Article

Assessment and Optimization of a Clean and Healthier Fusion Welding Procedure for Rebar in Building Structures

by
Javier Ferreiro-Cabello
1,*,
Esteban Fraile-Garcia
1,
Pedro María Lara-Santillán
2 and
Montserrat Mendoza-Villena
2
1
SCoDIP Group, Department of Mechanical Engineering, University of La Rioja, 26004 Logroño, Spain
2
PLOCEL Group, Department of Electrical Engineering, University of La Rioja, 26004 Logroño, Spain
*
Author to whom correspondence should be addressed.
Appl. Sci. 2020, 10(20), 7045; https://doi.org/10.3390/app10207045
Submission received: 4 September 2020 / Revised: 8 October 2020 / Accepted: 8 October 2020 / Published: 11 October 2020
(This article belongs to the Section Civil Engineering)

Abstract

:
The welding procedure for reinforcing bars used in reinforced concrete takes place at fixed industrial installations. The welders must ensure that the reinforcing bar positions are maintained throughout all stages leading up to concreting. Fusion welding offers an alternative procedure that entails fewer risks for the workers’ health. In this study, we aimed to determine the minimum parameters for the intensity, pressure, and time necessary to ensure the level of performance required by this assembly welding. A total of 2160 joints were manufactured, comprising the different thicknesses. For each thickness measurement, 45 different combinations of parameters were applied. The joints were evaluated based on the resulting dimensions and on the failure force necessary to break the joint. For different thicknesses, the breaking loads were over 7350 N. In addition, the welding cycle times did not exceed three seconds. Based on the results obtained in this study, we concluded that assembling rebar (manufacturing reinforcing bars) by electrical resistance welding is a viable option. This method is fast, safe, and clean, and reduces the risks to the workers’ health.

1. Introduction

The welding process for rebar in reinforced concrete has unique characteristics. This welding is usually carried out at fixed industrial installations, and, after, the rebar is transported to a construction site to be installed in the formwork. The next step is pouring fresh concrete and shaping the reinforced concrete in situ. Welding used to make reinforcing bars must ensure that its dimensions are maintained throughout the entire process: transportation, placement, and concrete pouring.
One of the most common procedures used to assemble rebar is metal inert gas (MIG) welding. This procedure offers certain advantages in terms of production; however, it also has some weaknesses. The main disadvantage is the fumes released during the welding process. As the substances are subjected to very high temperatures around the melting point, a mixture of particles and gas is generated during the welding. These fumes are derived primarily from: workpiece metals and their surface coatings, input materials, gas used in the welding process, the air in the welding area, and any existing atmospheric contamination. Welding fumes are a complex mixture of ultrafine particles in the nanometer range. Given that welding fumes are a known health hazard, it is useful to understand transport and deposition of these nanoagglomerates in the human respiratory system [1].
Another health risk that is present in the fumes generated during welding is the high concentration of nanoparticles loaded with hexavalent chromium (Cr6+), a known human carcinogen [2]. During MIG and tungsten inert gas (TIG) welding, nickel exposure is associated with work-related respiratory symptoms, and aluminum exposure is associated with a drop in the forced expiratory volume of 1 s (FEV1) [3]. These respiratory risks have been corroborated, and research confirmed that exposure to these fumes causes changes in lung function [4]. Pulmonary problems, such as asthma, pulmonary inflammation, hyper-responsiveness of the airways, and increased susceptibility to infections have been reported as a result of welders’ occupational exposure to ozone and nitrogen oxides [5].
Another risk that has been detected in welding is the blue light. The welders and their assistants must wear appropriate eye protection during arc-welding operations to prevent this dangerous effect [6]. Solar ultraviolet radiation (UVR) was also demonstrated to increase the risk of cataracts. With this premise as preamble, a study was conducted among Danish metal welders who worked between 1950 and 1985. The main objective was to determine whether arc-welding of metal increased the risk of cataracts. The researchers did not find a higher risk of developing cataracts in these workers. This fact may be attributed to the effectiveness of the personal safety equipment used in these activities [7]. The need for protective equipment is outlined in European Directive 2006/25/EC [8].
Occupational hazards related to vision are not the only risk that these workers receive: the steel industry welders are exposed to high levels of ultraviolet (UV) rays. This problem has been studied by numerous experts, and the results showed that welders’ UV exposure is generally above the permissible threshold. Thus, considering the general nature of eye and skin disorders in welders, it is very important to take essential measures, such as to reduce their exposure time and the level of UV radiation, and use personal protective equipment. As ultraviolet radiation (UVR) exposure has been linked to different types of skin cancer, skin aging, and cataracts, researchers advised the reduction of welders’ occupational exposure [9]. Thus, experience and observation showed that UVR exposure during arc-welding frequently causes keratoconjunctivitis and erythema. The degree of hazard from UVR exposure depends on the particular welding methods and conditions in use [10].
At the end of the 20th century, there were ongoing studies into the effects of welding on the performance of rebar [11]. One of the grave problems in the infrastructures is the deterioration of concrete construction due to deficient welding. Reinforcing steels that are incorporated into a concrete structure must be weldable and able to maintain their strength performance throughout the welding process used [12]. The dimensions of the bars, which incorporate some ribbing to increase the adhesion, also affect the welding process [13]. In order to improve the welding process, it is interesting to study the distribution of temperature and stress at the interface (horn and welded joints) and their influence on rebar [14]. Options accepted as valid are those processes that do not alter the initial properties of rebar [15,16] or compromise their durability facilitating corrosion [17]. In the case of MIG welding, it is important to determine and assess the behavior of the input material and its state after the process [18,19,20].
For rebar concrete, it is necessary to complement the industrial assembly operations with the tying in the work site. The construction industry worldwide faces a high incidence of work-related musculoskeletal disorders (MSDs), largely attributed to excessive physical exertion in the workplace [21,22]. In large-scale projects, robotic steel bar tying systems have been successfully implemented to facilitate the demanding task of tying on site [23]. However, not all projects are large enough to implement automatic systems. Ergonomic solutions in the construction industry must be based on both the specific characteristics of different construction professions and on the culture of the workers in need of support [21].
The use of personal protective equipment in adverse environmental conditions presents a drawback for the worker. In the construction industry, the risk factors for developing lower back disorders due to manual rebar tying are well-known [24], and the proposed solutions are postural improvements [25]. For this same reason, experiments have studied the effectiveness of an automatic gun to tie rebar, comparing the speed and cost effectiveness of this tool with the common industry practice of manually tying rebar with a spool of wire and pliers [26]. This tool has proven to offer improvements over the manual tying method [27]. However, said tool requires significant amounts of wire and complex mechanical maintenance.
Identifying the minimum required assembly welding performance is important. In the case of MIG welding, a previous study was conducted to establish the minimum process parameters [28]. It is necessary to distinguish assembly welding from welding whose purpose is exclusively related to strength [29,30,31]. When the elements have defined dimensions, of which only one parameter varies (diameter in the case of foundation piles) [32], and have the production of flat elements for prefabricated modules [33], fusion welding systems have been implemented that are characterized by the welding quality and the low values of energy consumption. The operating method of a robot cell for the assembly of rebar cages for beams and columns requires special robot configurations [34]. Fusion welding is not conditioned by the input material as the process consumes only electricity and pneumatic pressure. This alternative welding process presents fewer risks for workers’ health, which is evidenced by the fact that the need for personal protective equipment is eliminated.
The present study aims to determine the minimum parameters for intensity, pressure, and time that will provide the performance required in this type of assembly welding. The portability of the system will dictate its actual use by workers at rebar plants and construction sites. Companies should take advantage of the current context of concern and awareness to improve and rethink their production processes. The current atmosphere has been largely created by the utmost importance assigned to eco-friendly production as well as the effect of this objective on energy consumption and on the economy. We must not overlook other factors, such as acoustic comfort, sustainability, and workplace health and safety.

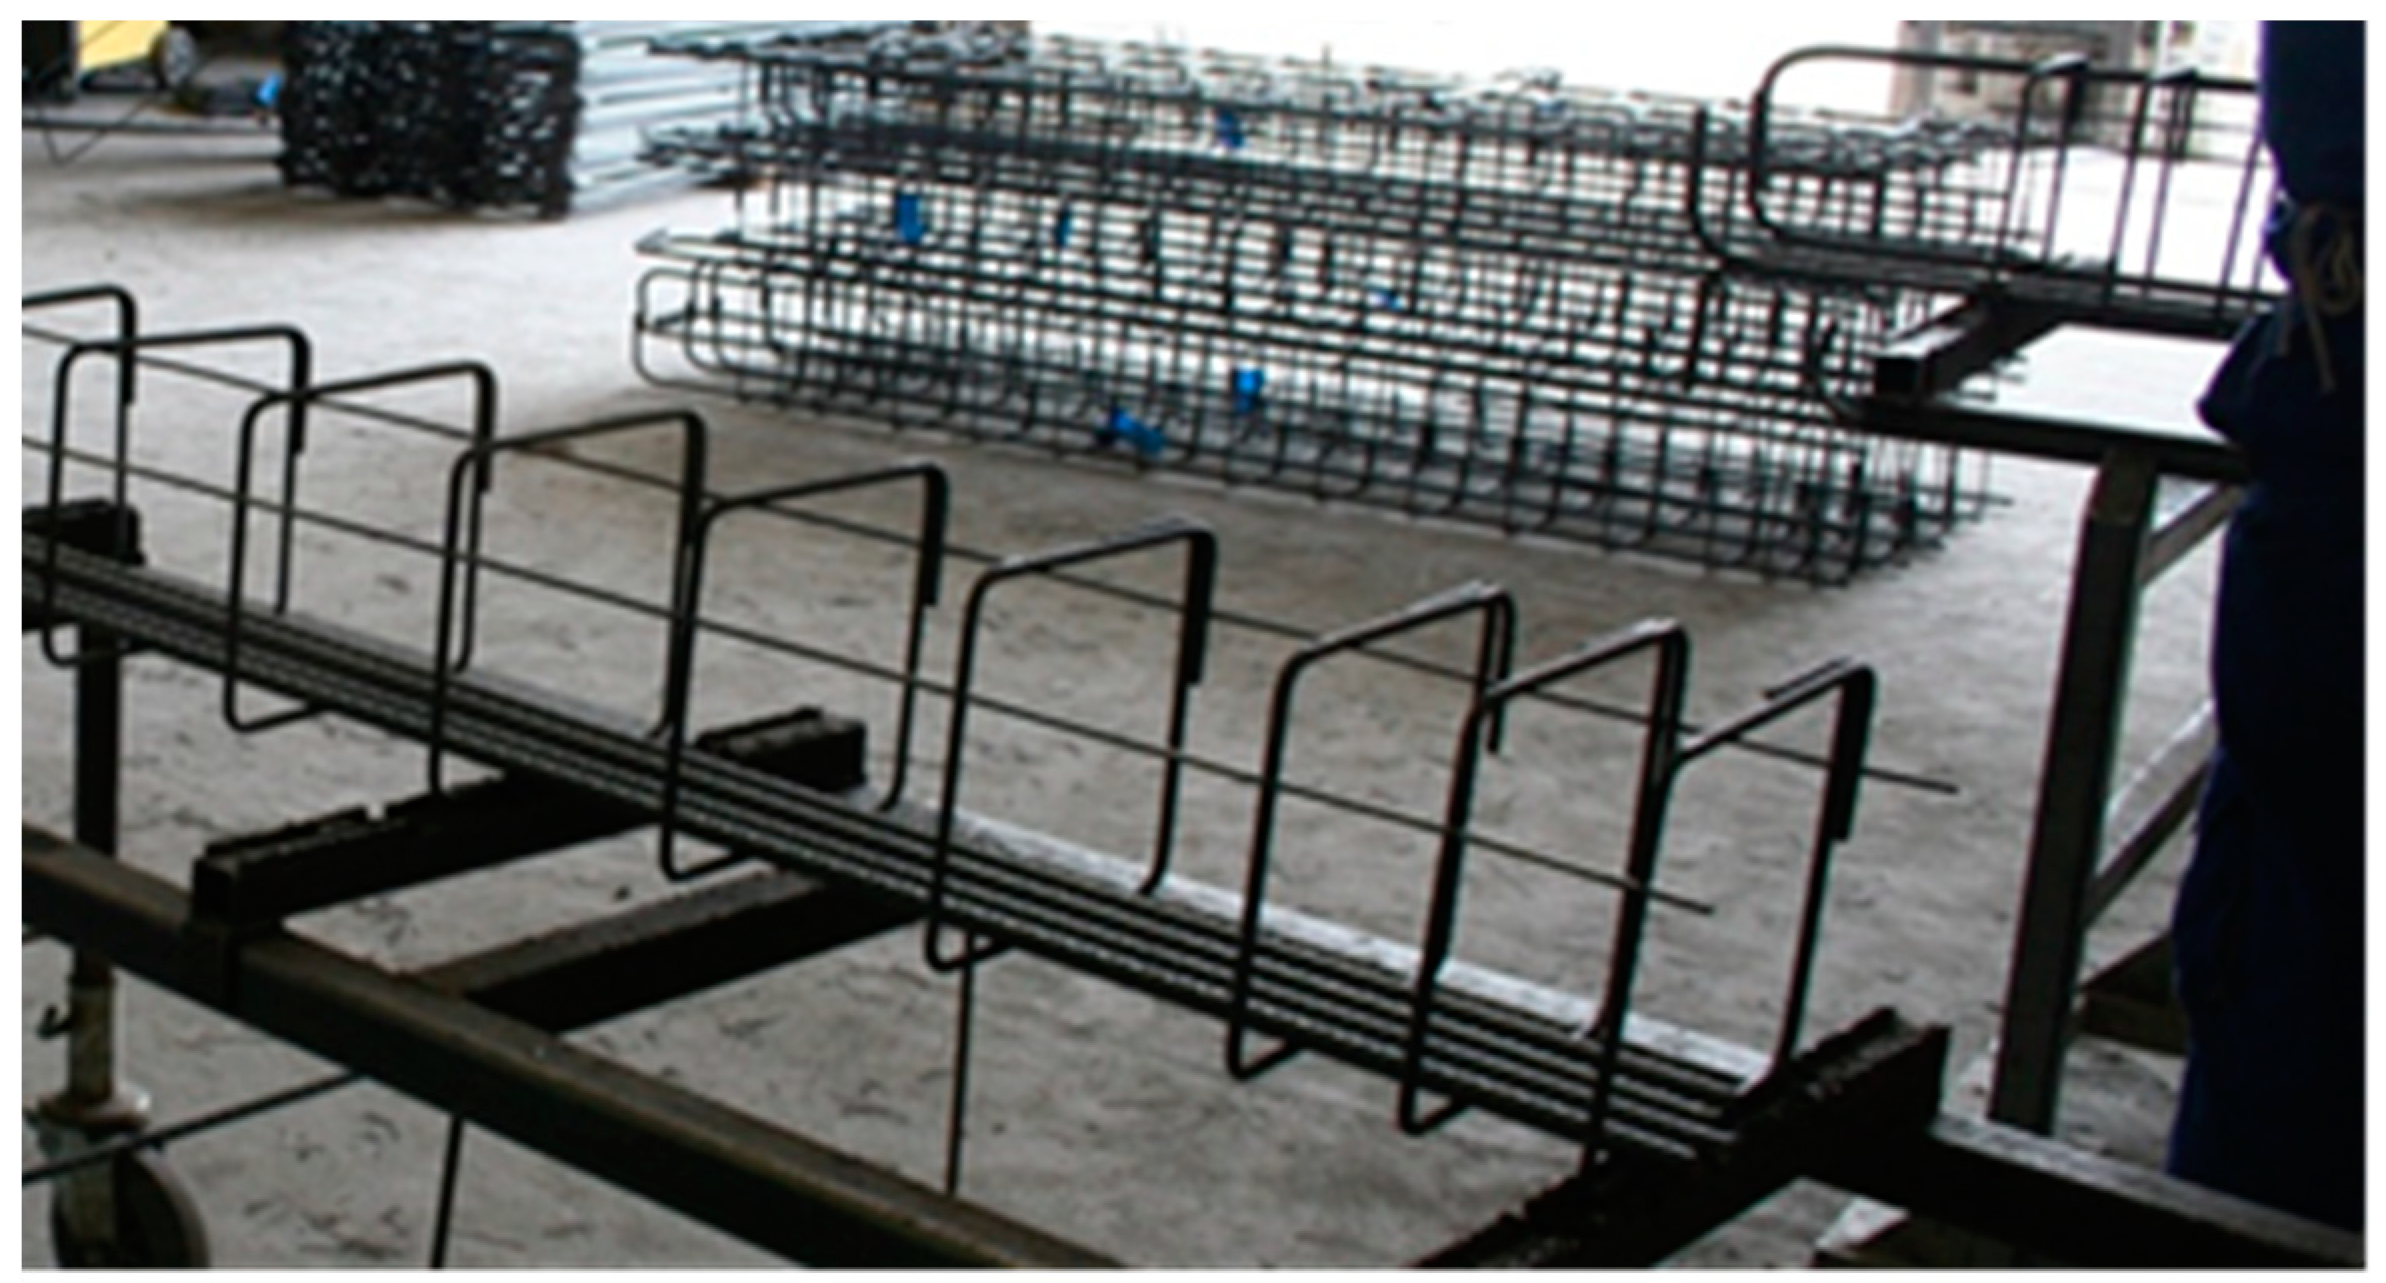
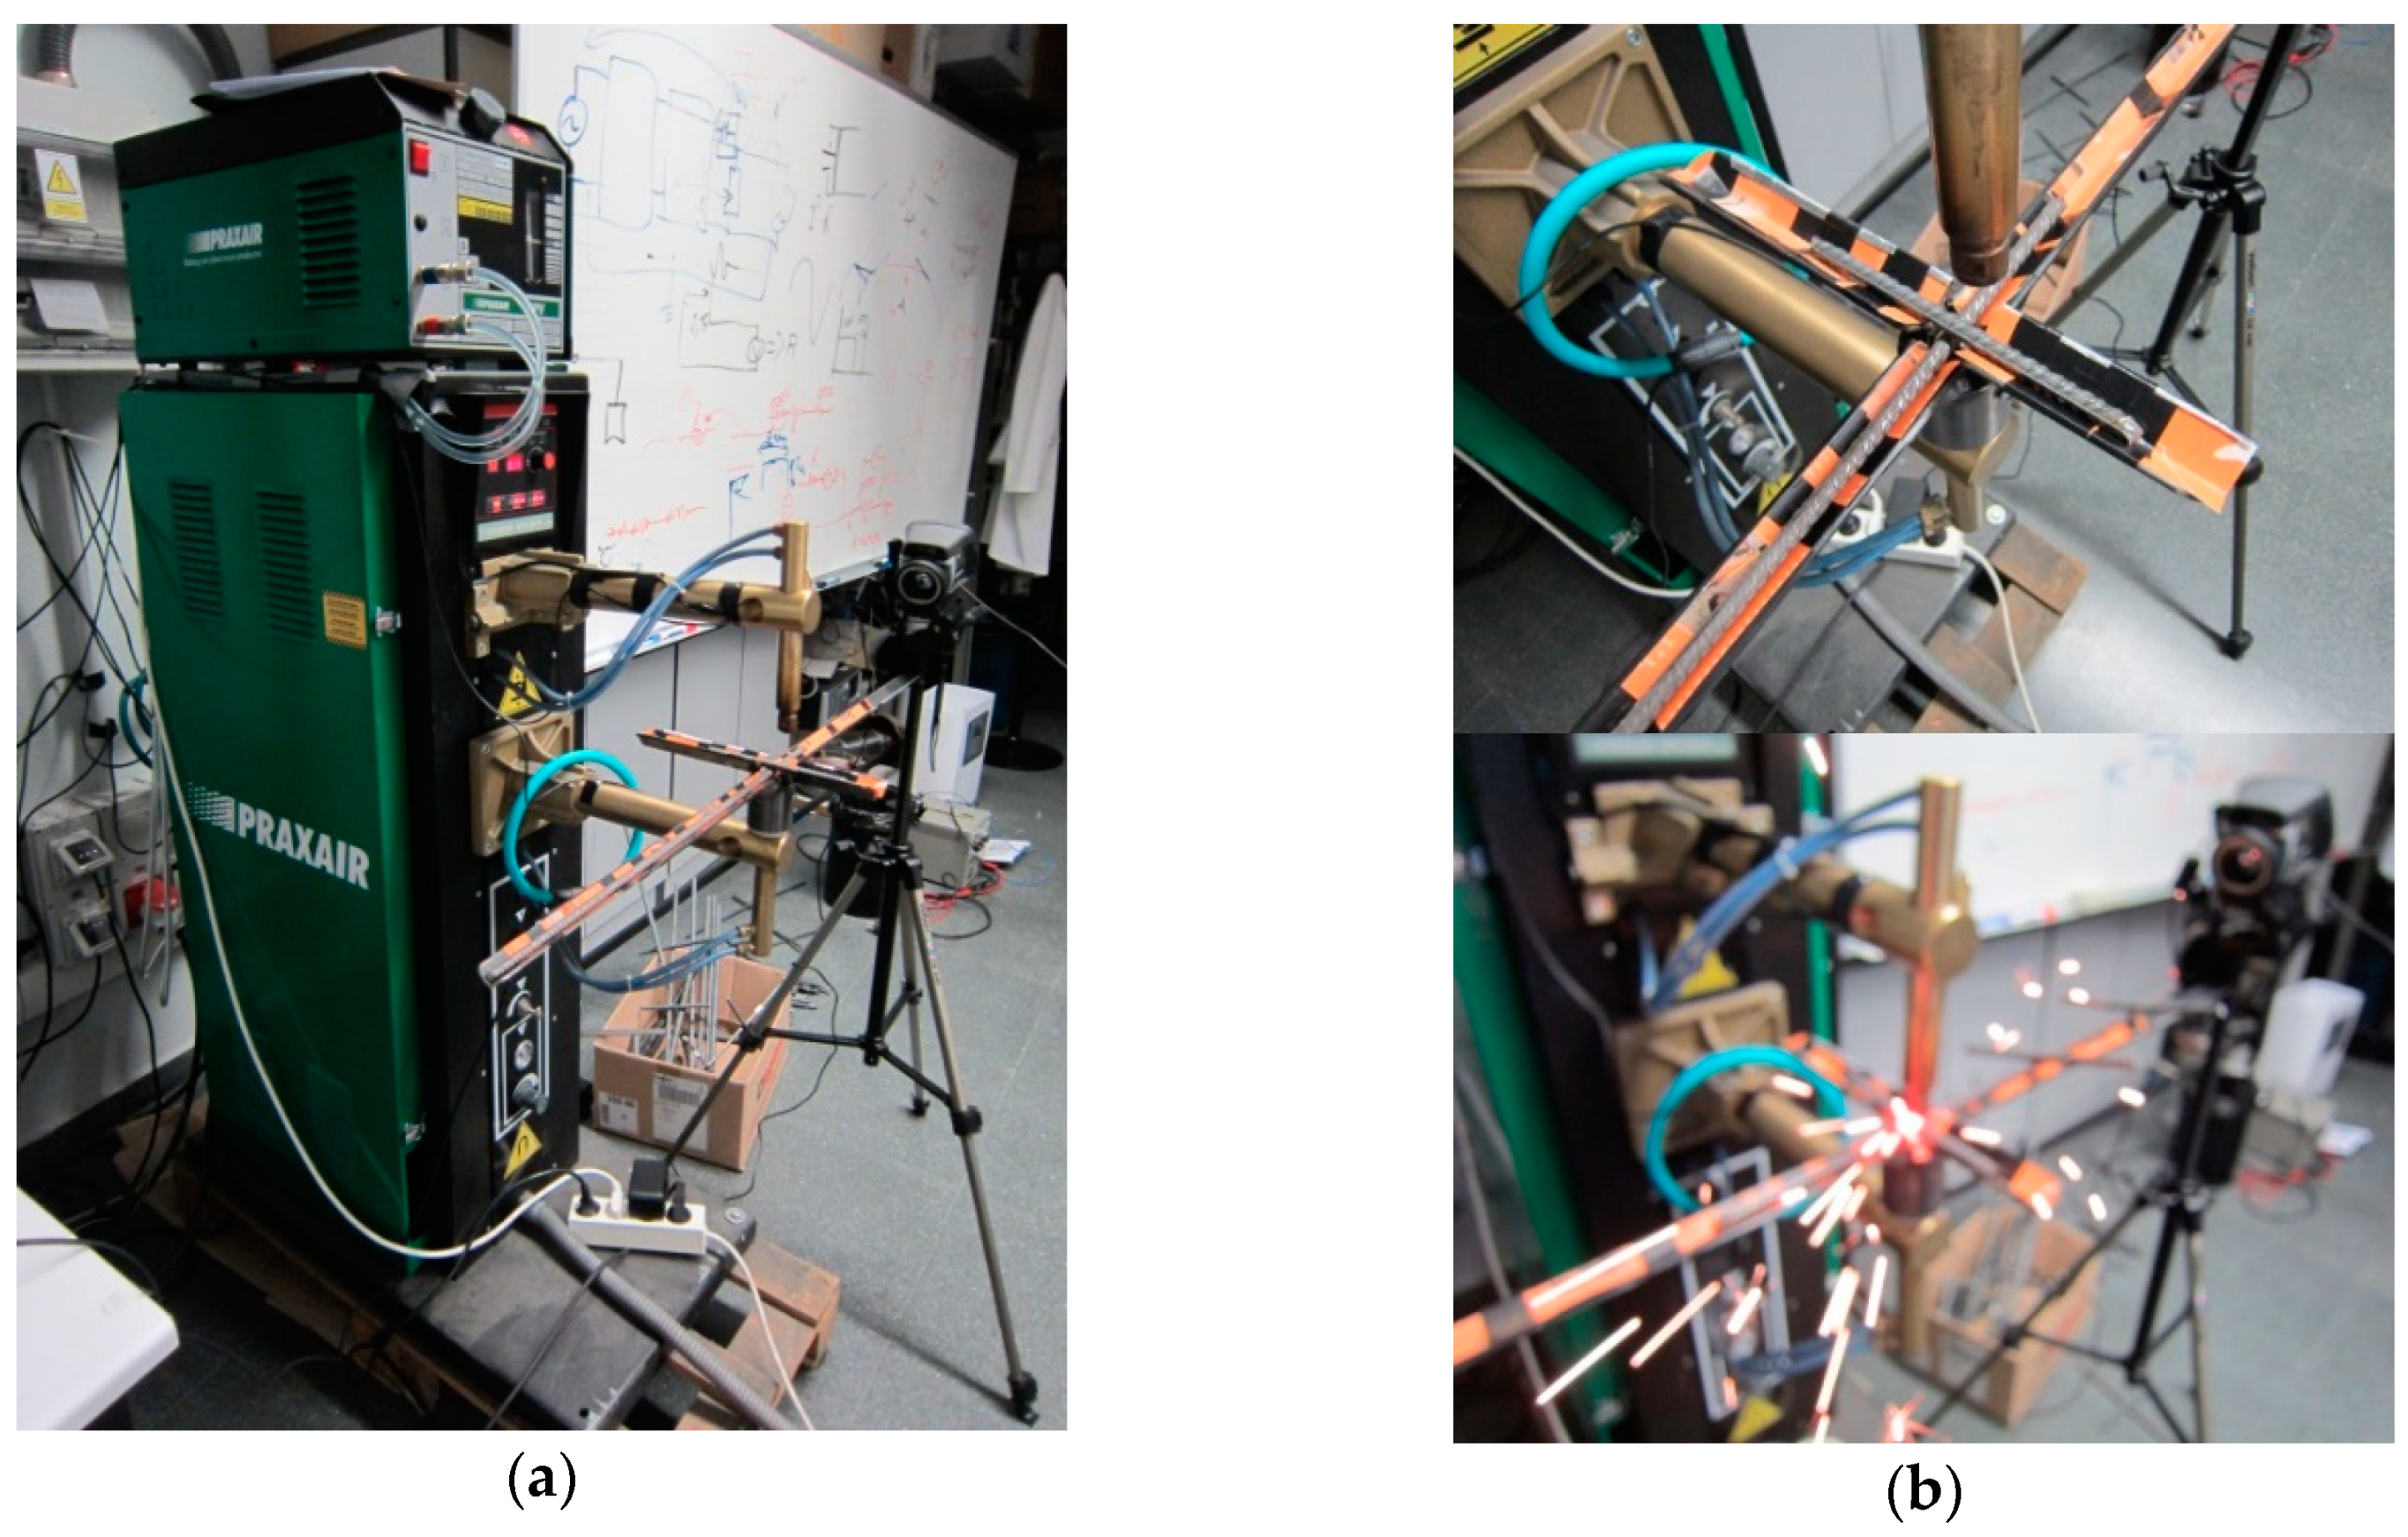
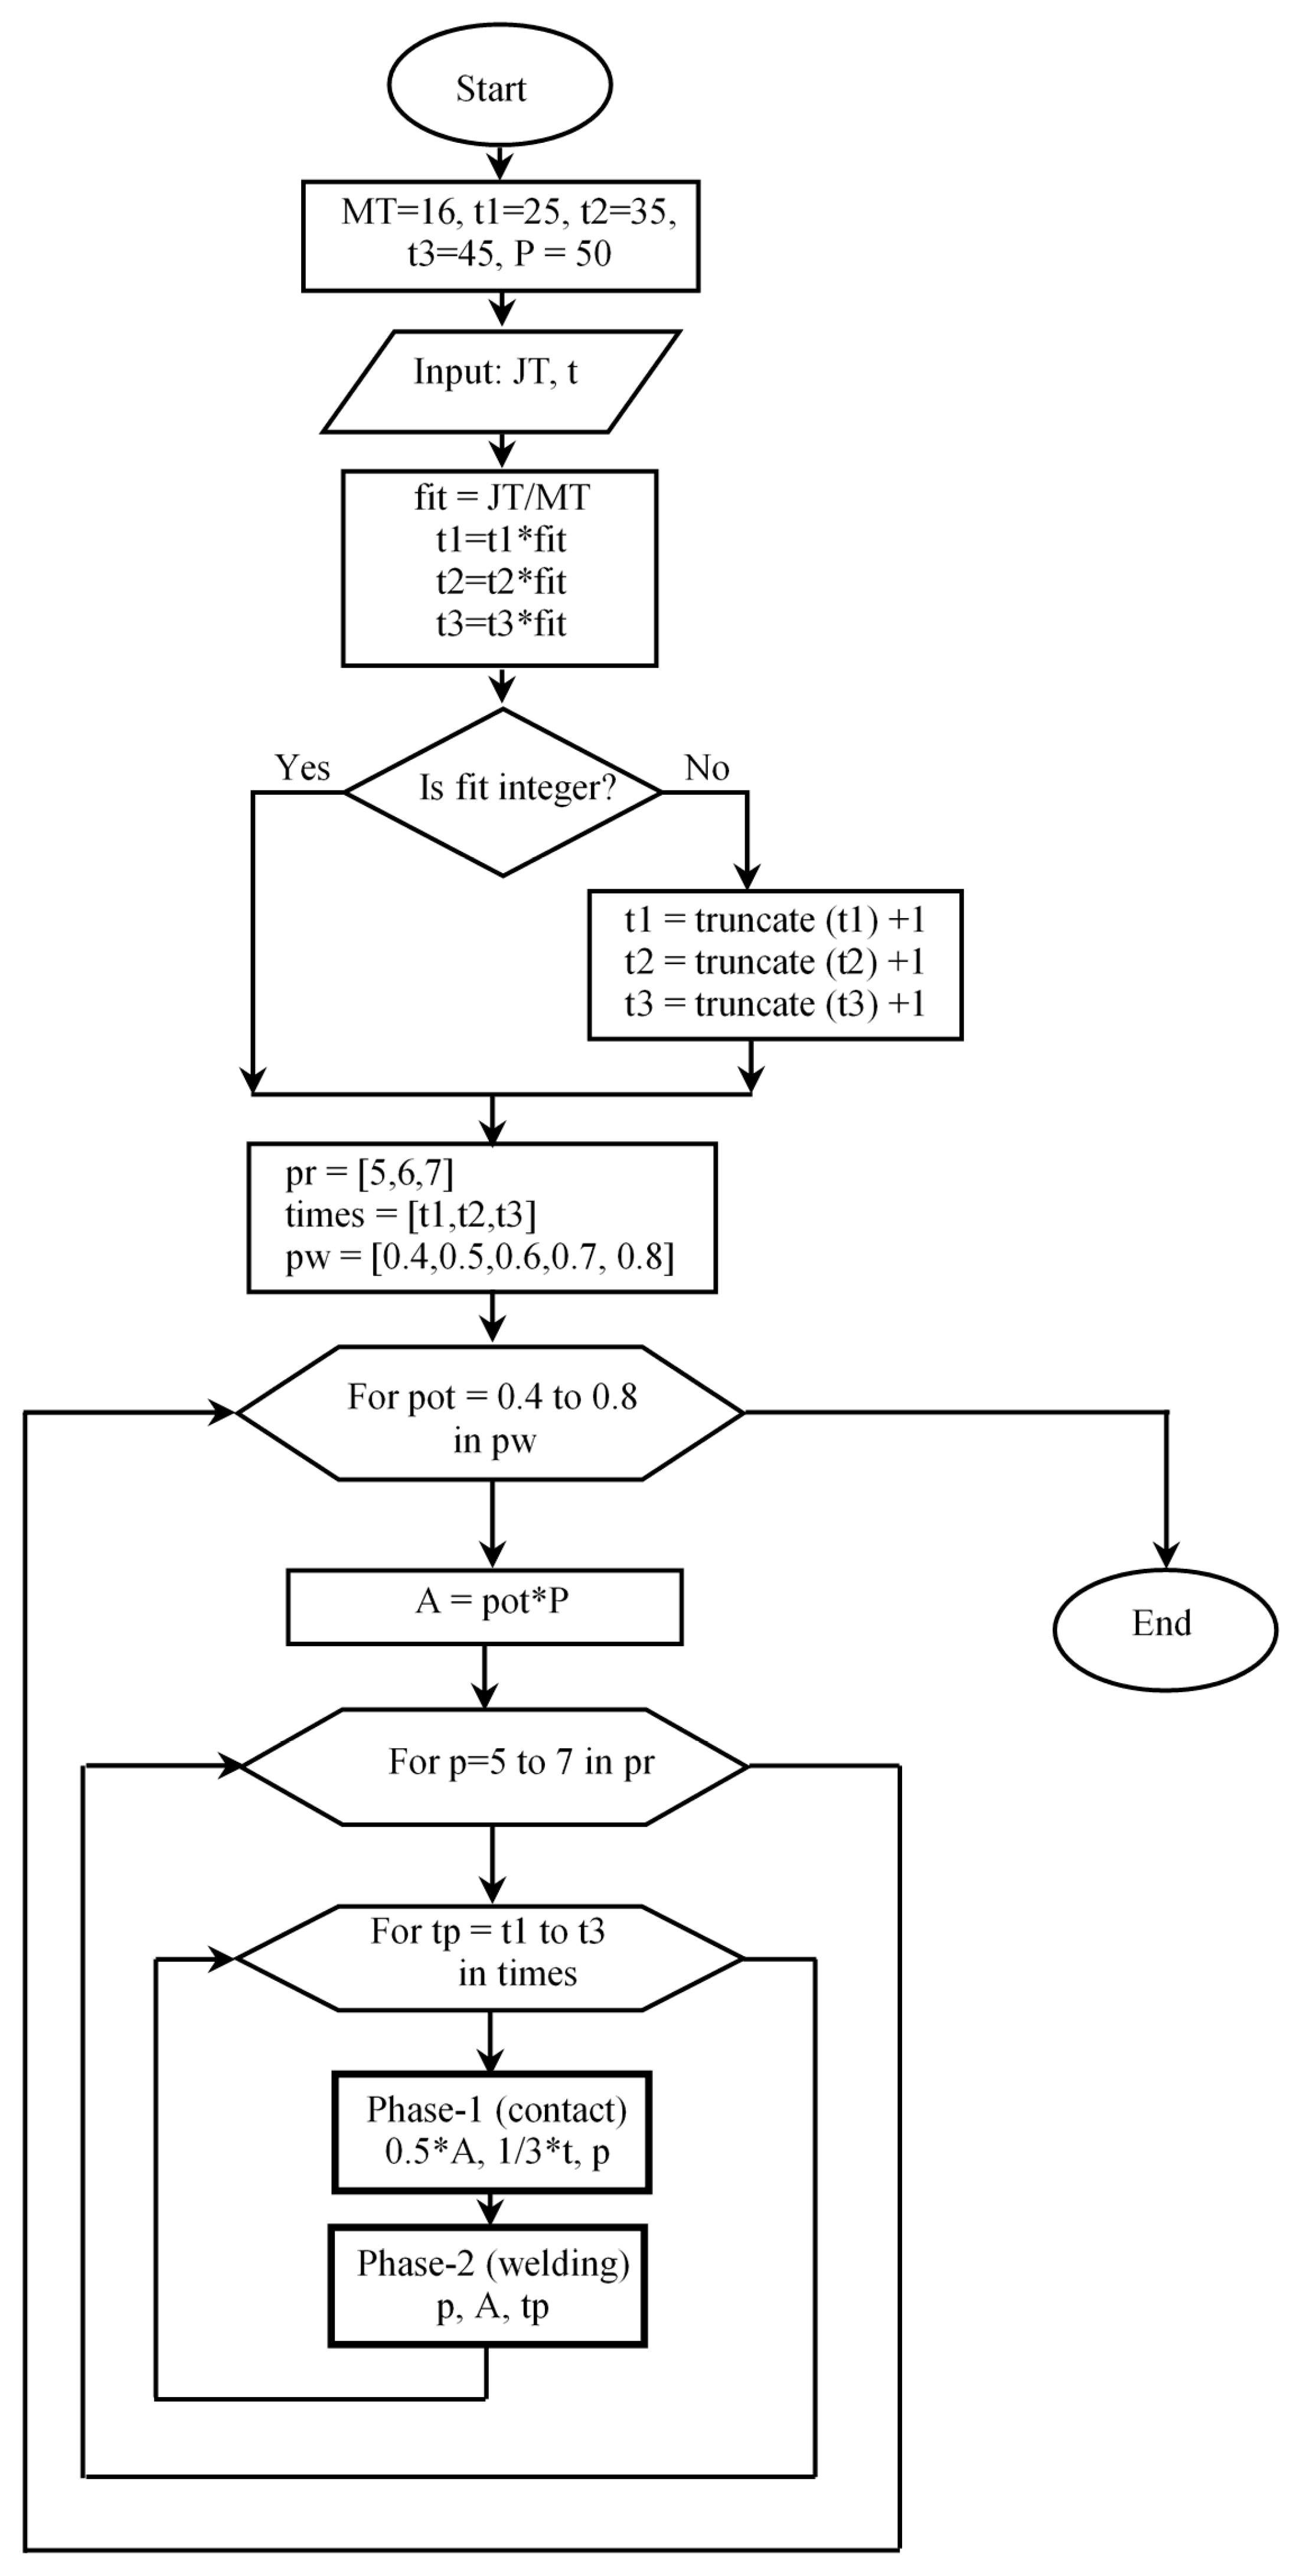
2. Materials and Methods

This section outlines the methodology utilized in the viability study of electric resistance welding to manufacture rebar. The focus is on rebar production for the construction of residential buildings. The various formats of rebar products, primarily bars and links, were examined (Figure 1). The material used in all cases was the structural steel B-500-SD [35]. A representative sample was selected to conduct this study of all the possible combinations of diameters used in welding.
The first step was to identify the most frequently used diameters in links (8, 10, and, more infrequently, 12 and 16 mm), and the longitudinal bars (10, 12, 16, 20, and occasionally 25 mm). A discrete list of eight joints’ thicknesses was compiled by combining the different diameters listed in Table 1. In this way, values joints were available between the minimum of 16 mm up to a maximum value of 32 mm for the test pieces.
This selection facilitates the analysis of the different joint thicknesses that are most common in rebar plants that manufacture reinforcements for residential buildings.
To study these joints, test pieces of the material S-500 were obtained. The chemical composition of the material used complies with the provisions of article 32 of the Code on Structural Concrete [35].
The samples had a length of 600 mm for Diameter A bars, and of 150 mm for Diameter B bars. Thus, the goal was to make welded rebar specimens in the laboratory: three pieces of Diameter B for each Diameter A piece as shown in Figure 2.
Based on the characteristics of the material, the above configuration of three joints was designed to obtain a representative average of the welding. The welding equipment of PRAXAIR brand named “MPH Digital Neumática” was utilized. This equipment is regulated by an electronic thyristor control system and allows for modifications in the following aspects: cycle time, power used, and electrode pressure. The digital controller allows the parameters to be adjusted in a simplified manner, along with the possibility of welding cycles with one or two current pulses. The welding current of the first pulse is established following a fixed slope (up-slope), thereby avoiding current peaks in the power supply network. The absence of a power switch increases the machine reliability and presents excellent precision in terms of the parameter repeatability (current/time). Thanks to the weld/no weld switch, it is possible to simulate operating cycles without a current traveling to the spots, thereby allowing for any necessary adjustments of the positions of frame and spots, before beginning the welding operation. The first pulse serves as the initial contact between the bars, and the second pulse consolidates the welding point. The parameters of each of the pulses (current and time), as well as the interval between pulses (cold), can be regulated separately. The different welds were made by modifying the parameters on the MPH Digital Neumática welding equipment, whose maximum power is 50 kVA, and the thicknesses of the welds ranged from 10 mm to 40 mm. The spot welder device parameters limits were intensity (0%–100 %), pressure (4–8 bar), and time (0–2 s).
The following figure shows the welding process. To be able to complete the welding of the test pieces, a fixture was configured to improve the handling and equalization of the welding; see Figure 3a,b. Additional current and voltage meters were installed at the inputs and outputs of the equipment.
A series of tests were performed to adapt the power of the equipment according to the needs of the joints to be made. The strategy established was to perform the welding in two phases:
  • Preparation and preheating of the contact area: with 50% of the power and 1/3 of the time planned for the welding cycle. Thus, the area to be welded was clean and prepared. Phase-1 (contact).
  • Welding phase parameters with constant pressure: test intensity (A), time (t), and corresponding pressure (P). Phase-2 (Welding).
An algorithm was established for the action times depending on the joint thickness to be made, when problems were detected in the joints due to a fusion defect (very weak joints) or an excess thereof (joints that are incompatible with piece maintenance). The algorithm flow diagram can be observed in Figure 4 and is defined below. At the beginning, the welding time cycle variables (t1, t2, t3) were initialized with the values corresponding to the minimum thickness (MT). The MT was considered to be 16 mm, and the times used were 25 (0.5 s), 35 (0.7 s), and 45 (0.9 s), respectively. The nominal machine power was defined with the P variable, which, in our case, was 50 kVA. In the following step, the time t (0–2 s) and joint thickness (JT) values are defined by the operator. If the piece thickness is above the minimum, the time cycles should be adjusted. To achieve this adjustment, the fit variable was used, which is the number result from dividing the joint thickness by the MT. This variable was multiplied by the times cycles corresponding to the minimum thickness (t1, t2, and t3). The result of this math operation was truncated, and we added 1. Thus, we gradually increased the time, depending on the thickness of the joint, until duplicated for the case of the thickness of 32 mm: 50 (1.0 s), 70 (1.4 s), and 90 (1.8 s). For each joint thickness, 45 different piece tests were realized, varying the electric power, time cycle, and pressure. Table 2 shows the welding options available with the phase 1 and phase 2 parameters.
The variables that appear in this table are test power (A) expressed in kVA; time cycle (t), which is indicated in pulses (100 pulses corresponding to 2 s); and pressure (p) in bars. The power value varies between 40% and 80% of the total power that the machine can provide in increments of 10%; the intensity absorbed by the machine will have the same percentage value as the power. The time is increased with the total joint thickness as explained above, and its value, expressed in pulses, is equivalent to the percentage over the maximum time. That is, a cycle time of 25 is equivalent to 25% of 2 s, which is 0.5 s. The pressure utilized in the tests has three discrete values: 5, 6, and 7 bars.
In the flow diagram (Figure 4), three FOR loop were utilized to able to complete all tests (45) with each joint thickness (from 16 to 32 mm). We utilized 270 pieces of each of the eight different thicknesses. Each test, with similar conditions, was repeated in six pieces of the same thickness. In total, 2160 pieces were tested. The first FOR loop was run by the pot index (percentage of nominal power), which changed this value among the list values pw (0.4, 0.5, 0.6, 0.7, and 0.8). For each value of the pot index, the variable A was calculated. The following step, consisting of second FOR loop, covered the three pressures used, and the index p varied into the list values pr (5, 6, and 7). For each value of power and pressure, a test with the three different time cycles was realized, and this was covered with the FOR loop at the end. For each set of power and pressure values, a test was performed with the three different time cycles adapted to the joint thickness. This was covered with the last FOR loop, run with the tp index, which varied according to the list values times. This improved the realization of the 45 tests with each thickness (five power values, three pressures, and three time cycles).
For each case, two identical test pieces (same diameters, pressure, time, and test intensity) of each combination were made in order to perform two different physical tests: tensile and shear force. Two test pieces with identical labels (Figure 5) were tested to determine the physical parameters in question.
A preliminary step was to verify the quality of the joint, by measuring the joint thickness. This process is shown in Figure 6a. This non-destructive sampling was performed on the six welds of each test piece.
To this end, a Palmer micrometer or caliper was used, which uses a micrometer screw to assess joint thickness with great precision (Figure 6a). The micrometer spindle is moved toward the anvil until it touches the piece whose thickness is being measured. The measurement obtained can be used to confirm the theoretical thickness (Diameter A + Diameter B) and to determine whether the weld is acceptable. To do this, the aim is to obtain the difference between the resulting and the theoretical joint thicknesses and to establish a difference threshold to be able to assess its quality. Thus, the thickness of the resulting joint was compared with the nominal theoretical value (Diameter A + Diameter B), and if the former was less than 85% of the latter, that weld was discarded given that it had excessive denting (Figure 6b). After performing the tests, we located the threshold value from which the joint geometry was permanently deformed. This situation was not assumable in the rebar configuration.
The welds must be broken to study the strength performance (Figure 7a). Specific equipment was used to perform the pulling force tests: the Servosis ME-420/20, which registers the precise force necessary to break the weld at each welded point (Figure 7b).
The welds were subjected to two different tests using specially designed tools. The weld failures were generated by subjecting the joint to shear or tensile tests.
The shear force test was conducted with the help of a single tool: the Diameter A rod was fixed and the lower clamp moved enacting force on the Diameter B rod, as shown in Figure 8a. This is how the amount of force necessary to incur failure by shear force (τ) was determined.
The tensile failure test, unlike the shear test, utilizes two tools: an upper clamp that maintains the Diameter A piece in a fixed position and a lower clamp that is attached to the machine clamp and is moved along with it. The test begins with the movement of the lower clamp, acting upon the Diameter B rod and breaking the weld with pulling force as shown in Figure 8b.
This test design provides data regarding the strength of the joints made in this welding process. Once the results of the two orthogonal force tests were obtained, the average of the three values obtained for each test piece was calculated, and the tensile and shear results were combined, thereby determining the force necessary for a weld failure. The transportation and placement of the rebar at the construction site was performed using tools that subject these welds to the combination of efforts proposed. This result is depicted in Figure 9.
After these tests and calculations were performed, the data were used to apply two filters. A filter in the lower part discarded the values of weld failure under 3430 N, as this would make it difficult to transport the parts by truck. On the other hand, those values in which the resulting (∆real) joint thickness was 15% lower than the theoretical value (A+B) were also discarded. The error threshold was set at 15%. This information is presented in a summarized format in Table 3, which includes the assessment of the welds according to the different parameters utilized herein.
Then, we created tables to depict the results obtained in the laboratory for each combination of thickness. To facilitate the interpretation of the results, the valid results were filtered to create summary graphs. In these graphs, the intensity in percentage with respect to the nominal (% maximum machine power) is represented along the X axis, while the tensile strength measured in Newtons (N) is represented along the Y axis. The graphs are represented grouped by the joint thickness. The legend of each graph has three lines. Each line represents three tests with the same electrode pressure (second digit) and different welding cycle times (first digit) expressed as pulses (equivalent of the percentage).

3. Results

As mentioned above, for an enhanced visualization of the results, separate graphs were created for each weld thickness. The type of line of the legend indicates the working pressure (dashed = 5 bar, solid = 6 bar, and dotted = 7 bar). The different colors indicate the welding times used in the second pulse as explained in the methodology (in ascending order, the machine times are represented in %) and range from the smallest value in grey, through the middle value in blue, to the largest value in orange. The axes of each graph correspond to the failure force on the Y axis and intensity on the X axis.
In the case of smaller thicknesses (Figure 10) with low cycle times, higher intensities were necessary to achieve optimum welds. Increasing the working pressure improved the weld performance primarily in longer cycle times. These joints failed due to a lack of strength and a reduction in the thickness of the resulting joint. In both cases, joints with failure forces above 9800 N were achieved.
When the joint thickness increased (Figure 11) with low cycle times, the 20 mm thickness did not admit the maximum intensity; as the thickness increased, the maximum intensity could be used. The input energy was determined by combining the time and intensity. The combination of high energy and excess pressure led to deficient welds. For the 20 mm thickness, failures occurred due to a lack of strength and a reduction in the thickness of the resulting joint. With 22 mm joint thickness, the welding had enough material, and, at low energy levels, the work pieces were not dented. By keeping the test electrical energy constant and varying the pressure, we observed that, with excessive pressure, the joints began to dent.
With joint thicknesses above 22 mm (Figure 12), low cycle times tests obtained joints with a failure force greater than 14,700 N, when the maximum intensity was used. This proved that excess pressure did not bring improvements to the resultant piece. In the case of the 24 mm thickness, the best results (greater failure forces) were obtained for medium and high cycle times and 6 bars of pressure. For thicknesses of more than 24 mm, only high cycle times produced failures, due to the reduced thickness of the resulting joint. In the case of high cycle times, the use of high pressure improved the obtained welds. Data series 57-6 (Figure 12b) presents an area with unexpected results. Using the same time cycle and with the pressures of 5 and 7 bars (data series 57-5 and 57-7 in the same figure) the graphs obtained show a similar trend and are quite different to data series 57-6. This fact may be due to decreases in the joints caused during the collection and handling.
For joint thicknesses around 28 mm and higher (Figure 13), failures did not occur due to the reduced thickness in the resulting joint. With low cycle times, joints above 9800 N were achieved at the maximum intensity. In view of the results, excess pressure did not appear to be a beneficial factor. For high cycle times, in the case of the 28 mm thickness, 5 bars of pressure obtained the best results. For medium levels of energy, the optimum value for the weld was around 19,600 N. In the case of higher levels of energy, since there was material available to melt, values close to 29,400 N were obtained.
In all cases, the intensity needed to obtain a good weld was over 60% of the maximum performance of the machine used. In these cases, the breaking loads were over 7350 N. In addition, the welding cycle times did not exceed three seconds. The performance and cycle times are comparable to those obtained with MIG welding.

4. Discussion

Based on our analysis of the results obtained in this study, we concluded that manufacturing rebar by means of electrical resistance welding is a viable option in the conditions tested in the laboratory. This method is fast, safe, and clean and involves fewer risks for the workers’ health. The decrease in cost is another attractive characteristic of this process, in terms of both the welding time and materials, given that the need for input material is eliminated. The challenge lies in achieving portability and obtaining the appropriate tools to assemble rebar in real workplace conditions.

5. Conclusions

The most outstanding conclusions are outlined below:
  • The obtained force failure values are compatible with the requirements for the studied type of assembly. The extensive variation in stacking conditions as well as lifting mechanisms commonly deployed in situ influenced the load nature on the joints. No known standard specification is available, as the strength of these welds is not part of the structural engineering design. In this study, the maximum values obtained by fusion welding were between 9800 and 29,400 N depending on the joint thickness. Comparing the breaking values obtained in joints of the same order of magnitude in our research tests with the obtained in the MIG welding, the results in both processes were the same [28].
  • The cycle times utilized herein are not problematic as compared to those currently used in MIG-welding. The examined cases in this study employed welding cycles of less than two seconds. Extending that time would reduce the labor intensity.
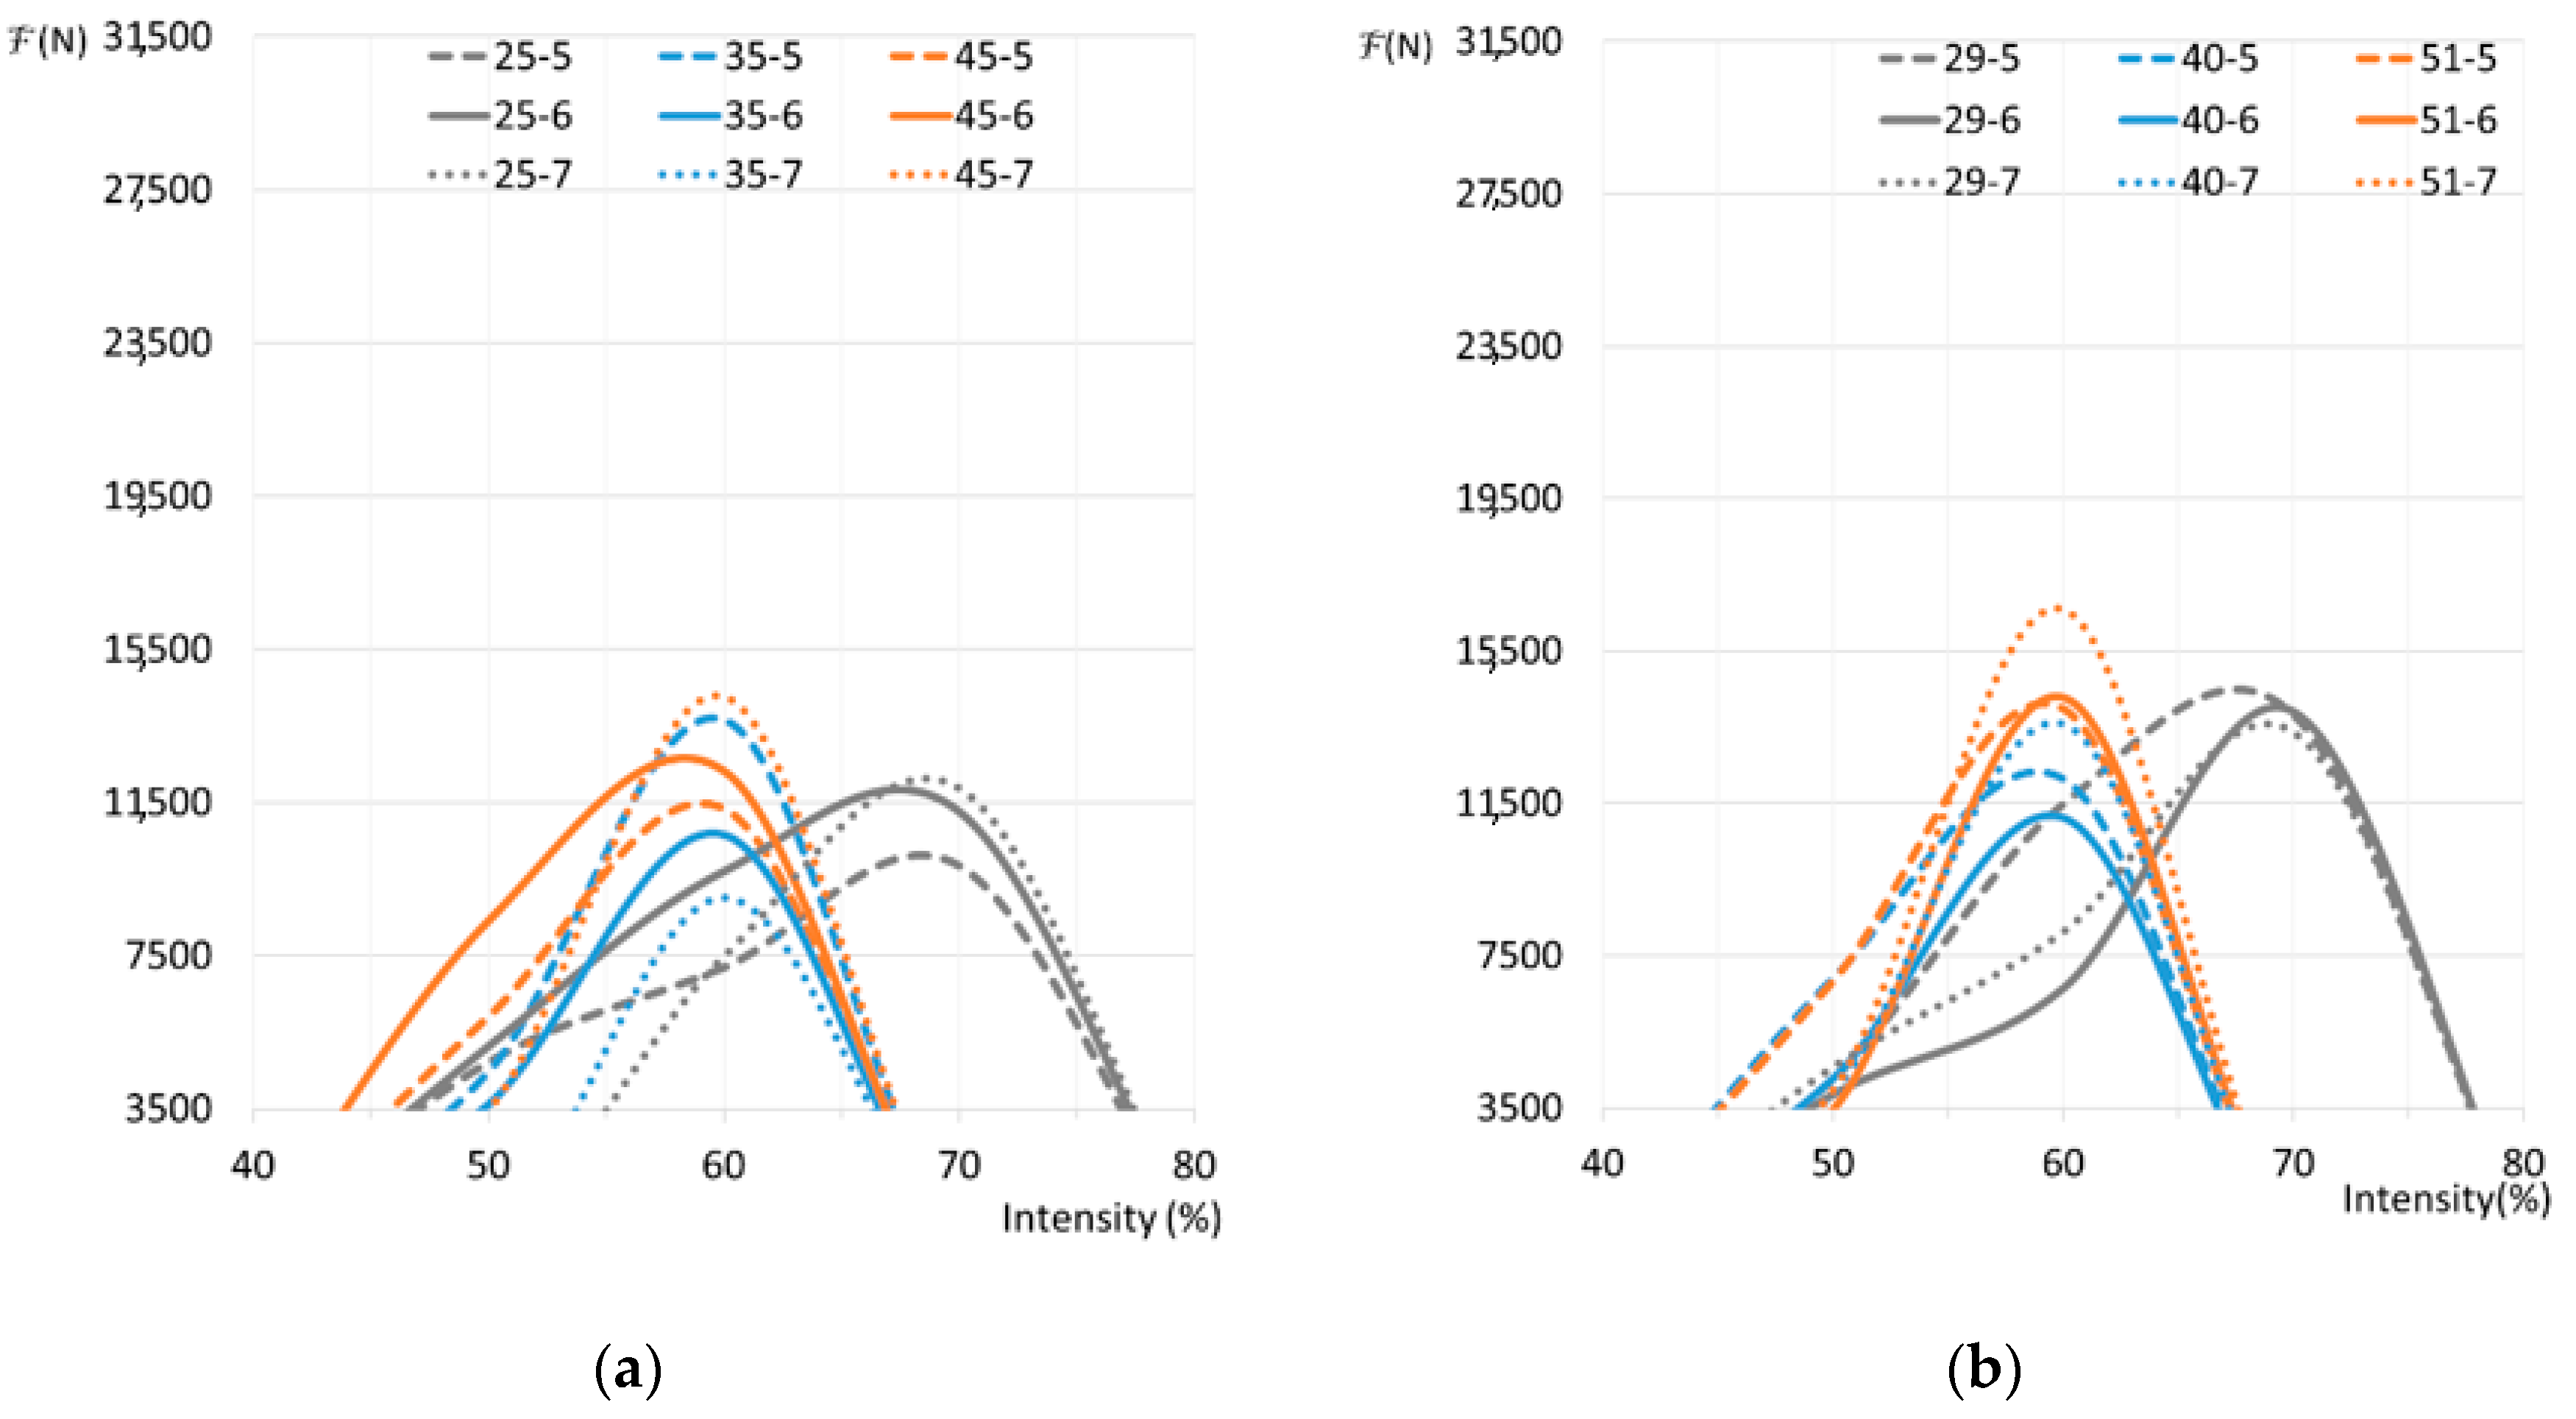
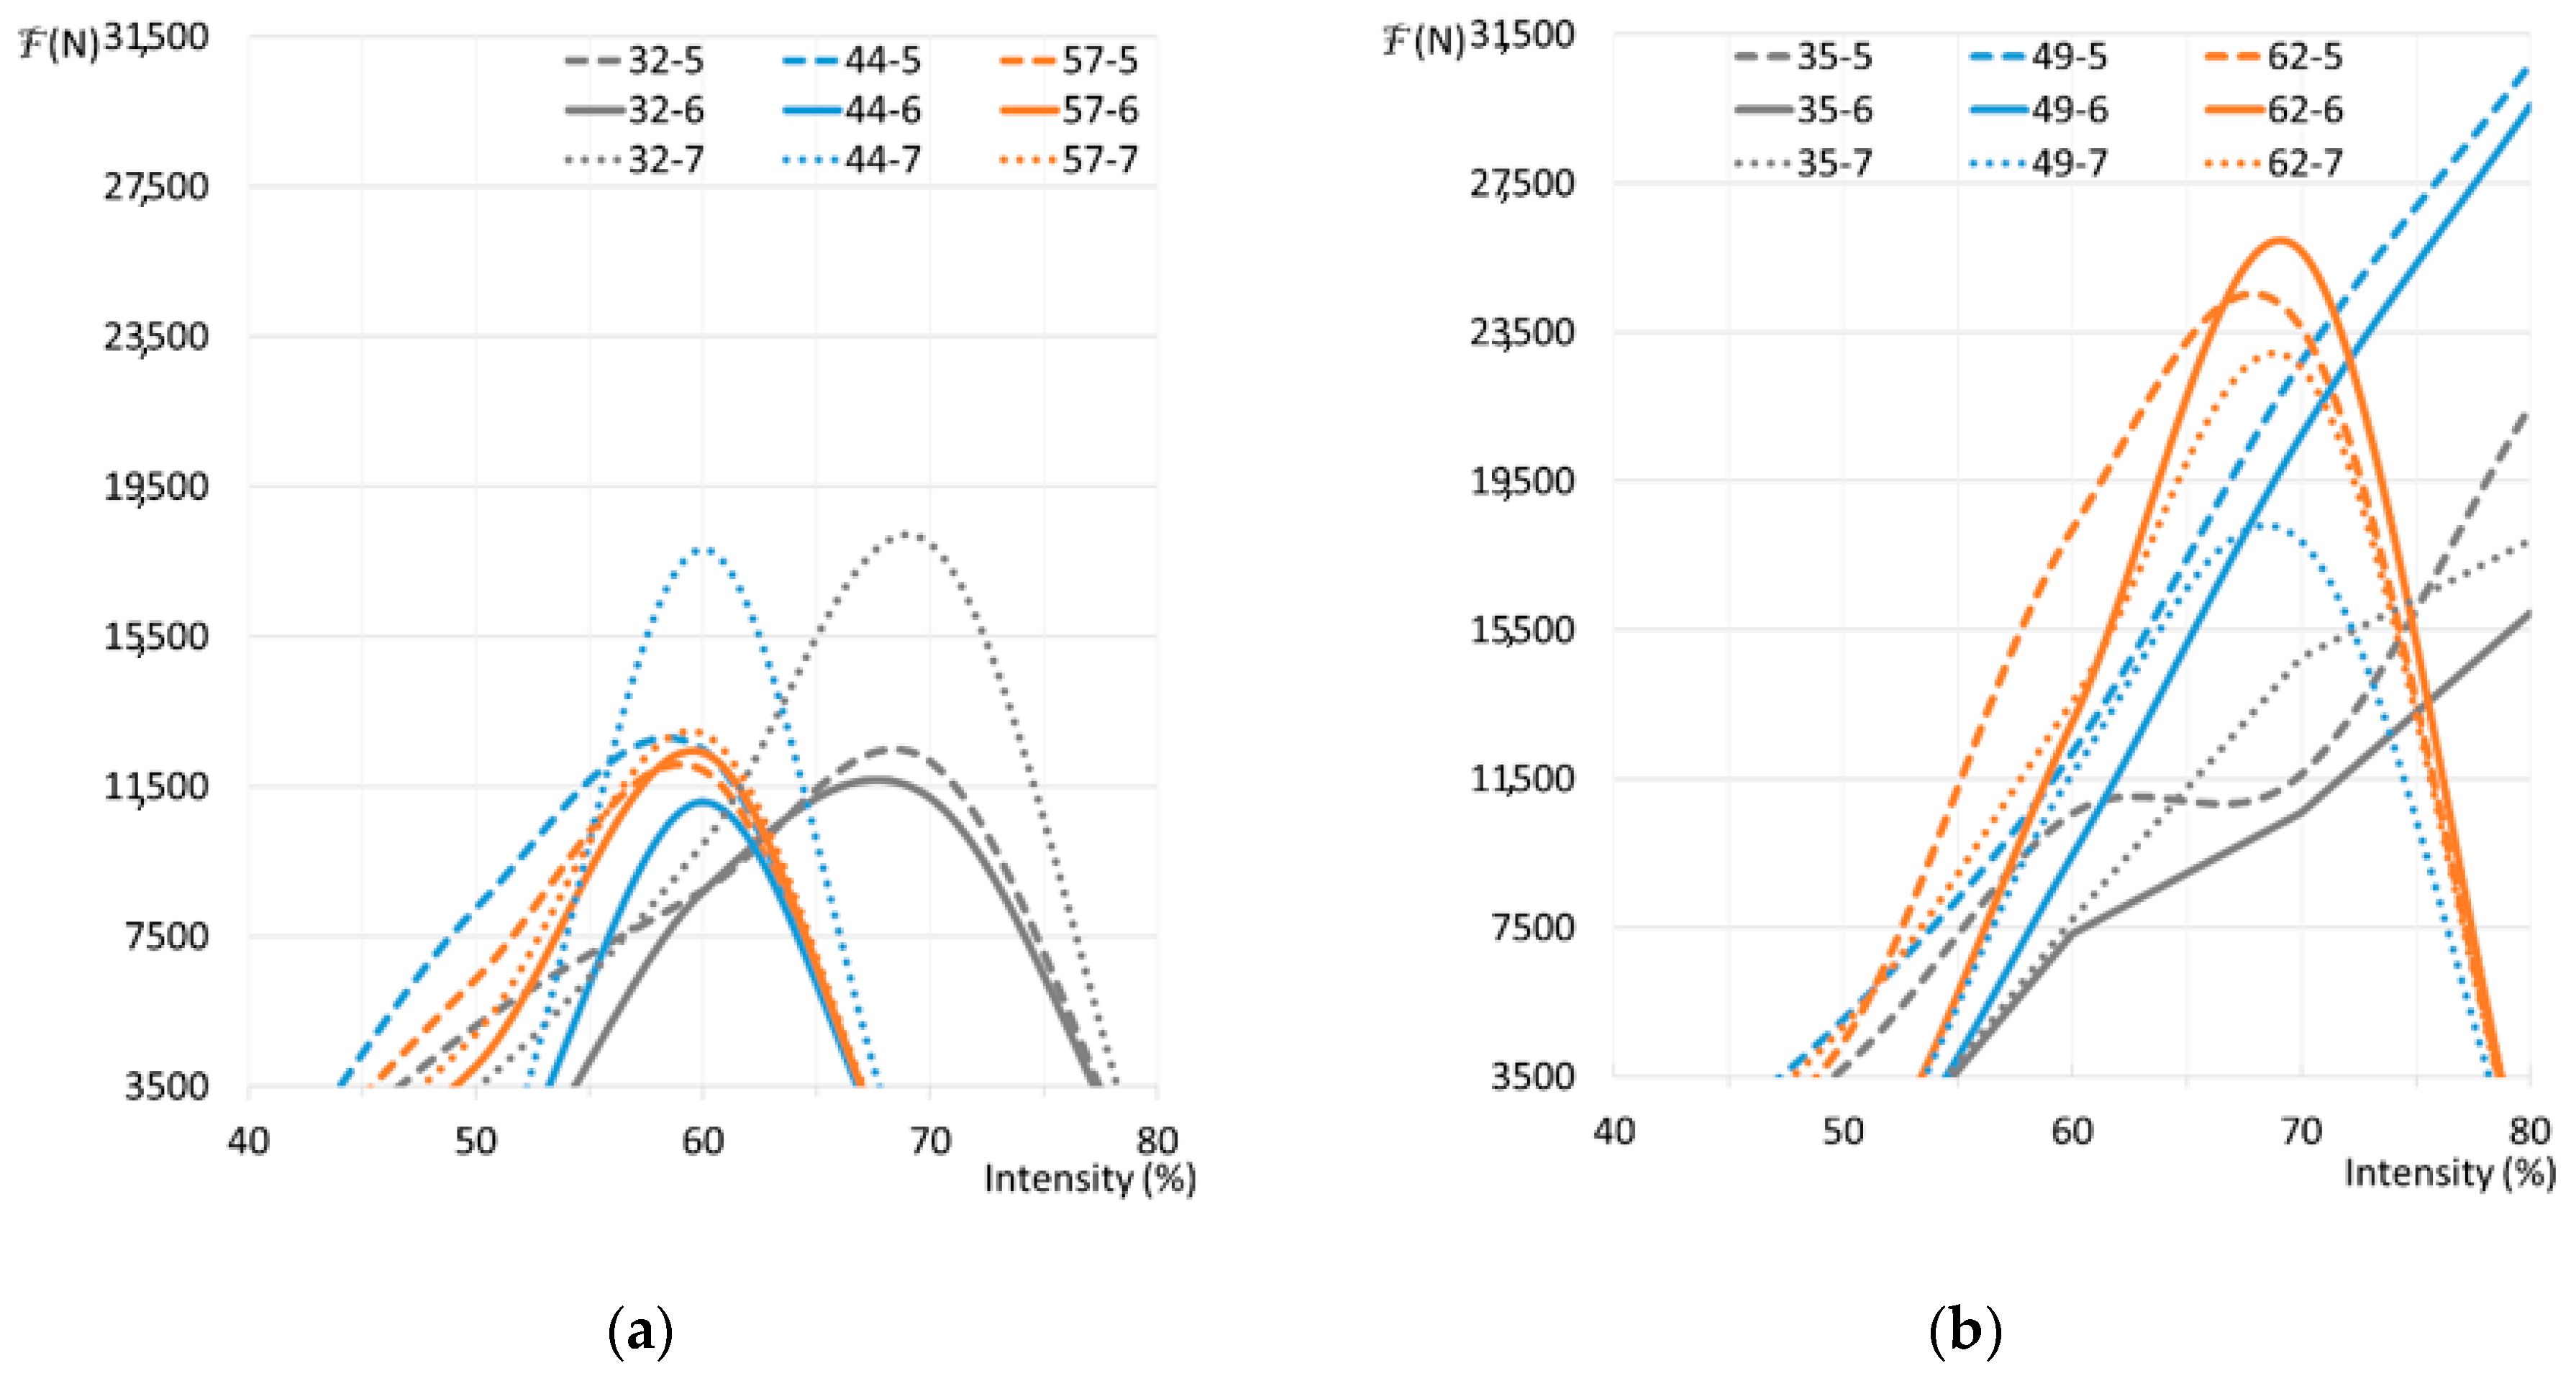
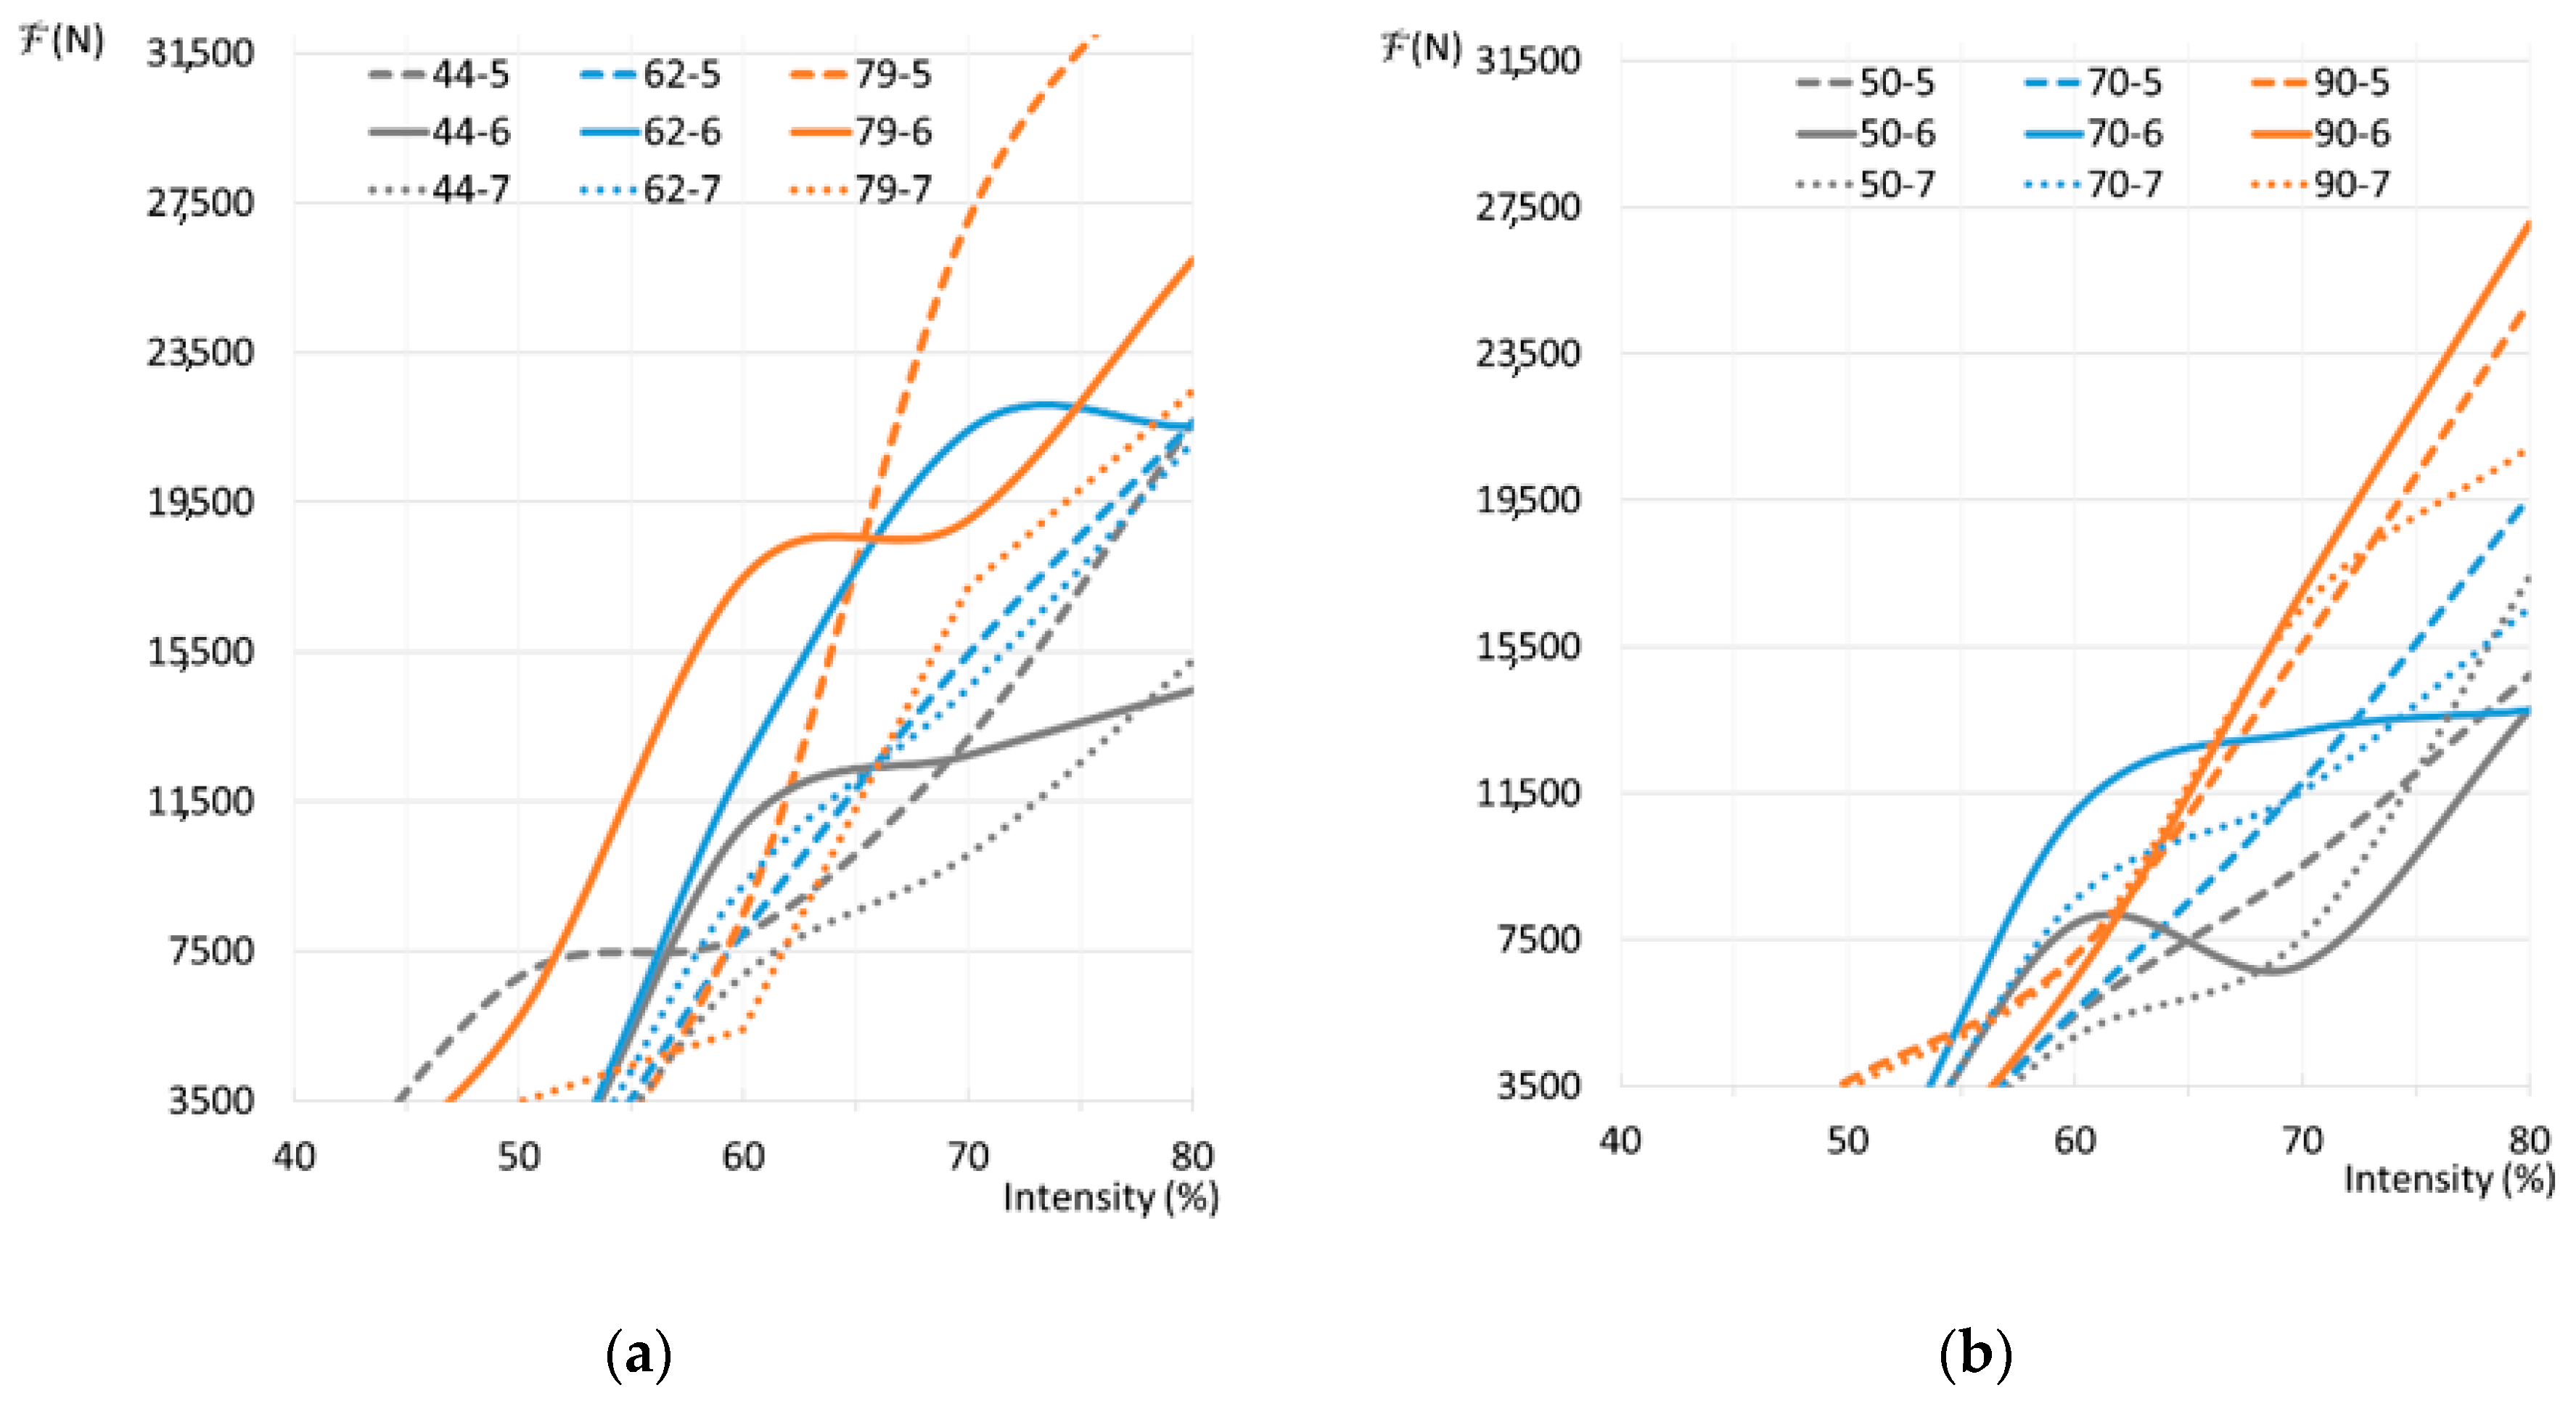
  • Working pressure should complement the melting conditions of the material. With lower thicknesses (lower resistance), the joint reached its melting temperature too early, and the pressure presence caused excessive damage to the joint. In the tests performed with greater thicknesses (higher resistance), the joints did not reach such high temperature values, thus reducing the joint damage.
  • Electrical resistance welding (without material input) promotes a healthier work environment where workers do not need to wear eye protection and the hazards inherent in gas and melting materials are also avoided, as gas-generating sources are eliminated. By controlling the intensity and cycle times, the danger of molten material splashing is also avoided and, thereby, the need for protective clothing, which are both inherent in welding with input material.
  • If the consumed electricity comes from renewable sources, this kind of welding process is even more sustainable, and ultimately contributes to a greater respect for the environment.
  • Strong performance in assembly welding is directly related to the joint thickness. The welding parameters can be regulated by determining the thickness of the joint (A + B). The regulation must be focused on the electrical intensity and time. A pressure of 5 bars was sufficient to achieve correct connections in all the joint thicknesses studied.

Author Contributions

Conceptualization, J.F.-C. and E.F.-G.; methodology, J.F.-C. and E.F.-G.; software, P.M.L.-S.; validation, J.F.-C., E.F.-G., P.M.L.-S. and M.M.-V.; formal analysis, J.F.-C., E.F.-G. and P.M.L.-S. and M.M.-V.; investigation, J.F.-C. and E.F.-G.; resources, P.M.L.-S. and M.M.-V.; data curation, J.F.-C., E.F.-G., P.M.L.-S. and M.M.-V.; writing—original draft preparation, J.F.-C. and E.F.-G.; writing—review and editing, J.F.-C., E.F.-G., P.M.L.-S. and M.M.-V.; visualization, J.F.-C. and E.F.-G.; supervision, J.F.-C. and E.F.-G.; project administration, J.F.-C. and E.F.-G.; funding acquisition, J.F.-C., E.F.-G., P.M.L.-S. and M.M.-V. All authors have read and agreed to the published version of the manuscript.

Funding

This research received no external funding.

Acknowledgments

All the authors are greatly indebted to the company Vigas-Mazo SA and to the regional government of La Rioja. The authors would also like to express their gratitude for the support of the University of La Rioja.

Conflicts of Interest

The authors declare no conflict of interest. The funders had no role in the design of the study; in the collection, analyses, or interpretation of data; in the writing of the manuscript, or in the decision to publish the results.

References

  1. Tian, L.; Inthavong, K.; Lidén, G.; Shang, Y.; Tu, J. Transport and Deposition of Welding Fume Agglomerates in a Realistic Human Nasal Airway. Ann. Occup. Hyg. 2016, 60, 731–747. [Google Scholar] [CrossRef] [PubMed]
  2. Wang, J.; Kalivoda, M.; Guan, J.; Theodore, A.; Sharby, J.; Wu, C.Y.; Paulson, K.; Es-Said, O. Double Shroud Delivery of Silica Precursor for Reducing Hexavalent Chromium in Welding Fume. J. Occup. Environ. Hyg. 2012, 9, 733–742. [Google Scholar] [CrossRef] [PubMed]
  3. Fishwick, D.; Bradshaw, L.; Slater, T.; Curran, A.; Pearce, N. Respiratory symptoms and lung function change in welders: Are they associated with workplace exposures? N. Z. Med. J. 2004, 117, 1193. [Google Scholar]
  4. Hartmann, L.; Bauer, M.; Bertram, J.; Gube, M.; Lenz, K.; Reisgen, U.; Schettegen, T.; Kraus, T.; Brand, P. Assessment of the biological effects of welding fumes emitted from metal inert gas welding processes of aluminium and zinc-plated materials in humans. Int. J. Hyg. Environ. Health 2014, 217, 160–168. [Google Scholar] [CrossRef] [PubMed]
  5. Azari, M.R.; Esmaeilzadeh, M.; Mehrabi, Y.; Salehpour, S. Monitoring of occupational exposure of mild steel welders to ozone and nitrogen oxides. Tanaffos 2011, 10, 54–59. [Google Scholar] [PubMed]
  6. Okuno, T.; Ojima, J.; Saito, H. Blue-Light Hazard from CO2 Arc Welding of Mild Steel. Ann. Occup. Hyg. 2009, 54, 293–298. [Google Scholar] [PubMed]
  7. Slagor, R.M.; La Cour, M.; Bonde, J.P. The risk of cataract in relation to metal arc welding. Scand. J. Work. Environ. Health 2016, 42, 447–453. [Google Scholar] [CrossRef]
  8. Gourzoulidis, G.A.; Achtipis, A.; Topalis, F.V.; Kazasidis, M.E.; Pantelis, D.; Markoulis, A.; Kappas, C.; Bourousis, C.A. Artificial Optical Radiation photobiological hazards in arc welding. Phys. Med. 2016, 32, 981–986. [Google Scholar] [CrossRef]
  9. Zamanian, Z.; Mortazavi, S.J.; Asmand, E.; Nikeghbal, K. Assessment of health consequences of steel industry welders′ occupational exposure to ultraviolet radiation. Int. J. Prev. Med. 2015, 6, 123. [Google Scholar]
  10. Nakashima, H.; Utsunomiya, A.; Takahashi, J.; Fujii, N.; Okuno, T. Hazard of ultraviolet radiation emitted in gas metal arc welding of mild steel. J. Occup. Health 2016, 58, 452–459. [Google Scholar] [CrossRef] [Green Version]
  11. Mo, Y.L.; Koan, K.J. Investigation of Welding Effect on Rebars Using Neural Networks. J. Test. Eval. 1998, 26, 285–292. [Google Scholar]
  12. Datta, R.; Veeraraghavan, R.; Rohira, K.L. Weldability Characteristics of Torr and Corrosion-Resistant TMT Bars Using SMAW Process. J. Mater. Eng. Perform. 2002, 11, 369–375. [Google Scholar] [CrossRef]
  13. Murakami, K.; Maeda, N.; Kanematsu, H.; Nakata, K. Effect of Concrete Rebar Joint Arrangement on Weldability of Hot Dip Galvanizing Rebar by Shielded Metal Arc Welding. Q. J. Jpn. Weld. Soc. 2007, 25, 128–134. [Google Scholar] [CrossRef]
  14. Elangovan, S.; Semeer, S.; Prakasan, K. Temperature and stress distribution in ultrasonic metal welding—An FEA-based study. J. Mater. Process. Technol. 2009, 209, 1143–1150. [Google Scholar] [CrossRef]
  15. Velasco, F.; Blanco, V.; Bautista, A.; Martínez, M.A. Effect of welding on local mechanical properties of stainless steels for concrete structures using universal hardness tests. Constr. Build. Mater. 2009, 23, 1883–1891. [Google Scholar] [CrossRef]
  16. Xavier, C.R.; Delgado Junior, H.G.; de Castro, J.A. An Experimental and Numerical Approach for the Welding Effects on the Duplex Stainless Steel Microstructure. Mater. Res. 2015, 18, 489–502. [Google Scholar] [CrossRef] [Green Version]
  17. Bautista, A.; Paredes, E.C.; Alvarez, S.M.; Velasco, F. Welded, sandblasted, stainless steel corrugated bars in non-carbonated and carbonated mortars: A 9-year corrosion study. Corros. Sci. 2016, 102, 363–372. [Google Scholar] [CrossRef] [Green Version]
  18. Demarque, R.; de Castro, J.A.; Xavier, C.R.; da Silva, D.S.; Marcelo, C.J.; dos Santos, E.P.; de Queiroz, A.V. Numerical and Experimental Study of Microstructure Evolution and Properties of Welded Joints of Rebars by GMAW Process. Soldag. Inspeção 2015, 20, 434–445. [Google Scholar] [CrossRef]
  19. Moustafa, T.; Khalifa, W.; El-Koussy, M.R.; Abd El-Reheem, N. Optimizing the Welding Parameters of Reinforcing Steel Bars. Arab. J. Sci. Eng. 2016, 41, 1699–1711. [Google Scholar] [CrossRef]
  20. Ilić, A.; Ivanović, L.; Josifović, D.; Lazić, V.; Živković, J. Effects of welding on mechanical and microstructural characteristics of high-strength low-alloy steel joints. IOP Conf. Ser. Mater. Sci. Eng. 2018, 393, 1–10. [Google Scholar] [CrossRef]
  21. Umer, W.; Li, H.; Szeto, G.P.Y.; Wong, A.Y.L. Low-Cost Ergonomic Intervention for Mitigating Physical and Subjective Discomfort during Manual Rebar Tying. J. Constr. Eng. Manag. 2017, 143, 10. [Google Scholar] [CrossRef]
  22. Hajaghazadeh, M.; Marvi-Milan, H.; Khalkhali, H.; Mohebbi, I. Assessing the ergonomic exposure for construction workers during construction of residential buildings. Work 2019, 62, 411–419. [Google Scholar] [CrossRef] [PubMed]
  23. Cardno, C.A. Robotic Rebar-Tying System Uses Artificial Intelligence. Civ. Eng. Mag. Arch. 2018, 88, 38–39. [Google Scholar] [CrossRef]
  24. Salas, E.A.; Vi, P.; Reider, V.L.; Moore, A.E. Factors affecting the risk of developing lower back musculoskeletal disorders (MSDs) in experienced and inexperienced rodworkers. Appl. Ergon. 2016, 52, 62–68. [Google Scholar] [CrossRef]
  25. Umer, W.; Li, H.; Szeto, G.P.Y.; Wong, A.Y.L. Identification of Biomechanical Risk Factors for the Development of Lower-Back Disorders during Manual Rebar Tying. J. Constr. Eng. Manag. 2017, 143, 1–10. [Google Scholar] [CrossRef] [Green Version]
  26. Safa, M.; Cardenas, J.G.; Leblanc, D.G.; Rose, D.; Shahi, A. Improving construction labor productivity using automatic rebar tying gun. In Proceedings of the ISARC 2016—33rd International Symposium on Automation and Robotics in Construction 2016, Auburn, AL, USA, 18–21 July 2016; pp. 150–155. [Google Scholar]
  27. Martinez Aires, M.D.; Alonso, M.L.; Gago, E.J.; Pacheco-Torres, R. Technological advances in rebar tying jobs: A comparative analysis of the associated yields and illnesses. Int. J. Civ. Eng. 2015, 13, 171–178. [Google Scholar]
  28. Sam, S.; Sen, B.N.; Tzan, E.P.; Soon, Y.L. Development of standard MIG welding procedure for cage welding at NSH, Singapore. SEAISI Q. 2010, 39, 55–61. [Google Scholar]
  29. Chen, Y.; Yang, Z.M.; Wang, H.M. Comprehensive Properties of 400 MPa Grade Corrosion-Resistant Rebar. J. Iron Steel Res. Int. 2012, 19, 48–52. [Google Scholar] [CrossRef]
  30. Feng, P.; Zhou, Z.; Tian, Y.; Ye, L. Analysis on mechanical behavior of welding-overlap splices for mid-diameter steel bars. Tumu Jianzhu yu Huanjing Gongcheng/J. Civ. Archit. Environ. Eng. 2014, 36, 25–32. [Google Scholar]
  31. Girgin, S.C.; Misir, I.S.; Kahraman, S. Experimental Cyclic Behavior of Precast Hybrid Beam-Column Connections with Welded Components. Int. J. Concr. Struct. Mater. 2017, 11, 229–245. [Google Scholar] [CrossRef]
  32. Dance of the rebars at Finger Beton|Tanz der Stäbe bei Finger Beton. Betonw. Fert.-Tech./Concr. Plant Precast. Technol. 2015, 81, 54–55.
  33. Kim, J.J.; Kim, J.H. Designing bar-mesh modules of reinforced concrete structures. Comput. Struct. 1998, 67, 319–337. [Google Scholar] [CrossRef]
  34. Dolinšek, B.; Duhovnik, J. Robotic assembly of rebar cages for beams and columns. Autom. Constr. 1998, 8, 195–207. [Google Scholar] [CrossRef]
  35. Code on Structural Concrete (Spanish Abbreviation—EHE-08); Ministry of Public Works Spain, Secretaría General Técnica: Madrid, Spain, 2008.
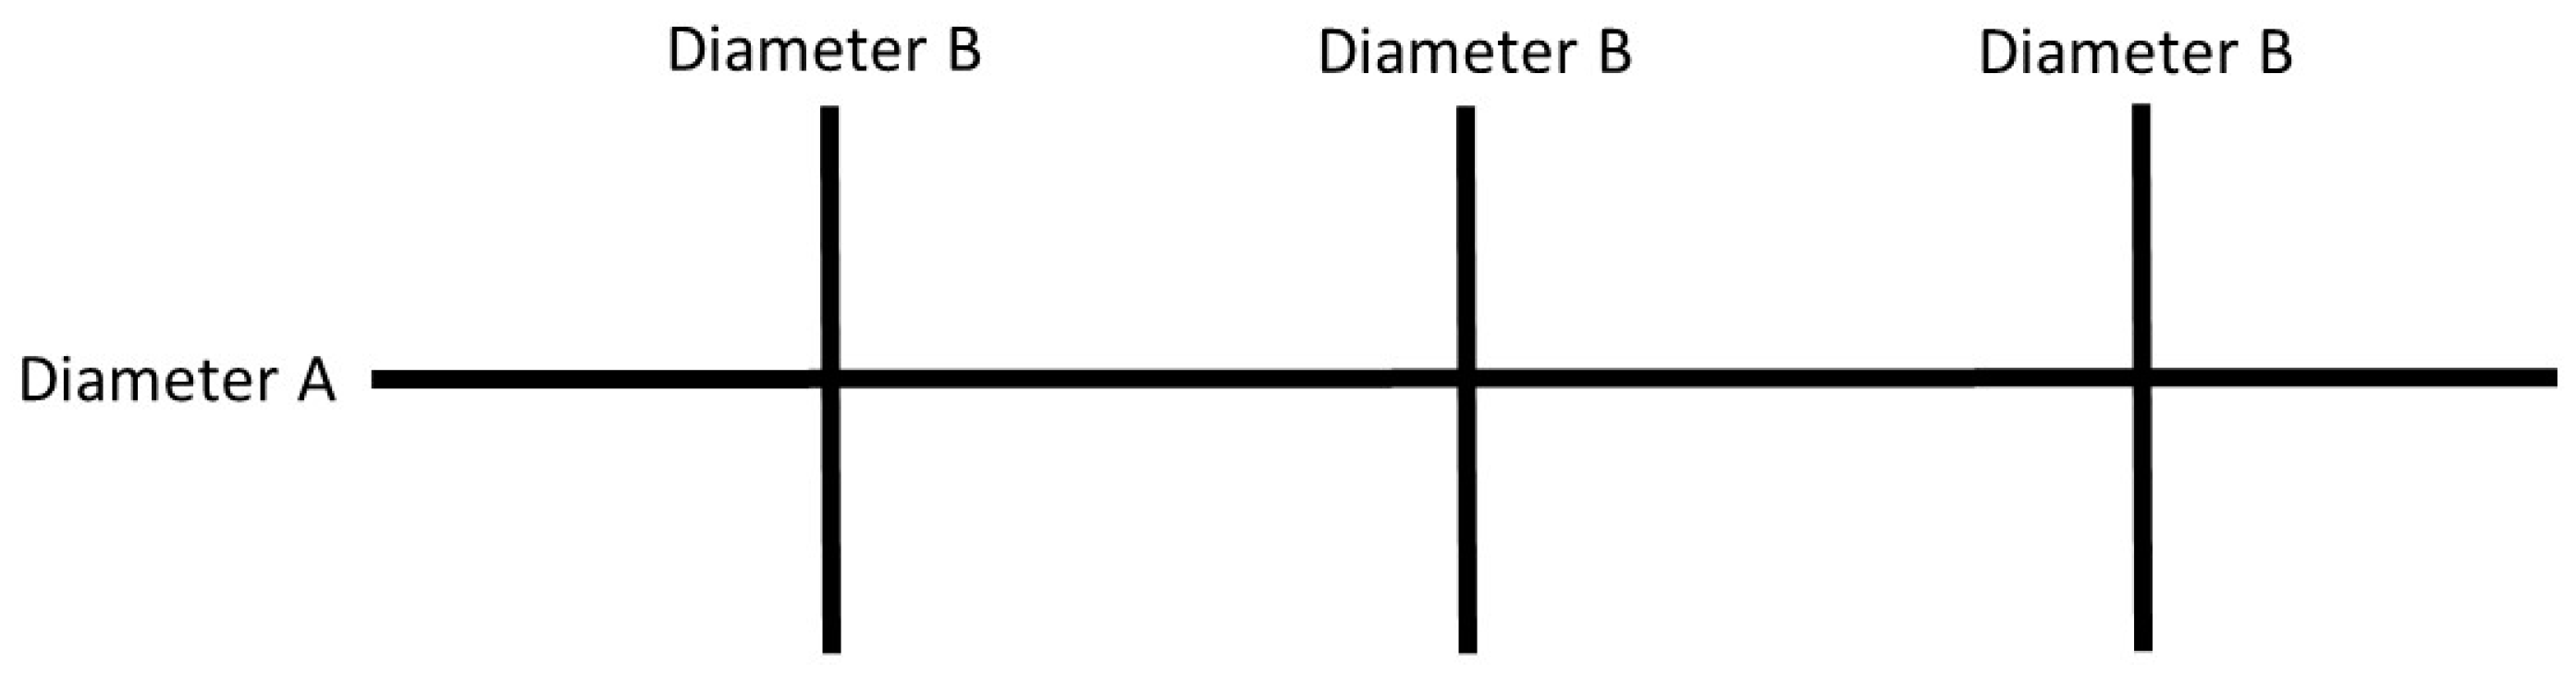
Figure 1. Rebar production.
Applsci 10 07045 g001
Figure 2. Configuration of the test pieces.
Applsci 10 07045 g002
Figure 3. (a) MPH Digital Neumática welding equipment and (b) fixture zoom and the welding process.
Applsci 10 07045 g003
Figure 4. Flow diagram of the welding process with each different joint thickness.
Applsci 10 07045 g004
Figure 5. Label nomenclature of the joint thickness (12 + 12 = 24 mm).
Applsci 10 07045 g005
Figure 6. (a) Measurement of the joint. (b) Example of a discarded weld.
Applsci 10 07045 g006
Figure 7. (a) Broken weld of a test piece, (b) Servosis ME-420/20.
Applsci 10 07045 g007
Figure 8. Shear (a) and tensile (b) failure tests.
Applsci 10 07045 g008
Figure 9. The force necessary for weld failure.
Applsci 10 07045 g009
Figure 10. Force necessary for failure. Weld thickness: 16 mm (a) and 18 mm (b).
Applsci 10 07045 g010
Figure 11. Force necessary for failure. Weld thickness: 20 mm (a) and 22 mm (b).
Applsci 10 07045 g011
Figure 12. Force necessary for failure. Weld thickness: 24 mm (a) and 26 mm (b).
Applsci 10 07045 g012
Figure 13. Force necessary for failure. Weld thickness: 28 mm (a) and 32 mm (b).
Applsci 10 07045 g013
Table 1. Combinations of different diameters.
Diameter A
(mm)
Diameter B
(mm)
Joint Thickness
(mm)
8816
81018
81220
101222
121224
101626
121628
161632
Table 2. The welding parameter commands for the A-t-p equipment.
Joint Thickness (mm)Equipment Parameters Nº Specimen
Phase-1 (Contact)Phase-2 (Welding)
16A*0.540%-50%-60%-70%-80%45
t*1/325-35-45
5_6_75_6_7
18A*0.540%-50%-60%-70%-80%45
t*1/329-40-51
5_6_75_6_7
20A*0.540%-50%-60%-70%-80%45
t*1/332-44-57
5_6_75_6_7
22A*0.540%-50%-60%-70%-80%45
t*1/335-49-62
5_6_75_6_7
24A*0.540%-50%-60%-70%-80%45
t*1/338-53-68
5_6_75_6_7
26A*0.540%-50%-60%-70%-80%45
t*1/341-57-74
5_6_75_6_7
28A*0.540%-50%-60%-70%-80%45
t*1/344-62-79
5_6_75_6_7
32A*0.540%-50%-60%-70%-80%45
t*1/350-70-90
5_6_75_6_7
Table 3. Assessment of weld performance.
Welding ParametersShear Force(Tn)AveragePulling Force(Tn)AverageWeld Failure (Tn)
A+B Thickness (mm)
Intensity (%)
Time (%)
Pressure (bar)
τ1τ2τ3τσ1σ2σ3σ F = σ 2 + τ 2
Real Thickness (mm)AverageOKInvalid
123456realreal > 0.85 ∆A+Breal < 0.85 ∆A+B

