Abstract
In 2006 the use of mercury (Hg) was banned for gold mining in French Guiana. However, mining of old placers could mobilize Hg accumulated in soils and sediment. This study aimed to measure the current impact of a mining concession (Boulanger site) on the Hg load in the watershed. Turbidity, Total Mercury (THg), and Monomethylmercury (MMHg) were measured in water, suspended particulate matter (SPM), river sediment and sediments from old tailing ponds along a river section of 30 km up and downstream from a mining concession in French Guiana during a dry and a rainy season. Total dissolved Hg (THgD) concentrations varied little from up- to down-stream but were all higher (fourfold on average) during the rainy season (3.2 to 4.4 ng L−1), than during the dry season and consistent with previous data known for the Amazonian area. Dissolved MMHg (MMHgD) represented up to 30% of THgD during the dry season, which is higher than previous results (typically around 2%). Mercury concentrations in sediments were highest in the vicinity of areas affected by old (before 2006) rather than new gold mining practices. Even though Hg was banned in 2006, present gold mining practices still release natural Hg and Hg inherited from older mining practices into the watershed.
1. Introduction
Mercury (Hg) is a toxic metal and a global pollutant, historically used in alluvial gold-mining to amalgamate and recover gold. In 2005, small-scale gold mining was estimated to contribute to more than 10% of the annual global anthropic Hg load to the atmosphere [1]. Use of Hg for gold mining was officially banned in French Guiana in 2006. However, “inherited” Hg in old gold mined areas is still present and remains a potential source of Hg to the environment. It is estimated that for 1 g of extracted gold, ~1.3 g of Hg are lost, despite its partial recycling [2,3]. In addition to Hg inputs from gold mining, Amazonian soils naturally contain high Hg concentrations due to the equatorial pedoclimatic situation (on average 10 times higher than temperate soils) [4]. During gold mining and generally during all deforesting operations [5,6,7,8], Hg adsorbed to colloids (clay, organic matter, and iron or aluminum oxides) is exported to the watershed, contaminating downstream ecosystems. In anaerobic environments (stagnant lagoons and sediment/water interface), Hg can be methylated, mainly by sulfate and iron-reducing bacteria, to form monomethylmercury (MMHg) [9,10]. MMHg is a neurotoxin which readily accumulates in the food chain up to concentrations considered dangerous for human health (around 1 mg kg−1 fresh weight in carnivorous fish such as Aymara, which is twice the World Health Organization (WHO) recommendation and 105–106 times higher than surrounding water concentrations) [11]. In local Amerindian populations, whose diet traditionally consists of freshwater fish, Hg concentrations can reach values clearly exceeding World Health Organization (WHO) safety recommendations. Indeed, concentrations of more than 10 µg g−1 hair have been measured in these populations [12].
French Guiana has known several gold rushes towards the end of the 19th century and especially at the beginning of the 20th. The gold mining techniques at that time, mainly imported from Anglo-Saxon methods developed in the Rocky Mountains, already used Hg to amalgamate gold. During these periods, gold-mined sites in French Guiana were mainly placers in small riverbeds or lateritic colluvium exploitations. The use of river barges came later, during the second half of the 20th century. It is considered that the activity at that time was much higher than presently, considering the number of placers and the volume of mineral treated. Evidently, this gold mining activity left traces of Hg contamination both on-site and downstream from the placers in the hydric network and the long-term stability of these Hg stocks is unknown. Many of the old placers are now covered by secondary rain forest, where little erosion occurs. However, these areas are potential sources of Hg pollution and need to be investigated to estimate their potential contribution to Hg dispersion in the Guianese hydric network, especially as many still contain economically relevant amounts of gold and are being re-exploited. Although 35% of the Hg used for goldmining is estimated to be released to the atmosphere, the remaining 65% are dumped on-site as metallic Hg (0) [13]. According to Laperche et al. [14], Hg concentrations in Guiana river sediments are generally close to background soil concentrations (100 ± 50 µg kg−1) and strongly increase close to gold mining sites. Concentrations up to 12 mg kg−1 have been measured in the River Approuague sediments and up to 15 mg kg-1 along the Eddie Creek (unpublished data). Spatial distribution in sediments along French Guiana Rivers indicates that metallic Hg lost by gold miners globally remains in the rejection zones, as contamination “hot spots” [14].
At gold-mined sites, Hg in soils either occurs naturally or is left over from past gold mining in the case of reopened old sites [8]. Due to mining, this Hg is mobilized together with soil particles and is dispersed downstream in the hydric network, where it can contaminate different compartments of the ecosystem. The water rejected from legal gold mining sites is controlled by measuring water turbidity, as high water turbidity can damage aquatic ecosystems due to light extinction [15]. Guédron et al. [16] showed that exported Hg is mainly associated to the fine suspended particulate matter (SPM) and colloids, prone to be transported over longer distances than coarse particles. However, despite this knowledge and the controls, the actual quantities of Hg rejected remain unknown, whether in pristine new placers or in re-opened old gold-mining sites that potentially contain more Hg.
The objective of the present work was to evaluate and compare the amounts of Hg exported from different gold mining areas, pristine or not, to the hydric network in contrasting hydrological situations (dry and rainy season) and to identify potential changes in water quality.
2. Materials and Methods
2.1. Study Area and Sampling Strategy
The Comté-Orapu basin covers 3359 km2. This study focuses on the sub basin of the Boulanger Creek, a tributary of the Orapu River (Figure 1), and downstream rivers including the Comté River, which joins the Orapu, forming the Oyack River. Sampling was carried out along a section of ~30 km, from the Boulanger Creek’s spring, accessed along the Molokoï path, to the Oyack River, along which water and sediment samples were collected, during a dry season in September 2012 and the following rainy season in March 2013 as described below.
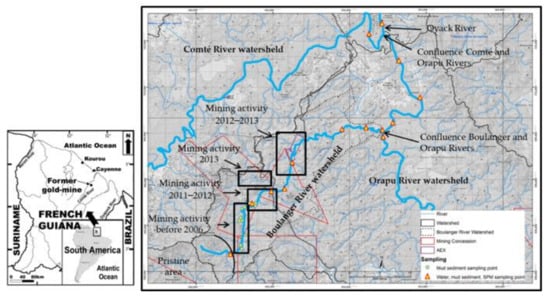
Figure 1.
Map of the study area in French Guiana and the sampling points.
During each sampling campaign, 14 water (~15 cm depth) and sediment samples were collected along the Boulanger Creek (Table 1 and Figure 1) and downstream Rivers (Orapu, Comté and Oyack).

Table 1.
Description of sampling points.
Suspended Particulate Matter (SPM) were recovered by filtering between 250 and 500 mL water on-site through pre-weighed cellulose nitrate filters (0.45 µm; ᴓ 47 mm; Sartorius®, Dourdan, France). The filters alone (blank) and the filters with SPM were transported to the laboratory in closed petrislides, then oven dried (50 °C, ~36 h) to constant weight. The mass of SPM sampled was determined on a precision balance (0.01 mg scales) from the difference with the initial dry filter weight. The filters were then conserved in sealed polypropylene boxes in the dark until further analysis.
Water samples were obtained by filtering 125 mL water (<0.45 µm, polyvinylidene fluoride filters (PVDF)) into pre-cleaned Teflon fluorinated ethylene propylene (FEP) bottles. Samples were acidified with suprapur HCl 0.5% v/v (Merck, Darmstadt, Germany) and stored in double polyethylene bags until analysis. All materials (PP, Teflon) in contact with samples were acid-washed (5 days in 20% HNO3 v/v followed by 5 days in HCl 10% v/v), rinsed several times with deionized water (Milli-Q®, Merck Millipore, Darmstadt, Germany) and dried under a laminar flow hood and stored in sealed polyethylene bags pending sampling. Polyethylene gloves were used for all handling operations.
River sediment samples were collected along the river section at the same spots as the water and SPM samples. At each sampling site, sediments were collected from just above the low water line during low tide on river banks where finer sediment tends to accumulate. It is assumed that they provide geochemical information that reflects the previous season’s conditions [14]. There was no chemical (saltwater) impact of the tide on the water samples. Sediment samples were stored in polyethylene bottles and sent to the laboratory in Petit Saut (Hydreco, French Guiana, French) for treatment and analysis.
During the dry season (September 2012), sediment samples were also collected from the edges of 14 old tailing ponds (Figure 1). Some of these tailing ponds were filled more than 10 years ago and they are now covered by vegetation without having been properly rehabilitated, which makes it too dangerous to walk on the tailing pond’s surface. No tailing samples were collected during the rainy season in March 2013. Indeed, as shown in the results section, Hg contents measured in the 2012 samples were similar to previous analyses carried out in 2006 [14], suggesting little evolution of the Hg concentrations in the tailing ponds.
2.2. Mercury Analysis in Tailing Ponds and Sediment Samples
Tailing and sediment samples were oven dried at 38 °C to constant weight and sieved (2 mm) before analysis. Total Hg (THg) concentrations in solids were determined by Atomic Absorption Spectrophotometry after dry mineralization and gold amalgamation with an Automatic Mercury Analyzer (Model AMA 254 Altec, Uherske Hradiste, Czech Republic). All particulate THg concentrations were expressed in ng g−1 dry sediment. Triplicates were performed for each analysis for quality assurance/quality control (QA/QC). The relative error was routinely ±5% (Relative Standard Deviation) and always under ±10%, consistently with typical relative errors reported for this method [17]. Detection limit (defined as 3 times the standard deviation (SD) of the blanks) was maximum 5 ng g−1. Concentrations obtained for repeated analyses of the certified reference material (CRM) MESS-3 (Marine Sediment Reference Materials, National Research Council Canada, Ottawa, Ontario were consistently within the published concentration range (91 ± 8 ng g−1).
2.3. Dissolved Mercury (HgD) and Methylmercury (MMHg) Analyses
All analytical procedures were conducted using ultra clean sample handling to avoid laboratory contamination of low-level sample extracts and a cross-contamination of high-level samples [18]. Calibration was performed by species-specific isotope-dilution by adding known amounts of 201Hg-enriched Hg(II) solution (Oak Ridge National Laboratory, isotopic purity 96%) and 202Hg-enriched MMHg solution (CH3202HgCl; ERM-AE670; Institute for Reference Materials and Measurements, isotopic purity of 98%) directly to the sample before the extraction procedure [19,20]. Analysis of Hg species in the organic extract was performed by Gas Chromatography (Thermo-Fischer Scientific, Focus GC, France) coupled with ICP-MS (Inductively coupled plasma mass spectrometry, Thermo-Fischer Scientific; X7, France) as previously described [21].
Detection limit (3 sigma of the blank values including reagent blank and sample handling) was 0.008 ng L−1. The analytical results were continuously quality checked by analyzing an internal standard solution prepared by digesting a known amount of international certified reference material (International Atomic Energy Agency, IAEA 405) with 6 M HNO3 [20]. Accuracy was 94 ± 4% and precision based on replicate analyses (n = 12) of the standard solution was better than 5% (RSD).
2.4. Mercury Concentrations in Suspended Particulate Matter
Total Hg in SPM was measured by Atomic Absorption Spectrometry with a Direct Mercury Analyzer 80 (MILESTONE, Sorisole, Italy), i.e., analytical equipment using procedures similar to those used for THg analyses in sediment (see above). Quality control was performed by measuring blanks and certified materials of different origins (estuary, sea or river sediments) and concentrations (from 30 to 1600 ng g−1; NCS DC 70317 (Tibet sediment) from Laboratory Standards (Budapest, Hungary), IAEA-433 (Marine Sediment) from IAEA Reference Products for Environment and Trade, BCR-320R (Channel sediment) and BCR-280R (Lake sediment) from the Joint Research Centre (Geel, Belgium), after each set of 5 samples. Accuracy was evaluated to ~90% and precision was better than 5% (RSD).
2.5. Turbidity
Turbidity is water cloudiness caused by suspended and dissolved particles. As water turbidity is mainly caused by the presence of SPM [22], turbidity has often been used to estimate SPM concentrations. Turbidity is a function not only of SPM but also of the sizes, shapes, and composition/colour of the particles. These variables may introduce bias to SPM estimation. In this study, turbidity was assessed by the value of Nephelometric Turbidity Unit (NTU). Turbidity was measured with a microprocessor turbidity meter (Eutech Instrument Turbidimeter TN-100, Fisher Scientific, Illkirch, France) calibrated by using Formazin solutions of 0.02, 20, 100, and 800 NTU, according to the manufacturer’s operating instructions.
Parallel measurements of SPM concentrations by filtration and weighing were performed (see above) to establish potential relationships between turbidity and SPM concentration under the different hydrological situations studied.
2.6. Water Flow and Hg Fluxes
Water flow was measured with an acoustic Doppler velocimeter ([ADV] 10-MHz Ocean ADV, Sontek Inc., San Diego, CA, USA), in 6 different places along the rivers: (1) upstream and (2) downstream the Boulanger Creek; (3) in the Orapu River, just upstream from its confluence with the Boulanger Creek; (4) in the Orapu River, just downstream from its confluence with the Boulanger Creek; (5) in the Comté River just before it flows into the Orapu; and (6) in the Oyack, just after its formation by the joining of the Comté and Orapu Rivers.
Fluxes were estimated for the SPM in g s−1, for total particulate Hg adsorbed on the SPM (THgp, µg s−1) and for total dissolved Hg (THgD, µg s−1).
3. Results
3.1. Hg in Tailing Ponds
Total Hg concentrations in the 14 tailing pond samples ranged between 70 and 1020 ng g−1 dry sediment (Figure 2). The Hg concentrations in samples (n = 8) from the pond zones exploited before 2006 (from Creek St Roch to Creek Diable, points 17–24, Figure 2 covered the whole concentration range, whereas the recently exploited zone showed concentrations between 110 and 470 ng g−1 (n = 6). Except for point 4 (1020 ng g−1), the average Hg concentration in pond sediments was 190 ng g−1, which is very similar to values obtained in 2006 for the same ponds (180 ng g−1, 26 samples from 10 ponds) [14].
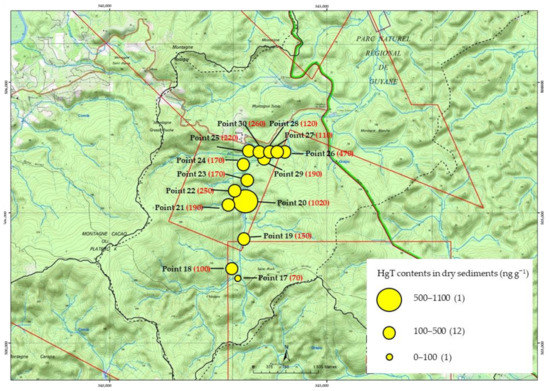
Figure 2.
Localization of samples taken from old tailing ponds in the Boulanger concession in the dry season of September 2012 and total mercury (THg) contents (ng g−1). Points 17–24 are tailing ponds dating before the mercury (Hg) ban for gold mining in 2006, whereas points 25–30 are more recent.
3.2. Total Hg in River Sediments and Suspended Particulate Matter in Relation to Turbidity
Total Hg in river sediments (THg) from both sampling campaigns were compared (Figure 3a). Overall, there was little difference between the dry season and the rainy season with THg concentrations varying from 40 to 380 ng g−1. For both campaigns, the highest concentrations occurred at points B2 and B3 in the sector exploited prior to 2006 (B2) and in the more recently exploited area (B3).
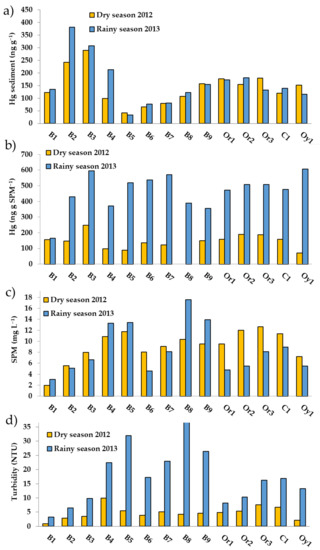
Figure 3.
(a) Hg associated to river sediments, (b) Hg associated to suspended particulate matter (SPM), (c) suspended particulate matter (SPM) and (d) Turbidity at all sampling points for the dry season in September 2012 and the rainy season in March 2013. B1 to B9: Boulanger Creek, Or1 to Or3: Orapu River, C1: Comté River and Oy1: Oyack River.
The lowest THg in river sediment was measured at point B5, where the Boulanger Creek was deviated from its original course. The sediment at this point contained 42 ng kg−1, close to the lowest value (31 ng g−1) found in this area [14]. Moreover, THg concentrations at B5 were even lower in 2013 (34 ng g−1 dry sediment), when the creek was positioned to flow through the middle of the flats in a rehabilitated zone.
Downstream from B5, total Hg concentrations in river sediments increased regularly from 70 to maximum 150 ng g−1 along the Boulanger Creek to its confluence with the Orapu River (point B9) and were then constant until the Orapu and the Comté Rivers merge and form the Oyack River (points Or1 to Or3).
Total Hg concentrations in SPM collected during the dry season are comparable to those in the sediment and vary from 80 to 505 ng g−1 (Figure 3b). However, during the rainy season Hg concentrations in SPM increased by two- to three-fold, except in the most upstream point where values were the same (~150 ng g−1) for both seasons. Maximum Hg concentrations in SPM, i.e., ~600 ng g−1 were higher than maximum values in sediments (~380 ng g−1).
Although Hg concentrations in SPM increased during the rainy season, the amounts of SPM in river water were globally similar for both sampling campaigns (Figure 3c) and ranged between 2 and 18 mg L−1. Turbidity on the other hand was 2–9-fold higher during the rainy season with an increase in NTU along the Boulanger Creek to 38 NTU that then dropped in the Orapu and Oyak to around 10–15 NTU (Figure 3d). The lowest value (<5NTU) corresponded to an isolated spot upstream from the mining district and uninfluenced by human activities.
Accordingly, amounts of SPM did not follow the same pattern as the turbidity values. However, a linear relation was found between turbidity and SPM concentrations, that differed between the dry and rainy seasons (Figure 4).
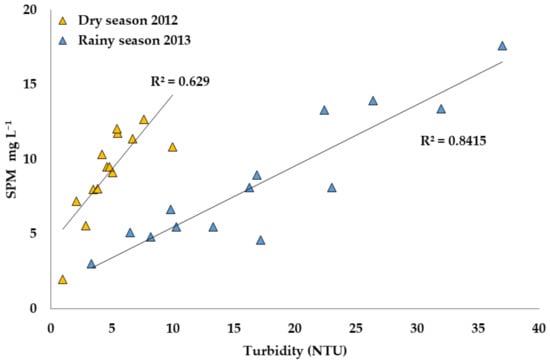
Figure 4.
Relation between SPM and Nephelometric Turbidity Unit (NTU) in the dry season in September 2012 and the rainy season in March 2013.
3.3. Hg and MMHg in River Water
Filtered water THgD concentrations varied little from up to downstream during the rainy season, from 3.2 to 4.4 ng L−1 (Figure 5) but were all higher than during the dry season (fourfold on average). During the dry season, an increase of MMHg in waters from upstream Boulanger down to the mined areas occurred. Concentrations then decreased downstream in the Orapu, probably because of the increase of the flow rate of the Orapu River (80 m3 s−1, SM-1) compared to the discharge of the Boulanger Creek (2.2 m3 s−1, SM-1). In contrast, during the rainy season, no clear pattern was observed but higher concentrations (160 pg L−1) were measured at points B2, B5, B8, and C1. During the dry season, the percentage of MMHg (MMHg/THgD) reached up to 30% downstream from the gold-mining district (Figure 5a–c), with an overall average of 13%, whereas during the rainy season it was of 3% in the same zone with a maximum of 4%.
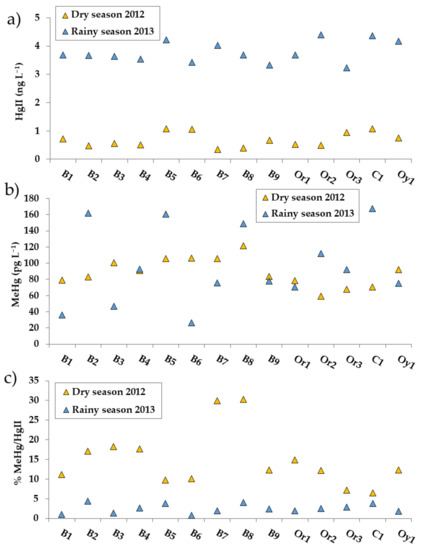
Figure 5.
Dissolved Hg and monomethylmercury (MMHg) in water samples from the Oyack River catchment. (a): Total dissolved Hg (THgD) (ng L−1), (b): MMHg (pg L−1) and (c): %MMHg/THgD. In all three graphs, stars give data for the dry season in September 2012 and triangles for the rainy season in March 2013. B1 to B9: Boulanger Creek, Or1 to Or3: Orapu River, C1: Comté River and Oy1: Oyack River.
3.4. SPM and Hg Global Export
Based on the water discharges measured at different points during the dry and rainy seasons (SM-1), estimations of the amount of exported SPM, particulate Hg or HgP and THgD were made for both seasons (Figure 6). Between the dry and the rainy season, water discharges increased by a factor of 3.4 to 4.1 at all sampling points (SM-1). There was also a similar increase (between 5.6 and 5.7) from up- to downstream along the Boulanger Creek. During the dry season, the area around the Boulanger Creek and the Comté River showed less gold mining activity than was expected. This induced a decrease in SPM export. During the dry season also, SPM exportations did not increase from upstream to downstream probably due to a balance between sedimentation and flux that maintained the SPM charge stable. On the opposite, during the rainy season, increasing river discharges resulted in higher erosion and transport, leading to an increase in SPM charge from upstream to downstream. Depending on the sampling points, the increase in HgP varied from 2 (upstream Orapu River) to 15 (Oyack River) between the dry and rainy season, reflecting the related soil erosion, whereas the increase in HgD was constant (~20 fold) whatever the sampling point.
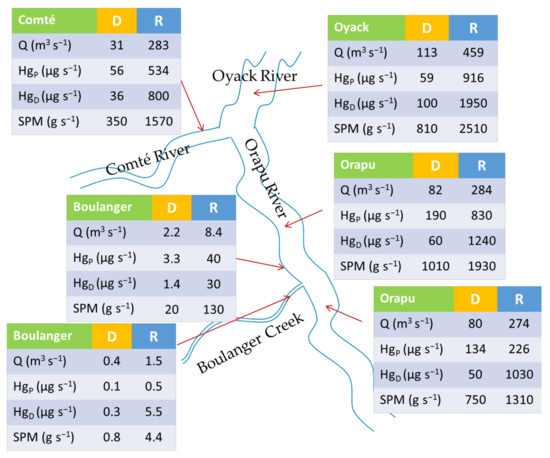
Figure 6.
Comparison of water flux in the Orapu-Comté watershed and associated estimations of SPM and Hg export during the dry and rainy sampling campaigns (September 2012 and March 2013), (dry season (D); rainy season (R); particulate Hg (HgP); dissolved Hg (HgD).
4. Discussion
4.1. Hg in Tailing Ponds Remains Constant over Time
As the concentrations measured in 2012 were very similar to those measured in 2006, it appears that the Hg in the tailing ponds remains stable over time, at least at the pluri-annual time scale. The range of values found here are much lower than Hg contents reported in Venezuela [23], where Hg in pond sediments ranged from 160 ng g−1 to 542 µg g−1, but comparable to those found in abandoned ponds in Colombia [24]. Here the authors measured THg in sediments from 27 tailing ponds, abandoned since 1997 and found between 39 and 1271 ng g−1 dry sediment.
Although it was expected to find higher amounts of Hg in the ponds dating from before the Hg ban for goldmining in 2006, some relatively high concentrations were also found in the more recently exploited areas. The typical background sediment concentration is around 100 ng g−1 sediment [14] and all the samples, except for point 17 (Figure 2), where THg was 70 ng g−1, were above this value. In the zone exploited after 2006, high Hg in the tailing ponds could be a legacy from older exploitation periods.
4.2. Recent Goldmining Activity Increased THg in River Sediment Despite the Hg Ban in 2006
Overall values of THg in river sediments varied between 40 and 380 ng g−1 and were similar in magnitude to previous results reported for French Guiana [14]. Spadini et al., [25] found 510 ng g−1, 295 ng g−1 and 261 ng g−1 dry sediment at distances of respectively 0, 35, and 50 km downstream from mining areas. Goix et al. [26], measured between 32 and 358 ng g−1 with significantly higher values in artisanal and small-scale gold-mining (ASGM) areas along the River Oyapock. These results are also close to values of 20 to 53 ng g−1 reported for river sediments along the Malinoski–Tambopata river system in Peru, a river affected by artisanal and small-scale gold-mining (ASGM) [27]. In another Peruvian river system, the Madre de Dios, also impacted by ASGM [28], authors reported Hg levels in sediments ranging from 9 ng g−1 upstream up to 95.3 ng g−1 downstream from the gold mined areas. More recently in Brazil, [29], measured between 19 and 155 ng g−1 along the River Tapajos. Again, highest values were observed in the vicinity of gold mining areas. However, all these Hg concentrations in goldmining-affected sediments of the Amazonian water basin were clearly lower than those reported for River Gambia in Senegal, where Hg in sediments reached 1160 +/- 800 ng g−1 in an area affected by ASGM [30].
In the present study, the highest concentrations of Hg in sediment occurred at points B2, B3, and B4 along the Boulanger Creek. These sites are both located directly downstream from the old tailing ponds, from where Hg-rich sediment can be exported and from the most recently exploited mining area (2011–2012), where bare soils are likely to favor soil erosion. These re-exploited old placers probably are sources of both Hg naturally present in soil and Hg leftovers from old mining practices, which would explain the increase at point B4 between the dry and rainy season (THg doubled from 100 to 200 ng g−1) in relation to the onset of the exploitation next to the nearby Fourmi Creek in 2013. Previously, in a study conducted on the Tapajos River in Brazil, Telmer et al., [31] concluded that mining operations were at the origin of Hg anomalies, not from the amalgamation process itself, but from the increased erosion during the mining operations. This re-mobilizes the mercury contained naturally in soils and mercury resulting from historical mining activities that then migrates to the river. These results are coherent with our results and are supported by recent research conducted by Goix et al., [26] using an isotopic approach. These authors showed that up to 78% of Hg in sediments downstream from the gold mining site was of anthropogenic origin, of which more than half derived from the release of liquid Hg (0) and the rest from erosion of surrounding Hg-contaminated soils.
Outside the mining zones, THg concentrations in sediment were of the same order as those measured previously in this area [14]. Accordingly, the relatively low concentrations measured upstream from the mining areas (point B1) were similar to previously reported values for uncontaminated Amazonian sediments [32,33].
The decrease in the Hg load in sediments downstream from the Boulanger Creek and especially in the larger rivers such as the Orapu and the Comté is supposedly due to the huge dilution with waters draining the whole watershed and highlight the locally high values of creeks such as the Boulanger, impacted by goldmining.
4.3. Greater SPM Hg Load during the Rainy Season All along the Water Shed
Suspended Particulate Matter (SPM) increased along the Boulanger Creek, from 2 mg L−1 at point B1 to a maximum of 18 mg L−1 at B8. Downstream from there, values were between 4 and 8 mg L−1 during the rainy season and 8–12 mg L−1 during the dry season. Mining activity was low that year on the Boulanger Creek, which could explain the small difference between the two seasons, but also a natural dilution effect can reduce SPM concentrations. Due to the low erosion rates of the Precambrian Guiana Shield, French Guiana Rivers naturally have very low SPM values [34]. Amounts of SPM observed in the present work are similar to average values reported by these authors along other Guiana Rivers, i.e., the Oyapock and the Maroni Rivers.
During the rainy season, the Hg load in SPM increased by 2–3-fold at all sampling points except B1. During the dry season, concentrations were between 100 and 250 ng g−1 while during the rainy season they were between 400 and 600 ng g−1. It would seem that the SPM mobilized during the rainy season contains more Hg than during the dry season. Roulet et al. [33,35,36] reported THg concentrations from 167 to 425 ng g−1 (dry weight) in SPM from clear waters (such as those in French Guiana), on a commercial sector of the Tapajos River, and from 154 to 355 ng g−1 (dry weight) in a zone 50 km from the mining district. The THg concentrations in the present study were slightly higher than this, but clearly lower than those reported for the Rio Négro, where THg reached values up to 2070 ng g−1 [32]. However, in 2006 [16], during the rainy season at point B5 (down-stream Leoncé; Figure 1), THg concentrations were 1420 ng g−1 (dry weight) i.e., three times higher than in the present study, which may be due to the fact that during this period there was active mining upstream from site B5. In other Amazonian watersheds, similar or higher values have been reported, e.g., between 400 and 4000 ng g−1 were found along the ASGM-affected Malinoski–Tambopata river system in Peru [27]. Furthermore, Hg concentration ranges of 3.2 to 133 ng g−1 in SPM during the dry season, and 13.3 to 42 ng g−1 during the rainy season were found along the Madre de Dios River [28]. In Brazil, along the Tapajos River, Hg in unfiltered water varied between 0.65 ng L−1 and 23.8 ng L−1 in tributaries closer to gold mining activities. Given that Hg is mainly transported in the particulate fraction, this maximum value corresponds to around 86 ng Hg g−1 SPM [29].
4.4. Relation between Turbidity and SPM Was Different According to the Season
Highest turbidity values occurred along the Boulanger Creek in areas flowing through active mining zones and downstream from these zones. Turbidity values decreased sharply in the Orapu River and then increased steadily down towards the Oyack River but not to values as high as in the Boulanger Creek. Turbidity must not be regarded as proportional to SPM concentration but as one effect of SPM among others on water physical properties such as transparency. Thus, although SPM concentrations during the rainy season are comparable to those of the dry season, turbidity can be higher. This is partly explained by the nature of SPM, which can vary from one river to another depending on the organic and mineral load and influence light reflection. Indeed, changes in turbidity per unit of SPM are likely associated with changes in particles morphology and also in changes in size as large particles scatter light less efficiently than smaller ones [37,38]. The fact that, for a similar SPM concentration, turbidity in the studied rivers was clearly higher during the rainy season, may also suggest the presence of high amounts of colloidal/dissolved components, such as humic and/or fulvic acids due to increased soil leaching [38]. Two distinct linear relationships were obtained for the rainy and dry season between SPM and turbidity, possibly linked to the different nature of SPM during the two seasons. Further work to characterize these differences could also contribute to explaining the Hg load. Turbidity could provide an easy way to control gold mining sites and might be an efficient monitor of correct use of tailing ponds, although it appears here that for a same turbidity measure, the SPM load is not the same depending on the season, and thus the amounts of transported Hg are also different.
4.5. River Water THgD and MMHgD
As in previous studies, the Hg fraction in filtered water was very low compared to the particulate fraction. Indeed, SPM remains the major pathway for river borne Hg as Hg bound to SPM [31]. Concentrations of THgD averaged 0.25 ng L−1 in the dry season of 2012 and 3.70 ng L−1 in the rainy season of 2013. These concentrations are comparable to those found in unpolluted waters [39] and are similar to those measured previously in the Boulanger Creek in 2005–2006 [16].
During the dry season, concentrations of MMHgD were globally higher along the Boulanger Creek than further downstream, whereas during the rainy season no clear pattern was found and concentrations fluctuated between low (20 pg L−1) to high concentrations (160 pg L−1). In comparison, [16] found concentrations of 24–25 pg L−1 in the Boulanger Creek in 2005–2006. Although highest concentrations of MMHgD were measured during the rainy season, during this period it represented a very small (<3%) fraction of THgD, whereas during the dry season this ratio went up to 30% at points B7 and B8. Such increase could be due to conditions that are more stagnant during the dry season favoring anaerobic conditions and Hg methylation.
4.6. SPM and Hg Global Export
Exported SPM from the Boulanger Creek was low compared to the Orapu River; however, it is possibly the multitude of such small creeks impacted by goldmining activities which results in the concentrations observed downstream. An approach such as the one carried out by Gallay et al. [34], who estimated the impact of land degradation on sediment fluxes in the Maroni and Oyapock River catchments, coupled to Hg measurements would yield further information on the impact of modern goldmining on Hg fluxes.
5. Conclusions
Regardless of the process used for the extraction of alluvial gold in French Guiana, the activity consists first of the resuspension of the clays and loose materials of the placers using pressurized water jets. Without carefully sized settling basins, this considerably increases river turbidity and Hg mobility. The hypothesis of the present study was that this phenomenon is more intense when older sites are exploited and that “inherited” Hg can also be remobilized. Based on the two sampling campaigns carried out in the dry season and in the rainy season downstream of the Boulanger mining sector, this study gives a first assessment of the spatial and seasonal variability of Hg exported from a re-exploited site. Results showed that, even in the absence of gold mining activity (during the dry season in September 2012, activity on the CMB concession was low), Hg was exported to the rivers downstream. Furthermore, when previously mined areas (with the use of Hg for amalgamation) are re-exploited, exports tended to be greater and were amplified during the rainy season.
The present work confirms previous observations reporting that soil erosion, whether due to deforestation for agricultural purposes, or soil excavation for goldmining is likely to contribute to Hg mobilization from soil to the water shed. Although the ban of Hg for amalgamation in 2006 put a stop to additional Hg input in legal mining exploitations, recent mining exploitations on sites where gold was mined during the last century by amalgamation imply a higher risk of re-mobilizing “inherited” mercury.
Author Contributions
Conceptualization, J.H., J.S., and V.L.; funding acquisition, J.H. and V.L.; investigation, J.H., R.V., L.L., and V.L.; project administration, V.L.; writing—original draft, J.H. and V.L.; writing—review and editing, J.S. and V.L. All authors have read and agreed to the published version of the manuscript.
Funding
This research was funded by the French Guiana Water Office and DEAL in the frame of the PRSE2 Guyane (Second programme for the promotion of Health and environment).
Acknowledgments
We thank Philippe Matheus, manager of the Boulanger Mining Company (CMB) for giving us access and authorization to collect samples from the CMB mining concession. We also thank Erwan Manach from CMB for helping with access to the sampling spots; Manuel Moisan and Bernard Joseph for their help with the fieldwork; and Cécile Bossy for her help in data acquisition.
Conflicts of Interest
The authors declare no conflict of interest. The funders had no role in the design of the study; in the collection, analyses, or interpretation of data; in the writing of the manuscript, or in the decision to publish the results.
References
- Swain, E.B.; Jakus, P.M.; Rice, G.; Lupi, F.; Peter, A.M.; Jozef, M.P.; Alan, P.; Samuel, J.S.; Marcello, M.V. Socioeconomic Consequences of Mercury Use and Pollution. Ambio 2007, 36, 45–61. [Google Scholar] [CrossRef]
- Picot, J.C.; Foucher, J.L.; Wagner, R. Production aurifère et mercure utilisé de l’origine à nos jours. BRGM-Guyane Rapp. 1993, R37837, 18. [Google Scholar]
- Pfeiffer, W.C.; Drude de Lacerda, L.; Malm, O.; Souza, C.M.M.; da Silveira, E.G.; Bastos, W.R. Mercury concentrations in inland waters of gold-mining areas in Rondônia, Brazil. Sci. Total Environ. 1989, 87–88, 233–240. [Google Scholar] [CrossRef]
- Carmouze, J.P.; Lucotte, M.; Boudou, A. Le Mercure en Amazonie, Rôle de l’Homme et de l’Environnement, Risques Sanitaires; IRD Editions: Paris, France, 2002; p. 494, EAN13: 9782709914673. [Google Scholar]
- Roulet, M.; Lucotte, M.; Canuel, R.; Farella, N.; Courcelles, M.; Guimarães, J.R.D.; Mergler, D.; Amorim, M. Increase in mercury contamination recorded in lacustrine sediments following deforestation in the central Amazon. Chem. Geol. 2000, 165, 243–266. [Google Scholar] [CrossRef]
- Lacerda, L.D.; de Souza, M.; Ribeiro, M.G. The effects of land use change on mercury distribution in soils of Alta Floresta, Southern Amazon. Environ. Pollut. 2004, 129, 247–255. [Google Scholar] [CrossRef]
- Almeida, M.D.; Lacerda, L.D.; Bastos, W.R.; Herrmann, J.C. Mercury loss from soils following conversion from forest to pasture in Rondonia, Western Amazon, Brazil. Environ. Pollut. 2005, 137, 179–186. [Google Scholar] [CrossRef] [PubMed]
- Grimaldi, M.; Guédron, S.; Grimaldi, C. Impact of gold mining on mercury contamination and soil degradation in Amazonian ecosystems of French Guiana. In Land-Use Change Impacts on Soil Processes: Tropical and Savannah Ecosystems; Brearley, F.Q., Thomas, A.D., Eds.; CAB International: Wallingford, UK, 2015; pp. 95–107. [Google Scholar]
- Compeau, G.C.; Bartha, R. Sulfate-Reducing Bacteria: Principal Methylators of Mercury in Anoxic Estuarine Sediment. Appl. Environ. Microbiol. 1985, 50, 498–502. [Google Scholar] [CrossRef] [PubMed]
- Fleming, E.J.; Mack, E.E.; Green, P.G.; Nelson, D.C. Mercury Methylation from Unexpected Sources: Molybdate-Inhibited Freshwater Sediments and an Iron-Reducing Bacterium. J. Appl. Environ. Microbiol. 2006, 72, 457–464. [Google Scholar] [CrossRef]
- Charlet, L.; Boudou, A. Cet or qui file un mauvais mercure. Recherche 2002, 359, 52–59. [Google Scholar]
- Cordier, S.; Grasmick, C.; Pasquier-Passelaigue, M.; Mandereau, L.; Weber, J.P. Imprégnation de la population guyanaise par le mercure: Niveaux et sources d’exposition. Bull. Epidémiol. Hebd. 1997, 14, 59–61. [Google Scholar]
- Telmer, K.H.; Veiga, M.M. World emissions of mercury from artisanal and small scale gold mining. In Mercury Fate and Transport in the Global Atmosphere: Emissions, Measurements and Models; Mason, R., Pirrone, N., Eds.; Springer: Boston, MA, USA, 2009; pp. 131–172. [Google Scholar]
- Laperche, V.; Hellal, J.; Maury-Brachet, R.; Joseph, B.; Laporte, P.; Breeze, D.; Blanchard, F. Regional distribution of mercury in sediments of the main rivers of French Guiana (Amazonian basin). SpringerPlus 2014, 3, 1–11. [Google Scholar] [CrossRef]
- Davies-Colley, R.J.; Smith, D.G. Turbidity Suspended Sediment, and water clarity: A Review. JAWRA J. Am. Water Resour. Assoc. 2001, 37, 1085–1101. [Google Scholar] [CrossRef]
- Guedron, S.; Grimaldi, M.; Grimaldi, C.; Cossa, D.; Tisserand, D.; Charlet, L. Amazonian former gold mined soils as a source of methylmercury: Evidence from a small scale watershed in French Guiana. Water Res. 2011, 45, 2659–2669. [Google Scholar] [CrossRef]
- Roos-Barraclough, F.; Givelet, N.; Martinez-Cortizas, A.; Goodsite, M.E.; Biester, H.; Shotyk, W. An analytical protocol for the determination of total mercury concentrations in solid peat samples. Sci. Total Environ. 2002, 292, 129–139. [Google Scholar] [CrossRef]
- Cossa, D.; Gobeil, C. Mercury speciation in the Lower St. Lawrence Estuary. Can. J. Fish. Aquat. Sci. 2000, 57, 138–147. [Google Scholar] [CrossRef]
- Monperrus, M.; Krupp, E.; Amouroux, D.; Donard, O.F.X.; Martín-Doimeadios, R.C.R. Potential and limits of speciated isotope-dilution analysis for metrology and assessing environmental reactivity. TrAC Trends Anal. Chem. 2004, 23, 261–272. [Google Scholar] [CrossRef]
- Schäfer, J.; Castelle, S.; Blanc, G.; Dabrin, A.; Masson, M.; Lanceleur, L.; Bossy, C. Mercury methylation in the sediments of a macrotidal estuary (Gironde Estuary, south-west France). Estuar. Coast. Shelf Sci. 2010, 90, 80–92. [Google Scholar] [CrossRef]
- Martín-Doimeadios, R.C.R.; Krupp, E.; Amouroux, D.; Donard, O.F.X. Application of Isotopically Labeled Methylmercury for Isotope Dilution Analysis of Biological Samples Using Gas Chromatography/ICPMS. Anal. Chem. 2002, 74, 2505–2512. [Google Scholar] [CrossRef]
- Ives, K.J.; Atkin, J.R.; Thompson, R.P. Measurement of turbidity. Effl. Water Treat. J. 1968, 3, 342–348. [Google Scholar]
- Santos-Francés, F.; García-Sánchez, A.; Alonso-Rojo, P.; Contreras, F.; Adams, M. Distribution and mobility of mercury in soils of a gold mining region, Cuyuni river basin, Venezuela. J. Environ. Manag. 2011, 92, 1268–1276. [Google Scholar] [CrossRef]
- Gutiérrez-Mosquera, H.; Marrugo-Negrete, J.; Díez, S.; Morales-Mira, G.; Montoya-Jaramillo, L.J.; Jonathan, M.P. Distribution of chemical forms of mercury in sediments from abandoned ponds created during former gold mining operations in Colombia. Chemosphere 2020, 258, 127319. [Google Scholar] [CrossRef]
- Spadini, L.; Charlet, L. Distribution of anthropogenic mercury in French Guyana river sediments downstream from gold mining sites. J. Phys. IV Fr. 2003, 107, 1263–1266. [Google Scholar] [CrossRef]
- Goix, S.; Maurice, L.; Laffont, L.; Rinaldo, R.; Lagane, C.; Chmeleff, J.; Menges, J.; Heimbürger, L.-E.; Maury-Brachet, R.; Sonke, J.E. Quantifying the impacts of artisanal gold mining on a tropical river system using mercury isotopes. Chemosphere 2019, 219, 684–694. [Google Scholar] [CrossRef]
- Moreno-Brush, M.; Rydberg, J.; Gamboa, N.; Storch, I.; Biester, H. Is mercury from small-scale gold mining prevalent in the southeastern Peruvian Amazon? Environ. Pollut. 2016, 218, 150–159. [Google Scholar] [CrossRef] [PubMed]
- Diringer, S.E. River transport of mercury from artisanal and small-scale gold mining and risks for dietary mercury exposure in Madre de Dios, Peru. Environ. Sci. 2015, 17, 478–487. [Google Scholar] [CrossRef]
- Lino, A.S.; Kasper, D.; Guida, Y.S.; Thomaz, J.R.; Malm, O. Total and methyl mercury distribution in water, sediment, plankton and fish along the Tapajós River basin in the Brazilian Amazon. Chemosphere 2019, 235, 690–700. [Google Scholar] [CrossRef] [PubMed]
- Niane, B.; Guédron, S.; Feder, F.; Legros, S.; Ngom, P.M.; Moritz, R. Impact of recent artisanal small-scale gold mining in Senegal: Mercury and methylmercury contamination of terrestrial and aquatic ecosystems. Sci. Total Environ. 2019, 669, 185–193. [Google Scholar] [CrossRef]
- Telmer, K.; Costa, M.; Angélica, R.S.; Araujo, E.S.; Maurice, Y. The source and fate of sediment and mercury in the Tapajós River, Pará, Brazilian Amazon: Ground- and space-based evidence. J. Environ. Manag. 2006, 81, 101–113. [Google Scholar] [CrossRef] [PubMed]
- Maurice-Bourgoin, L.; Quemerais, B.; Moreira-Turcq, P.; Seyler, P. Transport, distribution and speciation of mercury in the Amazon River at the confluence of black and white waters of the Negro and Solimões Rivers. Hydrol. Process. 2003, 17, 1405–1417. [Google Scholar] [CrossRef]
- Roulet, M.; Lucotte, M.; Canuel, R.; Rheault, I.; Tran, S.; Gog, Y.G.D.F.; Farella, N.; do Vale, R.S.; Passos, C.J.S.; da Silva, E.D.J.; et al. Distribution and partition of total mercury in waters of the Tapajós River Basin, Brazilian Amazon. Sci. Total Environ. 1998, 213, 203–211. [Google Scholar] [CrossRef]
- Gallay, M.; Martinez, J.-M.; Allo, S.; Mora, A.; Cochonneau, G.; Gardel, A.; Doudou, J.-C.; Sarrazin, M.; Chow-Toun, F.; Laraque, A. Impact of land degradation from mining activities on the sediment fluxes in two large rivers of French Guiana. L. Degrad. Dev. 2018, 29, 4323–4336. [Google Scholar] [CrossRef]
- Roulet, M.; Lucotte, M.; Saint-Aubin, A.; Tran, S.; Rhéault, I.; Farella, N.; Da Silva, E.D.J.; Dezencourt, J.; Passos, C.J.S.; Soares, G.S.; et al. The geochemistery of mercury in central Amazonian soils developed on the Alter-do-Chao formation of the lower Tapajos River Vally, Para state, Brazil. J. Sci. Total Environ. 1998, 223, 1–24. [Google Scholar] [CrossRef]
- Roulet, M.; Lucotte, M.; Canuel, R.; Farella, N.; Goch, Y.G.D.F.; Peleja, J.R.P.; Guimarães, J.R.D.; Mergler, D.; Amorim, M. Spatio-temporal geochemistry of mercury in waters of the Tapajós and Amazon rivers, Brazil. Limno. Oceanogr. 2001, 46, 1141–1157. [Google Scholar] [CrossRef]
- Kirk, J.T.O. Light and Photosynthesis in Aquatic Ecosystems; Cambridge University Press: Cambridge, UK, 1994; p. 524. [Google Scholar] [CrossRef]
- Pfannkuche, J.; Schmidt, A. Determination of suspended particulate matter concentration from turbidity measurements: Particle size effects and calibration procedures. Hydrol. Process. 2003, 17, 1951–1963. [Google Scholar] [CrossRef]
- Coquery, M.; Cossa, D.; Azemard, S.; Peretyazhko, T.; Charlet, L. Methylmercury formation in the anoxic waters of the Petit-Saut reservoir (French Guiana) and its spreading in the adjacent Sinnamary River. J. Phys. IV Fr. 2003, 107, 327–331. [Google Scholar] [CrossRef]
Publisher’s Note: MDPI stays neutral with regard to jurisdictional claims in published maps and institutional affiliations. |
© 2020 by the authors. Licensee MDPI, Basel, Switzerland. This article is an open access article distributed under the terms and conditions of the Creative Commons Attribution (CC BY) license (http://creativecommons.org/licenses/by/4.0/).