Article

Experimental and Numerical Investigation of Solar Panels Deployment with Tape Spring Hinges Having Nonlinear Hysteresis with Friction Compensation

1
Department of Mechanical Engineering, Jeonbuk National University, 567 Baekje-daero, Deokjin-gu, Jeonju-si, Jeollabuk-do 54896, Korea
2
Satellite Mechanical and Control Team, Korea Aerospace Research Institute, Daejeon 305–806, Korea
*
Author to whom correspondence should be addressed.
Appl. Sci. 2020, 10(21), 7902; https://doi.org/10.3390/app10217902
Submission received: 8 October 2020 / Revised: 31 October 2020 / Accepted: 3 November 2020 / Published: 7 November 2020
(This article belongs to the Special Issue Modeling, Design, and Optimization of Flexible Mechanical Systems)

Abstract

:
In this work, experimental and numerical investigation on the deployment of solar panels with tape spring (TS) hinges showing complex nonlinear hysteresis behavior caused by the snap-through buckling was conducted. Subsequently, it was verified by comparing simulation results by multi-body dynamics (MBD) analysis with test results on ground-based deployment testing considering gravity compensation, termed zero-gravity (Zero-G) device. It has been difficult to predict the folding and unfolding behavior of TS hinges because their moment–rotation relationship showed a nonlinear hysteresis behavior. To realize this attribute, an algorithm that checks the sign of angular velocity of the revolute joints was used to distinguish folding from unfolding. The nonlinear hysteresis was implemented in terms of two path-dependent nonlinear moment–rotation curves with the aid of the expression function (a kind of user subroutine) in MBD software RecurDyn. Finally, it was found that the results of the deployment analysis were in excellent agreement with those of the test when the friction torques of the revolute joints were properly identified by an inverse analysis with the test frames, thus validating the MBD model.

Graphical Abstract

1. Introduction

Several appendages of satellites were stowed inside the launch vehicle (LV) fairing during the launch phase and has to be deployed in orbit using various deployment mechanisms [1,2,3,4]. If the deployment of appendages was not achieved successfully, this could have a critical impact on the mission of satellites. Therefore, deployment structures, such as satellite solar panels, SAR antennas, and antenna booms, should be verified through ground-based deployment tests and analyzed to determine whether they can be deployed in space orbit successfully. The deployment schemes that have been employed so far released the clamping units to allow the stowed appendages to dynamically deploy and self-latch. However, it needs to be fully understood and optimized considering severe dynamic effects at the latching of deployment, which could damage the structure. Conversely, a slow and highly damped deployment may end without achieving the fully deployed configuration. Thus, balancing between these effects is challenging as noticed by the development process of the MARSIS booms of 20 m length [5,6] needing a large amount of testing and simulation.
As many deployment mechanisms [5,6,7,8,9,10,11,12,13,14,15,16,17,18,19], articulated spring (AS) hinges and tape spring (TS) hinges have been widely employed for solar panels and antennas in small satellites due to their simplicity and easy fabrication. Among those, AS hinges are a representative example of rigid hinges, composed of a torsional spring, a latch, and a stopper. The torsional spring stores strain energy during folding, and releases it for deployment operation. Its moment–rotation profile is very simple and almost linear elastic for entire rotation angles. The latch and stopper are used to maintain the deployment configuration and avoid the overshooting of deployment panels. Typically, AS hinges can realize high deployment stiffness; thus, they are suitable as deployment devices for satellites requiring high agility. However, at the moment of latching, its coupling parts come into contact with each other for stopping and latching. Therefore, high latching forces are generated, which require proper compensation.
TS hinges are a representative example of flexible hinges. They consist of curved short strip tape springs and a hinge bracket, as shown in Figure 1, the moment–rotation relationship of TS is linearly elastic for small rotations but suddenly dropped at the critical rotation angle due to the snap-through buckling. After that, the torque is almost constant for large rotations for forward rotation (see Figure 2). However, when the backward rotation is applied, it does not go back to the original moment–rotation profile obtained from the forward rotation. Its path-dependent moment–rotation profile generates high structural damping; thus, the impact energy at the latching dissipates, which leads to much smaller impact loads. In addition, it is well known that TS hinges have sufficient self-driving forces and self-locking function, which is simple in shape and reduces mass and manufacturing cost. To model such complex mechanisms of TS hinges, several approaches have been proposed, such as analytical methods [4], experimental methods [5] and finite-element methods [12,13,14]. Seffen et al. used both an analytical approach and finite-element (FE) analysis to investigate the relationship between the geometric parameters and the moment–rotation behavior of TS hinges [12,13]. Soykasap carried out a nonlinear FE analysis of TS hinges using an artificial damping method in ABAQUS software [14]. Walker et al. investigated the moment–rotation relationship when TS hinges were folded at some skew angle, also termed three-dimensional (3D) folding theoretically and experimentally [15,16]. Jung et al. employed a response surface method using the Box-Behnken method to describes the relationship between the geometric parameters of the TS hinges and the bending stiffness, deployment torque, and maximum folding stress [17]. Furthermore, to maximize the performance of TS hinges, optimizations with various design parameters were conducted with an experimentally validated physics-based model [18] and a multi-objective optimization [19].
In the case of boom application of TS hinges, due to extreme slenderness of appendages deployed, it is susceptible to lose structural stability subjected to various micro-vibration excitation. Thus, its inherent mechanisms of single TS (STS) according to the equal-sense bending and the opposite-sense bending was experimentally investigated (see Figure 2a) [20,21,22]. Besides, various numerical simulation of STS was conducted by an equivalent beam modeling [23] and nonlinear analysis by FE simulation [21,22,24,25].
Regarding the deployment performance of panels with TS hinge modeling, systematic optimization was conducted with constraints on the maximum latching forces, deployment time, and torque margin of the panels [26]. To make the correlation of deploying panels between test and analysis, the dynamic equation of the deploying solar arrays was derived and the motion was compared with the deployment test result of a Korean multi-purpose satellite (KOMPSAT-2) with multi-layer TS hinges (MLTS) (see Figure 2b). They found that there was some deviation due to the friction arising from the bungee cables of the Zero-G device [27,28]. To minimize the friction from the zero-G device, Moon et al. conducted a study on the development test device considering gravity compensation by air bearings to minimize friction [29], but still showed some deviation due to air-drag of large panels.
The goal of this work is to investigate and validate the deployment motion of solar panels of TS hinges showing nonlinear hysteresis behavior by multi-body dynamics (MBD) with deployment tests considering friction compensation. For the MBD simulation, we used a commercial MBD software, RecurDyn [30] which simplifies the process of deriving the dynamics equation of motion. It is noted that, as mentioned earlier, TS hinges showed a path-dependent moment–rotation profile according to folding and unfolding that were hardly tractable in MBD modeling and also a time-consuming job in FE simulation, which were realized by the expression function in RecurDyn. The expression function distinguished the folding from unfolding by the sign of angular velocity of the revolute joints, and it determined the stiffness according to the sign of angular velocity similar to approaches in the references [26,27,28].
For the validation of the MBD model, several deployment tests were performed on the Zero-G device that simulates the space orbit environment by compensating gravity effect. However, even in the Zero-G device, when appendages were deployed or stowed, friction forces at the joints arising from the test set-up such as fine misalignment, and air resistance were unavoidable. To make a nice correlation between test and analysis, such effects have to be identified and properly compensated. Therefore, in this work, these frictions were substituted with the equivalent friction torques (EFTs) of the revolute joints, which were obtained by inverse analysis of simulation results referring to test results for the first 2 s and then it was applied to the MBD model for model validation.
To the best of our knowledge, this kind of integrated approach, including the modeling of TS hinges, deployment testing of panels on the Zero-G device, and simulation and validation with friction compensation, has rarely tried before due to complexity of this work despite its importance in the relevant industry. Furthermore, a commercial MBD software was adopted to reduce the burden of modeling, making modeling process efficient for relevant engineers.
The remainder of this paper is organized as follows. In Section 2, several mechanical characteristics of TS hinges, and measurement methods of the moment-rotation relationship of TS hinges with the MBD modeling strategy are discussed. In Section 3, the configuration of the deployment test on the Zero-G device considering gravity compensation is presented. In Section 4, the EFTs are inversely derived through a correlation of rotation angle history for the first 2 s, and they are reverified by torque margin evaluation. Finally, we close this paper with concluding remarks.

2. Experimental Investigation of Tape Spring Hinges

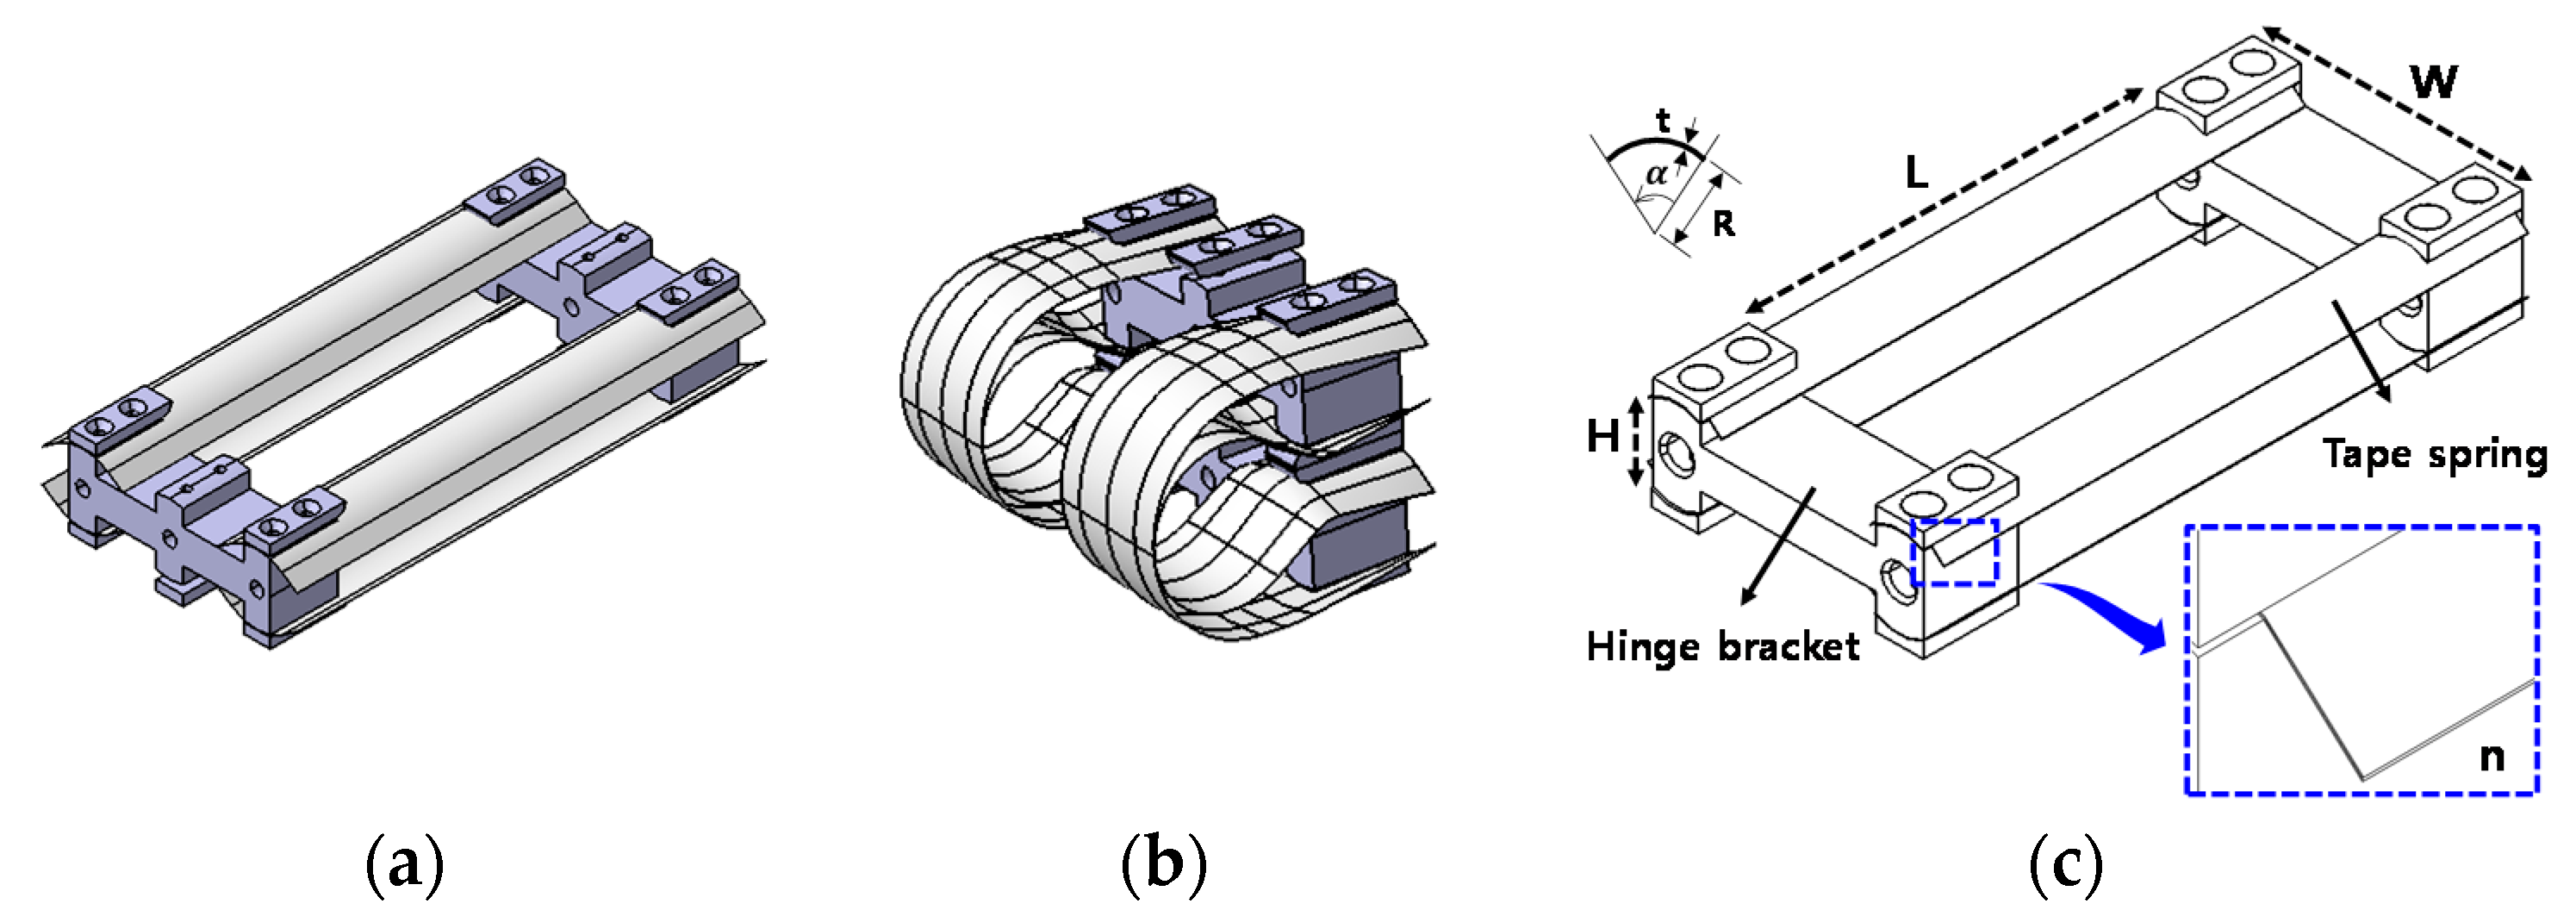
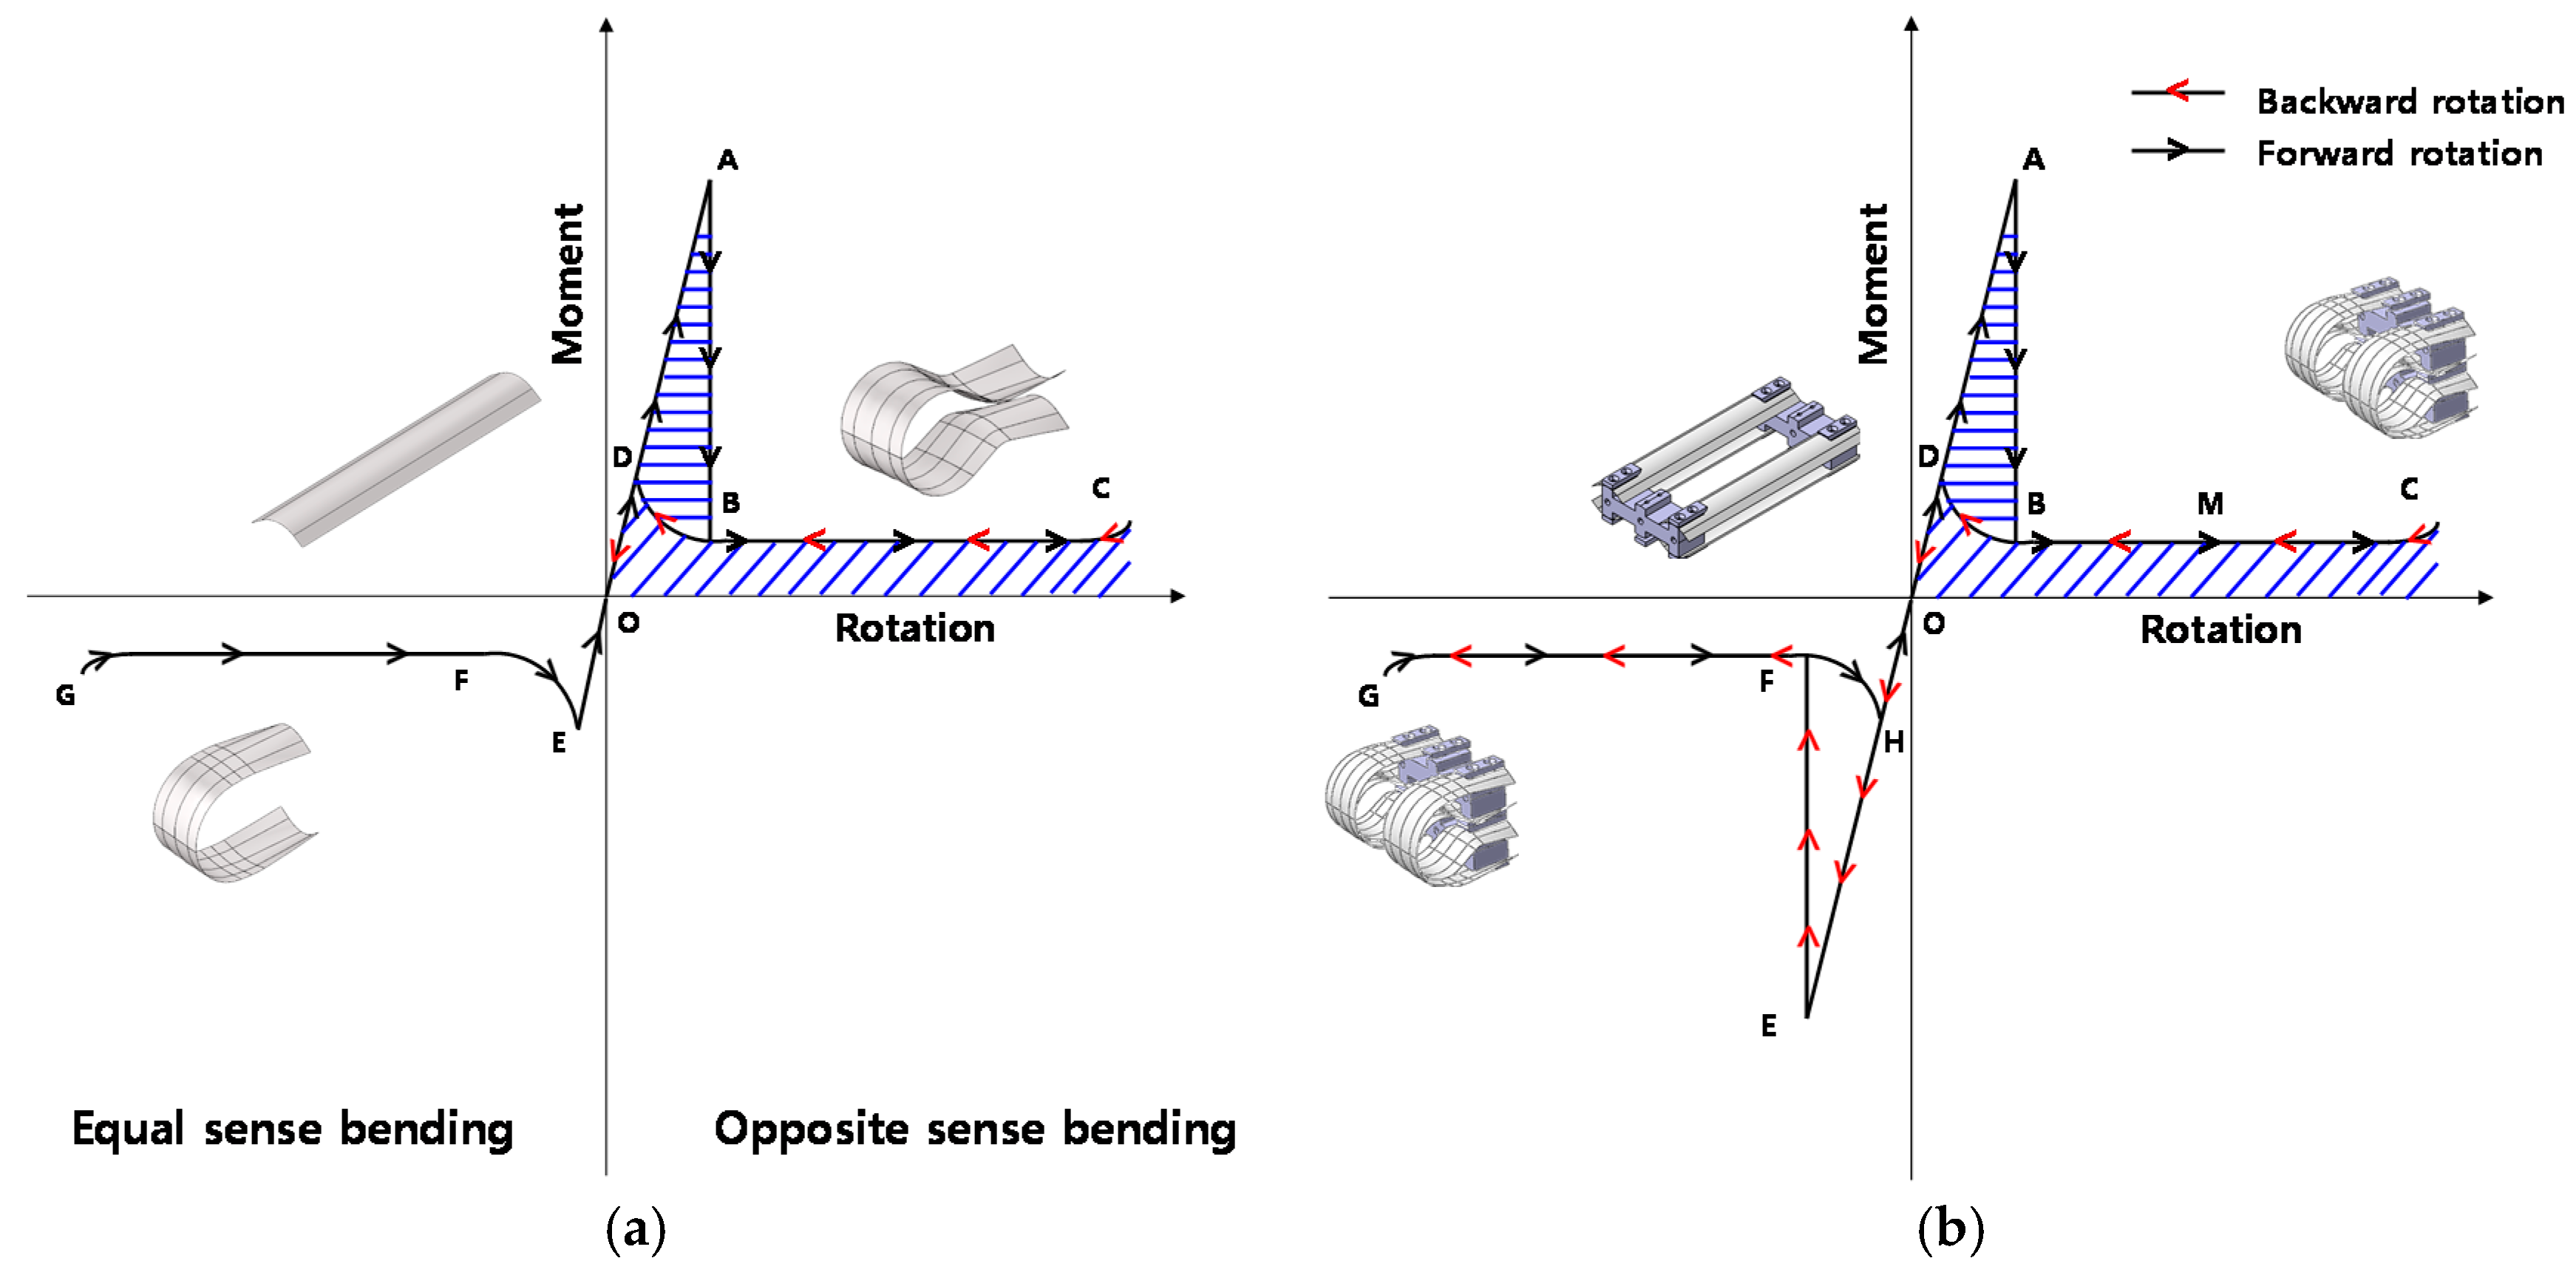
2.1. Moment-Rotation Profile of TS Hinges

As mentioned previously, the TS hinge is a flexible hinge having nonlinear hysteresis behavior according to folding and unfolding, which stores strain energy during folding to release it to unfold the appendages of satellites. A conventional moment–rotation profile of TS hinges is plotted in Figure 2. Typically, single TS showed a different moment–rotation behavior according to equal-sense bending and opposite-sense bending (see Figure 2a). However, single or multi-layer TS hinges showed the same moment–rotation behavior according to the positive and negative torque. In this work, we limit our attention to the MLTS.
The moment–rotation of TS is linearly elastic for small rotations, but the moment is almost constant for large rotations for positive torque. At the end of the linear elastic range, this TS suddenly buckles due to the snap-through buckling, thus making the stiffness dramatically lowered (A→B). Accordingly, the moment path is changed from O → A → B → C while it is folded to store the strain energy. Then, it is released to go back to O state through a different path of C → B → D → O by dissipating some of the stored energy surrounded by the area connecting A, B, and D. The moment–rotation profile of TS hinges can be tailored according to the number of tape layers (n), height (H), length (L), width (W) of tape springs, and radius (R), thickness (t) and subtended angle ( α ) of the tape springs as shown in Figure 1c.

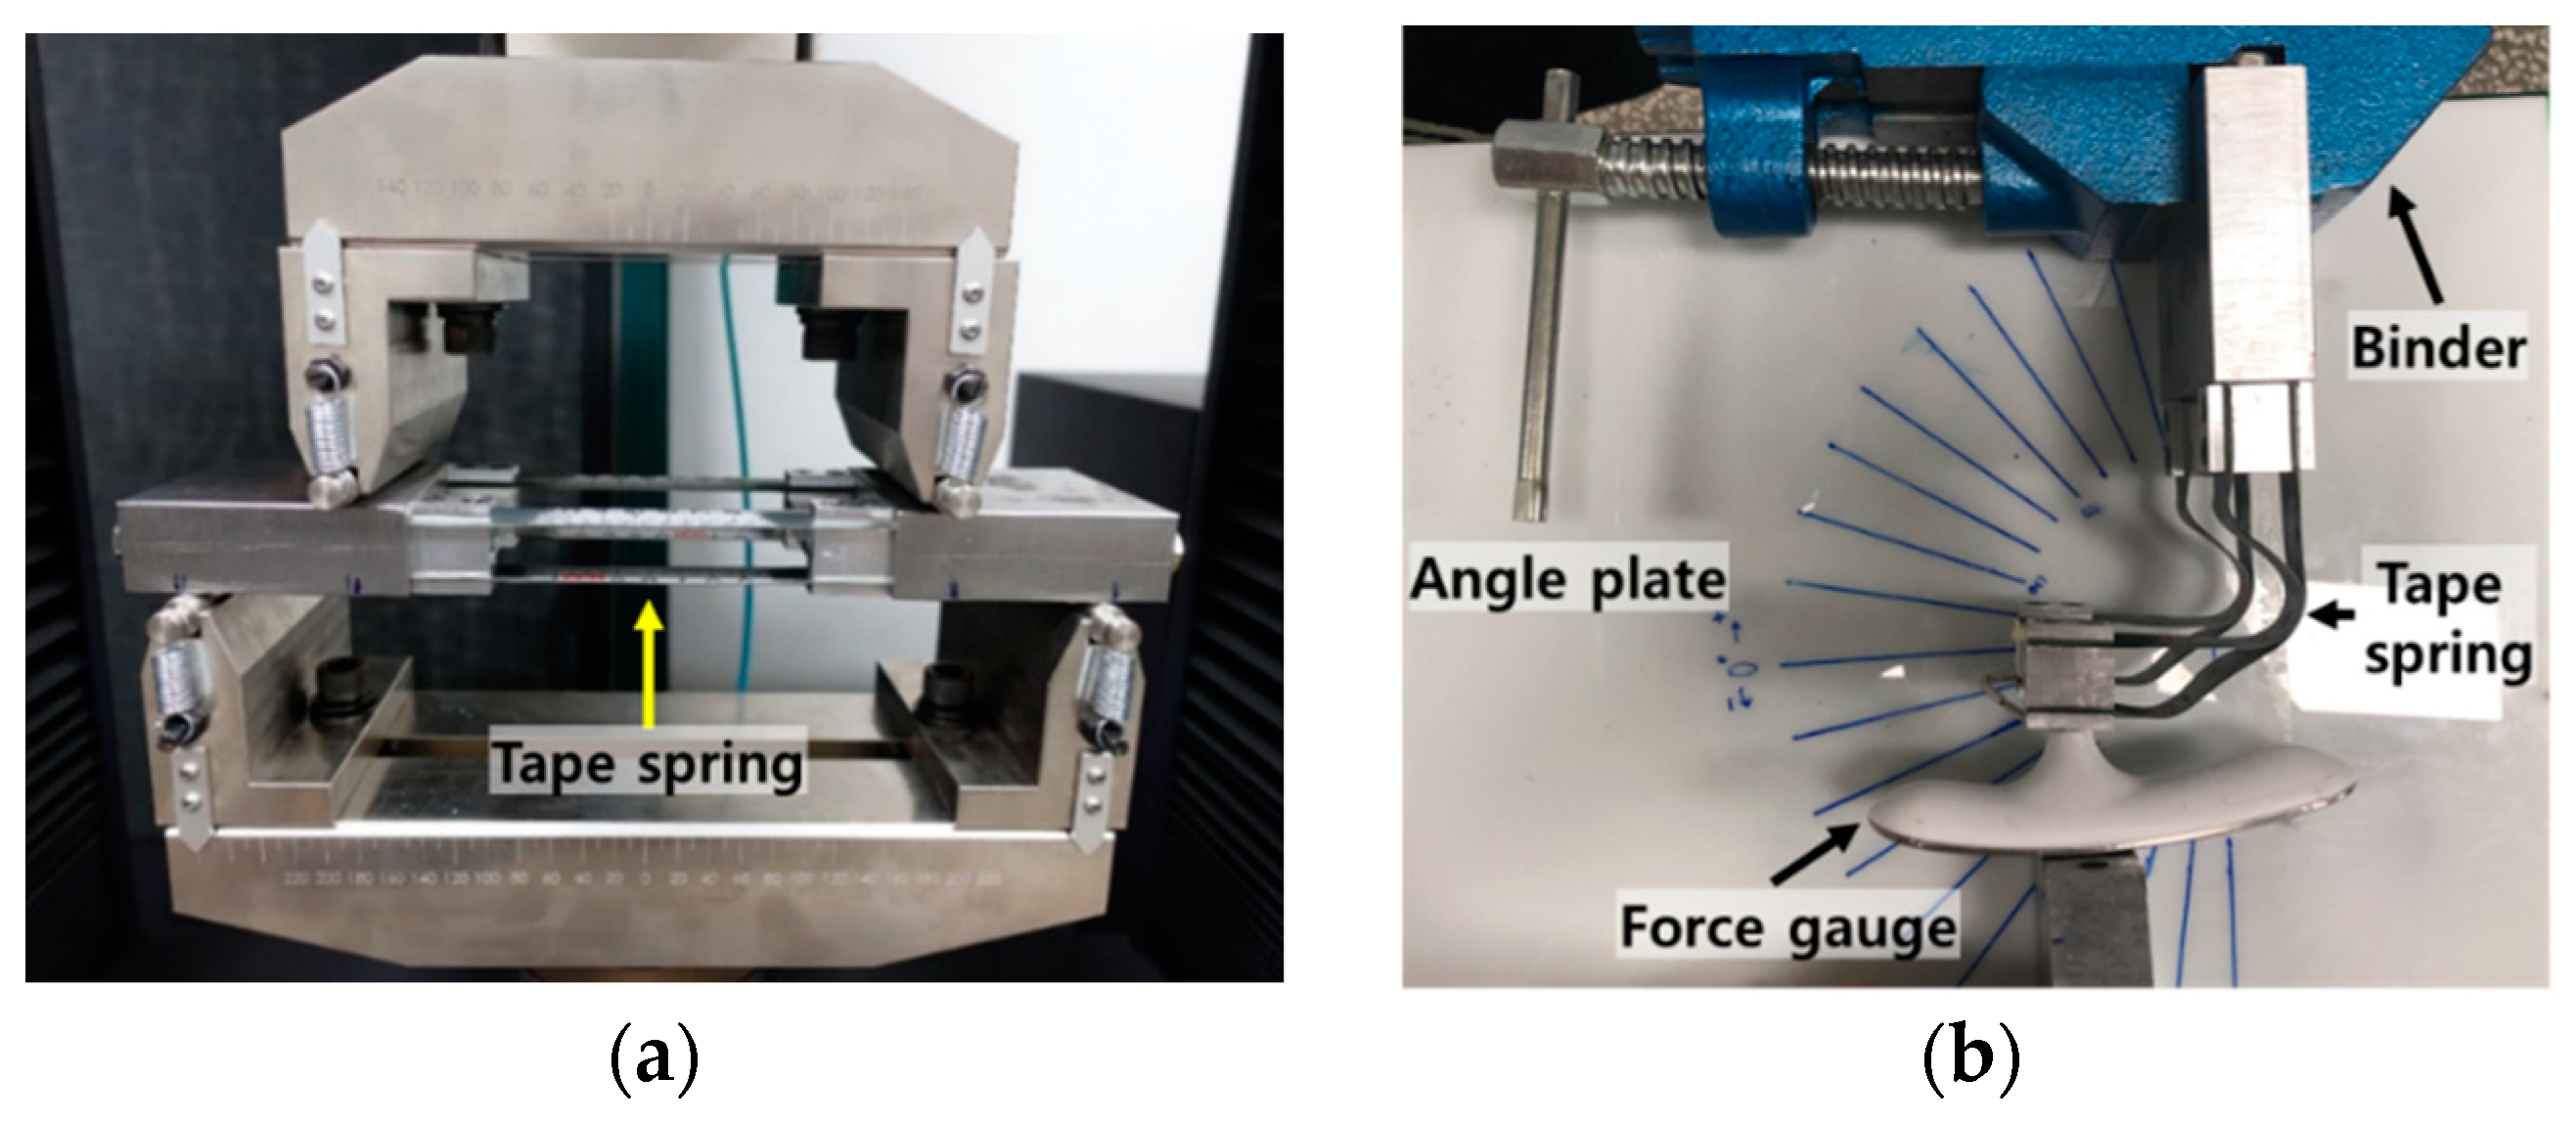
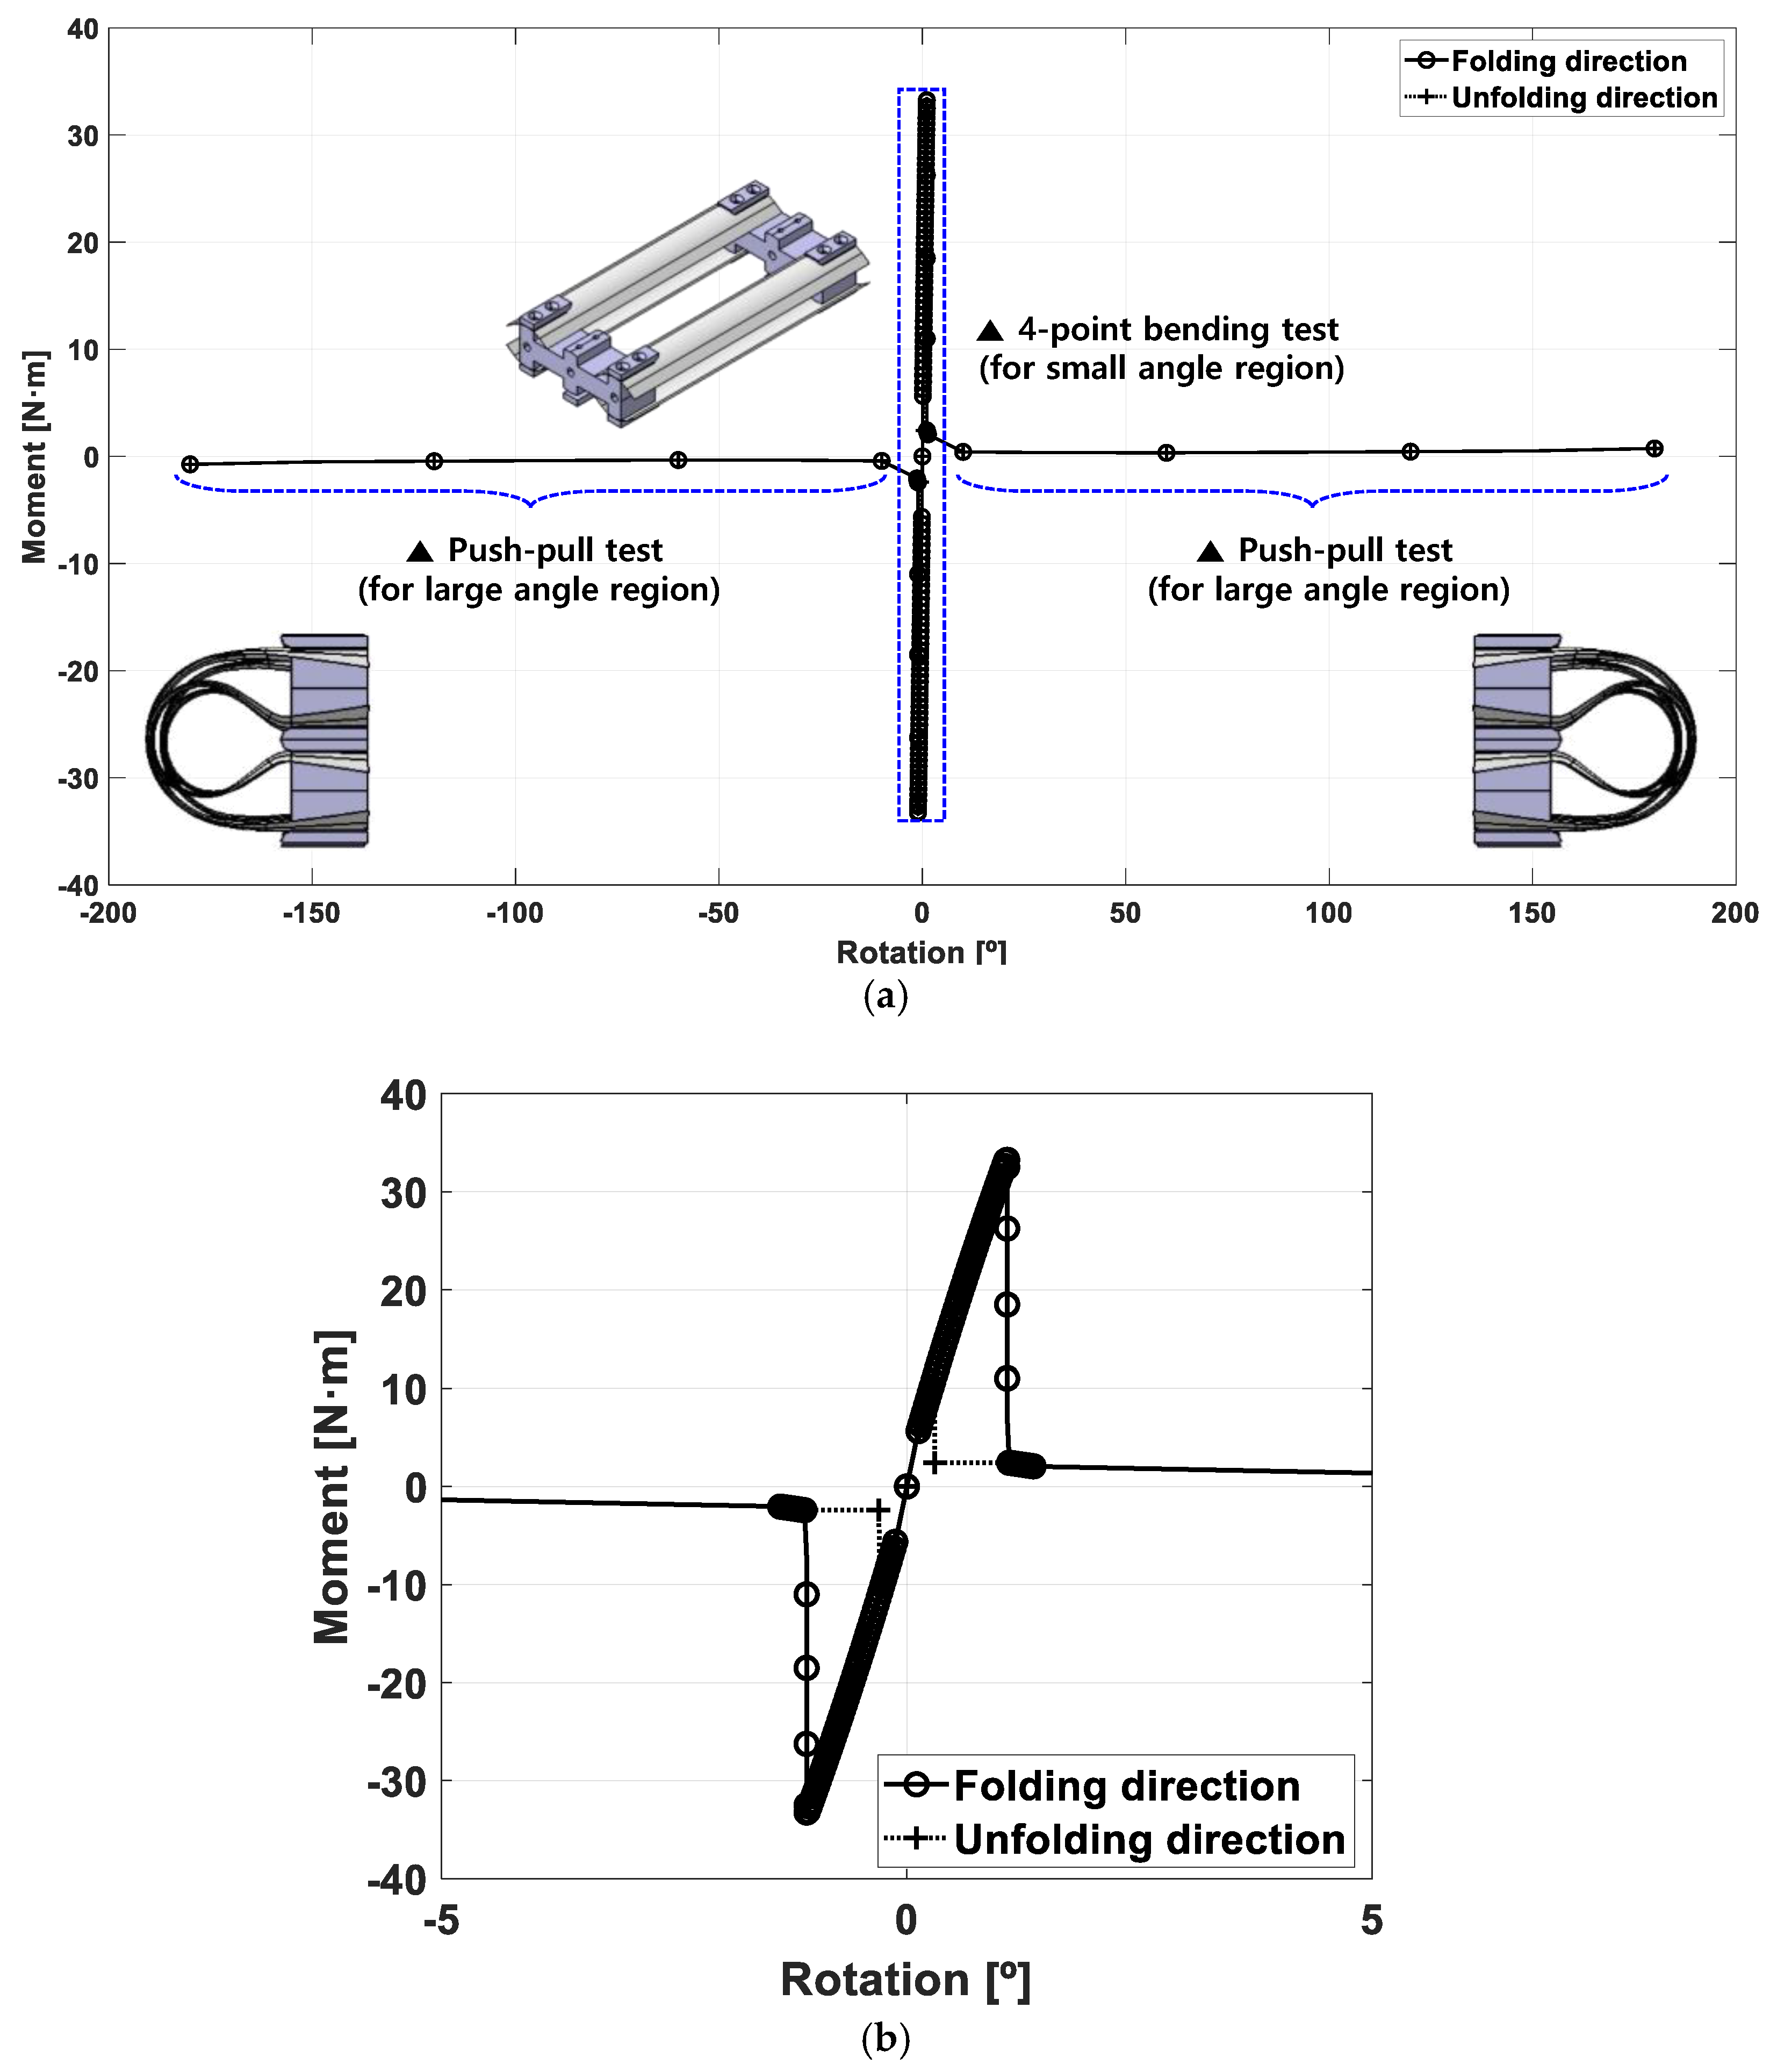
2.2. Measurement of the Moment–Rotation Relationship of TS Hinges

To obtain the moment–rotation profile for all rotation angles, we use a hybrid measurement by a four-point bending test for small rotation angles and a push-pull test for large rotation angles. In the case of a small-angle region less than 2°, a moment–rotation profile was measured by the four-point bending test with careful and fine control of the applied forces because the snap-through buckling suddenly initiated as shown in Figure 3a. Once the load-displacement curve was taken from the four-point bending test, the corresponding torque and rotation angle was determined by solving a problem subjected to the same four-point loads based on the elementary beam theory. In the case of rotation angles larger than 2°, it was measured through a push-pull test conducted using an angle plate, a force gauge, and a binder as shown in Figure 3b. In the push-pull test, one end of the TS hinge was fixed, and the other end was pulled vertically by hand with the force gauge. The torque was computed by multiplying the measured force by the moment arm (61.5 mm), and the rotation angle was determined with the reference values on the angle plate. The measurement results of the moment–rotation profile for all rotation angles are shown in Figure 4 through a combination of two test results.

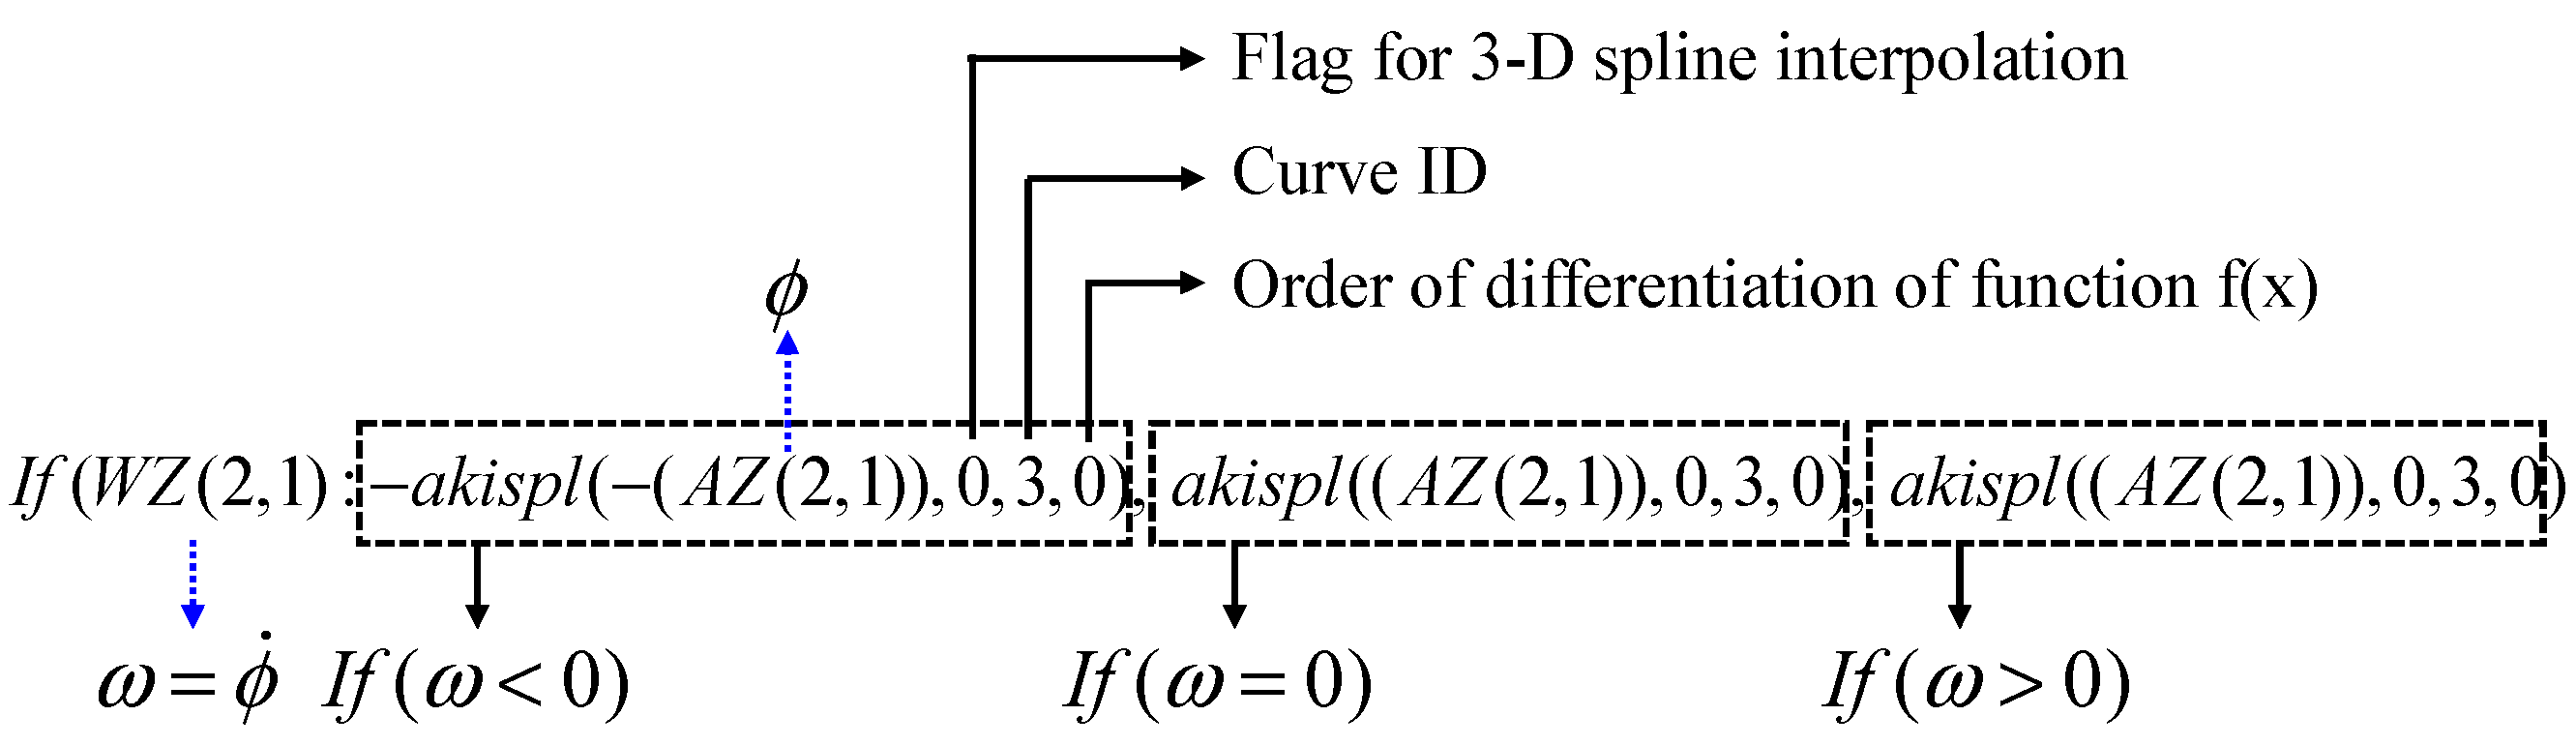
2.3. Implementation of Characteristics of TS Hinges

Nonlinear and path-dependent torsional spring stiffness of the TS hinges was realized by applying the expression function (a kind of user-subroutine) in RecurDyn. The nonlinear spring stiffness was simply implemented with the Akima spline function [31], which is a continuously differentiable sub-spline interpolation built from piecewise third-order polynomials. Only data from the neighboring points are used to determine the coefficients of the polynomial. The path-dependent behavior was identified according to the sign of angular velocity to check the status from folding and unfolding as
T = { f u n c ( ϕ )     ( ω < 0 ) f u n c ( ϕ )     ( ω 0 ) ,
where ϕ , ω are the given rotation angle and angular velocity, respectively; T is the corresponding torque according to ϕ ; and f u n c ( ϕ ) indicates a function interpolating the measurement result of the moment–rotation according to ϕ in Figure 5. This relationship is implemented by the expression function as
Where W Z and A Z are the angular velocity and rotation angle of hinges in RecurDyn, respectively; and a k i s p l indicates the Akima spline function. The first number and the second number in the parentheses of W Z and A Z indicates the action marker and the base marker of the reference coordinates, respectively.

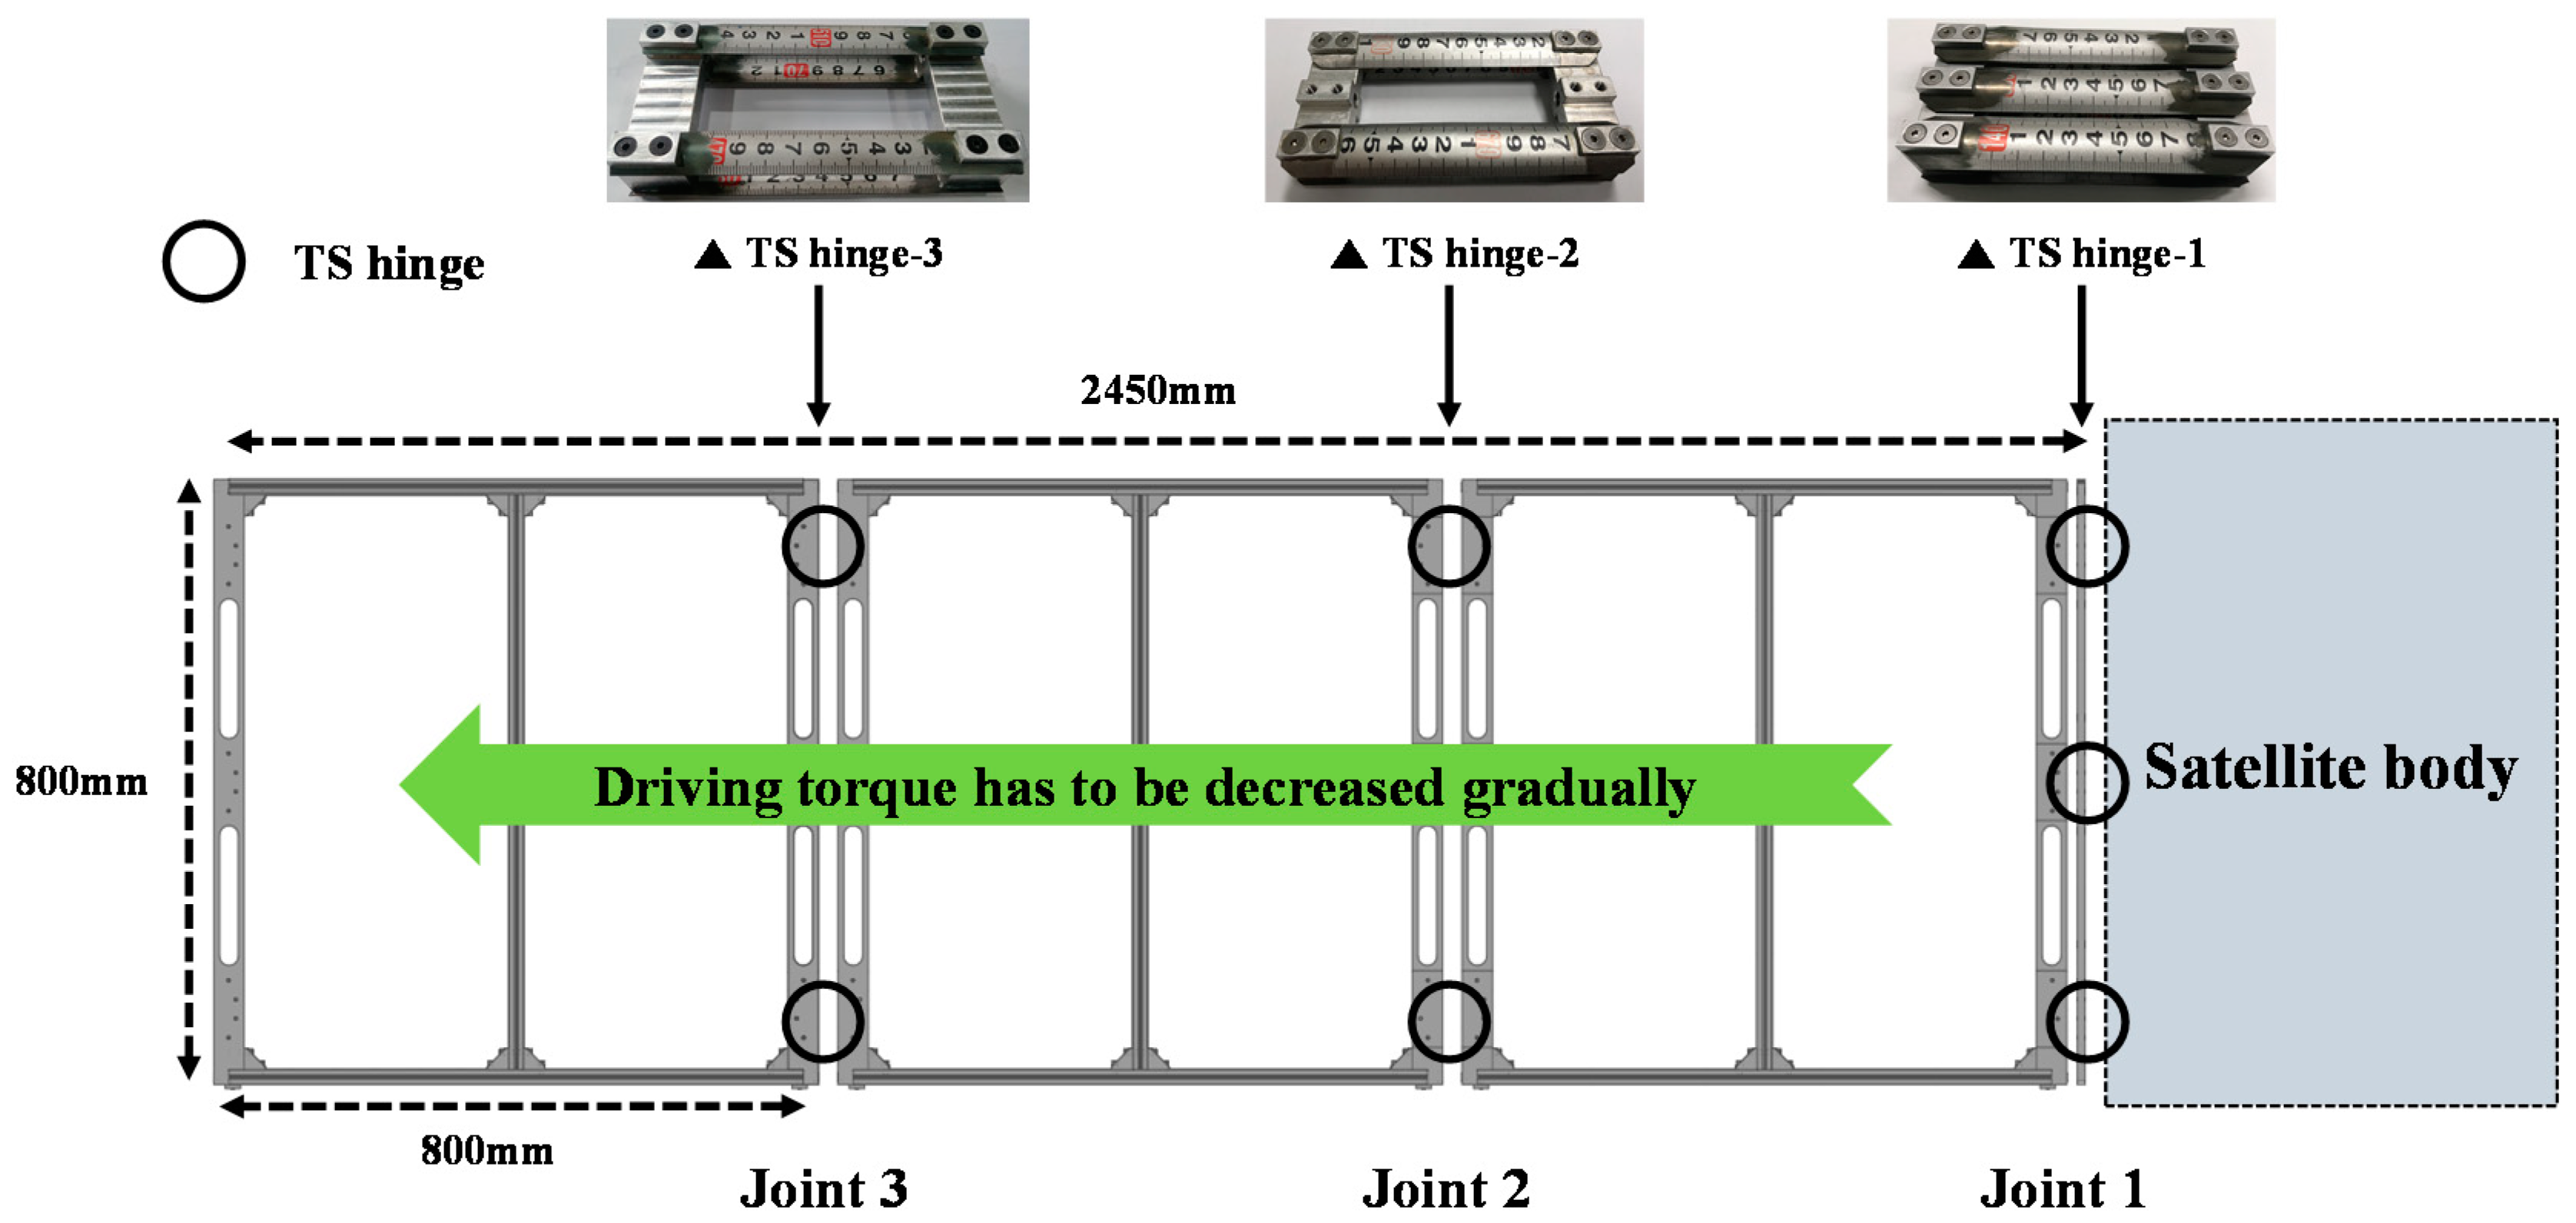
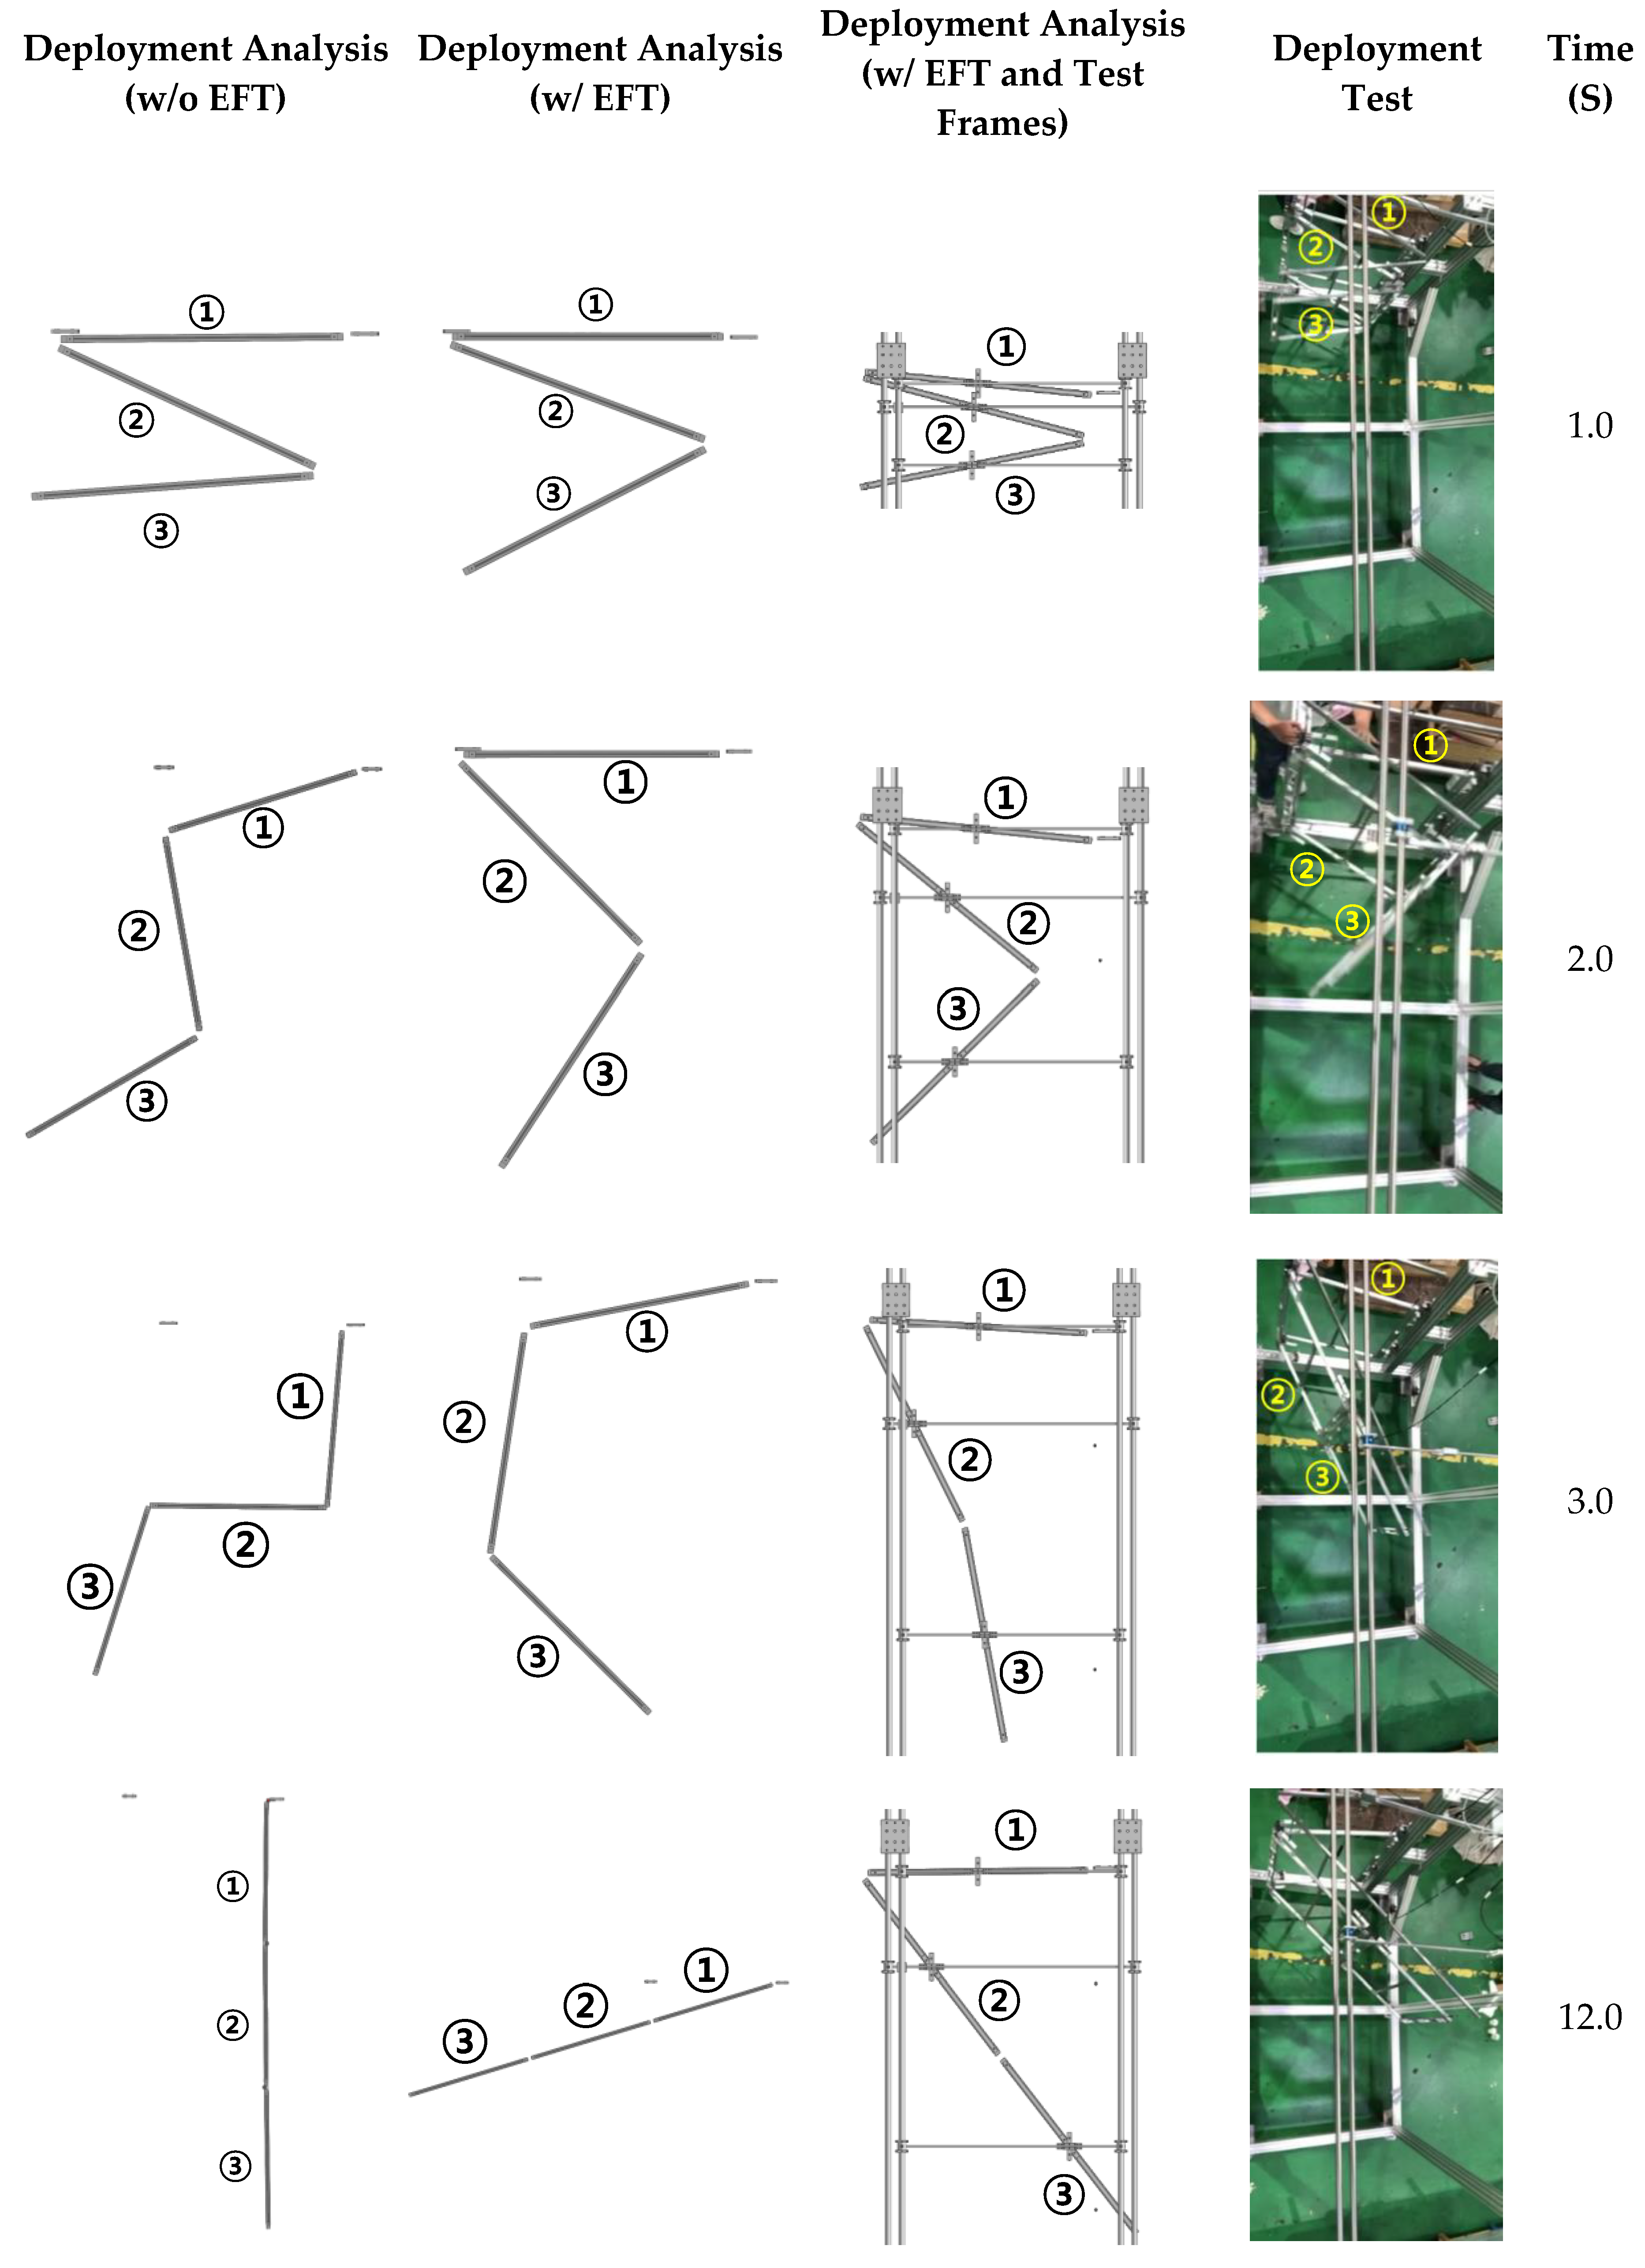
3. Deployment Test of Panels

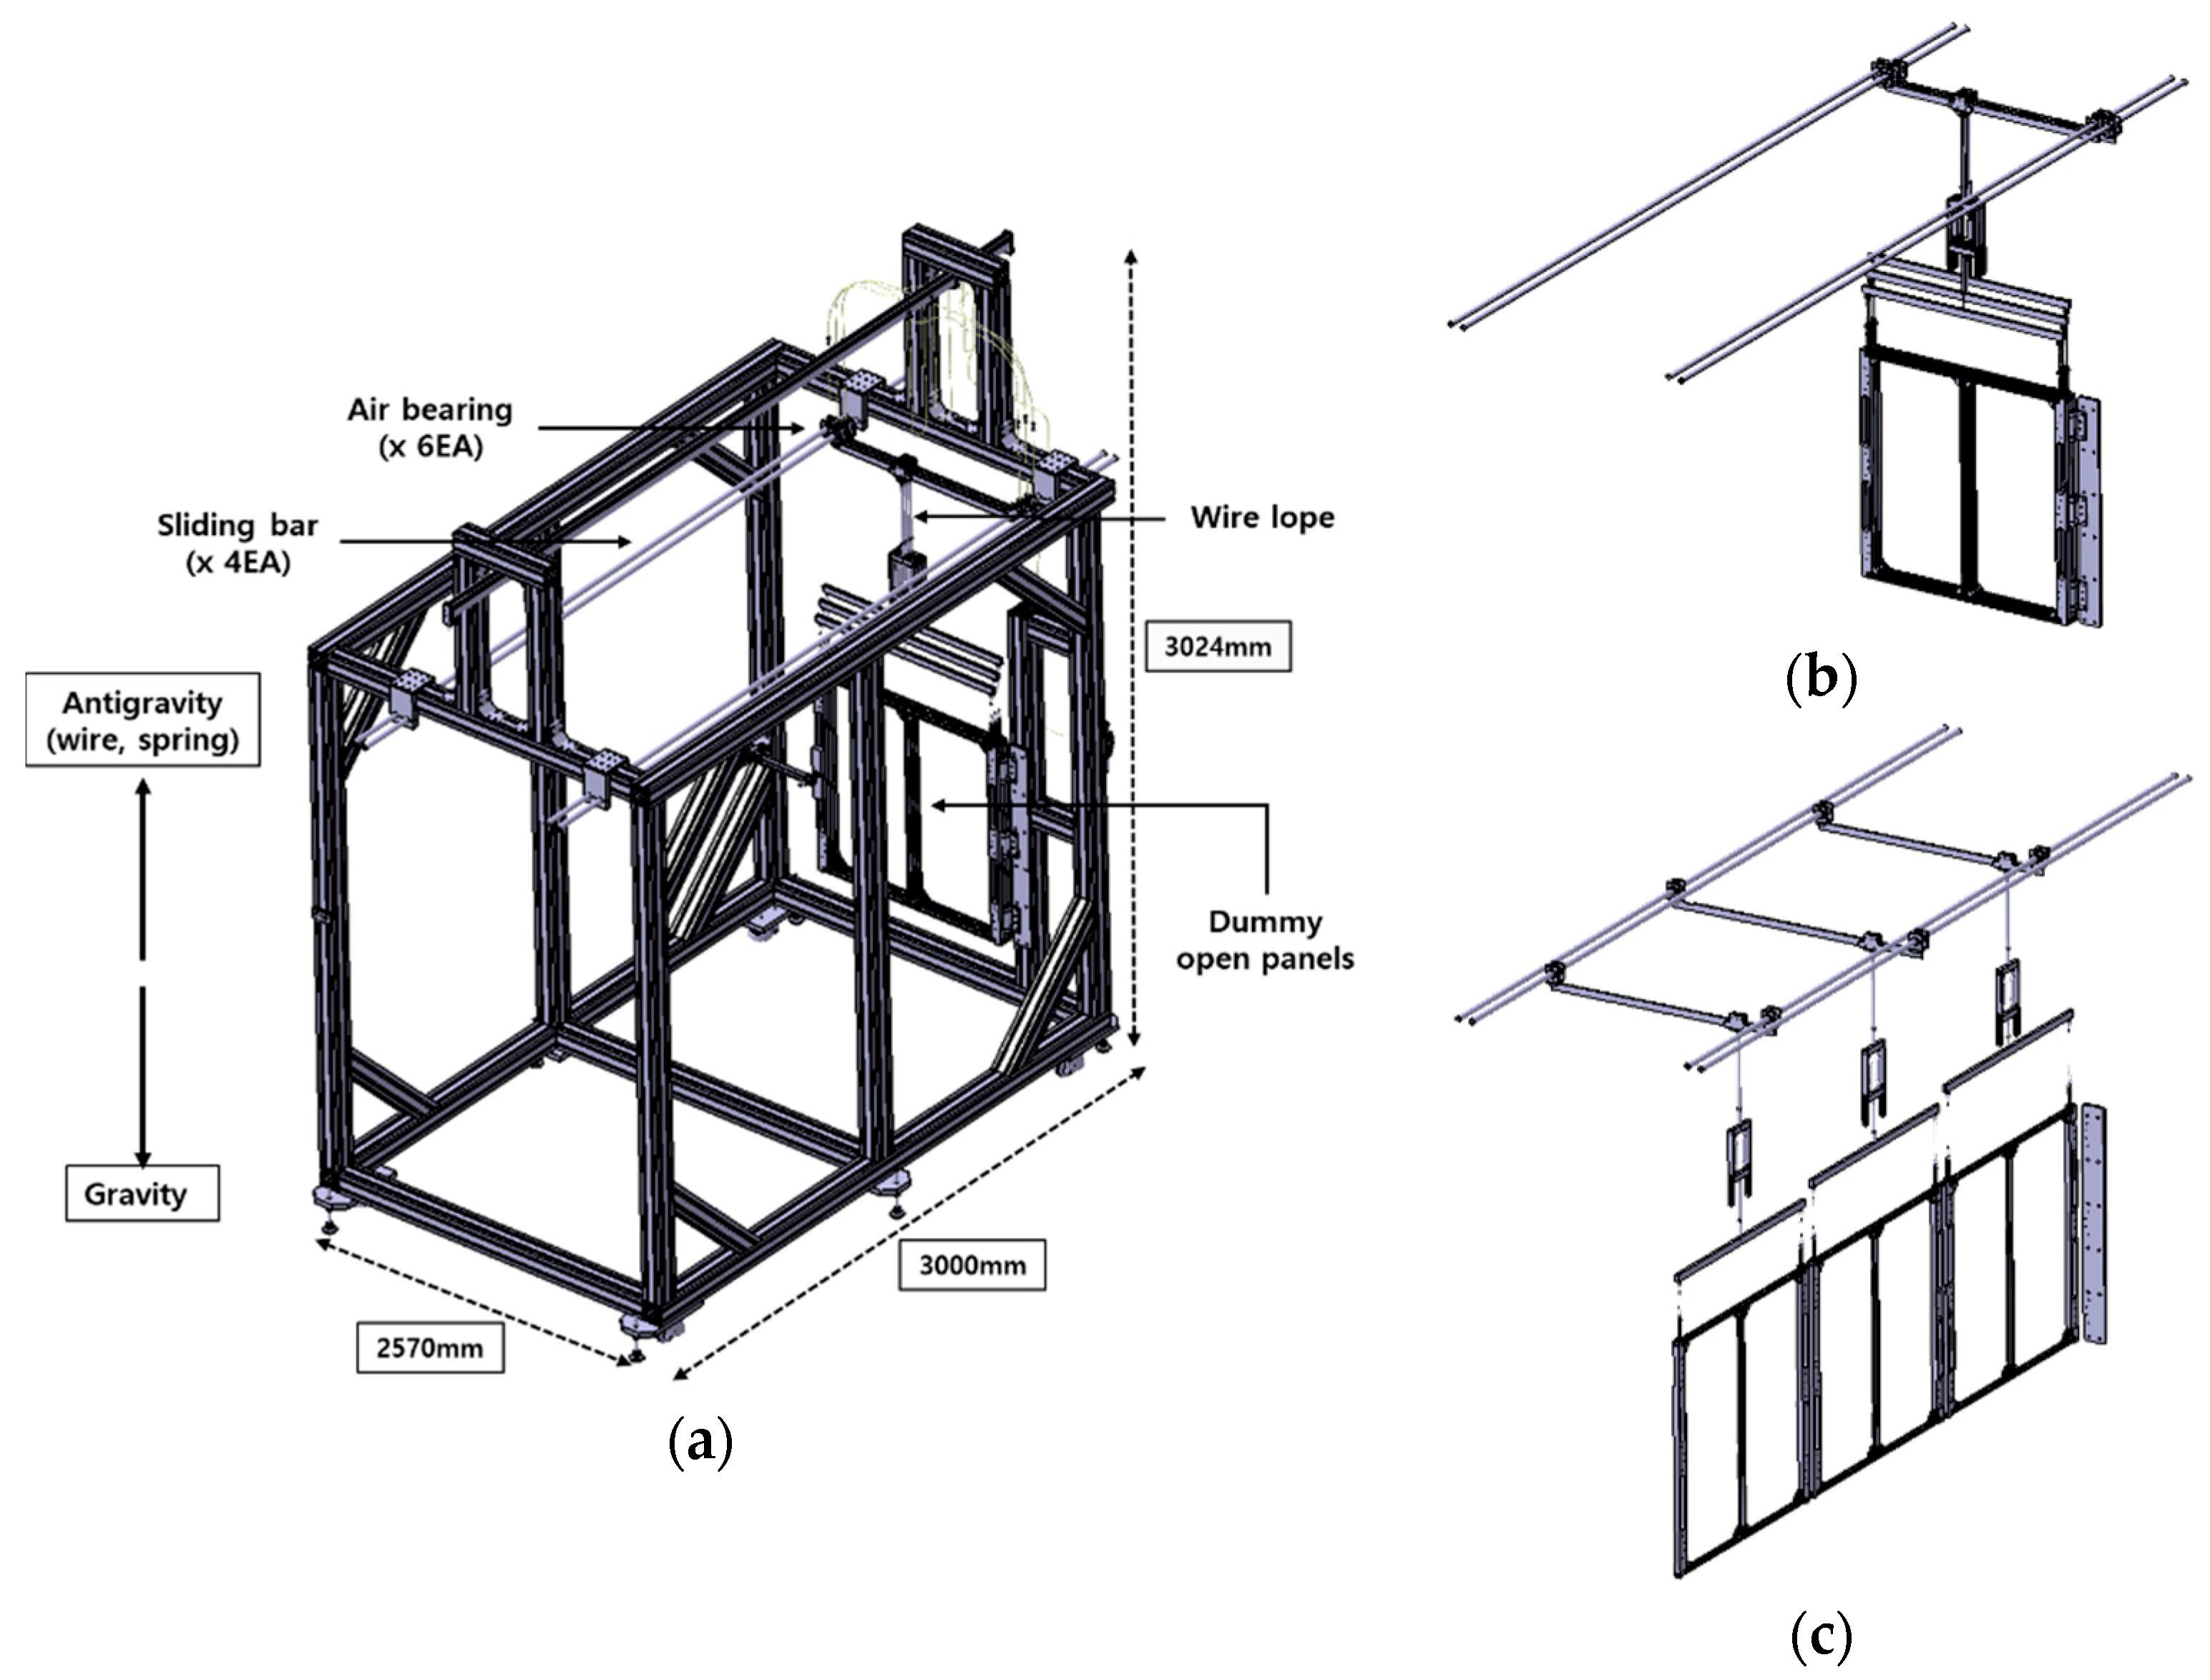
3.1. Test Setup with Zero-G Device

The deployment test was conducted with Zero-G device, which compensates the effect of gravity by hanging test articles with bungee cables with frictionless air bearings similar to other works [27,28,29]. Deployment testing of panels on the ground is routinely required to assure deployment success in space orbit for many space missions. One of the most critical factors of ground-based testing is the realization of zero gravity equal to space. Figure 6 shows the Zero-G device consisting of vertical and lateral frames, two sliding bars with air-bearings, and a dummy wing comprised of three open rectangular panels to minimize the effect of air-drag. The size of each dummy panel was 800 mm × 800 mm, and the total mass of the three panels made of aluminum 6061 was 10.5 kg. To minimize the friction caused by deflection of the sliding bars during the deployment test, wire cables coupled with springs and air-bearings were installed. Besides, if the deployment test device was tilted or was not straight horizontally or vertically, the test device had to be leveled before the deployment test to avoid undesirable friction. To minimize such concern, a two-axis digital leveler [32] was utilized to adjust all possible misalignment angles of the frames less than 0.1°. The stowed and deployed configurations of the panels in the deployment test device are shown in Figure 6b,c. To record the motion of panels during deployment, a motion capture camera of OQUS500 [33] was installed at the ceiling of the test facility.
For the deployment test, three types of TS hinges were prepared to check the deployment performance with five peak values of the moment-rotation profile: A, B, C, D, and M (see Figure 2b) summarized in Table 1. The moment and rotation behavior of all hinges were measured three times, respectively. For simulation, averages were taken over the measured data. The bracket parts of the TS hinges were made of aluminum 6061, and the TS hinges were fabricated by the tape measures of the KMC-27S product of the KOMELON company [34], but it had two types of the radius (R), thickness (t) and subtended angles ( α ): (11.5 mm, 0.08 mm, and 55°) and (13 mm, 0.13 mm and 70°).

3.2. Test Cases

The deployment test consists of two test cases: one normal case (T01) and one worst case (T02) as in Table 2. The normal case was determined by considering the case that the driving torque of hinges gradually decreases as moved away from the satellite body such as 3.6 Nm (3 × 1.20) for hinge-1, 2.92 Nm (2 × 1.46) for hinge-2, and 1.48 Nm (2 × 0.74) for hinge-3 (see Figure 7). The worst case was simply determined from the case that does not meet this condition as 0.77 Nm (2 × 0.385), 2.92 Nm (2 × 1.46), and 1.48 Nm (2 × 0.74), respectively. To keep the same friction level caused by the misalignment for two tests, TS hinges were replaced one by one in the deployed configuration.

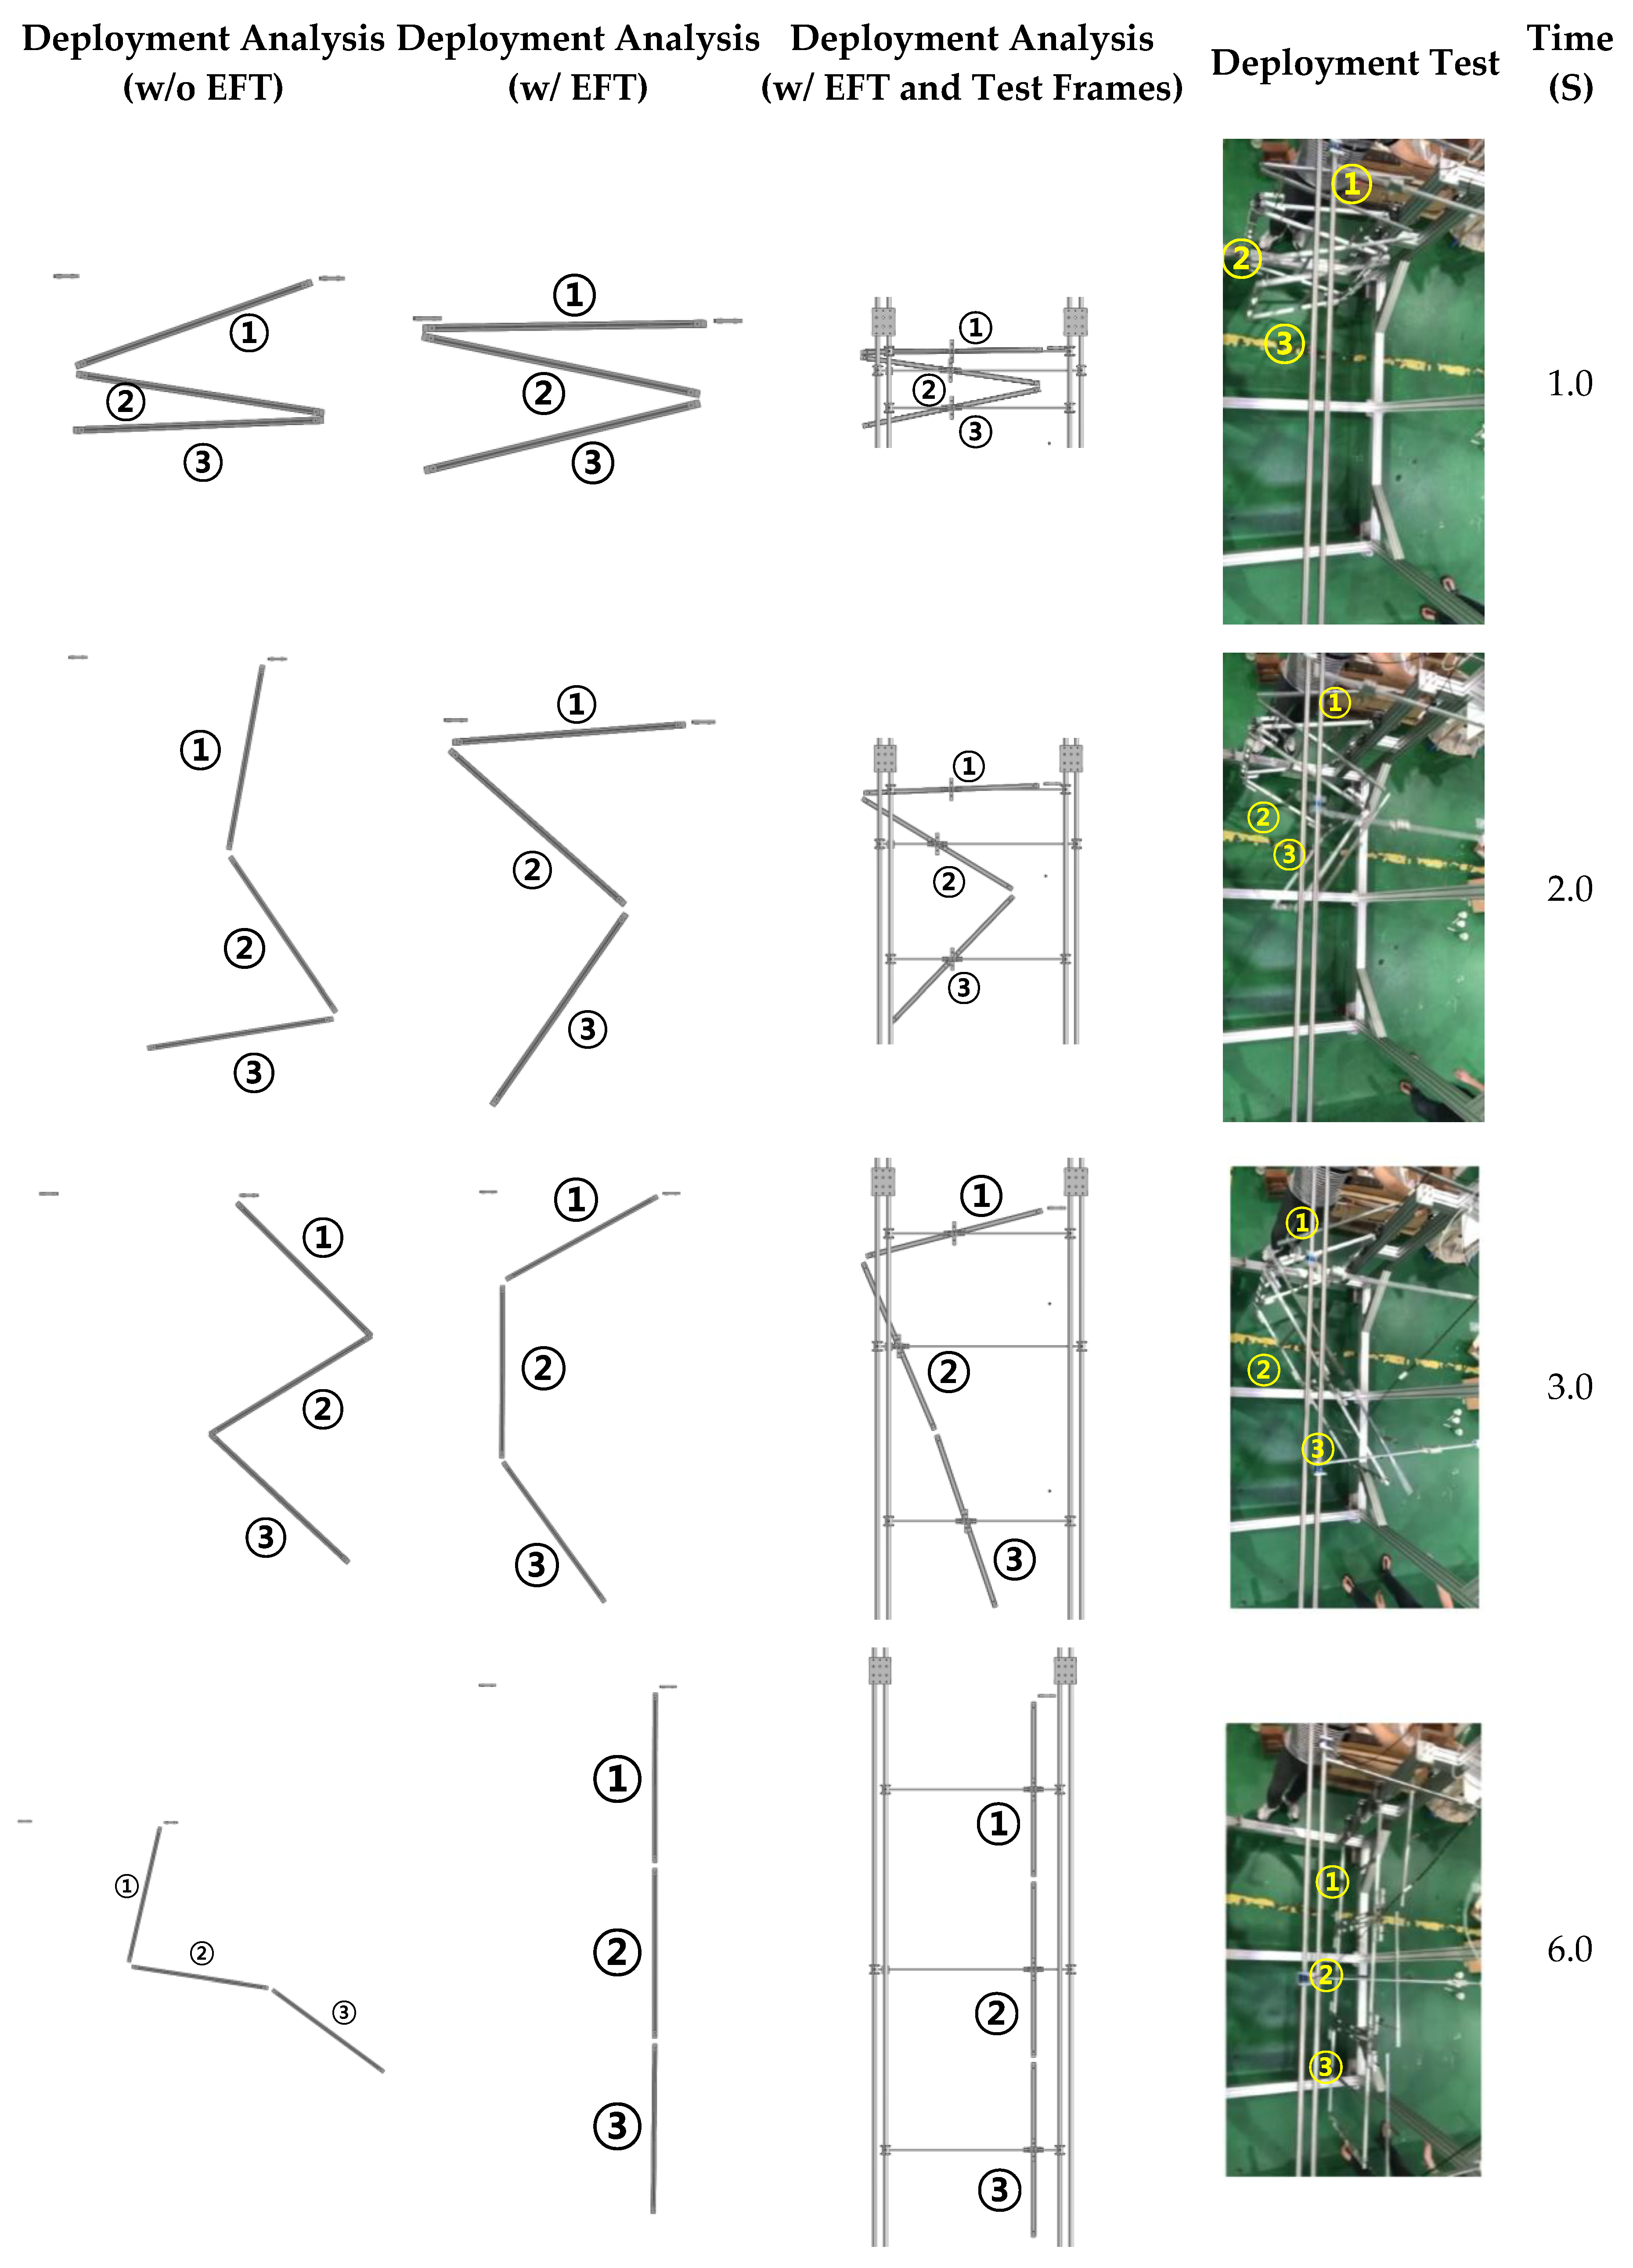
4. Results and Discussion

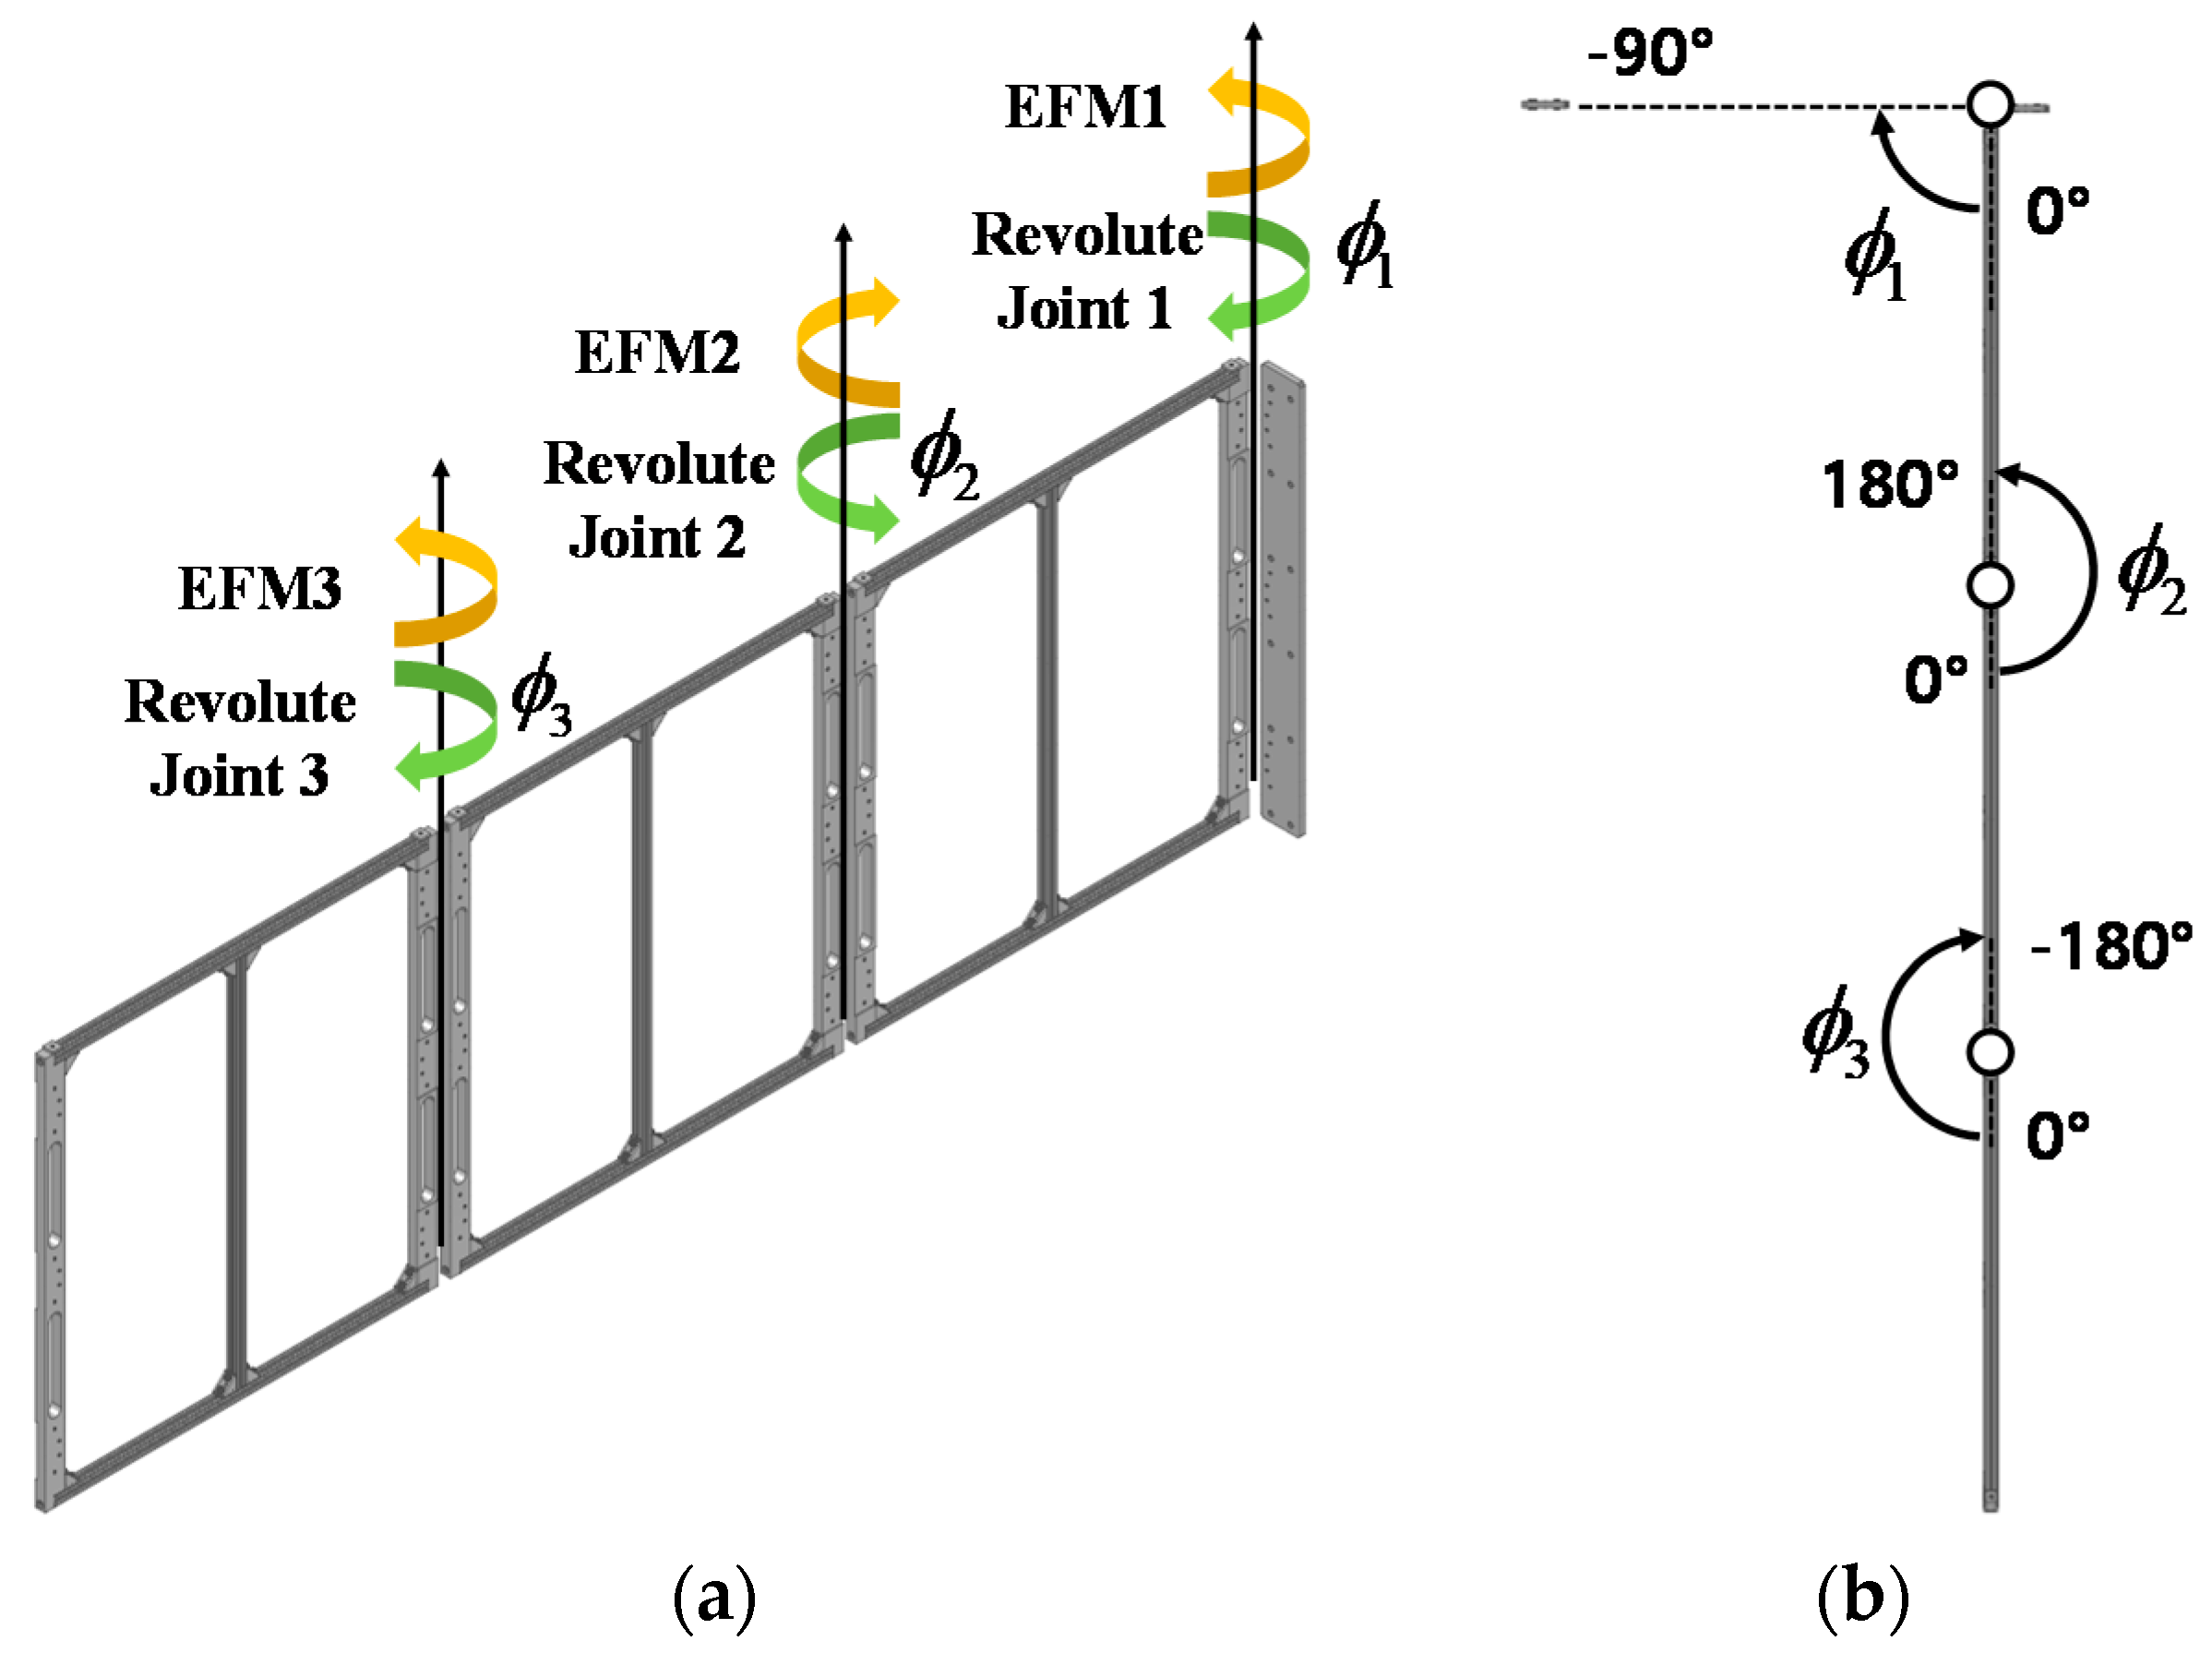
4.1. Multi-Body Dynamics Modeling of Solar Panels

For the deployment analysis with MBD model, RecurDyn V9R2 was used [30]. Overall configuration of panels was directly imported from a 3D CAD model. Its mass properties in terms of total mass, and mass moment of inertia were applied as in Table 3. TS hinges at the connection points between panels were modelled as a revolute joint with the rotational axial option in RecurDyn. The total degrees of freedom (DOF) of the MBD model were determined by the mobility formula of kinematics considering the number of rigid bodies and the type and number of joints as
S y s D O F   =   B o d y N u m   ×   6     J o i n t N u m   ×   C n s t N u m ,
where S y s D O F is the DOF of the entire system, B o d y N u m is the number of bodies, J o i n t N u m is the number of joints, and C n s t N u m is the number of DOFs to be constrained at the joint. Since the DOF of the entire body has six DOFs for each body, total DOFs of the entire system were determined by Equation (3) and Table 4. To avoid the over-constrained mechanism using a model with three rotational DOFs by applying one fixed joint and three revolute joints as
4 ( B o d y )   ×   6     [ 1 ( F i x e d )   ×   6   +   3 ( R e v o l u t e )   ×   5 ]   =   3 ,
where ϕ 1 , ϕ 2 , and ϕ 3 indicate the rotational DOF of each panel, respectively; and EFT1, EFT2, and EFT3 indicate the equivalent friction torque to be applied at each joint for the consideration of friction due to the misalignment of the Zero-G device as seen in Figure 8.
To give a driving force to deploy the dummy solar system in the stowed configuration, we set the initial rotation angles by ϕ 1 = −90°, ϕ 2 = 180°, and ϕ 3 = −180°, respectively as seen in Figure 8b.

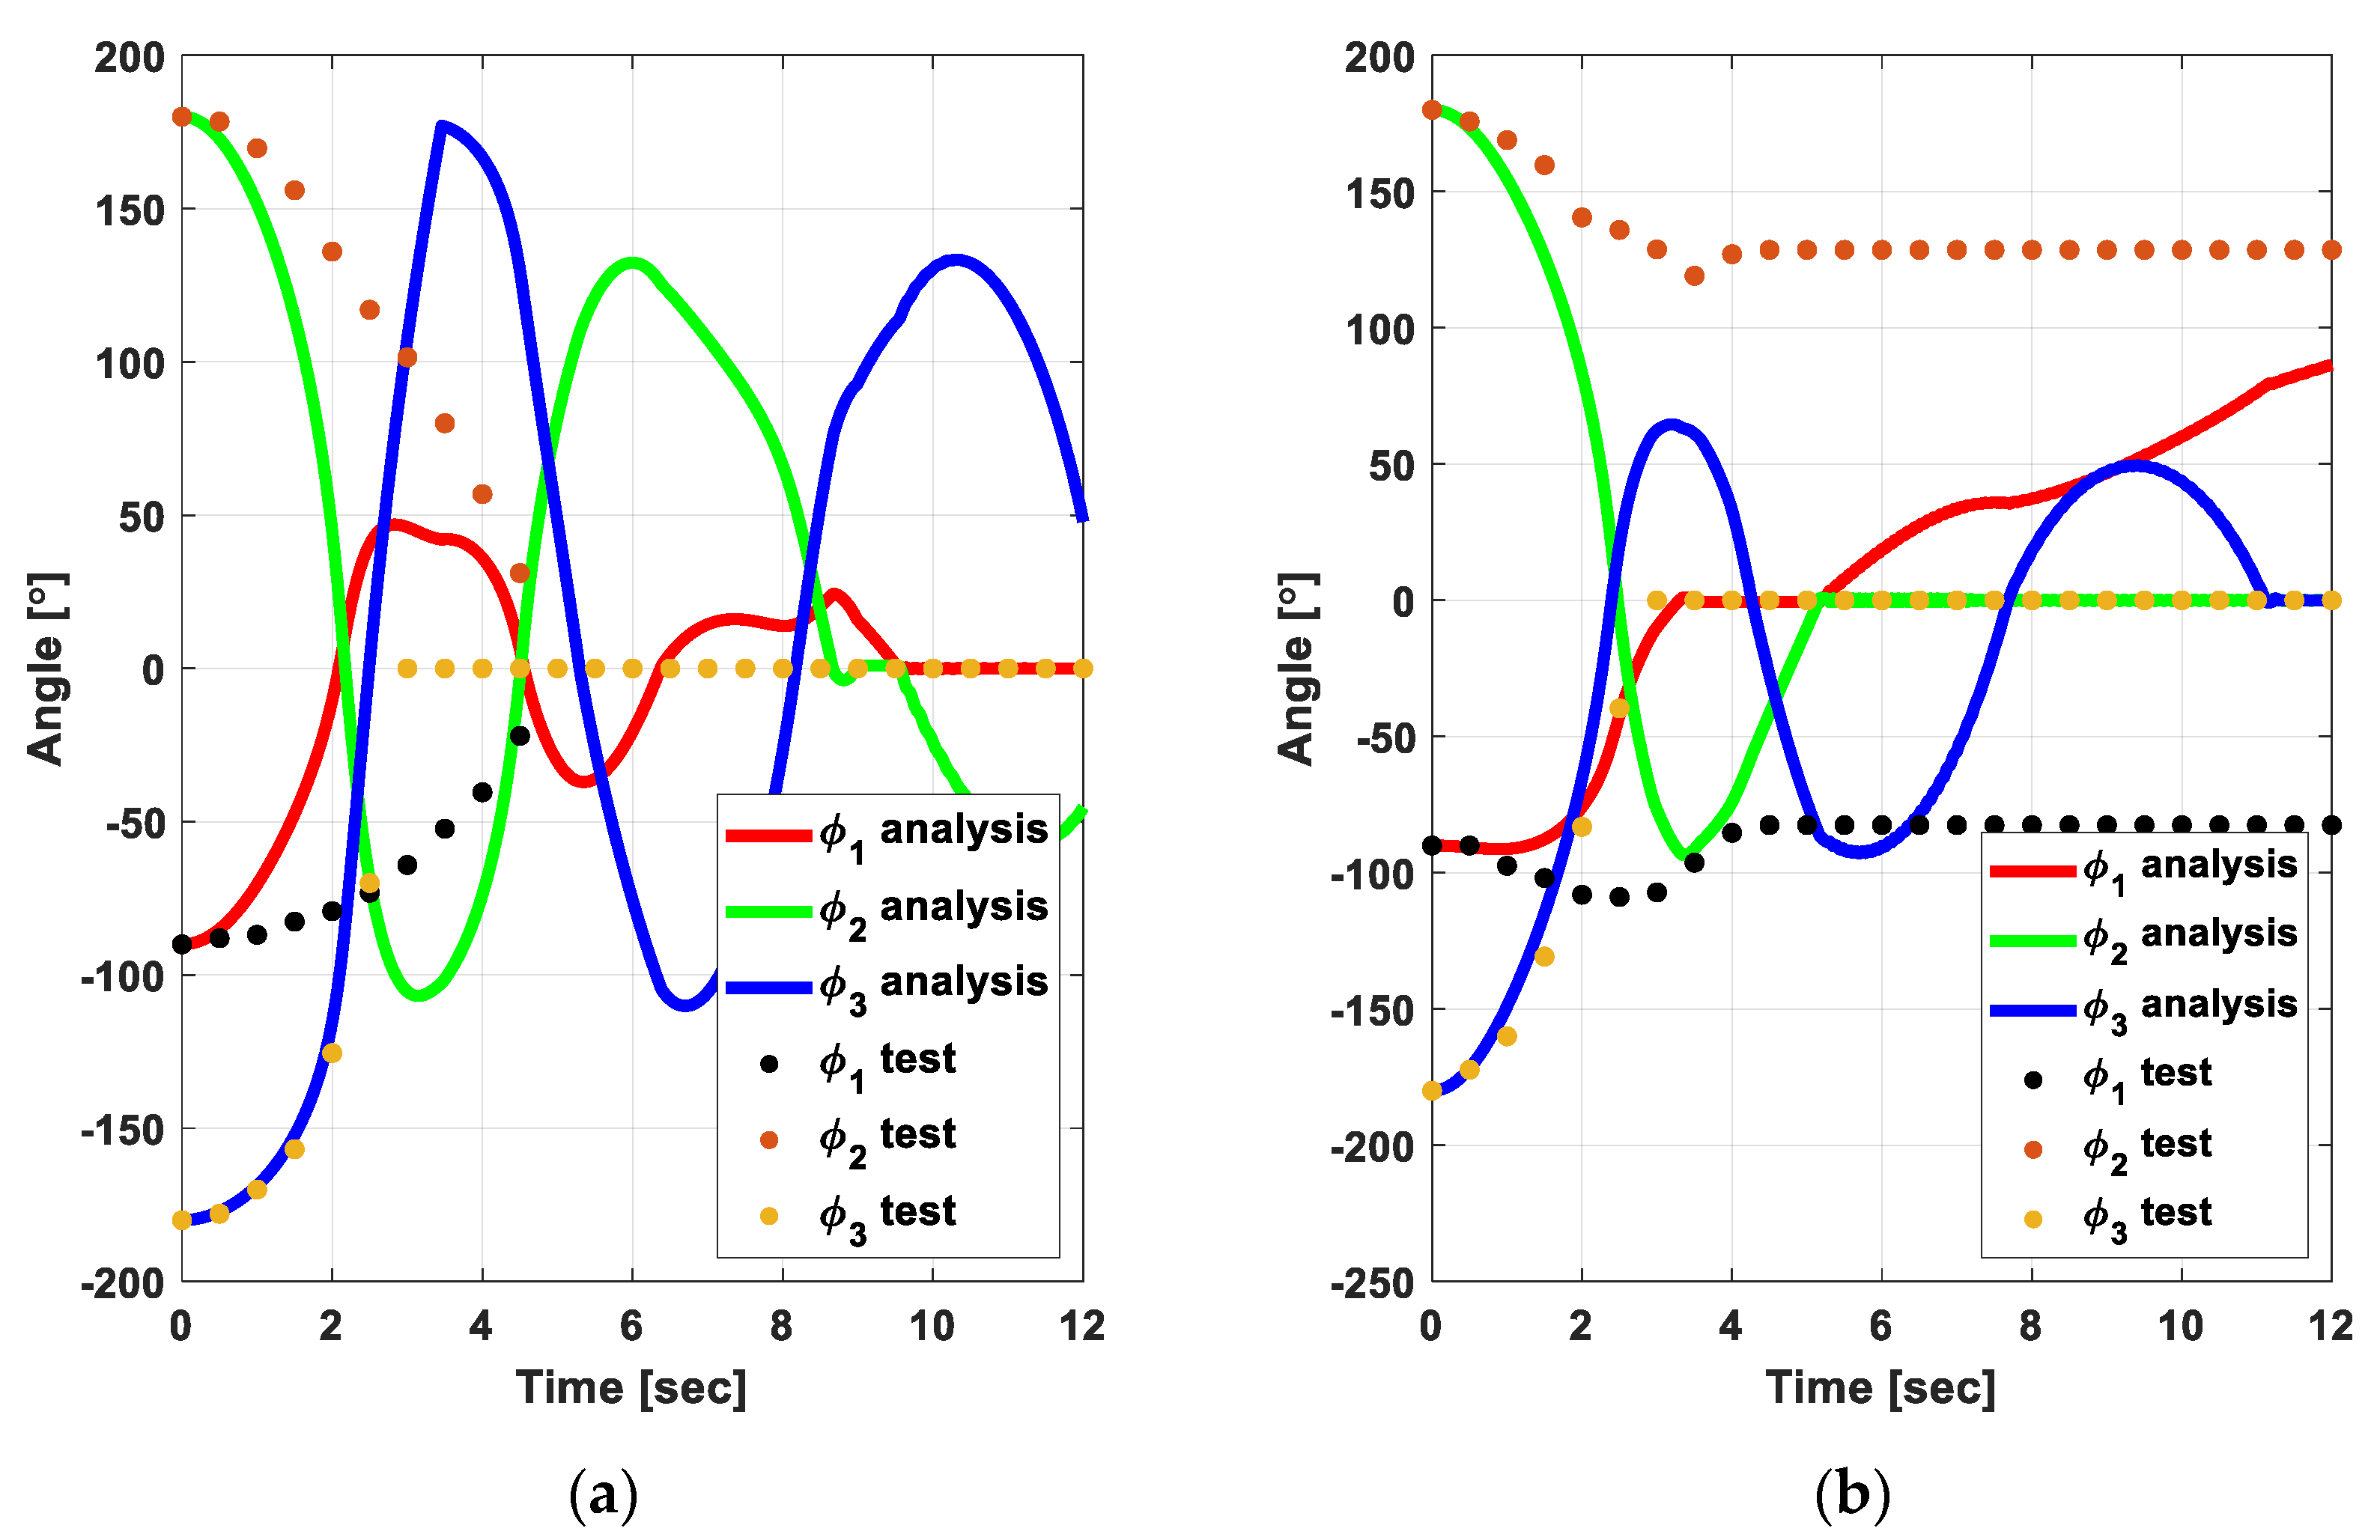
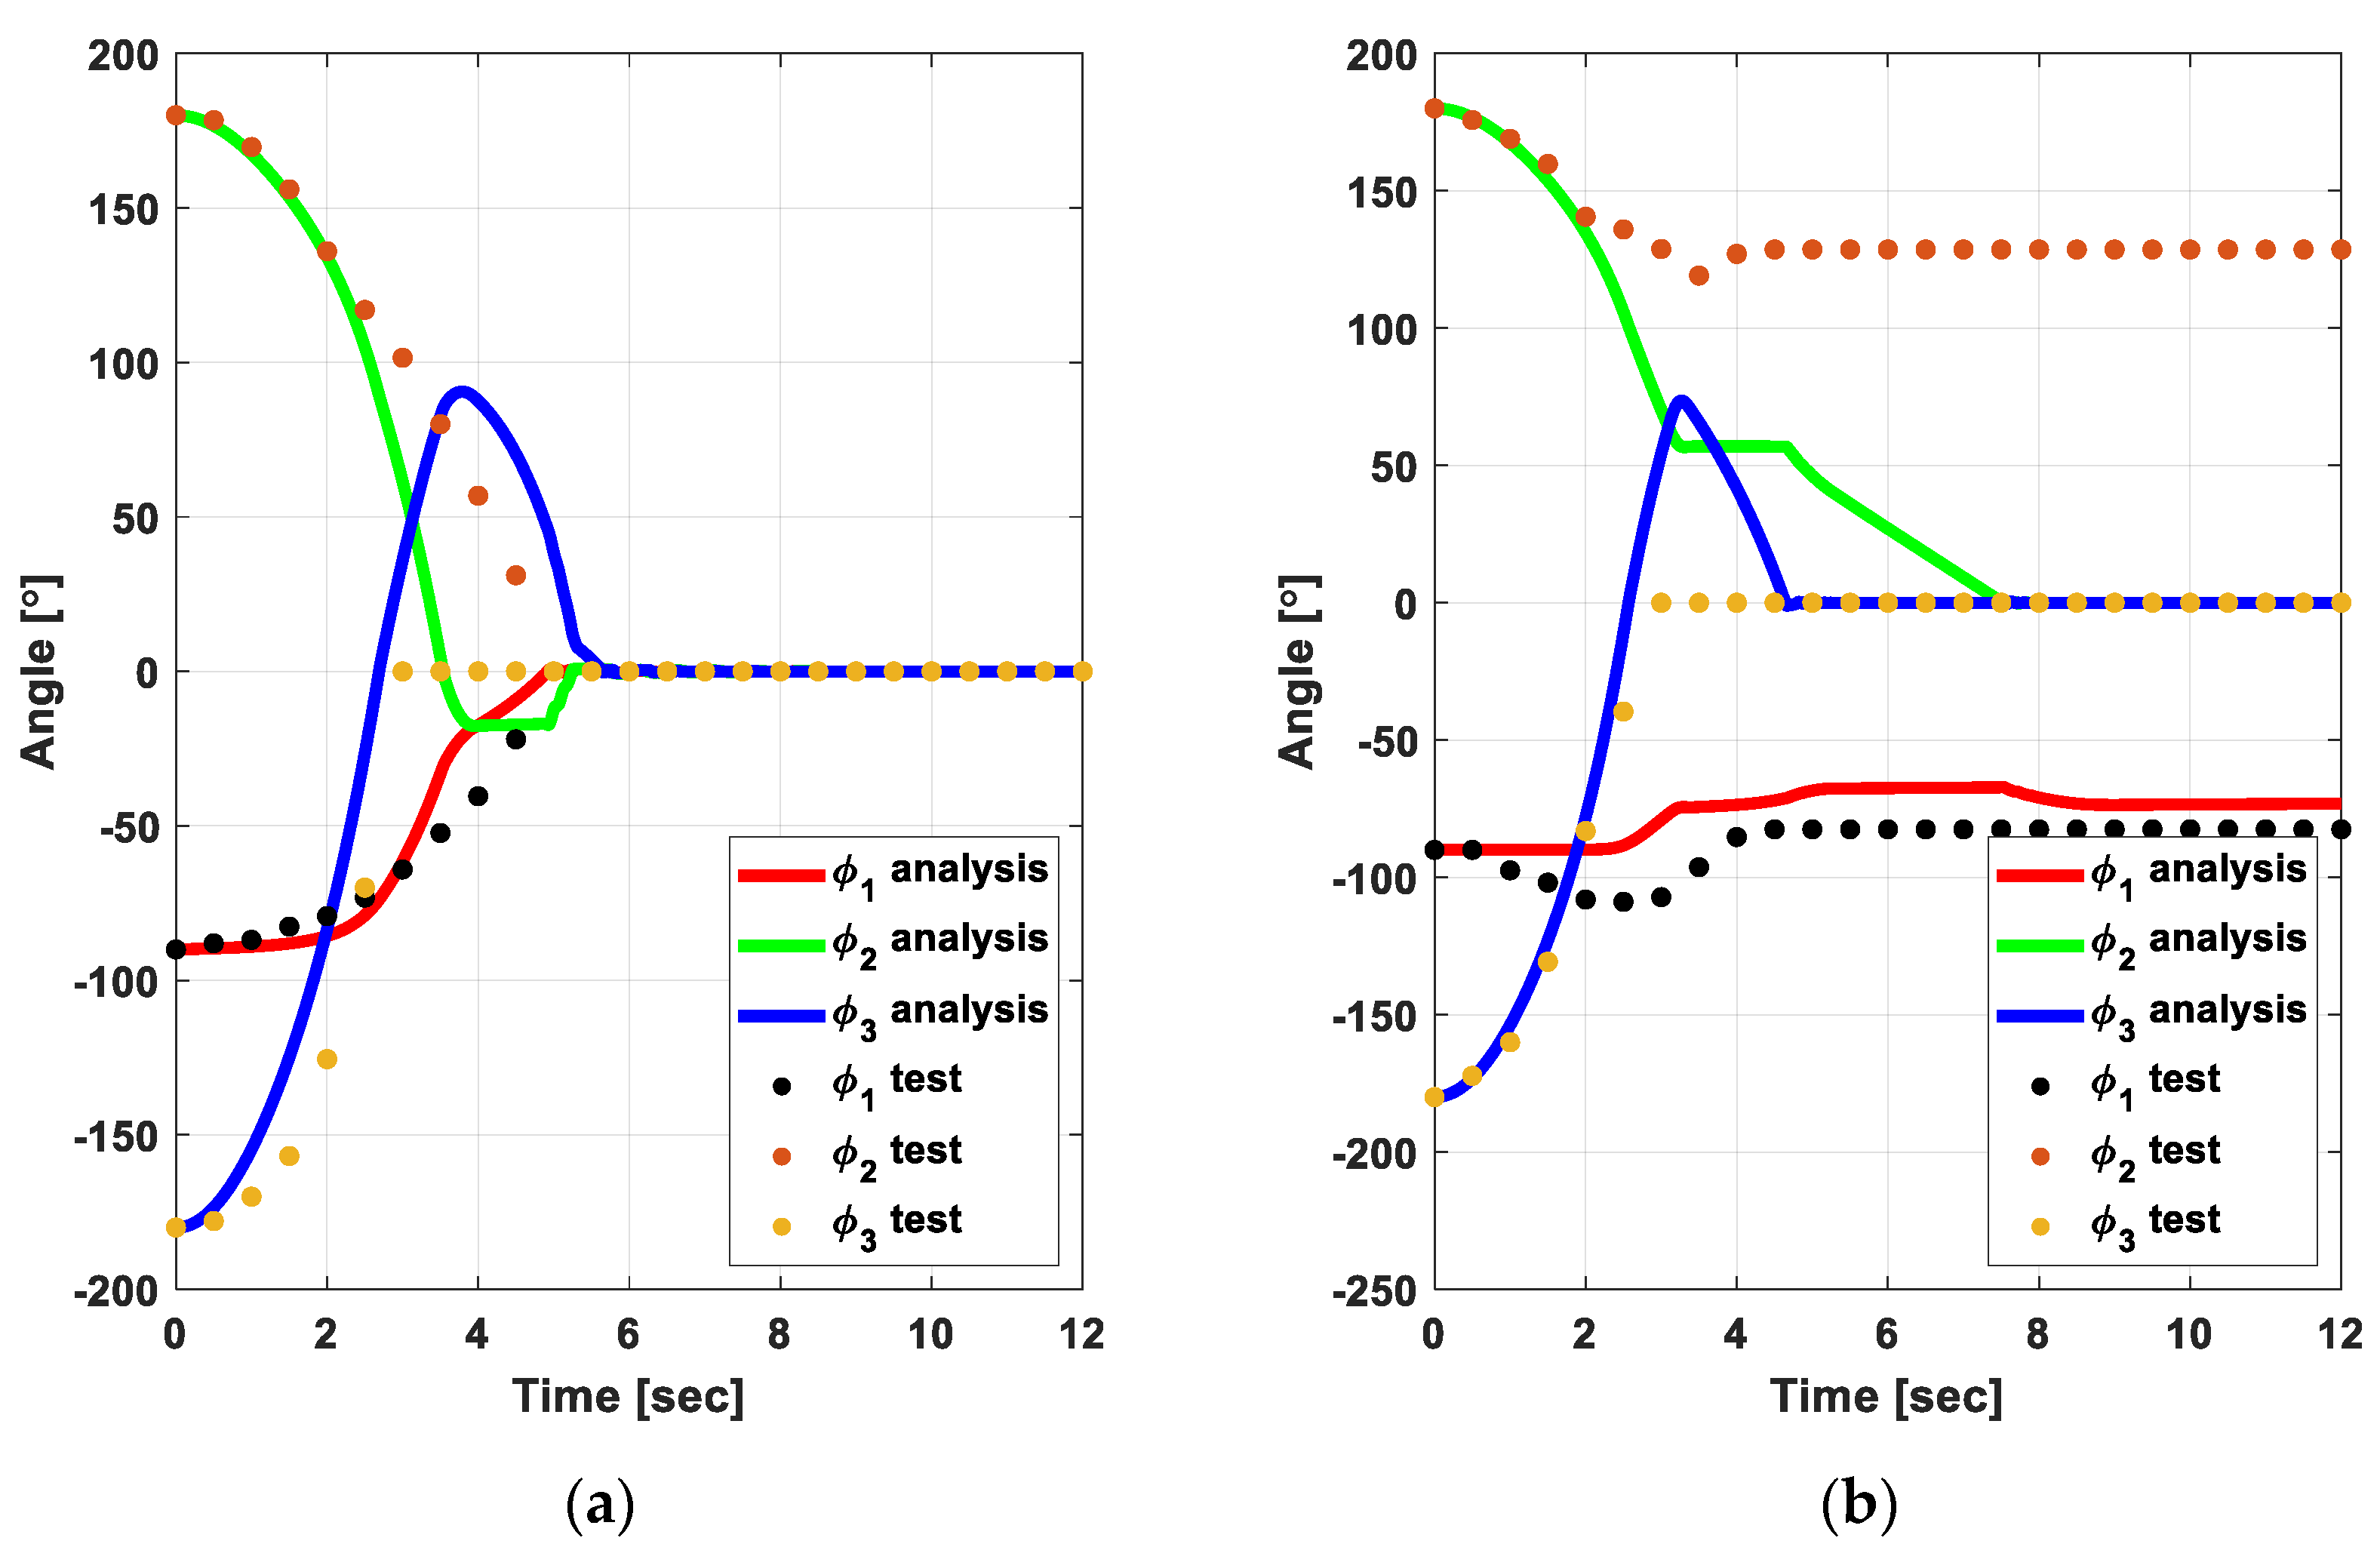
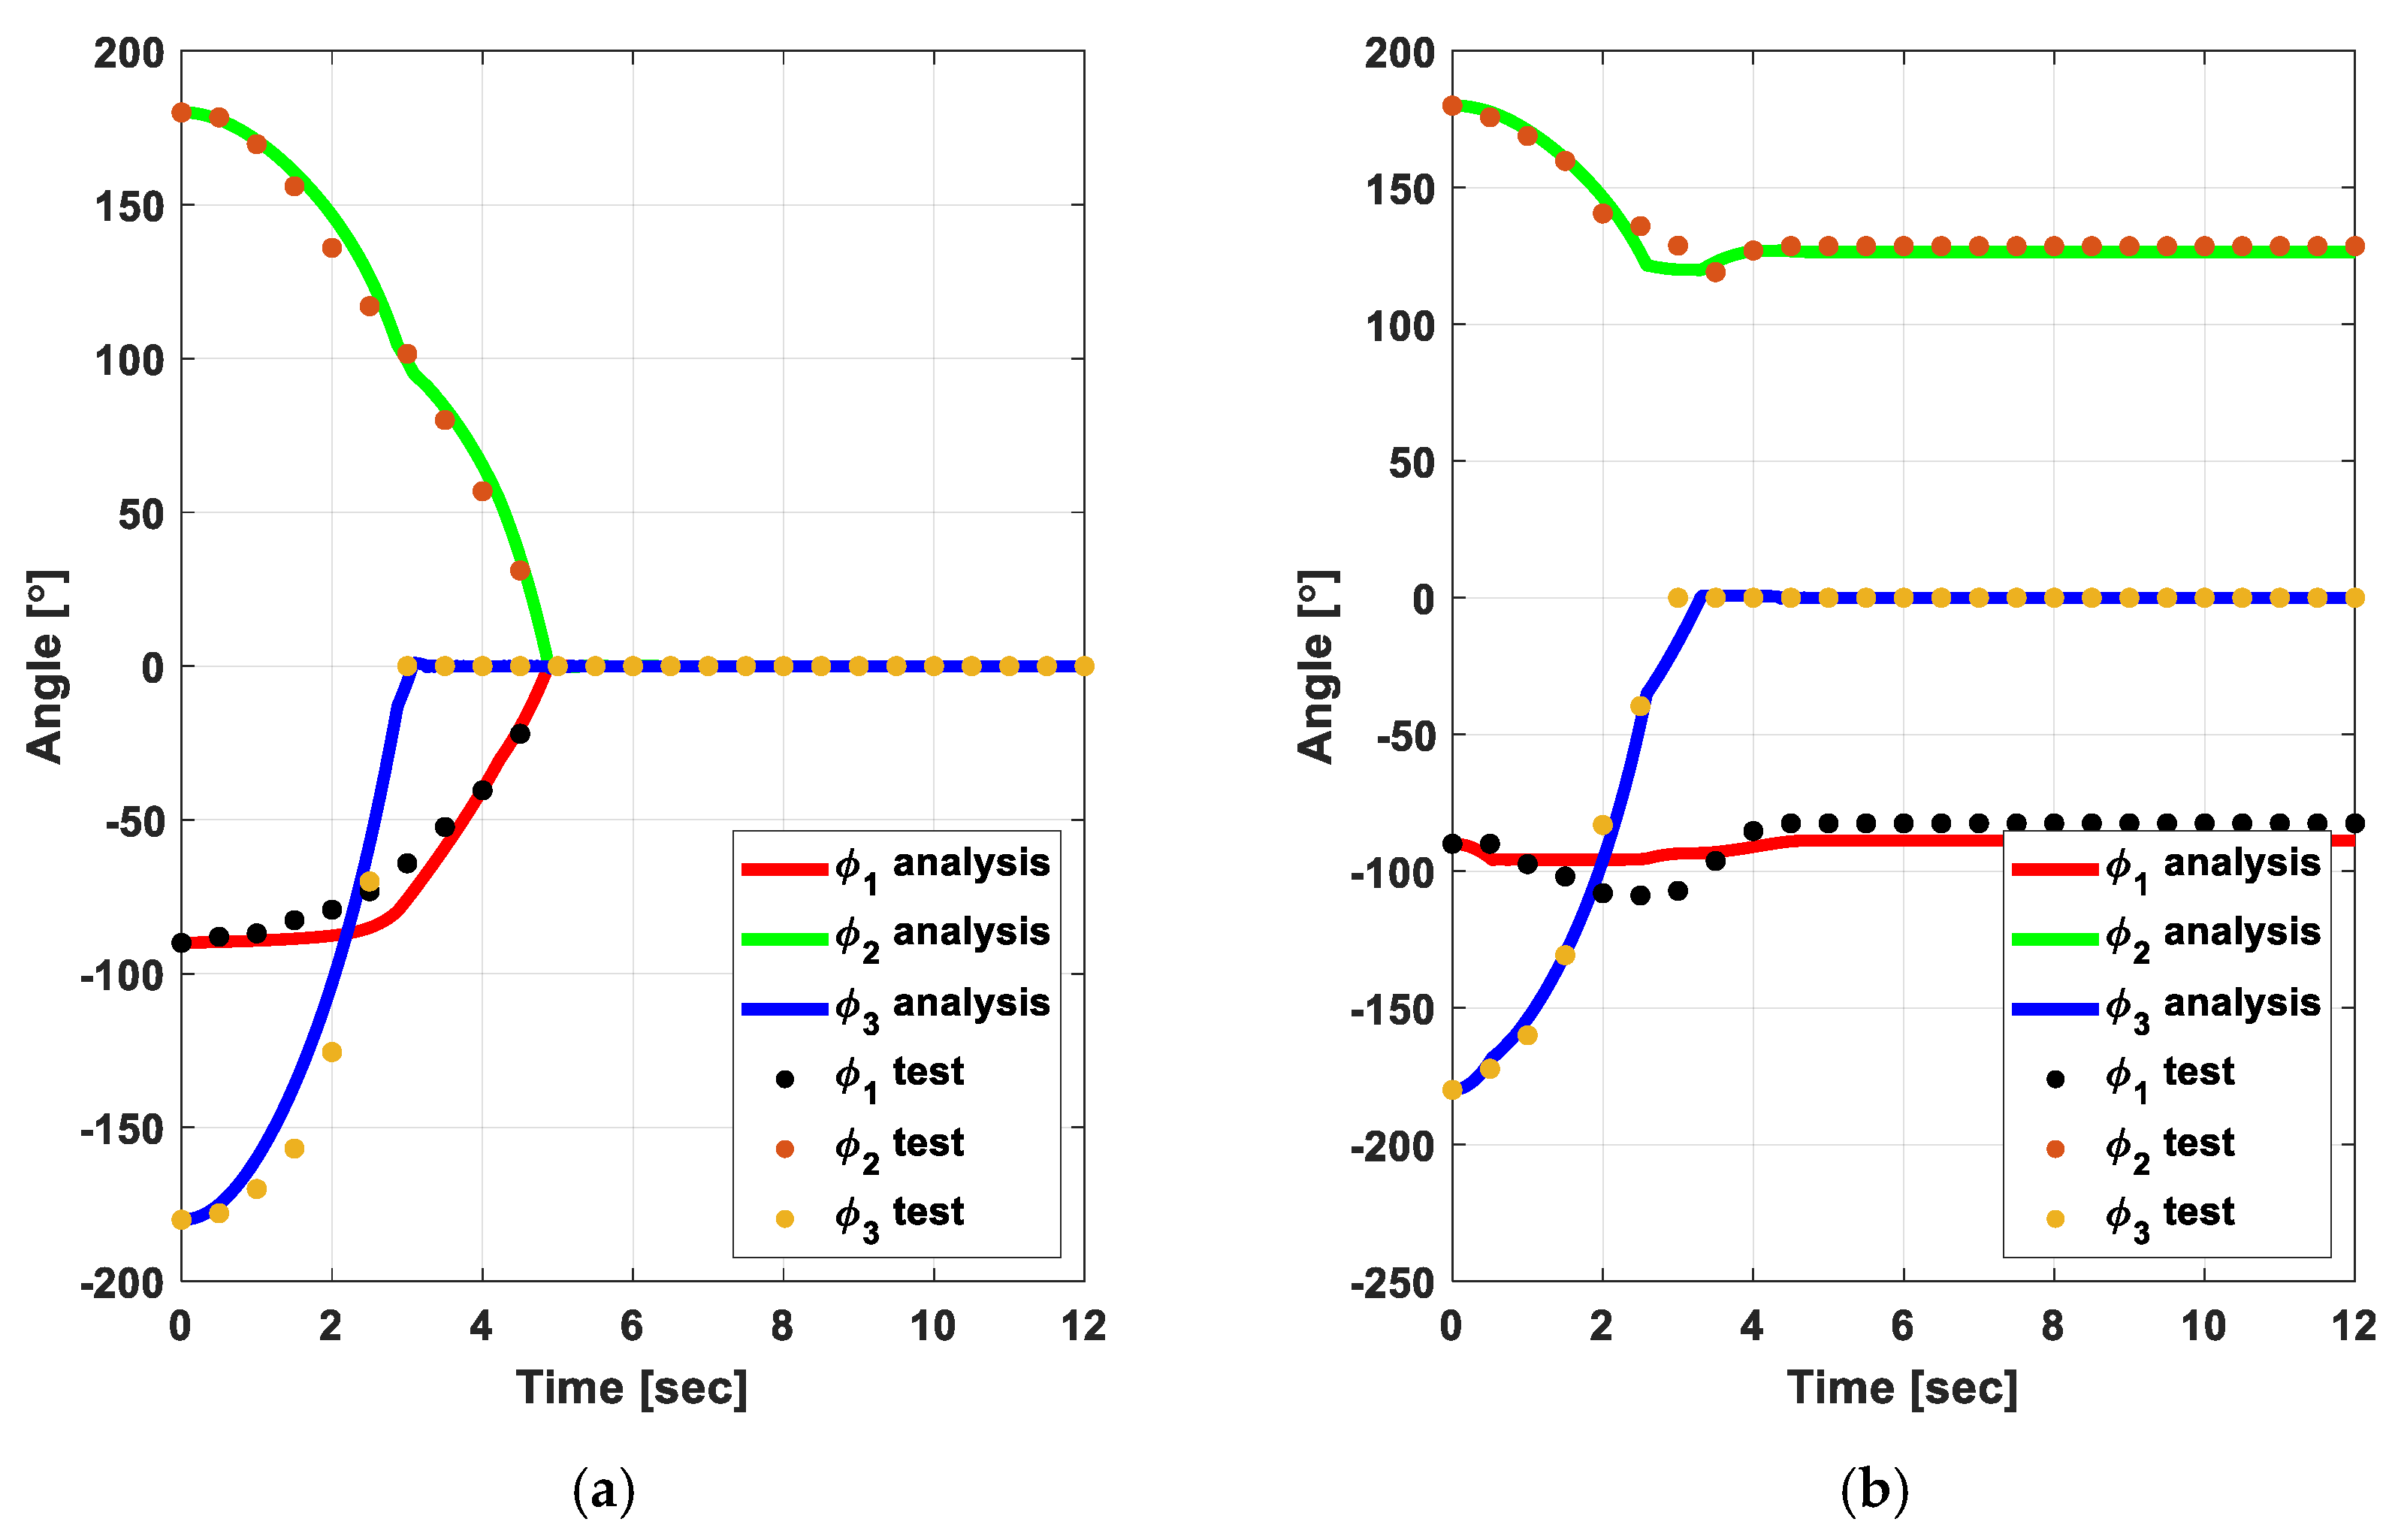
4.2. Friction Torque Evaluation by Inverse Analysis

In the deployment test, the deployment time history of angular displacement was compared with the deployment analysis results for all joints. As seen in case T01 and T02 (see Figure 9), the deployment time of testing was later than that of analysis, no critical overshoot of panels was found. In the test frames, there were various friction sources such as the slight misalignment of the deployment test device, the resistance forces caused by the air drag and air-bearing of the dummy panels were needed in the MBD model to compensate such deviation. Thus, in our work, the equivalent friction torque defined as EFT1, EFT2, and EFT3 including all friction sources is proposed. The EFT values can be easily determined by solving an optimization problem with the response surface method [2] to find EFT values that makes the rotation angle history of analysis results similar to those of testing for 2 s. In our work, the rotation angle history of three rotation joints ϕ 1 , ϕ 2 , and ϕ 3 were used as the target variables for the model correlation between test and analysis.
For the friction compensation [35], a rotation friction model was employed as,
E F T = 2 e ( T b r k T C ) exp ( ( ω ω s t ) 2 ) ω ω s t + T C tanh ( ω ω C o u l ) + f ω ,
where, T b r k , T c , and f indicates the breakway friction, Coulomb friction, and viscous friction coefficient, respectively; ω , ω C o u l , and ω s t are the relative velocity, Coulomb threshold velocity, and Stribeck velocity threshold, respectively; And ω C o u l is a parameter used to alleviate numerical instability caused by Coulomb friction. In this work, 0.01 rad/s was used in reference value [35]. It reduced to a simple Equation (5) by setting T b r k to T c and neglecting the effect of viscous friction as,
T C tanh ( ω ω C o u l ) ,
The error function in Equation (6) is defined in terms of the deviation of deployment angles ϕ 1 , ϕ 2 , and ϕ 3 of the three panels that were derived referring to the test data for the first 2 s while no interaction between the panels occurred. The deployment angles varied with friction torques: EFT1, EFT2, and EFT3. Therefore, the optimal design solution using various combinations of friction torques was obtained by minimizing the error function as,
E r r o r ( ϕ 1 a , ϕ 2 a , ϕ 3 a ) = i = 0 200 ( ϕ 1 a ( t i ) ϕ 1 e ( t i ) ) 2 + i = 0 200 ( ϕ 2 a ( t i ) ϕ 2 e ( t i ) ) 2 + i = 0 200 ( ϕ 3 a ( t i ) ϕ 3 e ( t i ) ) 2
where ϕ a i = ϕ a i ( EFT 1 , EFT 2 , EFT 3 ) , t i + 1 = t i + Δ t   ( t 0 = 0 s ,   Δ t = 0.01 s ) . Superscript a and e denote analysis and experiment, respectively.
As a result, the values of T C for the revolute joint 1, revolute joint 2, and revolute joint 3 were 2.63 N · m, 1.7 N · m, and 0.001 N · m to show excellent correlation between test and analysis for the T01 and T02 case for 2 s, respectively. The friction torque of Hinge-1 is higher than those of Hinge-2 and Hinge-3. It seems that inner hinges have to experience more friction caused by accumulated misalignments of friction elements from panels, air bearings, and panels.
After considering of EFTs, the simulation result for ϕ 1 value was quite consistent with that of testing, as seen in Figure 10. For ϕ 2 , and ϕ 3 values, during the first 2 s, the deployed configuration of the dummy solar panels with EFTs was very similar to that of testing. But after 2 s, there were undesirable interaction between the panels and the test frames because the dummy panels were also moved laterally due to the imbalance of the initial driving torques, which led to a critical deviation between test and analysis. Thus, we added the test frames in the MBD model. Friction between air bearing and rail was applied. The coefficient of static friction is 0.3, and the coefficient of dynamic friction is 0.1. Also, contact stiffness of 37,000 N/mm 1.5 and contact damping 3.7 N·s/mm 1.25 were applied based on Hertz contact theory. In addition, the same contact condition was also applied between panels to panels, and between panels to lifting devices so that they could move within a limited area in case of contact. After considering both the EFTs and the test frames, we found an excellent agreement between test and analysis, as shown in Figure 11. The overshoots of dummy panels disappeared in the MBD model with the test frames. Its detailed model correlation history with comparison of several snapshots was given in Figure 12 for test case T01 and Figure 13 for test case T02.

4.3. Validation of EFTs by Torque Margin Evaluation

In this section, the evaluated EFTs were reverified by the torque margin analysis. From the deployment test results, for the case T01, the deployment of dummy panels was successful but for the case T02, finally, it failed to deploy because the initial driving torque was not properly chosen as mentioned in Section 3. To investigate this phenomenon in detail, the torque margin was evaluated as
T o r q u e   M a r g i n = ( T D T R 1 ) × 100 ( % ) ,
where T D and T R are the driving torque and the resistance torque, respectively [36]. Here, T D is the driving torque value at the deployment angle 90° for joint 1 and at the deployment angle 180° for joints 2 and 3. Also, T R is the resistance torque value that was replaced by the EFT values.
The torque margin calculation results for all joints are summarized in Table 5. If the torque margin value was negative, it means that deployment of a panel at the corresponding joints will not be achieved. For the first test cases of T01, all torque margin values were positive, but for the worst cases of T02, there were negative torque margin values for joint-1. As seen in Figure 13, the T02 case failed to deploy the panels at joint-1. Hence, this torque margin calculation results were consistent with the deployment test results of the dummy solar panels.
Through this evaluation, it can be predicted that the worst case cannot be deployed in advance. Therefore, the EFT estimation method developed in this work was verified with excellent reliability for the design of torsional spring stiffness of hinges as well as the deployment of various satellite appendages.

5. Conclusions

In this work, experimental and numerical investigation of deployment of solar panels with tape spring hinge showing nonlinear hysteresis behavior was carried out with the aid of MBD simulation with friction compensation. The nonlinear and path-dependent behavior of TS hinges were realized by the expression function RecurDyn by distinguishing the folding/unfolding status by the sign of angular velocity of the revolute joints with the moment–rotation curves measured by the four-point bending test and push–pull test.
First, the deployment test and analysis results showed some deviation due to the friction caused by the slight misalignment of the frame and panels, and air drag caused during the panel deployment despite careful leveling and aligning. Thus, the EFT values were obtained by inverse analysis with test data for the first 2 s. Considering of the EFTs and test frames, the MBD simulation results showed excellent agreement with the deployment test results. Furthermore, to reverify the validity of the EFT values, the torque margin was estimated for all revolute joints. In the normal case, all torque margins were positive, while one of the torque margins was negative in the worst case, which was consistent with the deployment test results. Thus, MBD simulation with the applied EFTs was reasonable and efficient to consider the nonlinear and path-dependent behavior of TS hinges. The approach proposed was realized efficiently by commercial software, which would be quite helpful to relevant engineers.

Author Contributions

Conceptualization, J.H.L., K.-W.K. and J.J.; methodology, D.-Y.K.; software, D.-Y.K. and H.-S.C.; validation, J.H.L.; investigation, D.-Y.K.; data curation, H.-S.C.; writing—Original draft preparation, D.-Y.K. and J.H.L.; writing—Review and editing, K.-W.K. and J.J.; supervision, J.H.L.; All authors have read and agreed to the published version of the manuscript.

Funding

This research was supported by the National Research Foundation of Korea (NRF) funded by the Ministry of Science and ICT (NRF- 2018M1A3A3A02065478).

Conflicts of Interest

The authors declare no conflict of interest.

References

  1. Fufa, B.; Zhao-Bo, C.; Wensheng, M. Modeling and simulation of satellite solar panel deployment and locking. InfTJ 2010, 9, 600–604. [Google Scholar] [CrossRef] [Green Version]
  2. Kim, D.-Y.; Lim, J.H.; Jang, T.-S.; Cha, W.H.; Lee, S.-J.; Oh, H.-U.; Kim, K.-W. Optimal design of stiffness of torsion spring hinge considering the deployment performance of large scale sar antenna. J. Aerosp. Syst. Eng. 2019, 13, 78–86. [Google Scholar]
  3. Kim, K.-W.; Park, Y. Solar array deployment analysis considering path-dependent behavior of a tape spring hinge. J. Mech. Sci. Technol. 2015, 29, 1921–1929. [Google Scholar] [CrossRef]
  4. Hoffait, S.; Brüls, O.; Granville, D.; Cugnon, F.; Kerschen, G. Dynamic analysis of the self-locking phenomenon in tape-spring hinges. Acta Astronaut. 2010, 66, 1125–1132. [Google Scholar] [CrossRef]
  5. Mobrem, M.; Adams, D.S. Deployment analysis of the lenticular jointed antennas onboard the mars express spacecraft. J. Spacecr. Rocket. 2009, 46, 394–402. [Google Scholar] [CrossRef]
  6. Mallikarachchi, H. Thin-walled composite deployable booms with tape-spring hinges. Ph.D. Thesis, University of Cambridge, Cambridge, UK, December 2011. [Google Scholar]
  7. Boesch, C.; Pereira, C.; John, R.; Schmidt, T.; Seifart, K.; Sparr, H.; Lautier, J.; Pyttel, T. Ultra light self-motorized mechanism for deployment of light weight spacecraft appendages. In Proceedings of the 39th Aerospace Mechanisms Symposium, Sunnyvale, CA, USA, 7–9 May 2008; pp. 7–9. [Google Scholar]
  8. Block, J.; Straubel, M.; Wiedemann, M. Ultralight deployable booms for solar sails and other large gossamer structures in space. Acta Astronaut. 2011, 68, 984–992. [Google Scholar] [CrossRef]
  9. Sickinger, C.; Herbeck, L.; Ströhlein, T.; Torrez-Torres, J. Lightweight deployable booms: Design, manufacture, verification, and smart materials application. In Proceedings of the 55th International Astronautical Congress of the International Astronautical Federation, the International Academy of Astronautics, and the International Institute of Space Law, Vancouver, BC, Canada, 4–8 October 2004. [Google Scholar]
  10. Lane, S.A.; Murphey, T.W.; Zatman, M. Overview of the innovative space-based radar antenna technology program. J. Spacecr. Rocket. 2011, 48, 135–145. [Google Scholar] [CrossRef]
  11. Yang, H.; Liu, R.; Wang, Y.; Deng, Z.; Guo, H. Experiment and multiobjective optimization design of tape-spring hinges. Struct. Multidiscip. Optim. 2015, 51, 1373–1384. [Google Scholar] [CrossRef]
  12. Seffen, K.; Pellegrino, S. Deployment dynamics of tape springs. Proceedings of the royal society of London. Series A: Mathematical. Phys. Eng. Sci. 1999, 455, 1003–1048. [Google Scholar] [CrossRef] [Green Version]
  13. Seffen, K.; Pellegrino, S. Deployment of a Rigid Panel by Tape-Springs; Cambridge University Press: Cambridge, UK, 1997. [Google Scholar]
  14. Soykasap, Ö. Analysis of tape spring hinges. Int. J. Mech. Sci. 2007, 49, 853–860. [Google Scholar] [CrossRef]
  15. Walker, S.J.; Aglietti, G. Study of the dynamics of three dimensional tape spring folds. AIAA J. 2004, 42, 850–856. [Google Scholar] [CrossRef] [Green Version]
  16. Walker, S.J.; Aglietti, G.S. Experimental investigation of tape springs folded in three dimensions. AIAA J. 2006, 44, 151–159. [Google Scholar] [CrossRef] [Green Version]
  17. Jeong, J.W.; Yoo, Y.I.; Shin, D.K.; Lim, J.H.; Kim, K.W.; Lee, J.J. A novel tape spring hinge mechanism for quasi-static deployment of a satellite deployable using shape memory alloy. Rev. Sci. Instrum. 2014, 85, 025001. [Google Scholar] [CrossRef]
  18. Ye, H.; Zhang, Y.; Yang, Q.; Xiao, Y.; Grandhi, R.V.; Fischer, C.C. Optimal design of a three tape-spring hinge deployable space structure using an experimentally validated physics-based model. Struct. Multidiscip. Optim. 2017, 56, 973–989. [Google Scholar] [CrossRef]
  19. Ye, H.; Zhang, Y.; Yang, Q.; Zhang, B. Quasi-static analysis and multi-objective optimization for tape spring hinge. Struct. Multidiscip. Optim. 2019, 60, 2417–2430. [Google Scholar] [CrossRef]
  20. Hui, Y.; Ruipeng, Z.; Zhanwen, F.; Yan, W.; Rongqiang, L. Deploying dynamics experiment of tape-spring hinges for deployable mechanism. In Proceedings of the 32nd Youth Academic Annual Conference of Chinese Association of Automation (YAC), Hefei, China, 19–21 May 2017; pp. 106–110. [Google Scholar]
  21. Oberst, S.; Tuttle, S. Nonlinear dynamics of thin-walled elastic structures for applications in space. Mech. Syst. Signal Process. 2018, 110, 469–484. [Google Scholar] [CrossRef]
  22. Dewalque, F.; Schwartz, C.; Denoël, V.; Croisier, J.-L.; Forthomme, B.; Brüls, O. Experimental and numerical investigation of the nonlinear dynamics of compliant mechanisms for deployable structures. Mech. Systems Signal Process. 2018, 101, 1–25. [Google Scholar] [CrossRef]
  23. Picault, E.; Marone-Hitz, P.; Bourgeois, S.; Cochelin, B.; Guinot, F. A planar rod model with flexible cross-section for the folding and the dynamic deployment of tape springs: Improvements and comparisons with experiments. Int. J. Solids Struct. 2014, 51, 3226–3238. [Google Scholar] [CrossRef]
  24. Bai, J.-B.; Chen, D.; Xiong, J.-J.; Shenoi, R.A. Folding analysis for thin-walled deployable composite boom. Acta Astronaut. 2019, 159, 622–636. [Google Scholar] [CrossRef] [Green Version]
  25. Dewalque, F.; Rochus, P.; Brüls, O. Importance of structural damping in the dynamic analysis of compliant deployable structures. Acta Astronaut. 2015, 111, 323–333. [Google Scholar] [CrossRef]
  26. Kim, K.-W.; Park, Y. Systematic design of tape spring hinges for solar array by optimization method considering deployment performances. Aerosp. Sci. Technol. 2015, 46, 124–136. [Google Scholar] [CrossRef]
  27. Seo, J.-H.; Chae, J.-S.; Park, T.-W.; Han, S.-W.; Chai, J.-B.; Seo, H.-S. Solar panel deployment analysis of a satellite system. JSME Int. J. Ser. C Mech. Syst. Mach. Elem. Manuf. 2003, 46, 508–518. [Google Scholar] [CrossRef] [Green Version]
  28. Kwak, M.K.; Heo, S.; Kim, H.B. Dynamics of satellite with deployable rigid solar arrays. Multibody Syst. Dyn. 2008, 20, 271–286. [Google Scholar] [CrossRef]
  29. Moon, H.-Y.; Park, S. Development of deployment test equipment suitable for single large solar panel. J. Korean Soc. Aeronaut. Space Sci. 2018, 46, 583–591. [Google Scholar]
  30. FunctionBay, Recurdyn/solver Theoretical Manual. Available online: https://functionbay.com/documentation/onlinehelp/default.htm#!Documents/introduction.htm (accessed on 6 November 2020).
  31. Akima, H. A New Method of Interpolation and Smooth Curve Fitting Based on Local Procedures. J. ACM 1970, 17, 589–602. [Google Scholar] [CrossRef]
  32. A Two-Axis Digital Leveler. Available online: http://www.dong-do.co.kr (accessed on 6 November 2020).
  33. A Motion Capture Camera. Available online: http://www.qualisys.com (accessed on 6 November 2020).
  34. A Tape Measures. Available online: http://www.komelon.co.kr (accessed on 6 November 2020).
  35. Armstrong, B.; De Wit, C.C. Friction modeling and compensation. Control Handb. 1996, 77, 1369–1382. [Google Scholar]
  36. Postma, R.W. Force and torque margins for complex mechanical systems. In Proceedings of the 37th Aerospace Mechanisms Symposium, Galveston, TX, USA, 18–21 May 2004; p. 107. [Google Scholar]
Figure 1. Configuration of multi-layer TS hinges: (a) unfolding configuration, (b) folding configuration, (c) design parameters of multi-layer TS hinges.
Applsci 10 07902 g001
Figure 2. Typical moment–rotation profile of TS hinges: (a) single TS, (b) multi-layer TS.
Applsci 10 07902 g002
Figure 3. Test configuration for measurement of the moment–rotation profile: (a) four-point bending test for small angles, (b) push-pull test for large angles.
Applsci 10 07902 g003
Figure 4. Measurement results of the moment–rotation profile: (a) for all rotation angle ranges, (b) for small-angle ranges.
Applsci 10 07902 g004
Figure 5. Expression function for the implementation of the path-dependent stiffness of TS hinges in RecurDyn.
Applsci 10 07902 g005
Figure 6. Configuration of the Zero-G device: (a) schematic view of Zero-G device, (b) stowed configuration (frames were hidden), (c) deployed configuration (frames were hidden).
Applsci 10 07902 g006
Figure 7. Configuration of dummy open solar panels and hinges with three revolute joints for test case T01.
Applsci 10 07902 g007
Figure 8. Configuration of the MBD modeling at the deployed configuration: (a) isometric view (b) top view.
Applsci 10 07902 g008
Figure 9. Comparison of the time history of angular displacements for all test cases: (a) T01, (b) T02.
Applsci 10 07902 g009
Figure 10. Comparison of the time history of angular displacements after EFT consideration for test cases: (a) T01, (b) T02.
Applsci 10 07902 g010
Figure 11. Comparison of the time history of angular displacements after EFT and test frames consideration for test cases: (a) T01, (b) T02.
Applsci 10 07902 g011
Figure 12. Comparison of the rotation angle history for T01 case.
Applsci 10 07902 g012
Figure 13. Comparison of the rotation angle history for T02 case.
Applsci 10 07902 g013
Table 1. Specification of three types of TS hinges and mechanical characteristics.
TS Hinge-1TS Hinge-2TS Hinge-3
Figure Applsci 10 07902 i001 Applsci 10 07902 i002 Applsci 10 07902 i003
No. of tape layers (n)222
No. of ribs322
Dimension of TS hinges [mm] (L, W, H)(98.2, 68.0, 29.0)(98.2, 68.0, 29.0)(98.2, 68.0, 29.0)
Dimension of TS (R, t, α )(13 mm, 0.13 mm, 70°)(13 mm, 0.13 mm, 70°)(11.5 mm, 0.08 mm, 55°)
A(1.1°, 69.39 N·m)(1.26°, 58.20 N·m)(1.08°, 33.43 N·m)
B(1.1°, 1.50 N·m)(1.28°, 0.86 N·m)(1.15°, 0.46 N·m)
C (180°)(180°, 2.32 N·m)(180°, 1.46 N·m)(180°, 0.74 N·m)
D(0.52°, 37.0 N·m)(0.65°, 26.0 N·m)(0.29°, 11.07 N·m)
M (90°)(90°, 1.20 N·m)(90°, 0.80 N·m)(90°, 0.385 N·m)
Table 2. TS hinges for three revolute joints for deployment test.
Test CaseHinge-1 (90° Hinge) Hinge-2 (180° Hinge) Hinge-3 (180° Hinge)Remarks
T01 Applsci 10 07902 i004
3.6 Nm (3 × 1.2)
> Applsci 10 07902 i005
2.92 Nm (2 × 1.46)
> Applsci 10 07902 i006
1.48 Nm (2 × 0.74)
Normal case
T02 Applsci 10 07902 i007
0.77 Nm (2 × 0.385)
< Applsci 10 07902 i008
2.92 Nm (2 × 1.46)
> Applsci 10 07902 i009
1.48 Nm (2 × 0.74)
Worst case
Table 3. Mass properties of dummy solar open panels.
Dummy Solar Open Panel
Figure Applsci 10 07902 i010
Mass3.5 kg
Moment of inertia[kg∙mm2] I x x = 0.83 × 10 6 I x y = 1.58 × 10 3
I y y = 1.90 × 10 6 I y z = 1.86 × 10 1
I z z = 1.06 × 10 6 I z x = 1.12
Dimension800 mm × 800 mm × 20 mm
Table 4. Number of constraints and active DOFs of various types of joints.
Joint TypeNo. of ConstraintNo. of Active DOFs
FixedTrans ( x ,   y ,   z ) = 3
Rot ( θ x ,   θ y ,   θ z ) = 3
0
RevoluteTrans = 3, Rot = 2Rot = 1
TranslationalTrans = 2, Rot = 3Trans = 1
SphericalTrans = 3, Rot = 0Rot = 3
Table 5. Torque margin for all test cases.
Test IDJointDriving
Torque
[N·m]
Friction
Torque
[N·m]
Torque
Margin
[%]
Deployment
Test
Pass/Fail
Deployment
Analysis
Pass/Fail
T01Joint-13.6 (3 × 1.2)2.6338.0PassPass
Joint-22.92 (2 × 1.46)1.771.8
Joint-31.48 (2 × 0.74)0.0011479
T02Joint-10.77 (2 × 0.385)2.63−70.7FailFail
Joint-22.92 (2 × 1.46)1.771.8
Joint-31.48 (2 × 0.74)0.0011479
Publisher’s Note: MDPI stays neutral with regard to jurisdictional claims in published maps and institutional affiliations.

