Article

Fracture Behavior of Two Biopolymers Containing Notches: Effects of Notch Tip Plasticity

1
Fatigue and Fracture Research Laboratory, Center of Excellence in Experimental Solid Mechanics and Dynamics, School of Mechanical Engineering, Iran University of Science and Technology, Narmak, Tehran 16846, Iran
2
Fracture Research Laboratory, Faculty of New Science and Technologies, University of Tehran, Tehran 16846, Iran
3
LADICIM (Laboratory of Materials Science and Engineering), University of Cantabria, E.T.S. de Ingenieros de Caminos, Canales y Puertos, Av/Los Castros 44, 39005 Santander, Spain
*
Authors to whom correspondence should be addressed.
Appl. Sci. 2020, 10(23), 8445; https://doi.org/10.3390/app10238445
Submission received: 11 November 2020 / Revised: 23 November 2020 / Accepted: 26 November 2020 / Published: 26 November 2020
(This article belongs to the Special Issue Fracture and Fatigue Assessments of Structural Components Ⅱ)

Abstract

:

Featured Application

The paper allows the fracture behavior of biopolymers containing notches to be better understood.

Abstract

This paper analyzes the notch effect on the fracture behavior of two biomaterials (a brittle bone cement and a ductile dental material) under mode I loading. U-notched Brazilian disk (UNBD) specimens of both materials were tested under remote compression, determining the corresponding fracture loads and load-displacement curves. Additionally, cracked rectangular and semicircular bend (SCB) specimens were tested under symmetric three-point bending in order to determine the fracture toughness of the two materials. Then, fracture loads were derived theoretically by applying the maximum tangential stress (MTS) and the mean stress (MS) criteria. Due to the brittle linear elastic behavior of the bone cement material, the MTS and MS criteria were directly applied to this material; however, given the significant nonlinear behavior of the dental material, the two fracture criteria were combined with the Equivalent Material Concept (EMC) for the fracture analyses of the dental material specimens. The results reveal a very good accuracy of both the MTS and the MS criteria for the fracture analysis of bone cement notched specimens. In the case of the dental material, very good results are also obtained when combining the MTS and the MS criteria with the EMC. The proposed approach can be useful for the fracture analysis of a wide range of biopolymers, from brittle to ductile behavior.

1. Introduction

Polymeric biomaterials are generally categorized, as many other families of materials, into three different groups, depending on their fracture behavior: brittle, quasi-brittle, and ductile. Fracture in brittle biomaterials usually takes place suddenly, with no plastic deformation from the pre-existing defect (crack or notch) tip. The fracture process in quasi-brittle biomaterials is still abrupt, but a small plastic zone is developed around the crack/notch tip at the fracture onset. Finally, ductile biomaterials usually exhibit elastic–plastic stress–strain behavior, and fracture normally occurs with an intermediate or large plastic zone in the vicinity of the crack/notch tip.
Bone cement is a well-known type of biomaterial. Bone cements are used in clinical applications for fixing joint prostheses in the hip and knee joints. Depending on the implant shape, notches of various shapes (e.g., U-shaped notches) can form in the bone cement. Due to the stress concentration around the notch tip and the corresponding reduction of the load-carrying capacity of the notched bone cement, prostheses may fail prematurely. Thus, the fracture behavior of notched biomaterials, particularly bone cements, should be carefully analyzed.
Polymer-based bone cement is the oldest and most well-known type of bone cement. Polymeric bone cements generally consist of two main components: the solid component, which is usually a Polymethyl-methacrylate powder, and the liquid component, frequently made of a methyl-methacrylate monomer [1]. Additionally, bone cements include additives to increase biocompatibility. In 1970, Charnley used bone cement material for orthopedic applications, with subsequent extensive research on this material [2]. In 1984, Saha et al. [3] widely investigated the mechanical properties of bone cement, including tensile strength, compression strength, viscoelastic behavior, fatigue response, impact strength, and fracture toughness [3]. Other works analyzing the properties of bone cements may be found in [4,5,6,7].
Low compatibility with body tissues and high heat generation during polymerization are the main issues of bone cement materials [8]. Ayatollahi et al. [9] investigated the fracture behavior of bone cement. They found that by adding nano-hydroxyapatite particles, the heat problem during the polymerization reaction could be reduced and the mechanical properties of the material could be increased [9]. Furthermore, Khandaker et al. [10] studied the fracture resistance, elastic modulus, and Poisson’s ratio of PMMA containing micro and nano MgO particles. They revealed that by adding nanoparticles to PMMA, the resulting mechanical properties could be improved considerably [10]. Kim et al. [11] and Gandomkarzadeh et al. [12] studied the fracture properties of bone cement materials by adding vancomycin. They measured the four-point bending strength, compressive strength, and fracture toughness of these materials [11,12]. Likewise, Tavakoli et al. [13] investigated the effect of adding the CS/Go optimized nanocomposite with different weight percentages to bone cement on mechanical properties of this material. They found that the addition of this nanocomposite (25 wt.%) could improve the mechanical, physical, and biological properties [13].
Concerning some of the latest advances in stress-based fracture criteria, Ayatollahi et al. [14] have recently investigated the fracture properties of three different dental biomaterials under mixed mode loading. They concluded that the use of T-stress in the generalized maximum tangential strain (GMTSN) criterion could improve the agreement between the theoretical predictions and the experimental results [14]. Previously, Taylor et al. [15] successfully predicted the fracture load of bone cement in presence of U-shaped notches under mode I loading by using the theory of critical distances (TCD). Not directly on biopolymers, but obtaining relevant engineering findings, Ayatollahi and Torabi [16] estimated the fracture initiation angles (FIAs) of polymeric materials weakened by V-shaped notches under mixed mode loading conditions by applying the maximum tangential stress (MTS) criterion. Furthermore, Ren et al. [17] validated the application of the MTS criterion to the analysis of fracture specimens under mixed mode loading. Bahrami et al. [18] combined Digital Image Correlation (DIC) with the MTS criterion to predict fracture loads in notched specimens. More recently, Hatami et al. [19] made use of two stress-based criteria to study the fracture resistance of notched components subjected to tension and out-of-plane deformation. Again, Bahrami et al. [20] evaluated the effect of layer orientation on the fracture properties of 3D printed polycarbonate specimens using the generalized MTS (GMTS) criterion. Kuruppu and Chong [21] investigated the fracture toughness of brittle materials in the presence of straight and chevron notches by using GMTS criterion. Torabi et al. [22] estimated the fracture toughness of notched graphite samples in mode I loading by using the mean stress (MS) and point stress (PS) criteria. Similarly, the brittle fracture under mode I loading of notched samples made of PMMA and polycrystalline graphite was analyzed using the MS criterion [23,24].
Moreover, with the aim of extending linear-elastic approaches to nonlinear situations, Torabi [25] was the first author who proposed the Equivalent Material Concept (EMC) for equating a real ductile material having elastic–plastic behavior with a virtual brittle material having perfectly linear-elastic behavior. By means of EMC in combination with PS and MS criteria, Torabi et al. [26,27] could estimate accurately the load-carrying capacity (LCC) of ductile U-notched Al 6061-T6 and Al 7075-T6 thin plates. Several works focused on the suitability of the EMC for analyzing fracture processes in ductile materials containing notches or cracks have recently been published (e.g., [28,29,30]).
In this work, the fracture loads of U-notched Brazilian disk (UNBD) specimens made of two different polymeric biomaterials (with linear and nonlinear behaviors) are numerically estimated under the opening mode loading using MTS and MS criteria. For the biomaterial with linear elastic behavior (bone cement), the two criteria are employed in their original forms (i.e., directly). For the biomaterial with nonlinear behavior (dental material), both the MTS and MS criteria are coupled with the EMC for the estimation of critical loads. In the two situations, very good consistency is obtained between the experimental results and the numerical predictions.

2. Materials and Methods

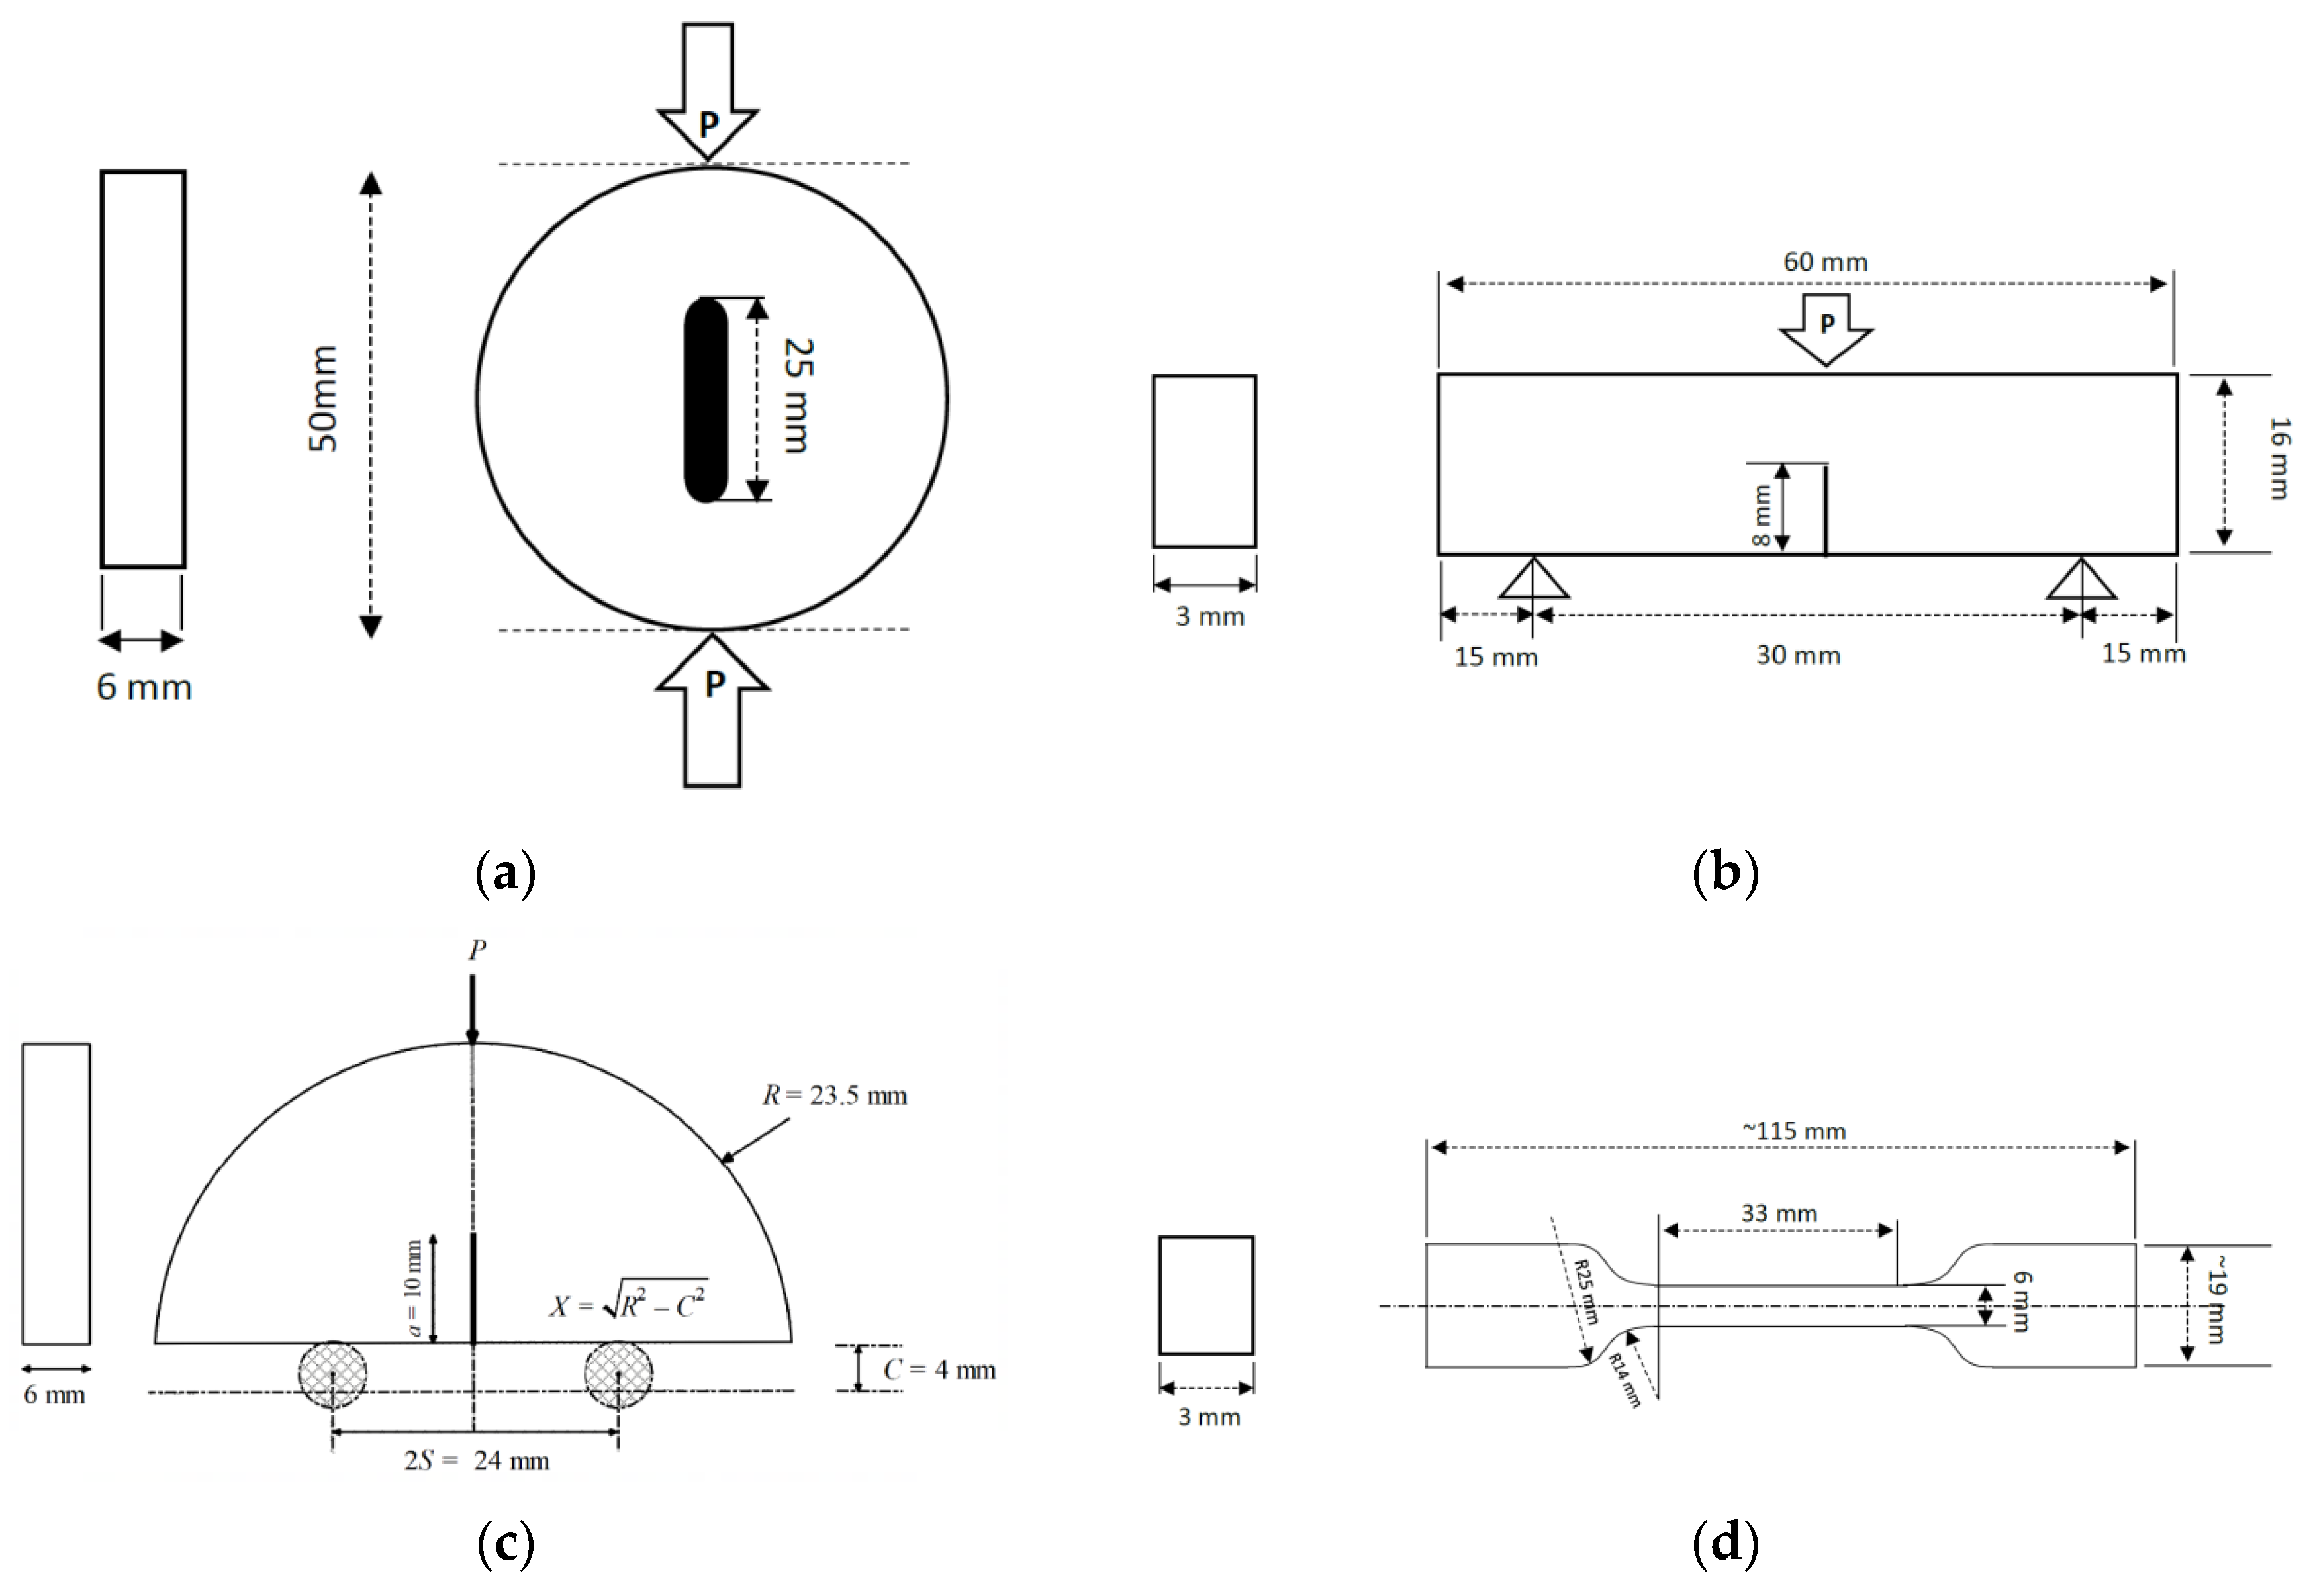
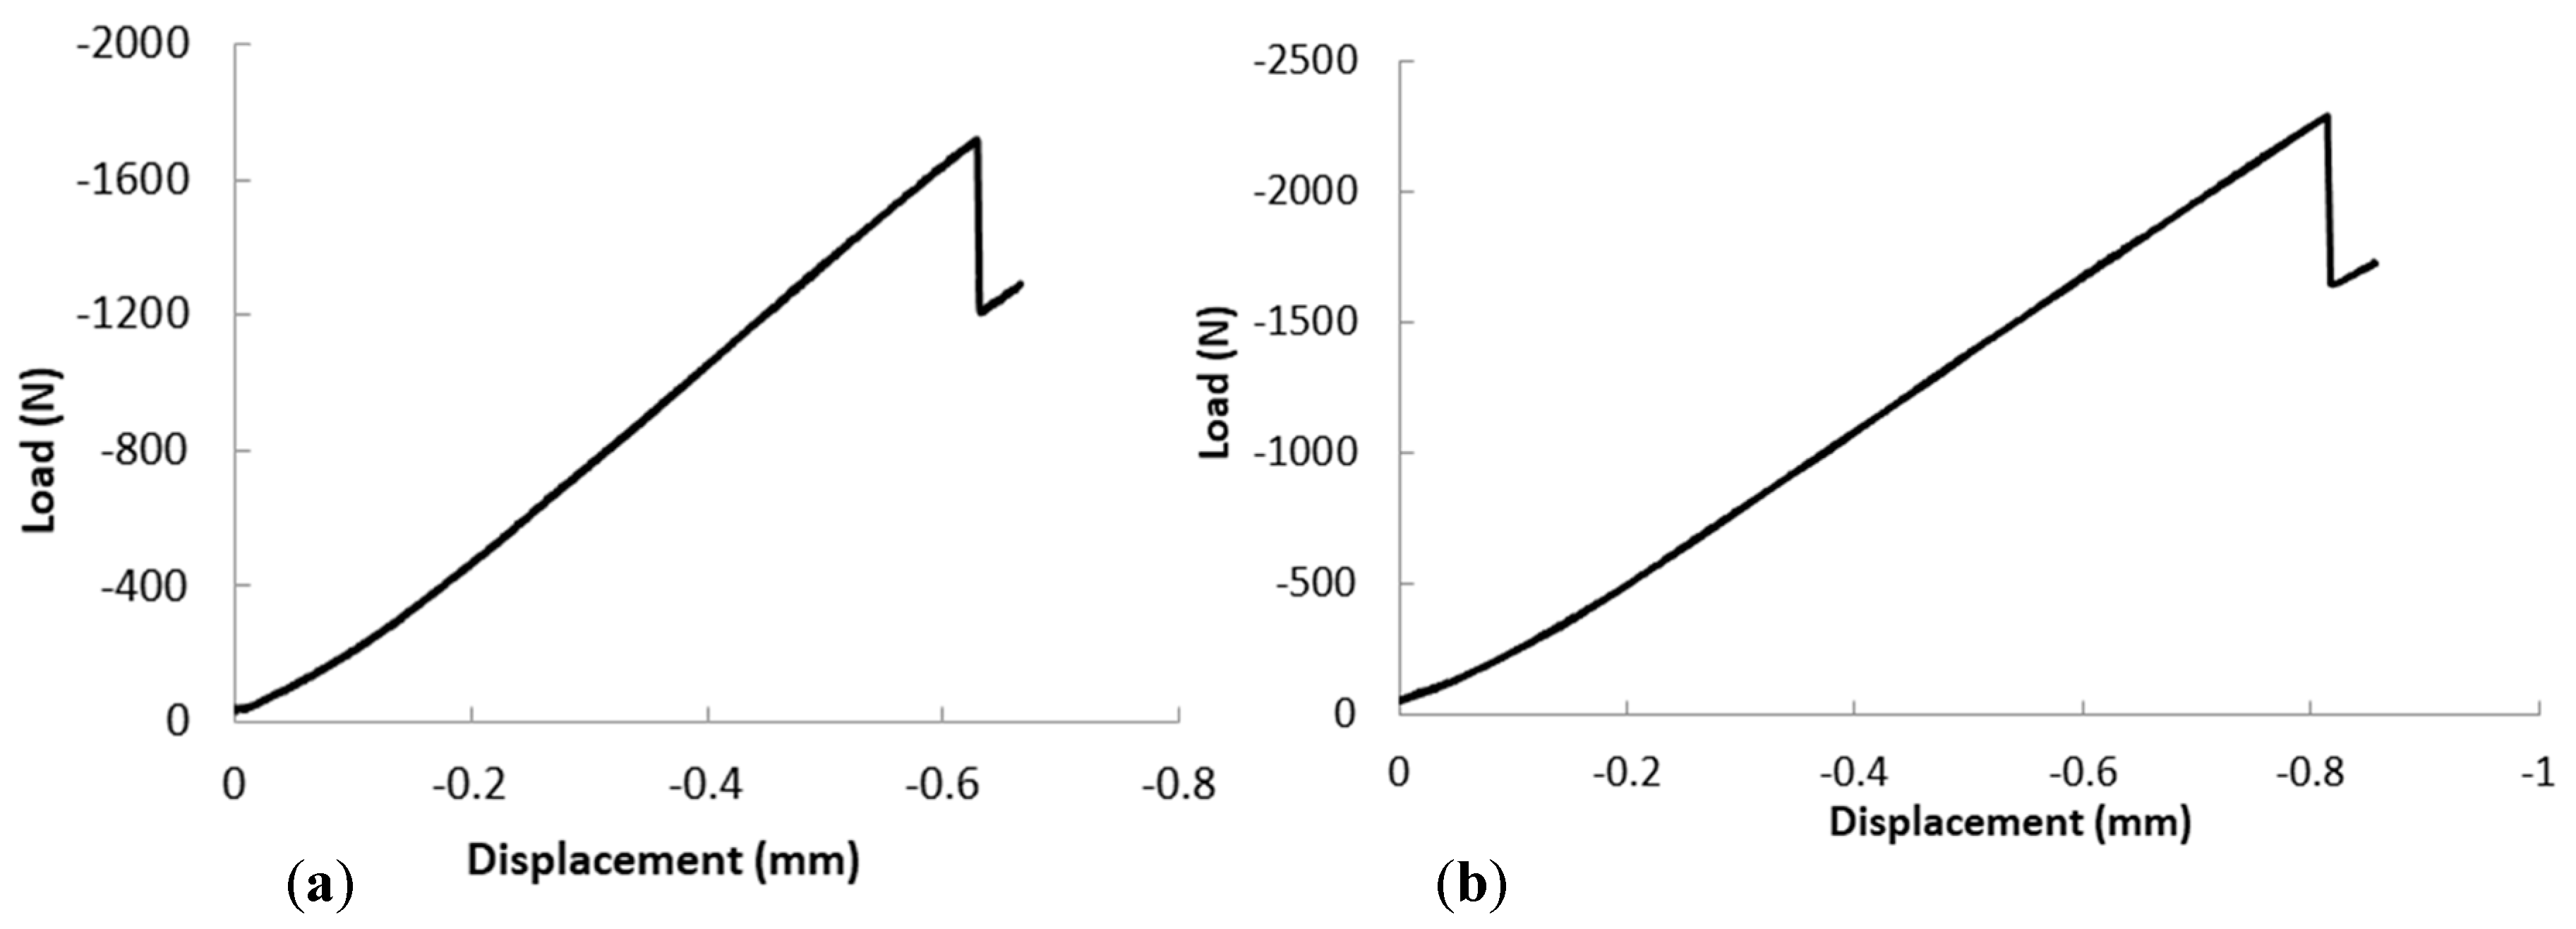
2.1. Materials, Testing Specimens, and Experimental Results

In total, 3 groups of experiments were performed in the present investigation. The first group dealt with the standard tensile tests, aiming to obtain the stress-strain curves of the two biomaterials being analyzed. The second group, however, corresponded to fracture tests on cracked specimens, aiming to measure the corresponding fracture toughness. The last group corresponded to fracture tests on notched specimens, aiming to experimentally investigate the weakening effects of stress concentrations on the fracture behavior of the two materials, particularly their load carrying capacity.
The two materials used in this research are referred to as BC (bone cement) and DM (dental material). BC required 40 g of sterile powder (composed of Polymethyl-methacrylate 83.9%, Benzoyl peroxide 2.8%, Barium sulfate 9.6%, Gentamicin sulfate 3.8%) per 16.4 gr of sterile liquid (composed of Methyl-methacrylate 85.3%, Butyl-methacrylate 13.2%, N,N-dimethyl-p-toluidine (max 1.5%) and Hydroquinone (20 ppm)), the supplier being Groupe Lépine (France). DM was generated by combining 500 g of Polymethyl-methacrylate powder per 250 mL of liquid Methyl-methacrylate (supplier: Acropars Pharmaceutical Industry, Tehran, Iran).
In order to generate the two biomaterials, there are two common methods. In the first method, the powder and the liquid are manually mixed for 60 s at 23 °C. In the second method, known as the vacuum mixing method, powder and liquid are poured in molds and mixed in a vacuum chamber pressurized at 0.7 bar [31]. In the current study, the second method was used due to its ability to minimize the porosity of the material. It consists of three stages: during the first 15 s, the material was pressurized without any mixing; in the next 30 s, mixing and pressurizing were applied simultaneously; finally, during the last 15 s, the material was left out under constant pressure without mixing. To avoid bubble generation, the mixing process was performed in the vacuum chamber. After the mixing process, the samples were subjected to room temperature for 20 min for the curing process to be completed. Finally, the specimens were removed from the molds. These molds had been previously made of Poly Lactic Acid by 3D printing, with the required geometries to obtain Brazilian disk (BD), rectangular (DM), and semicircular bend (SCB) specimens (BC material). In the final stage of specimen generation, computer numerical control (CNC) machining was used to introduce U-notches with 1, 2, and 4 mm radii to BD samples. Sharp cracks were also introduced to the rectangular and the SCB specimens using a razor blade, with the aim of measuring the fracture toughness of the two biomaterials.
The geometry of the resulting specimens is shown in Figure 1. The thickness of the UNBD specimens, the cracked rectangular samples, and the cracked SCB specimens was equal to 6 mm, 3 mm, and 6 mm, respectively. The tip-to-tip length of the central slot of the UNBD specimens was 25 mm, and the crack lengths of the rectangular and SCB samples were 8 mm and 10 mm, respectively. Additionally, and according to ASTM-D638-IV [32], 3 specimens (per material) were manufactured with the geometry described in Figure 1d, with the purpose of conducting standard tensile tests, which were performed with a displacement rate of 0.5 mm/min.
During the tensile tests, digital image correlation (DIC) was used to measure the displacements, and a 10 kN load cell was used to measure the loads. A summary of the tensile test results is given in Table 1, while Figure 2 shows two examples of the obtained load-displacement curves. These reveal linear-elastic behavior in the BC material and evident nonlinear behavior in the DM.
Three point bending (3PB) fracture tests were also performed on the SCB (BC) and cracked rectangular (DM) specimens in order to determine the fracture toughness. This conversion can be made by calculating the value of the mode I stress intensity factor (SIF) associated with the critical load using the finite element (FE) analysis, which is actually equal to the fracture toughness of the material. The fracture loads of the BC material (UNBD and cracked SCB specimens) and the DM (UNBD and cracked rectangular specimens) are gathered in Table 2. In these tables, C indicates the compression tests on the UNBD specimens. Meanwhile, SCB and R denote the bending tests performed on the cracked specimens. Further, the numbers 1, 2, and 4 correspond to the radius of the notch tip, and numbers 8 and 10 indicate the length of the pre-existing cracks. Finally, Pi (i = 1, 2, 3) and Pm denote the fracture loads of the different tests performed and the resulting mean values. Beyond the fracture analyses performed below on the notched specimens, Table 1 gathers the resulting values of fracture toughness (KIC) derived from the bending tests (SCB-10 and R-8).
As an example, the load-displacement curves of 2 tests performed on UNBD specimens are shown in Figure 3.
It can be seen that, regardless of the brittle or ductile behavior observed in the tensile tests, the fracture curves in both materials are basically linear up to the final fracture. In other words, no significant nonlinear portion is observed in the curves of the cracked and UNBD specimens made of DM, in contrast to the tensile curve of this material (see Figure 2b). This is caused by the fact that the plastic deformations in the notch/crack tip vicinity are localized, while the displacement shown in the curve corresponds to the cross-head of the test machine, which is not very sensitive to moderate amounts of plasticity located at the defect tip. Accordingly, the displacement of the cross-head cannot capture properly the localized plastic deformations of the notch/crack tip. However, in the tensile specimens without stress concentration, the displacement of the cross-head is almost the same as that of the gage length and hence, it is directly affected by the bulk plastic deformations in the whole cross-section. Consequently, it should be noticed that a linear load-displacement curve in a cracked/notched specimen does not necessarily mean that the material of the specimen is developing perfectly linear elastic behavior, unless the measured displacement corresponds to a point affected by the crack/notch tip ductile behavior (if any).

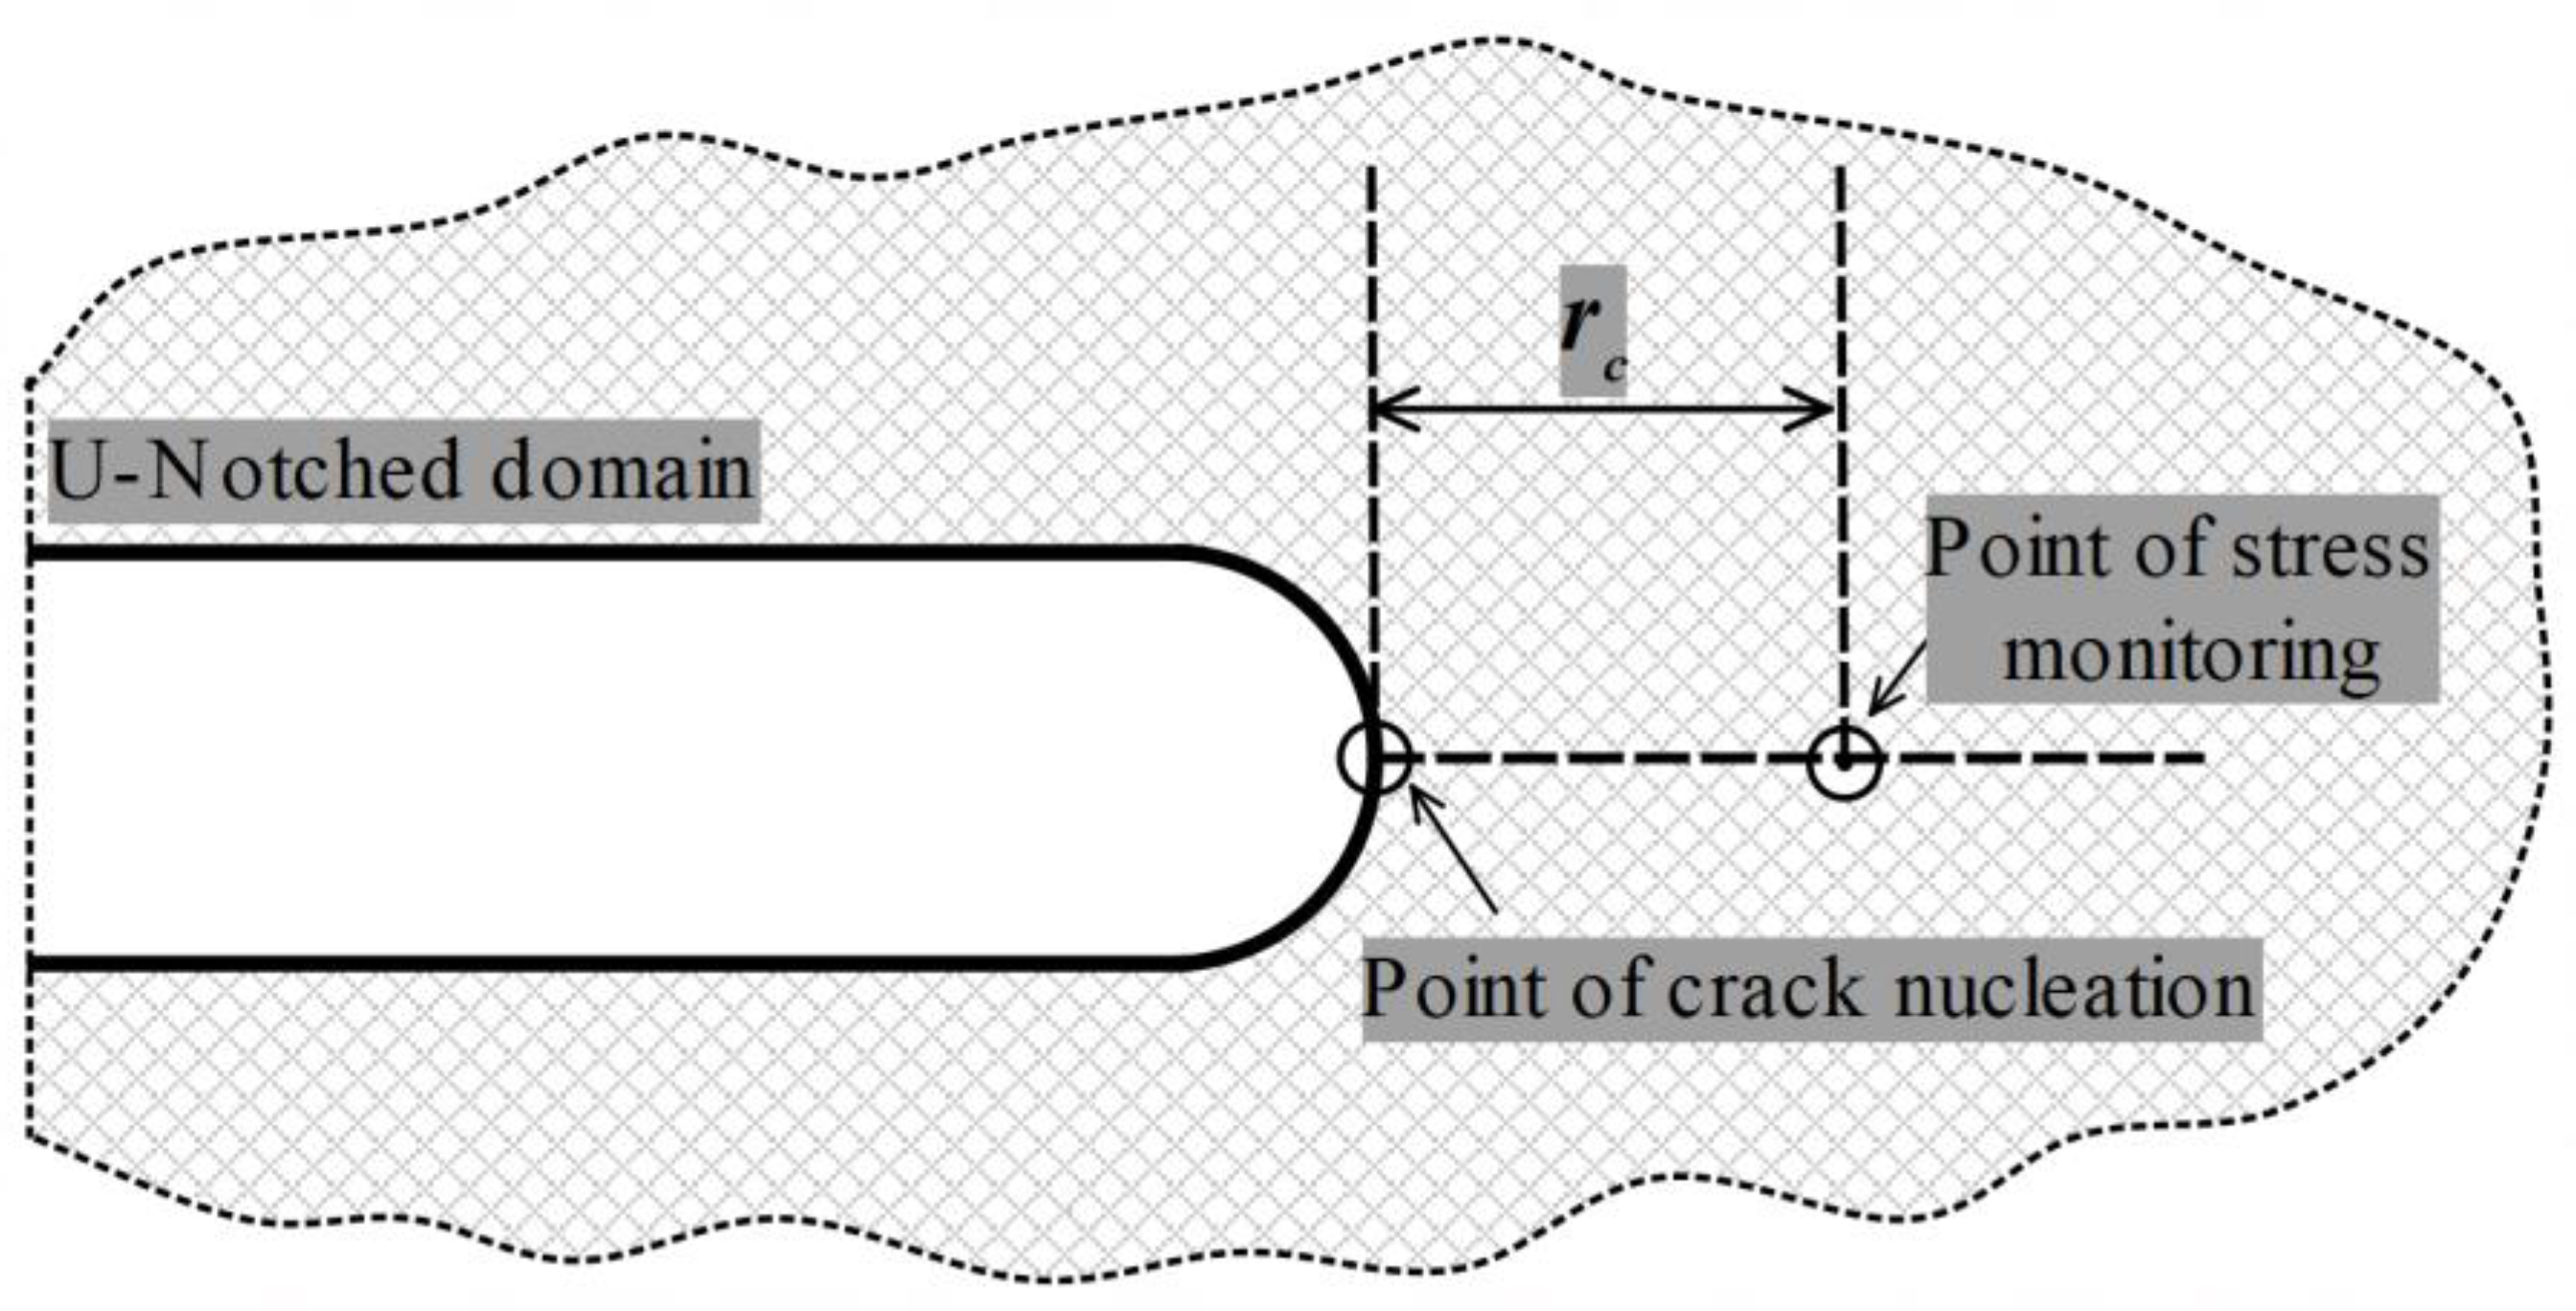
2.2. Stress-Based Fracture Criteria and the Equivalent Material Concept

The maximum tangential stress (MTS) and the mean stress (MS) criteria are described in this section, as two well-known linear-elastic fracture criteria that are used here to estimate the critical loads of the tested UNBD specimens. For the BC material specimens, the 2 criteria were applied in their original forms due to the linear-elastic behavior of the specimens. However, for the DM specimens, these criteria were coupled with the Equivalent Material Concept (EMC) [25] because of their nonlinear behavior developed around the corresponding notch tip.

2.2.1. Maximum Tangential Stress (MTS) Criterion

In 1963, Erdogan and Sih [33] proposed the MTS criterion for estimating brittle failure loads in structures containing sharp cracks under mixed mode I/II loading. In 2009 and 2010, Ayatollahi and Torabi [16,34] extended the MTS criterion to U-notched and round-tip V-notched structures, respectively. A schematic of the failure concept of MTS criterion for U-notches is shown in Figure 4. Based on MTS criterion, fracture in a brittle material takes place when the tangential stress (σθθ) at a particular critical distance in front of the notch tip (rc) reaches the material critical stress (σc). The MTS criterion also assumes that the overall geometry of the notched component and the loading conditions do not affect the critical stress and the critical distance, and hence, rc and σc are assumed to be the material properties. According to the literature (e.g., [35,36,37]), the critical stress for brittle and quasi-brittle materials may be assumed to be equal to the material ultimate tensile strength.
Moreover, the critical distance (rc) can be calculated from Equation (1) [34]:
rc = (1/2π) × (KICc)2,
where KIC is the material fracture toughness.
With the aim of estimating the fracture load of biomaterial cracked specimens considering the size effects, Akbardoost et al. [38] proposed the modified MTS (MMTS) criterion. A size-dependent critical distance was proposed in that study to be used in the MTS criterion.

2.2.2. Mean Stress (MS) Criterion

The mean stress (MS) criterion states that (brittle) fracture occurs when the average value of the tangential stress over a specific critical distance from the notch tip (dc) reaches the critical stress of the material (σc). The specific critical distance dc is also assumed to be a material property. It can be derived from Equation (2) [39]:
dc = 4 × rc = (2/π) × (KICc)2,
A schematic of the MS criterion would be analogous to that shown in Figure 4 for the MTS criterion, but substituting rc by dc, and averaging the stress over dc, instead of determining the stress at rc.

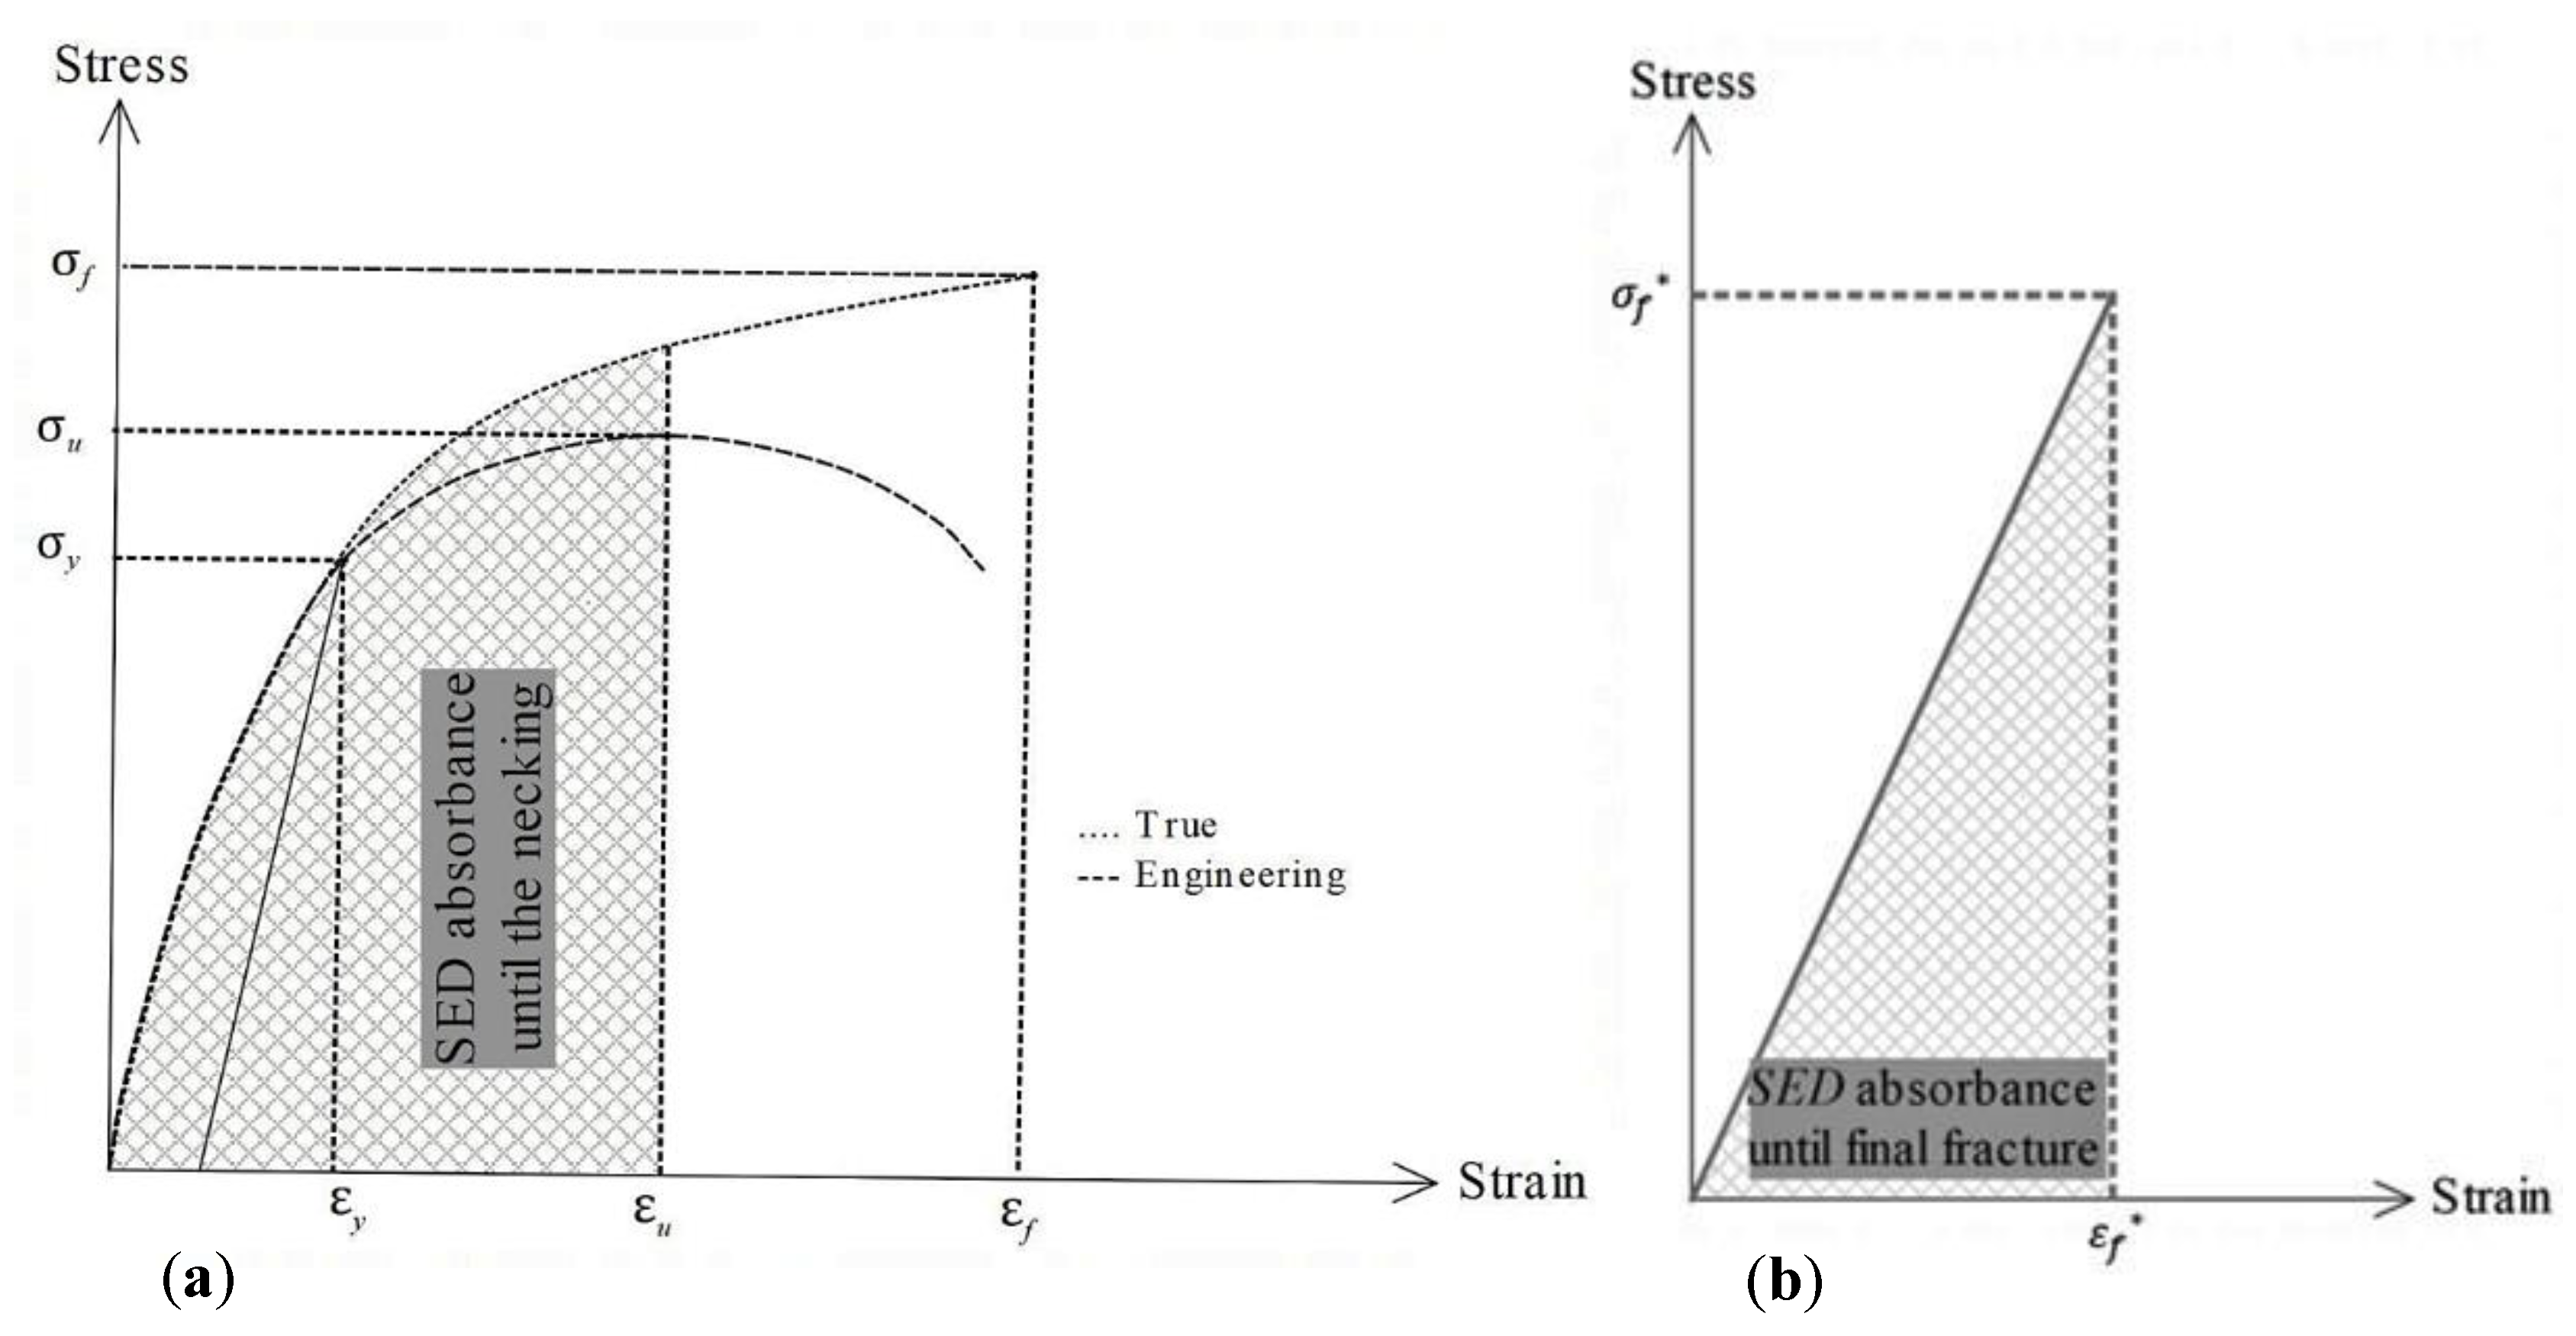
2.2.3. The Equivalent Material Concept

The Equivalent Material Concept (EMC) [25] enables a ductile material with K-based valid fracture toughness to be treated as a virtual brittle material with a different tensile strength (σf*) and the same fracture toughness and elastic modulus. According to the EMC, obtaining the tensile strength of the equivalent material requires some assumptions regarding the necking in the real ductile material and the onset of sudden fracture in the virtual brittle material.
The strain energy density (SED) required for initiation of necking in the real ductile material shown in Figure 5a is assumed to be equal to the SED required for sudden fracture in the virtual brittle material illustrated (Figure 5b). These SED values can be derived from the shaded areas in Figure 5a,b. The analysis of the elastic–plastic fracture of a notched ductile material can be replaced by the analysis of the brittle fracture of the corresponding virtual notched material. With all this, the EMC makes it possible to predict the fracture load in notched ductile components by using brittle fracture criteria.
The grey area in Figure 5b indicating the SED absorption of the equivalent brittle material until fracture (SEDf) can be written as:
SEDb = (1/2) × σf* × εf* = σf*2/2E,
By taking into consideration the main assumption of EMC in the equivalence of the SED values of the brittle and ductile materials (SEDb = SEDd), the tensile strength of the equivalent material (σf*) can be computed as follows:
SEDd = σf*2/2E ⇒ σf* = (2E × SEDd)0.5,
where E is the elastic modulus (identical for the real and the virtual material) and SEDd is the SED value of the ductile material until necking (shaded area in Figure 5a). Once the tensile strength (σf*), elastic modulus (E), and fracture toughness (KIC) of the equivalent material are known, they can be used in both the MTS and MS criteria to estimate the load-carrying capacity (LCC) of the nonlinear material (as is the case below for the DM UNBD specimens).

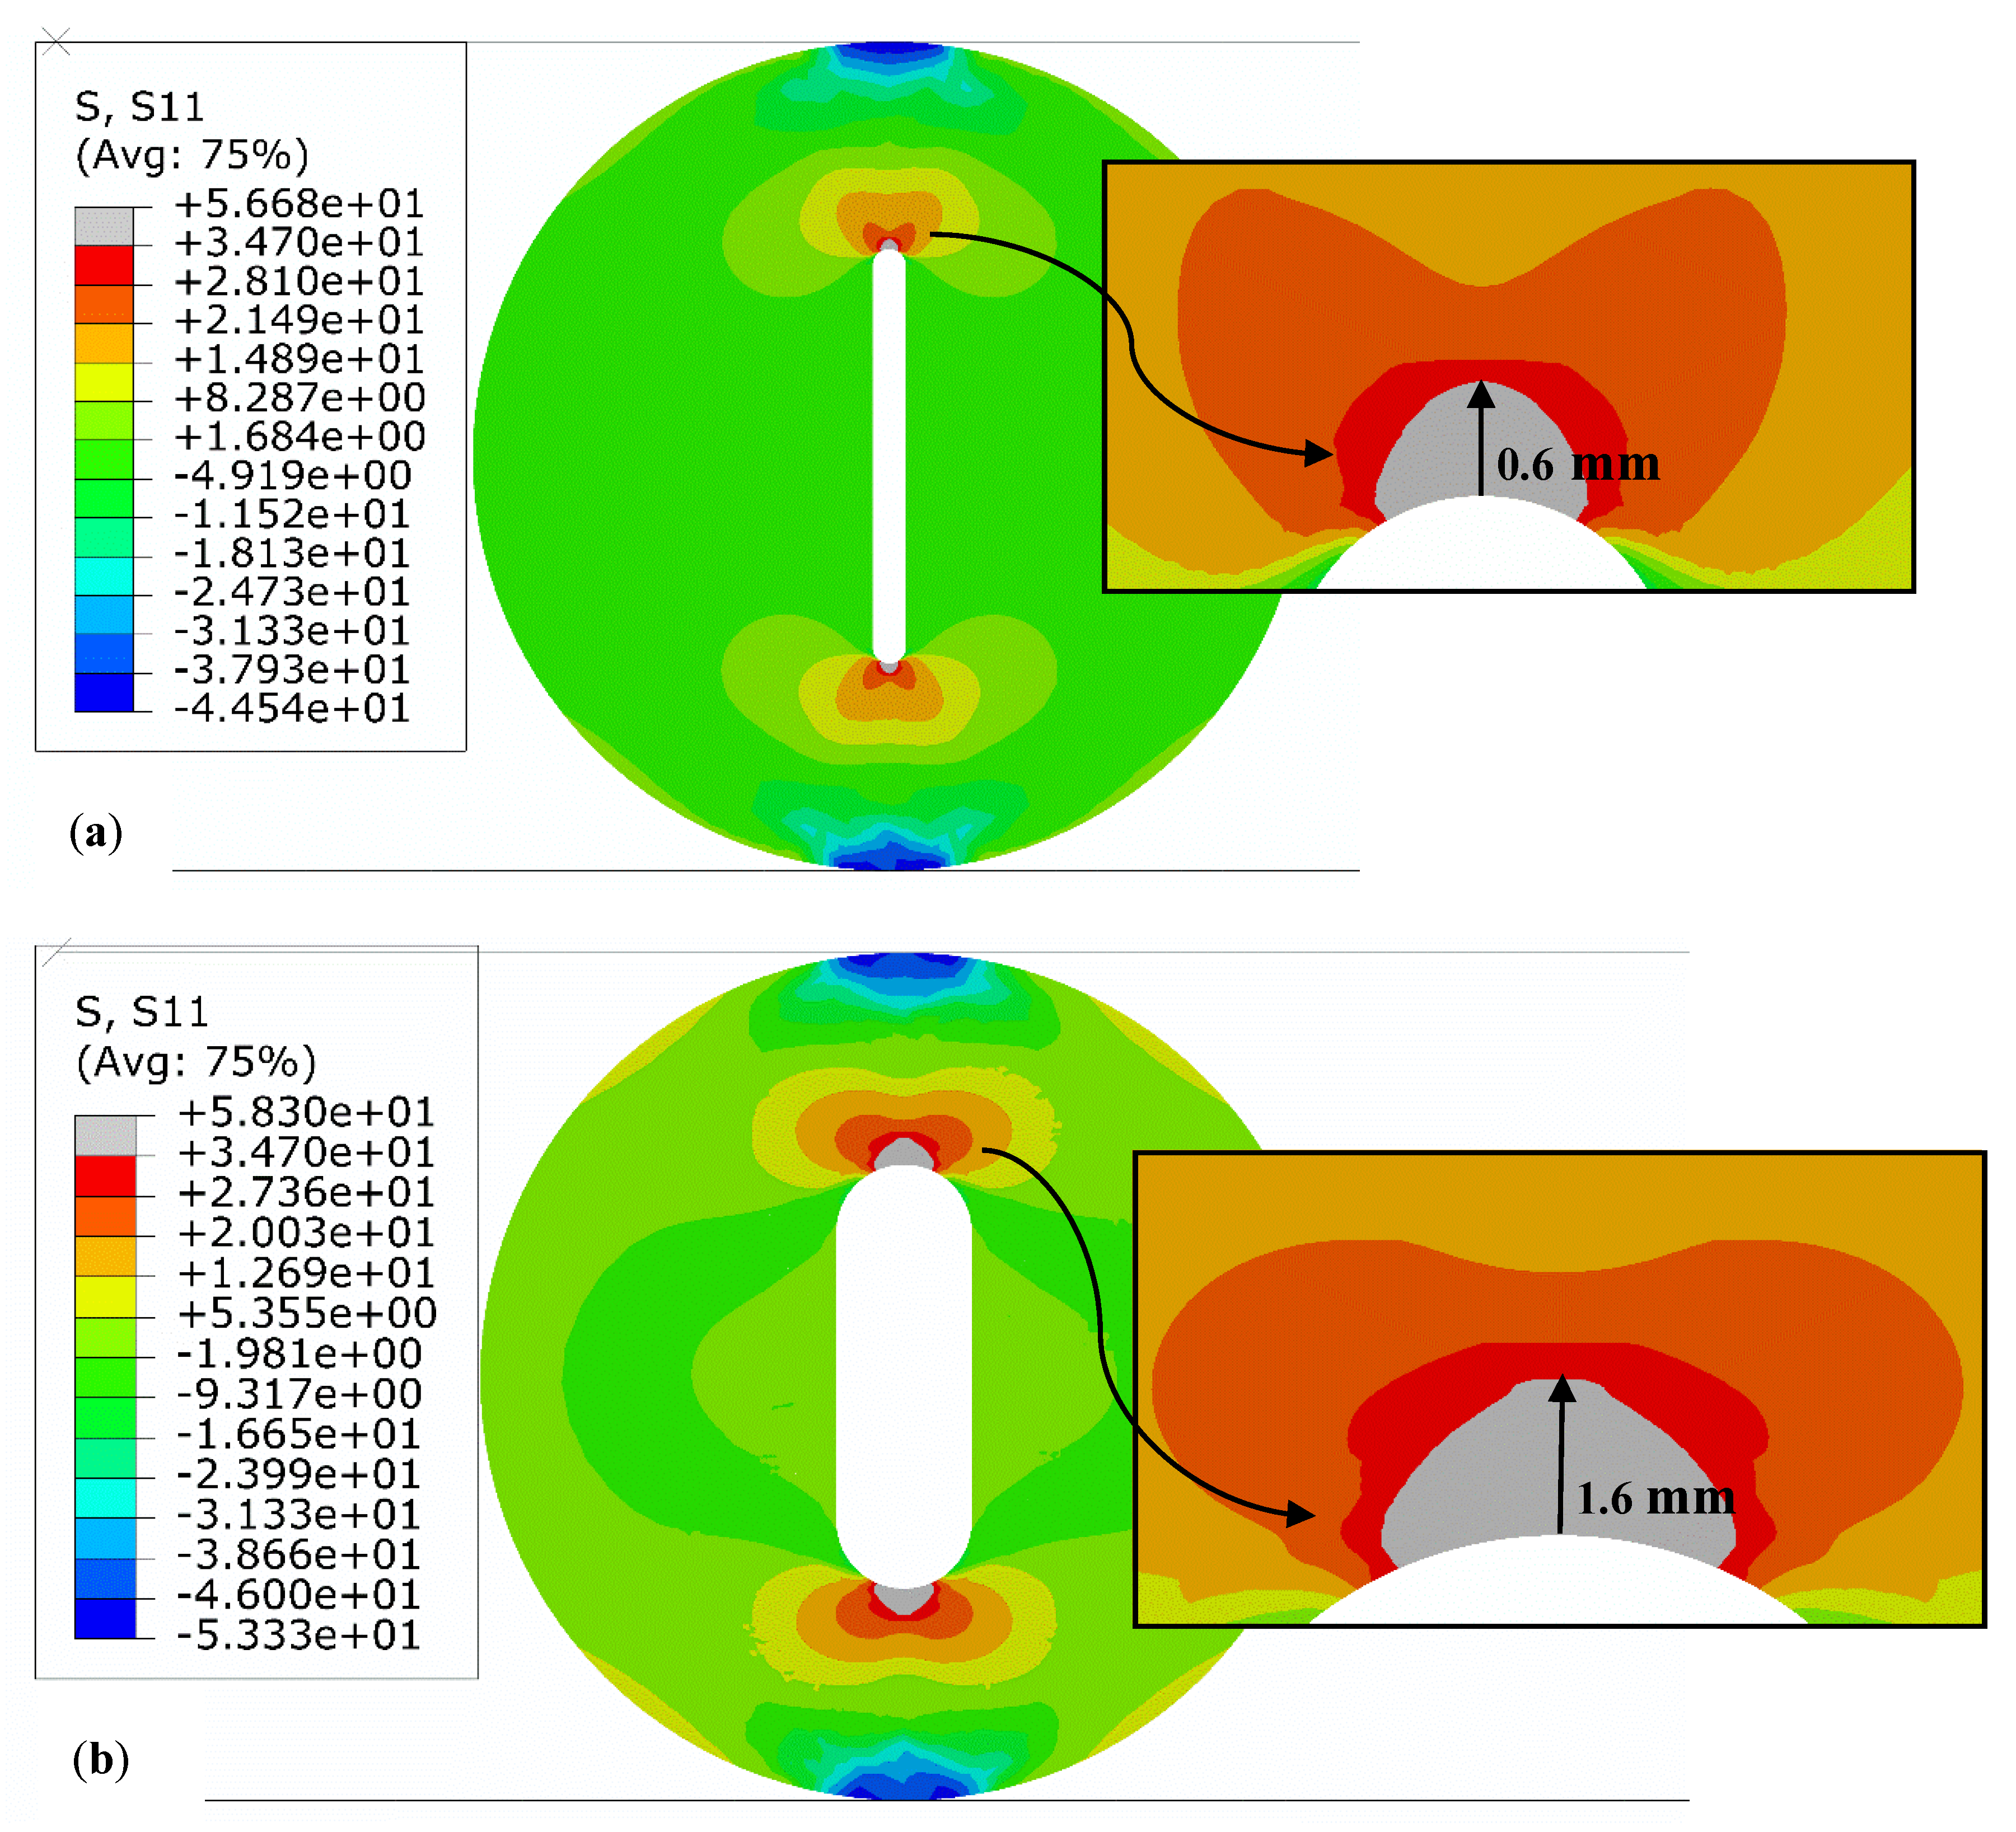
2.3. Finite Element Analyses

At this point, fracture mechanics analysis of cracked specimens is needed to convert the experimentally achieved fracture loads into the associated values of fracture toughness of the two biopolymers. This is usually done by means of finite element (FE) simulations and performing linear–elastic analysis. Moreover, as it is evident from Section 2.2.1 and Section 2.2.2, the application of both the MTS and the MS fracture criteria to predict the LCC of UNBD samples, requires the linear–elastic stress distribution around the U-notches to be determined. Hence, in this subsection, the FE simulation and analysis of the cracked and notched specimens utilized in the experimental program is performed.
The UNBD, cracked rectangular, and cracked SCB specimens were analyzed by finite element method using eight-node plane-stress quadratic elements. Regarding the boundary conditions, it should be explained that for the cracked rectangular and cracked SCB specimens tested under three-point bending, the displacements of the specimens at the bottom supports were set equal to zero in vertical direction, and the load was applied to the specimen at the top of the specimen as a concentrated compressive nodal force. For the UNBD specimens, however, the lowest node sticking to the bottom horizontal plate was fully fixed, and the concentrated compressive nodal force was applied at the opposite node located at the top of the specimen. Here, it should be noticed that, because of significant stress gradient at the crack and the notch tips, refined meshes were required to achieve accurate numerical results. In order to find the largest mesh size below which the numerical results are independent of the mesh size, a mesh sensitivity analysis was performed: the model was continuously refined until reaching a mesh size below which the numerical results are not affected by the mesh size. In this case, the final mesh size was fixed at 0.02 mm. A sample mesh pattern for the cracked rectangular and SCB specimens is shown in Figure 6.
To obtain the fracture toughness of the two biomaterials, both the cracked rectangular and SCB specimens (two well-known accepted fracture toughness specimens) were simulated in the FE software under three-point bend loading. The experimentally achieved critical loads (average values) of the cracked specimens reported in Table 2 (145 N and 333 N for the rectangular and the SCB samples, respectively) were applied to the corresponding FE models. Then, the value of the mode I stress intensity factor (SIF) KI for each specimen was directly computed from the FE models. These values correspond to the fracture toughness of the two materials being analyzed, with 1.2 MPa.m0.5 for the BC material and 1.32 MPa.m0.5 for the DM. As shown in Figure 2, the BC material has a brittle behavior with negligible capacity for developing plastic deformations. Therefore, the value of 1.2 MPa.m0.5 is considered here as the final value of its fracture toughness for this material. The DM, however, due to its capacity to develop elastic–plastic behavior (see Figure 2), experiences non-negligible plastic deformations at the crack tip neighborhood. Thus, the virtual crack extension method (VCEM) was used to modify the value of the initial fracture toughness by considering the impact of the plastic area around the crack tip. With this aim, the length of the initial crack was virtually extended. According to this method, the radius of the plastic area around the crack tip at the crack growth onset, rp, should first be calculated and secondly added to the initial length a0 to obtain the virtual crack length. The modified crack length (am) can be calculated as follows:
am = a0 + rp,
Therefore, the cracked rectangular specimen was simulated with the modified crack length and the new value of KI was computed by using the average fracture load of the cracked rectangular specimens (i.e., 145 N). As previously mentioned, this value is equal to the modified fracture toughness of the DM. The value of rp was estimated by using the Irwin’s theory [40] presented in Equation (6):
rp = (1/π) × (KICy)2,
The fracture toughness KIC and the yield strength σy are equal to 1.32 MPa.m0.5 and 34.7 MPa, respectively, resulting in an rp value of 0.46 mm. Finally, the simulation of a rectangular sample with an 8.46 mm initial crack length (the resulting value of am), provides a modified fracture toughness (KIC*) for the DM equal to = 1.41 MPa.m0.5.
Considering the values of KIC (1.2 MPa.m0.5) and σu (36.6 MPa) of the BC material, and using Equations (1) and (2), the values of rc and dc are 0.17 mm and 0.68 mm, respectively. Likewise, considering the values of KIC (1.32 MPa.m0.5) and σu (48.7 MPa) for the DM, the values of the critical distances rc and dc are 0.12 mm and 0.48 mm, respectively. With all this, an arbitrary external load of 100 N was applied to the FE models of UNBD specimens, and the linear elastic tangential stress (σθθ) at the critical distance in front of the notch tip (i.e., rc = 0.17 mm for BC material and rc = 0.12 mm for the DM), was computed. After that, by using the failure concept of the MTS fracture criterion, the fracture loads of the UNBD specimens were theoretically estimated. At fracture, the tangential stress at the critical distance for the BC and DM specimens should reach 36.6 MPa and 48.7 MPa, respectively. Therefore, it is possible to simply estimate the fracture loads (Pf) of the UNBD specimens using Equations (7) and (8):
Pf = (36.6/σθθ) × 100 N for BC material,
Pf = (48.7/σθθ) × 100 N for DM,
The fracture loads can also be predicted according to the MS criterion. The difference is that the mean value of tangential stress over the critical distance dc ((σθθmean) must be used, leading to:
Pf = (36.6/σθθmean) × 100 N for BC material,
Pf = (48.7/σθθmean) × 100 N for DM,
Equations (8) and (10) present the fracture load predictions of the DM UNBD specimens assuming that the behavior of this material is linear elastic. However, due to the elastic–plastic behavior of the DM, such Equations should be modified using the EMC. This means that the critical distances rc and dc should be recalculated, and also that the critical stress value (σc) should equate to the tensile strength of the equivalent elastic material (σf*), instead of using the ultimate tensile strength of the real material (DM). The area under the true stress-strain curve until necking (i.e., the SED value derived from Figure 2b) was equal to 1.33 MPa. Using Equation (4), the value of σf* was 87.4 MPa. Thus, using KIC* = 1.41 MPa.m0.5 and σf* = 87.4 MPa in Equations (1) and (2), the rc and dc values for the EMC-MTS and EMC-MS coupled criteria were 0.04 mm and 0.16 mm, respectively. Finally, the fracture loads by the EMC-MTS and EMC-MS criteria can be calculated according to Equations (11) and (12). Equation (11), for the MTS criterion, includes the tangential stress at a critical distance of 0.04 mm from the notch tip (σθθ) and for an arbitrary load of 100 N. Analogously, Equation (12), for the MS criterion and for the same arbitrary load of 100 N, includes the mean value of the tangential stress over the critical distance of 0.16 mm from the notch tip (σθθmean).
Pf = (87.4/σθθ) × 100 N for DM,
Pf = (87.4/σθθmean) × 100 N for DM,

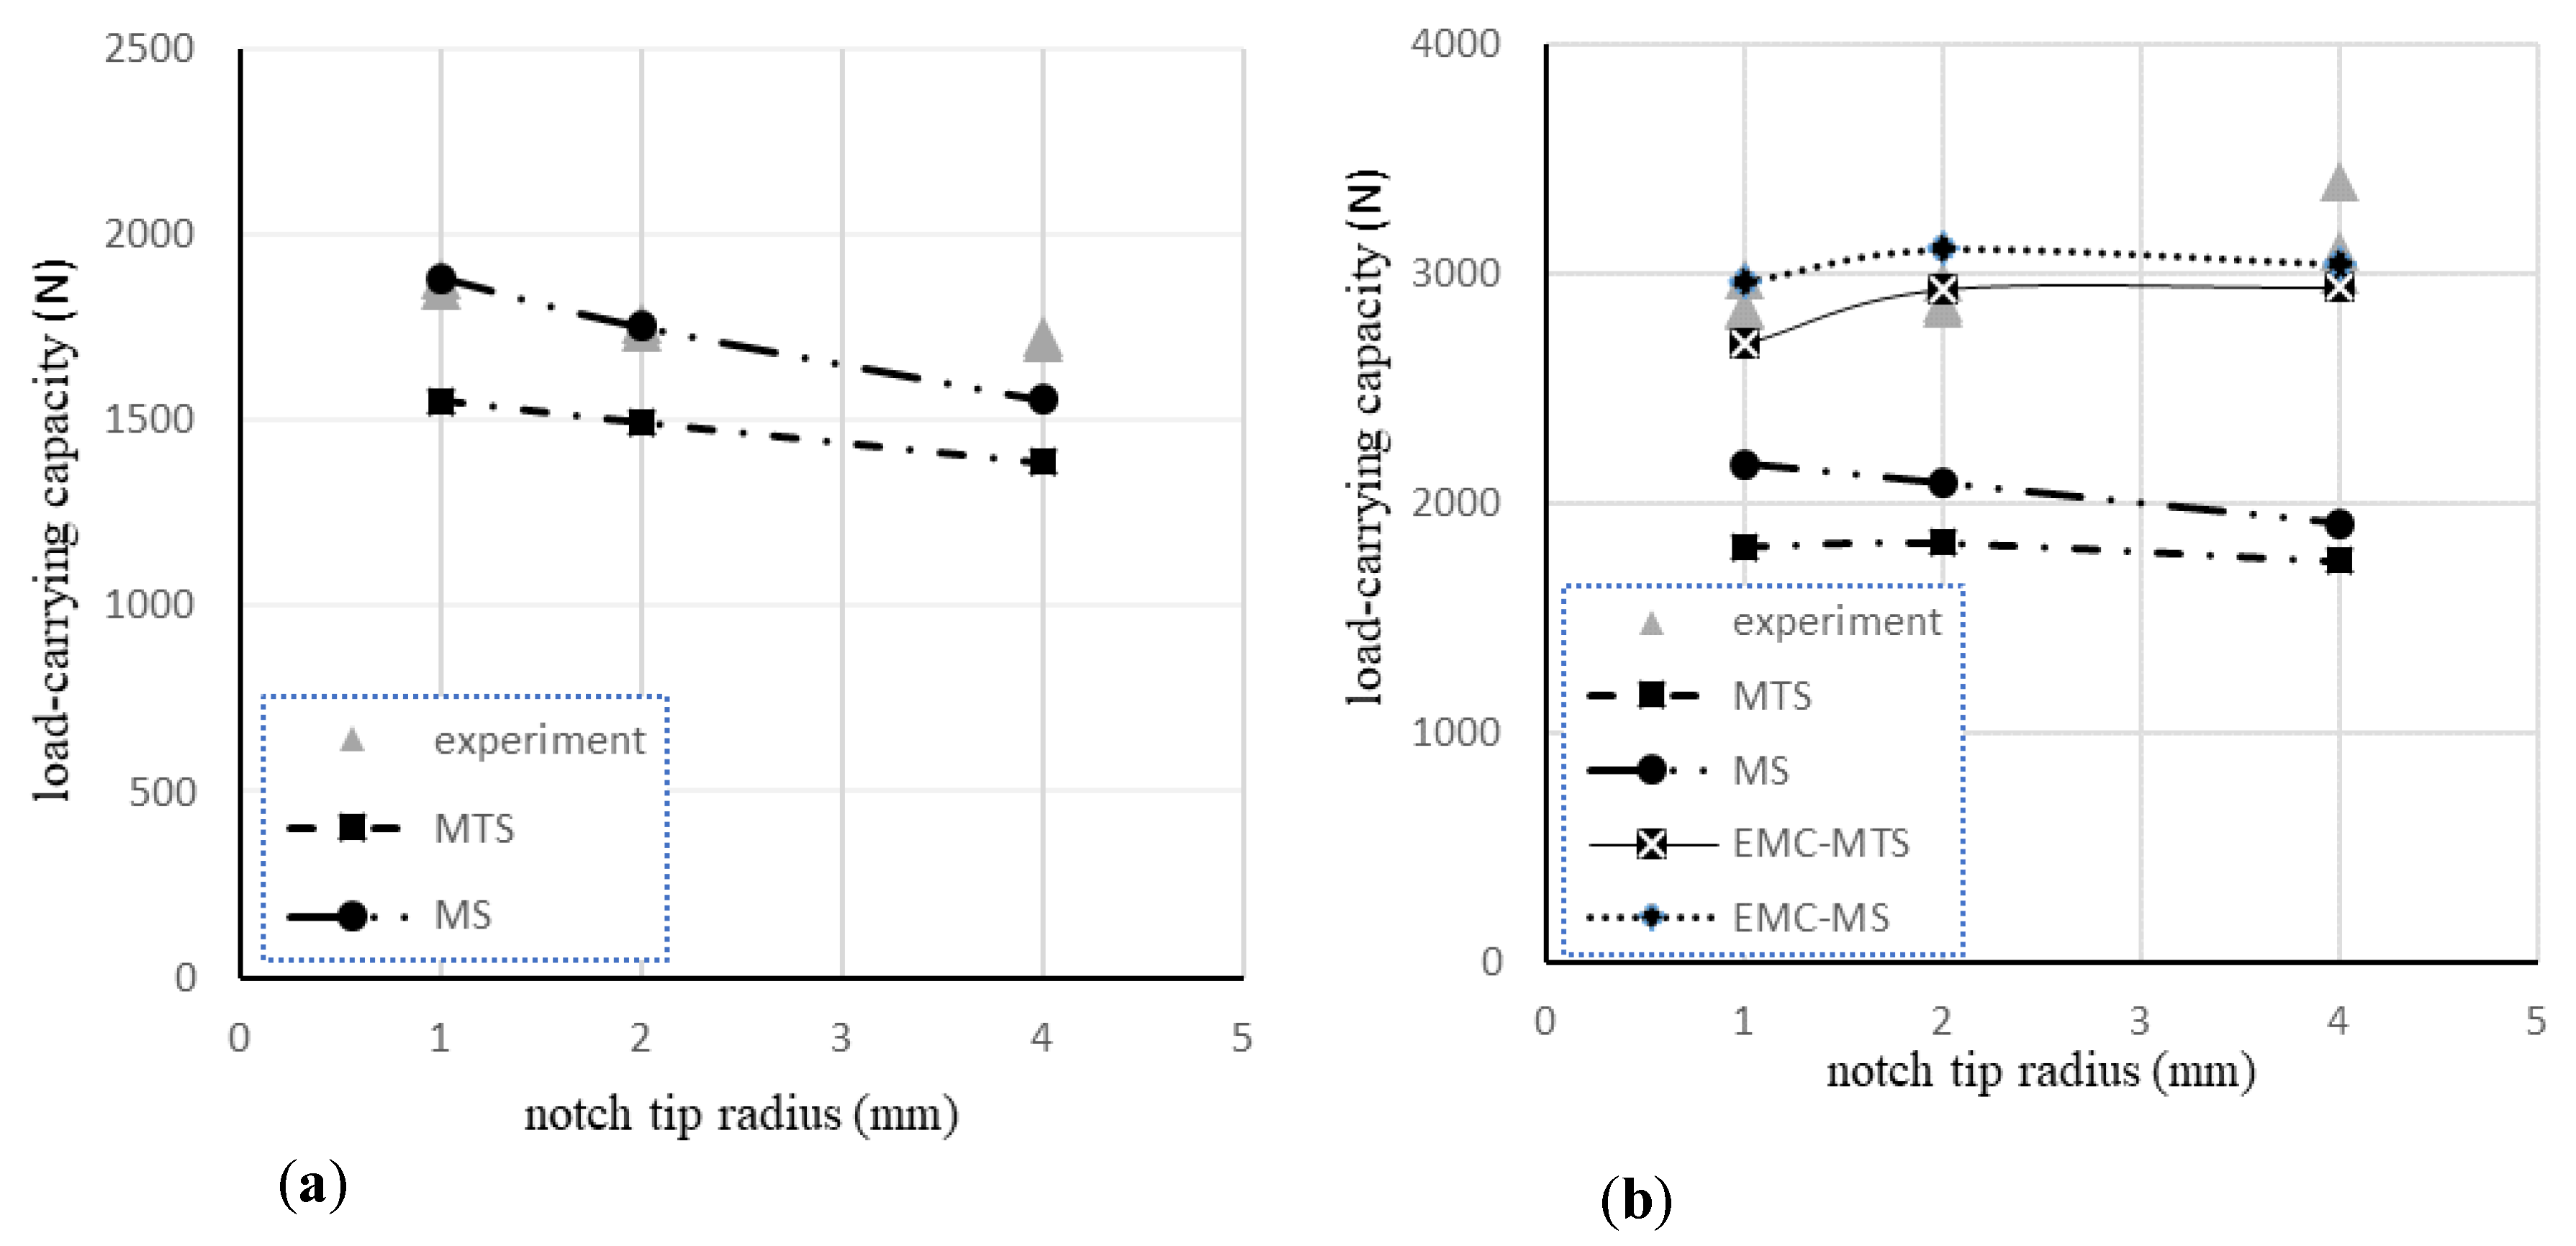
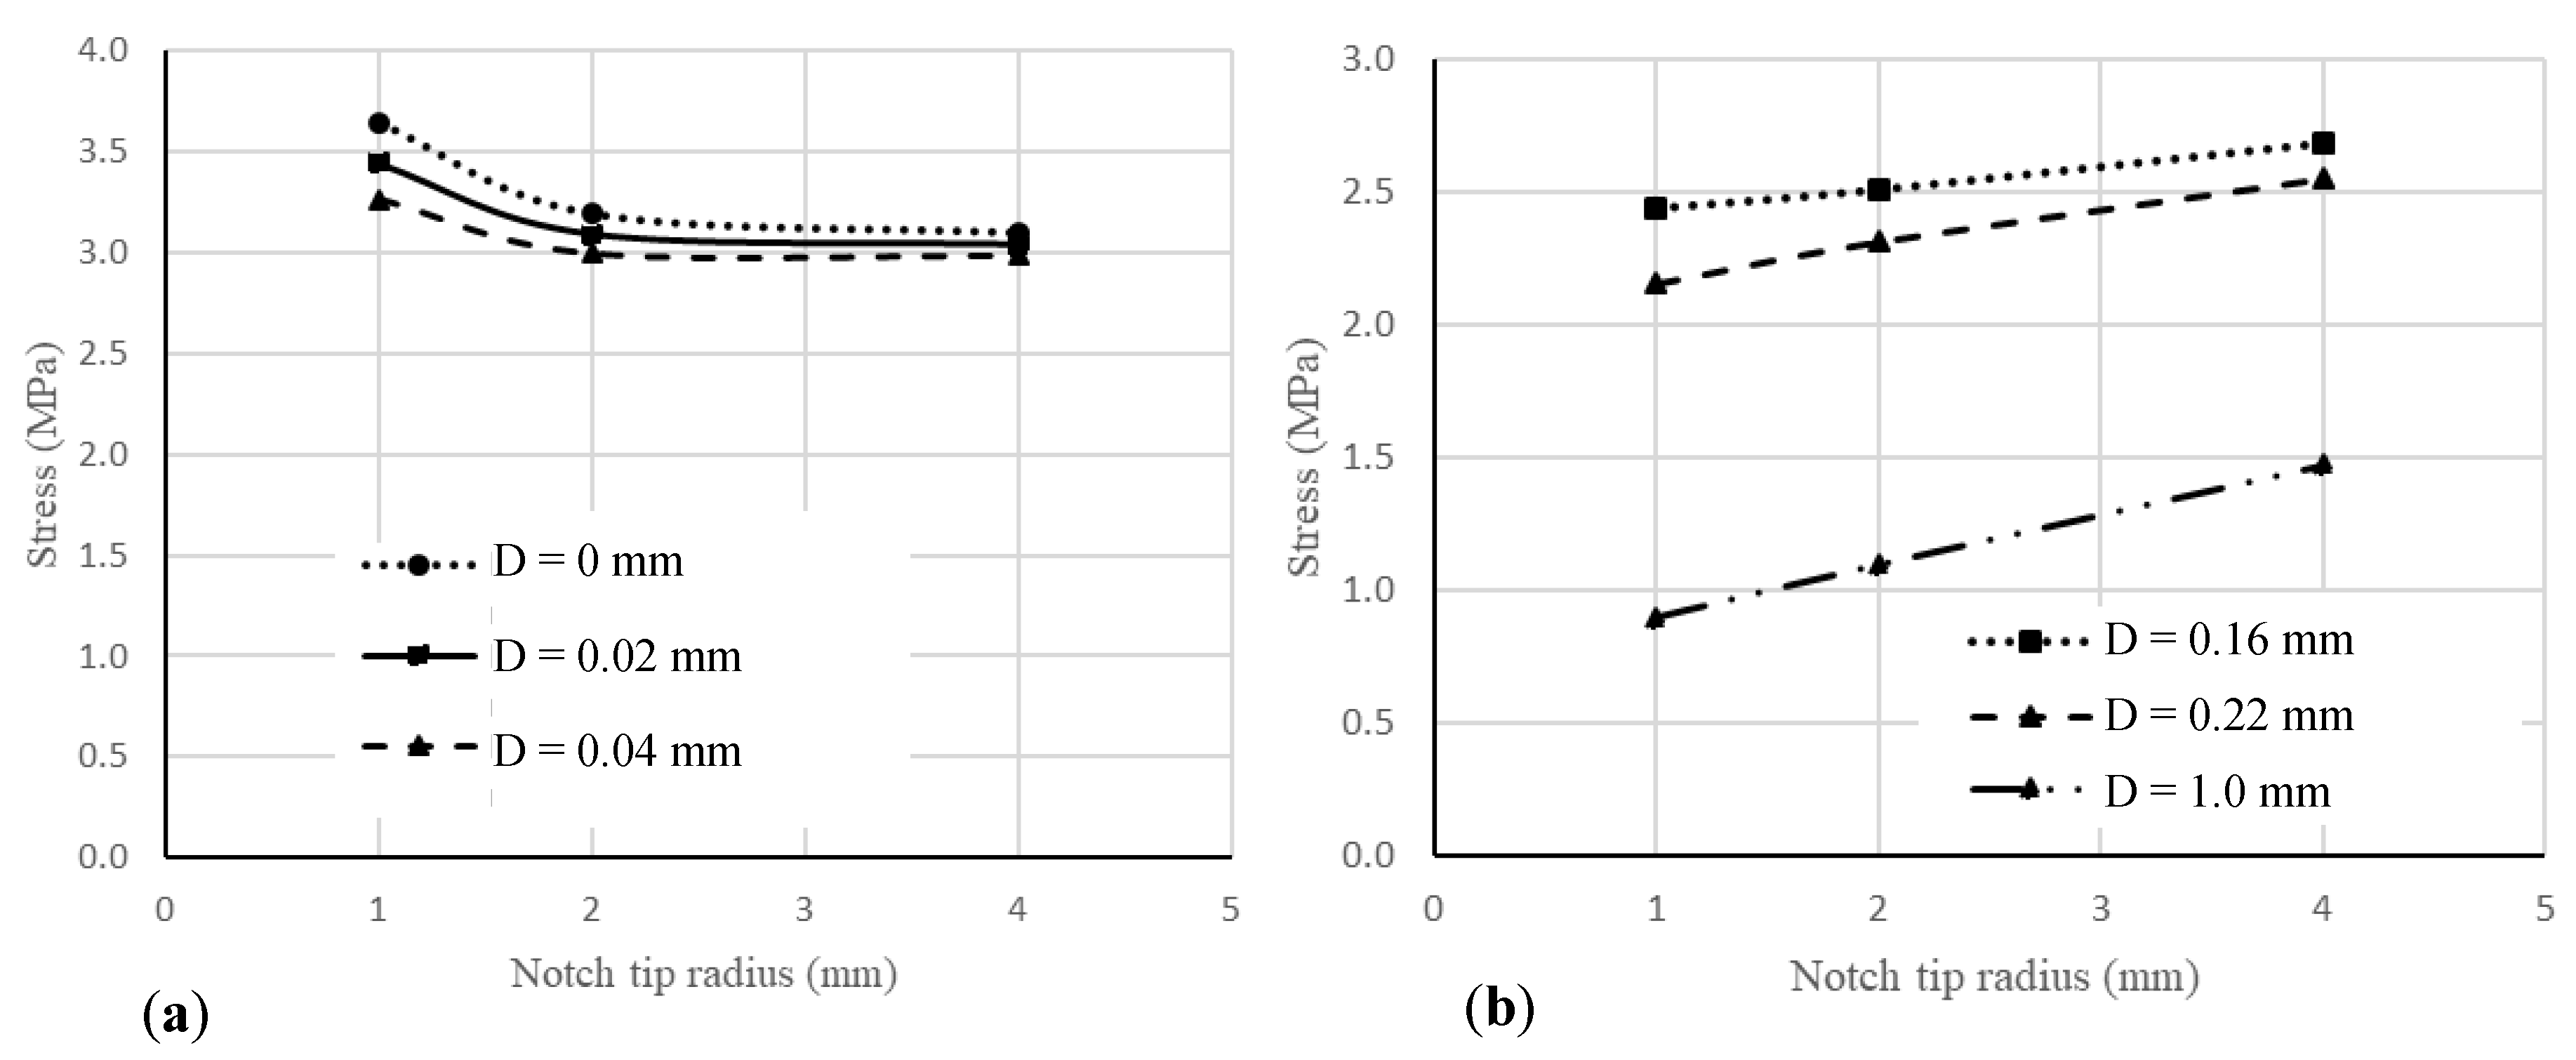
3. Results and Discussion

Figure 7a shows the variations of the load-carrying capacity (LCC) of the BC UNBD specimens versus the notch tip radius for MTS and MS criteria as well as for the experiments. Analogously, Figure 7b also represents the results of MTS, MS, EMC-MTS and EMC-MS criteria for the DM UNBD specimens together with those of the fracture tests. Moreover, Table 3 presents the discrepancies (%) between the theoretical and experimental results. Negative values mean that the predictions underestimate the experimental critical loads, whereas positive values imply overestimations of the load-carrying capacity.
According to Figure 7a and Table 3, when predicting fracture loads in the BC material, the MS criterion provides more accurate results than those obtained with the MTS criterion. Concerning the DM, Figure 7b and Table 3 show that both the EMC-MTS and the EMC-MS coupled criteria provide more accurate predictions than those provided by the MTS and MS criteria. This is because both coupled criteria consider the nonlinear behavior of the DM. The accuracy of both coupled criteria is similar, and since it is easier to apply the EMC-MTS criterion and it seems more conservative, this latter option is recommended here to analyze biomaterials with similar levels of nonlinear behavior.
Figure 8 illustrates the variations of linear elastic tangential stress versus the notch tip radius at different distances (0 mm to 1 mm) from the notch tip, for an arbitrary load of 100 N. As mentioned before, for the DM UNBD specimens, the critical distance rc of EMC-MTS criterion is found equal to 0.04 mm. In Figure 8a it is observed that, at a distance of 0.04 mm, the stress significantly decreases when comparing specimens of notch radii 1 mm and 2 mm, and develops a much smaller decrease when comparing 2 mm and 4 mm radii. This implies that the fracture load increases considerably from UNBD specimens with 1 mm notch radius to UNBD specimens with 2 mm notch radius, and has a subsequent slight increase for UNBD specimens with 4 mm notch radius.
However, in the BC material, rc is equal to 0.17 mm. Figure 8b shows the stress at similar distances from the notch tip for different notch radii in UNBD specimens (again, for an arbitrary load of 100 N). In this particular case of rc values and specimen geometry, it can be observed that the higher the notch radius the higher the resulting stress, which implies that critical loads decrease with the notch radius. This result justifies not only the evolution of the critical load estimations, but also the evolution of the experimental results (which are in agreement).
However, when applying the MTS (or the MS) criterion to the DM, it can be observed that the predictions generally reveal a decrease in the load-carrying capacity when the notch radius increases, something which is quite different from the experimental observations (see Figure 7b). This is because of the effects of the plastic zone that forms around the notch tip during loading. Figure 9 shows an example of elastic–plastic finite element (FE) analysis, that demonstrates that the size of the plastic zone at the onset of fracture increases by increasing the notch tip radius, and also that this size is not negligible if compared to other relevant dimensions (e.g., rc). These plastic zones lead to the development of larger amounts of energy before fracture, and then to increases in the load-carrying capacity. As a consequence, the MTS criterion, which does not take into account the influence of the plastic deformations on fracture, is not an appropriate criterion for fracture load predictions of DM UNBD specimens. In other words, the plastic zone in the notch tip vicinity plays a vital role in assessing the fracture behavior of UNBD specimens with elastic–plastic behavior, and purely linear–elastic criteria, such as the MTS and the MS, do not provide accurate predictions.
In order to determine the effective plastic zone size (EPZS) at fracture onset for the DM UNBD specimens, three elastoplastic FE analyses were carried out, in which the true stress-strain curve of the DM is used as the material property. Figure 9 shows two examples of the contours of tangential stresses (at fracture onset) in UNBD specimens with notch tip radii of 1 and 4 mm, together with their corresponding EPZSs, which were calculated as 0.6, 0.9, and 1.6 mm for notch radii of 1, 2, and 4 mm respectively.
To determine the type of ductile failure regime in the UNBD polymeric specimens tested, the EPZS should be compared with the effective ligament size (ELS), which is that part of the ligament encountering tensile stresses (i.e., 6 mm). The ELS can be simply obtained from a linear elastic FE analysis, and for the cases being analyzed is equal to (about) 6 mm from the notch tip. From the values obtained, it is obvious that for the notch tip radii 1, 2, and 4 mm, the plastic zone occupies 10%, 15%, and 27% of the ELS. It is then proposed that the fracture regime for the 1 mm notch tip radius is the small-scale yielding (SSY) regime, while for the notch tip radii 2 and 4 mm, it is the moderate-scale yielding (MSY) regime. This is directly related with the fact that, although the two linear–elastic criteria (MTS and MS) provide inaccurate results for the DM predictions, the accuracy becomes lower when the notch radius (and then, the EPZS) becomes larger.
At the end of this section, it should be underlined that some fracture models other than the MTS and MS criteria, which are both based on the Theory of Critical Distances (TCD), have been recently proposed in literature. One of them is the phase-field fracture model [41]. In this model, the fracture problem is described by a phase-field method and by using the Bayesian inversion, the problem can be solved on a rather coarse mesh and the corresponding parameters can be fitted. The possibility of applying the phase-field fracture model to the notch fracture problems investigated in the present contribution can be an interesting topic for future investigations. In parallel, one may want to obtain the numerical FE results from a specific computational code rather than directly from the ABAQUS software. In this regard, different FE approaches can be employed to prepare the code (see for instance [42]).

4. Conclusions

Fracture tests were carried out on U-notched Brazilian disk (UNBD) specimens with various notch tip radii made of two different biomaterials with different fracture behavior: linear elastic (bone cement material, BC) and elastic–plastic (dental material, DM). While the behavior of the DM in tensile tests was clearly elastic–plastic, its behavior in UNBD tests did not present any evident nonlinear zone in the load-displacement curves before the critical point, given that the plastic zone around the notch is very localized in the notch tip vicinity.
While maximum tangential stress (MTS) and mean stress (MS) criteria were shown to be effective in the fracture prediction of BC UNBD specimens (particularly the MS criterion), they were not effective in the fracture analysis of DM UNBD specimens, given that they ignore the DM nonlinear behavior. For this material (DM), MTS and MS criteria were coupled with the Equivalent Material Concept (EMC), leading to the EMC-MTS and the EMC-MS coupled criteria, which provided good agreement with the experimental results.
Concerning the DM, and by means of elastic–plastic finite element (FE) analysis, the plastic zone around the notch tip at the fracture onset was evaluated for different notch tip radii. It was found that the failure regime for the notch tip radius of 1 mm is the small-scale yielding (SSY) regime, while that for the notch tip radii of 2 mm and 4 mm is the moderate-scale yielding (MSY) regime.
The procedure proposed in this paper can be useful for the analysis of fracture processes in notched biopolymers with a wide range of nonlinearity.

Author Contributions

Conceptualization, A.R.T.; methodology, A.R.T.; software, S.S.; validation, M.R.A., A.R.T., S.S. and S.C.; investigation, S.S.; writing—original draft preparation, A.R.T., S.C.; writing—review and editing, M.R.A., and S.C.; project administration, M.R.A.; All authors have read and agreed to the published version of the manuscript.

Funding

This research received no external funding.

Conflicts of Interest

The authors declare no conflict of interest.

References

  1. Topoleski, L.D.T.; Rodriguez-Pinto, R. Bone Cement. In Comprehensive Biomaterials II; Ducheyne, P., Gringer, D.W., Healy, K.E., Hutmacher, D.W., Kirkpatrick, C.J., Eds.; Elsevier: Cambridge, MA, USA, 2017; Volume 7, pp. 12–33. [Google Scholar]
  2. Charnley, J. Acrylic Cement in Orthopedic Surgery; Williams and Wilknis: Baltimore, MD, USA, 1970. [Google Scholar]
  3. Saha, S.; Pal, S. Mechanical properties of bone cement: A review. J. Biomed. Mater. Res. 1984, 18, 435–462. [Google Scholar] [CrossRef] [PubMed]
  4. Juszczyk, E.B.; Baleani, M.; Cristofolini, L.; Viceconti, M. Fracture properties of an acrylic bone cement. Acta Bioeng. Biomech. 2008, 10, 21–26. [Google Scholar]
  5. May-Pat, A.; Cervantes-Uc, J.; Flores-Gallardo, S. Essential work of fracture: An approach to study the fracture behavior of acrylic bone cements modified with comonomers containing amine groups. Polym. Test. 2013, 32, 291–298. [Google Scholar] [CrossRef]
  6. Freitag, T.A.; Cannon, S.L. Fracture characteristics of acrylic bone cements. I. Fracture toughness. J. Biomed. Mater. Res. 1976, 10, 805–828. [Google Scholar] [CrossRef] [PubMed]
  7. Merta, I.; Berger, L.; Heidfogel, G.; Kuhn, K.D.; Lewis, G.; Tschegg, E.K. Size and boundary effects on notch tensile strength and fracture properties of PMMA bone cement. Polym. Test. 2017, 59, 441–448. [Google Scholar] [CrossRef]
  8. Li, Y.W.; Leong, J.C.; Lu, W.W.; Luk, K.D.; Cheung, K.M.; Chiu, K.Y.; Chow, S.P. A novel injectable bioactive bone cement for spinal surgery: A developmental and preclinical study. J. Biomed. Mater. Res. 2000, 52, 167–170. [Google Scholar] [CrossRef]
  9. Ayatollahi, M.R.; Mirmohammadi, S.A.; Shirazi, H.A. The tension-shear fracture behavior of polymeric bone cement modified with hydroxyapatite nano-particles. Arch. Civ. Mech. Eng. 2018, 18, 50–59. [Google Scholar] [CrossRef]
  10. Khandaker, M.; Li, Y.; Morris, T. Micro and nano MgO particles for the improvement of fracture toughness of bone–cement interfaces. J. Biomech. 2013, 46, 1035–1039. [Google Scholar] [CrossRef] [Green Version]
  11. Kim, S.; Bishop, A.R.; Squire, M.W.; Rose, W.E.; Ploeg, H.L. Mechanical, elution, and antibacterial properties of simplex bone cement loaded with vancomycin. J. Mech. Behav. Biomed. Mater. 2020, 103, 103588. [Google Scholar] [CrossRef]
  12. Gandomkarzadeh, M.; Moghimi, H.R.; Mahboubi, A. Evaluation of the Effect of Ciprofloxacin and Vancomycin on Mechanical Properties of PMMA Cement; a Preliminary Study on Molecular Weight. Sci. Rep. 2020, 10, 1–8. [Google Scholar] [CrossRef] [Green Version]
  13. Tavakoli, M.; Bakhtiari, S.S.E.; Karbasi, S. Incorporation of chitosan/graphene oxide nanocomposite in to the PMMA bone cement: Physical, mechanical and biological evaluation. Int. J. Biol. Macromol. 2020, 149, 783–793. [Google Scholar] [CrossRef] [PubMed]
  14. Ayatollahi, M.R.; Ghouli, S.; Bahrami, B. Experimental and theoretical fracture analyses for three biomaterials with dental applications. J. Mech. Behav. Biomed. Mater. 2020, 103, 103612. [Google Scholar] [CrossRef] [PubMed]
  15. Taylor, D.; Merlo, M.; Pegley, R.; Cavatorta, M. The effect of stress concentrations on the fracture strength of polymethylmethacrylate. Mater. Sci. Eng. A 2004, 382, 288–294. [Google Scholar] [CrossRef]
  16. Ayatollahi, M.R.; Torabi, A.R. Investigation of mixed mode brittle fracture in rounded-tip V-notched components. Eng. Fract. Mech. 2010, 77, 3087–3104. [Google Scholar] [CrossRef]
  17. Ren, L.; Zhu, Z.; Yang, Q.; Ai, T. Investigation on the applicability of several fracture criteria to the mixed mode brittle fractures. Adv. Mech. Eng. 2013, 5, 545108. [Google Scholar] [CrossRef]
  18. Bahrami, B.; Ayatollahi, M.R.; Torabi, A.R. In-situ brittle fracture analysis of sharp V-notched components using digital image correlation. Appl. Fract. Mech. 2020, 106, 102484. [Google Scholar] [CrossRef]
  19. Hatami, F.; Ayatollahi, M.R.; Torabi, A.R. Limit curves for brittle fracture in key-hole notches under mixed mode I/III loading based on stress-based criteria. Eur. J. Mech. A Solids 2021, 85, 104089. [Google Scholar] [CrossRef]
  20. Bahrami, B.; Ayatollahi, M.R.; Sedighi, I.; Pérez, M.A.; Garcia-Granada, A.A. The effect of in-plane layer orientation on mixed-mode I-II fracture behavior of 3D-printed poly-carbonate specimens. Eng. Fract. Mech. 2020, 231, 107018. [Google Scholar] [CrossRef]
  21. Kuruppu, M.D.; Chong, K.P. Fracture toughness testing of brittle materials using semi-circular bend (SCB) specimen. Eng. Fract. Mech. 2012, 91, 133–150. [Google Scholar] [CrossRef]
  22. Torabi, A.R.; Fakoor, M.; Pirhadi, E. Tensile fracture in coarse-grained polycrystalline graphite weakened by a U-shaped notch. Eng. Fract. Mech. 2013, 111, 77–85. [Google Scholar] [CrossRef]
  23. Ayatollahi, M.R.; Torabi, A.R. Brittle fracture in rounded-tip V-shaped notches. Mater. Des. 2010, 31, 60–67. [Google Scholar] [CrossRef]
  24. Ayatollahi, M.R.; Torabi, A.R. Tensile fracture in notched polycrystalline graphite specimens. Carbon 2010, 48, 2255–2265. [Google Scholar] [CrossRef]
  25. Torabi, A.R. Estimation of tensile load-bearing capacity of ductile metallic materials weakened by a V-notch: The equivalent material concept. Mater. Sci. Eng. A 2012, 536, 249–255. [Google Scholar] [CrossRef]
  26. Torabi, A.R.; Habibi, R.; Hosseini, B.M. On the ability of the equivalent material concept in predicting ductile failure of U-notches under moderate-and large-scale yielding conditions. Phys. Mesomech. 2015, 18, 337–347. [Google Scholar] [CrossRef]
  27. Torabi, A.R.; Alaei, M. Application of the equivalent material concept to ductile failure prediction of blunt V-notches encountering moderate-scale yielding. Int. J. Damage Mech. 2016, 25, 853–877. [Google Scholar] [CrossRef]
  28. Torabi, A.R. Tensile failure in blunt V-notched ductile members: A new formulation of the Equivalent Material Concept. Eng. Fract. Mech. 2017, 184, 1–13. [Google Scholar] [CrossRef]
  29. Torabi, A.R.; Kalantari, M.H.; Aliha, M.R.M. Fracture analysis of dissimilar Al-Al friction stir welded joints under tensile/shear loading. Fatigue Fract. Eng. Mater. Struct. 2018, 41, 2040–2053. [Google Scholar] [CrossRef]
  30. Torabi, A.R.; Rahimi, A.S.; Ayatollahi, M.R. Tensile fracture analysis of a ductile polymeric material weakened by U-notches. Polym. Test. 2017, 64, 117–126. [Google Scholar] [CrossRef]
  31. Karimzadeh, A.; Ayatollahi, M.R. Investigation of mechanical and tribological properties of bone cement by nano-indentation and nano-scratch experiments. Polym. Test. 2012, 31, 828–833. [Google Scholar] [CrossRef]
  32. ASTM International. ASTM D638-14. Standard Test Method for Tensile Properties of Plastics; ASTM International: West Conshohocken, PA, USA, 2014. [Google Scholar]
  33. Erdogan, F.; Sih, G. On the crack extension in plates under plane loading and transverse shear. J. Basic Eng. 1963, 85, 519–525. [Google Scholar] [CrossRef]
  34. Ayatollahi, M.R.; Torabi, A.R. A criterion for brittle fracture in U-notched components under mixed mode loading. Eng. Fract. Mech. 2009, 76, 1883–1896. [Google Scholar] [CrossRef]
  35. Torabi, A.R.; Berto, F. Notch fracture toughness evaluation for a brittle graphite material. Mater. Perform. Charact. 2014, 3, 398–413. [Google Scholar] [CrossRef] [Green Version]
  36. Torabi, A.R.; Campagnolo, A.; Berto, F. Local strain energy density to predict mode II brittle fracture in Brazilian disk specimens weakened by V-notches with end holes. Mater. Des. 2015, 69, 22–29. [Google Scholar] [CrossRef]
  37. Torabi, A.R.; Campagnolo, A.; Berto, F. Mode II brittle fracture assessment of key-hole notches by means of the local energy. J. Test. Eval. 2014, 44, 1261–1270. [Google Scholar] [CrossRef]
  38. Akbardoost, J.; Amirafshari, R.; Mohsenzade, O.; Berto, F. Scaling effect on the fracture toughness of bone materials using MMTS criterion. J. Mech. Behav. Biomed. Mater. 2018, 85, 72–79. [Google Scholar] [CrossRef] [PubMed]
  39. Seweryn, A. Brittle fracture criterion for structures with sharp notches. Eng. Fract. Mech. 1994, 47, 673–681. [Google Scholar] [CrossRef]
  40. Irwin, G.R. Plastic zone near a crack and fracture toughness. In Proceedings of the Seventh Sagamore Ordance Materials Conference, Syracuse University, New York, NY, USA, 16–19 August 1960; pp. IV-63–IV-78. [Google Scholar]
  41. Khodadadian, A.R.; Noii, N.; Parvizi, M.; Abbaszadeh, M.; Wick, T.; Heitzinger, C. A Bayesian estimation method for variational phase-field fracture problems. Comp. Mech. 2020, 66, 827–849. [Google Scholar] [CrossRef]
  42. Khodadadian, A.R.; Parvizi, M.; Abbaszadeh, M.; Dehghan, M.; Heitzinger, C. A multilevel Monte Carlo finite element method for the stochastic Cahn-Hilliard-Cook equation. Comp. Mech. 2019, 64, 937–949. [Google Scholar] [CrossRef] [Green Version]
Figure 1. Geometries of the different specimens. (a) U-notched Brazilian disk (UNBD) specimen; (b) cracked rectangular specimen (dental material, DM); (c) semicircular bend (SCB) specimen (bone cement (BC) material); (d) standard tensile test specimen.
Applsci 10 08445 g001
Figure 2. Examples of load-displacement curves obtained in the tensile tests. (a) BC material; (b) DM.
Applsci 10 08445 g002
Figure 3. Examples of load-displacement curves obtained in the UNBD fracture tests. (a) BC material; (b) DM.
Applsci 10 08445 g003
Figure 4. Schematic of the maximum tangential stress (MTS) criterion.
Applsci 10 08445 g004
Figure 5. (a) True and engineering tensile stress-strain curves of a typical ductile material. The shaded area identifies the strain energy density (SED) absorbed by the ductile material prior to the necking; (b) Tensile stress-strain curve of a typical brittle material.
Applsci 10 08445 g005
Figure 6. Examples of mesh patterns. (a) cracked rectangular specimens (DM); (b) cracked SCB specimens (BC material).
Applsci 10 08445 g006
Figure 7. Comparison between experimental results and predictions. (a) BC material, including maximum tangential stress (MTS) and mean stress (MS) predictions; (b) DM, including MTS, MS, Equivalent Material Concept (EMC)-MTS and Equivalent Material Concept (EMC)-MS predictions.
Applsci 10 08445 g007
Figure 8. Variation of linear elastic tangential stress versus the notch tip radius at different distances from the notch tip and for an arbitrary load of 100 N. (a) Distances (D) of interest for DM (rc = 0.04 mm); (b) Distances of interest (D) for BC material (rc = 0.17 mm).
Applsci 10 08445 g008
Figure 9. Tangential stress distributions (MPa) around a U-notch together with the effective plastic zone size (EPZS). (a) Notch tip radius = 1 mm; (b) notch tip radius = 4 mm.
Applsci 10 08445 g009
Table 1. Mechanical properties (tensile and fracture) of BC material and DM.
Material PropertyBCDM
Elastic modulus, E (GPa)3.022.80
Poisson’s ratio, υ0.30.3
Ultimate tensile strength, σu (MPa)36.648.7
Yield strength, σy (MPa)N/A34.7
Fracture toughness, KIC (MPa.m0.5)1.21.32
Table 2. Mechanical properties (tensile and fracture) of BC material and DM.
MaterialSpecimen P1 (N)P2 (N)P3 (N)Pm (N)
BCC-118501880-1865
C-217401760-1750
C-417101730-1720
SCB-10336330-333
DMC-12690272326452686
C-23280322032263242
C-43265324332573255
R-8144150141145
Table 3. Discrepancies (%) between experimental results and analytical predictions.
MaterialSpecimen MTSMSEMC-MTSEMC-MS
BCC-1−17+1--
C-2−150--
C-4−19−9--
DMC-1−32−19010
C-2−43−35−94
C-4−45−40−7−4
Publisher’s Note: MDPI stays neutral with regard to jurisdictional claims in published maps and institutional affiliations.

