Article

Failure Mechanism of Rock Specimens with a Notched Hole under Compression—A Numerical Study

by
Amin Manouchehrian
*,
Pinnaduwa H. S. W. Kulatilake
and
Rui Wu
School of Resources and Environmental Engineering, Jiangxi University of Science and Technology, Ganzhou 341000, China
*
Author to whom correspondence should be addressed.
Appl. Sci. 2021, 11(17), 7797; https://doi.org/10.3390/app11177797
Submission received: 16 June 2021 / Revised: 12 August 2021 / Accepted: 22 August 2021 / Published: 24 August 2021
(This article belongs to the Section Civil Engineering)

Abstract

:
Discontinuities are natural structures that exist in rocks and can affect the stability of rock structures. In this article, the influence of notch presence on the strength and failure evolution around a hole in compressed rock specimens is investigated numerically. Firstly, the uniaxial compressive test on a rock specimen with a circular hole is modeled, and the failure evolution in the specimen is simulated. In a separate model, notches are created at the surface of the hole. Results show that, when the notches are created in the model, a failure zone around the hole is transferred to a distance away from the surface of the hole. In addition, a parametric study is carried out to investigate the influence of the notch length and the confining pressure on the fracturing behavior of the specimen. Numerical results presented in this article indicate that the presence of notches at the surface of the hole and their dimensions can affect the fracturing mechanism of the specimen. In some cases, the failure at the boundary of the hole is prevented when the notches of certain dimensions are added to the hole. The insights gained from this numerical study may be helpful to control the failure around underground excavations.

1. Introduction

Discontinuity is an inherent characteristic of rocks and rock-like materials. Generally, rocks include defects and discontinuities at various scales. Different types of defects exist in rocks such as faults, bedding planes, pores, grain boundaries, joints, holes, cracks, and notches. These natural defects originate from the various geological processes acting on the rocks. Moreover, defects in rocks may be created artificially for some engineering purposes. Whether the defects are formed naturally or created artificially, they affect the load-bearing capacity of the rock [1,2,3,4]. Defects in rock masses are stress-raisers and play a key role in the rock fracturing processes. Therefore, understanding the role of different types of defects on the mechanical behavior of rocks under various loading conditions is an essential task for any rock engineering design.
Cracks and notches are two types of planar defects that may exist naturally in rock masses or may be created artificially in different structures, such as dams, tunnels, and wells. The definition of a “crack” refers to a defect that is generated during the loading process, and a “notch” or a “flaw” refers to a prefabricated defect in the solids. In this article, the word “notch” refers to a cut at the surface of the specimens. Cracks and notches show a similar behavior under tensile loads. However, their behavior under compressive and shear stresses are different. When a crack is subjected to pure compression, the two faces of the crack are pushed together and the free space between them closes due to the penetration of the molecules on each face moving into another face. In this condition, the presence of the crack has little or no effect on the strength of the solid. Thus, the crack behavior under pure compression (negative Mode-I) is not crucial to the stability of a structure. In contrast, a notch under compression can affect the stability of a solid depending on the distance between the two faces of the notch and its geometry.
In rock structures, rocks are subjected to different loading conditions. Damage initiation and propagation from a pre-existing defect in a rock depends on the loading condition. In theory, three basic modes of crack extension are postulated: Opening mode (Mode-I), shearing mode (Mode-II), and tearing mode (Mode-III). Basic modes of crack extension are sketched in Figure 1. In the rock mechanics and the fracture mechanics literature, a large number of studies have been devoted to the study of initiation, propagation, and the coalescence of cracks in rocks and brittle materials under different loading conditions [5,6,7,8,9,10,11,12,13,14,15,16,17,18]. These studies have revealed many fracturing characteristics of rocks and have led to the improvement of safety in rock structures.
In the studies related to failure mechanism, defects are usually in either the form of holes with different geometries (e.g., circular, rectangular, and triangular) or planar defects, such as cracks, flaws and notches. A large number of research studies have investigated the failure mechanisms in rock specimens containing holes under different loading modes [19,20,21,22]. However, in the study of defected rocks, the inclusion of planar defects, tensile, and shear loads are usually more applied, while the pure compression is neglected [5,6,7,8,9,10,11,12,13,14,15,16,17,18]. For example, Park and Bobet studied the failure mechanisms of pre-flawed specimens under mixed mode I/II loads. They observed three different types of cracks including wing cracks, coplanar shear, and oblique shear cracks [12]. In rock structures such as mine pillars, tunnel walls, and slopes, the existing defects at the surface of the excavations can be subjected to pure compression. Hence, the influence of the presence of a defect on the failure evolution of rocks under compression is important. The fracturing behavior of defects under pure compression has been studied in a limited number of investigations [23,24,25]. For example, Berto et al. [23] used polycrystalline graphite to study the brittle failure of specimens with V-shaped notches under pure compression. They observed and explained the failure evolution from the notch tips. In a similar experiment, Bura et al. [25] studied the fracturing process in polymethyl methacrylate (PMMA) specimens under compression, which were weakened by V and U-shaped edge notches. In their research, fracture evolution during the notch closure was observed. Torabi et al. [24] suggested a flattened V-notched semi-disk specimen to study the brittle failure of PMMA specimens with blunt V-shaped notches under compression.
The above-mentioned studies and some others have shown that the failure behavior of planar defects under pure compression has some specific characteristics and needs to be given attention. As mentioned before, the failure behavior of planar defects under pure compression has not been well studied. In this research, a numerical study is conducted to understand the contribution of planar defects (notches in this study) to the rock failure at the surface of a circular hole when the defects are subjected to a pure compression. In Section 2, the stress distribution around circular holes and cracks under Mode-I loading condition is analytically described. In Section 3, bonded particle models are built to study the failure mechanism of a specimen with a notched hole under compression. In Section 4, a parametric study is conducted to investigate the influence of the notch length and the confining pressure on the failure behavior of the specimen.

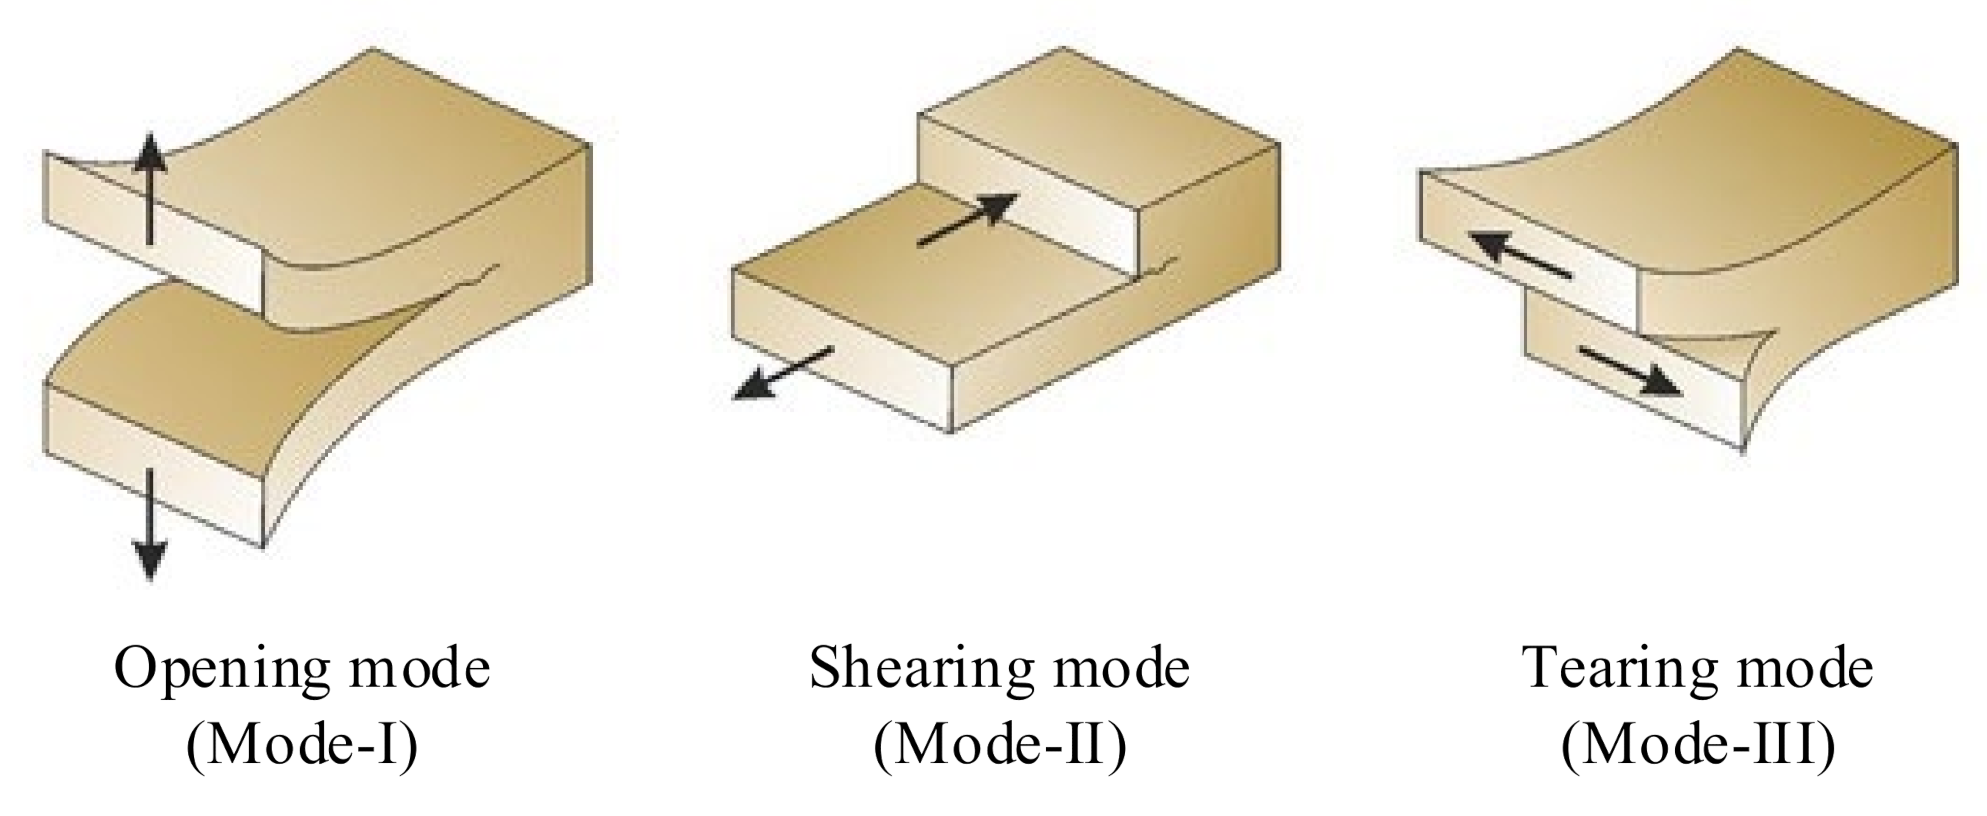
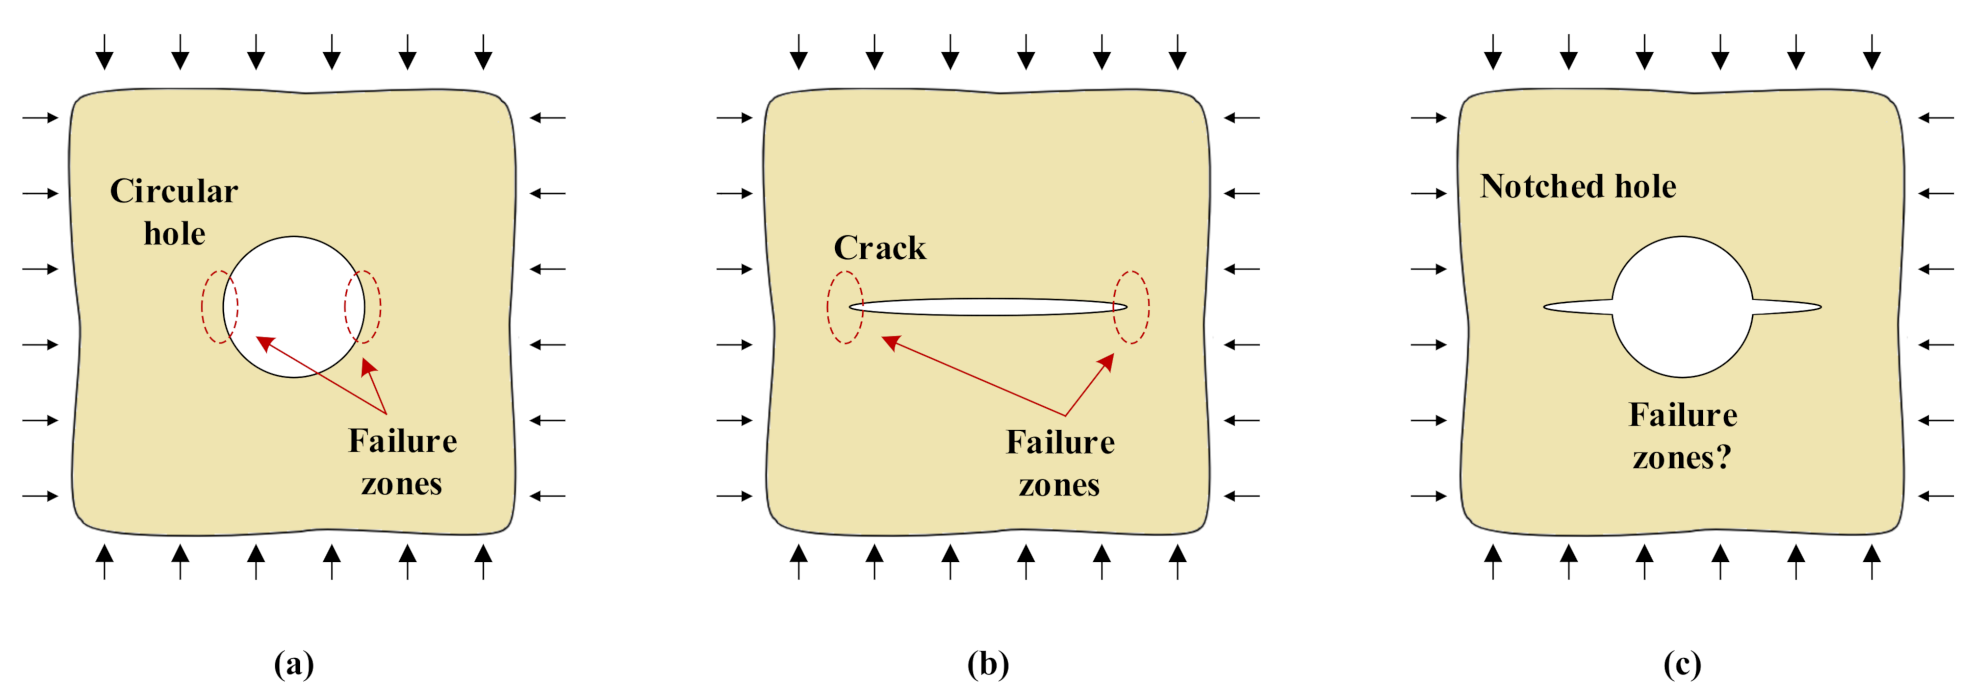
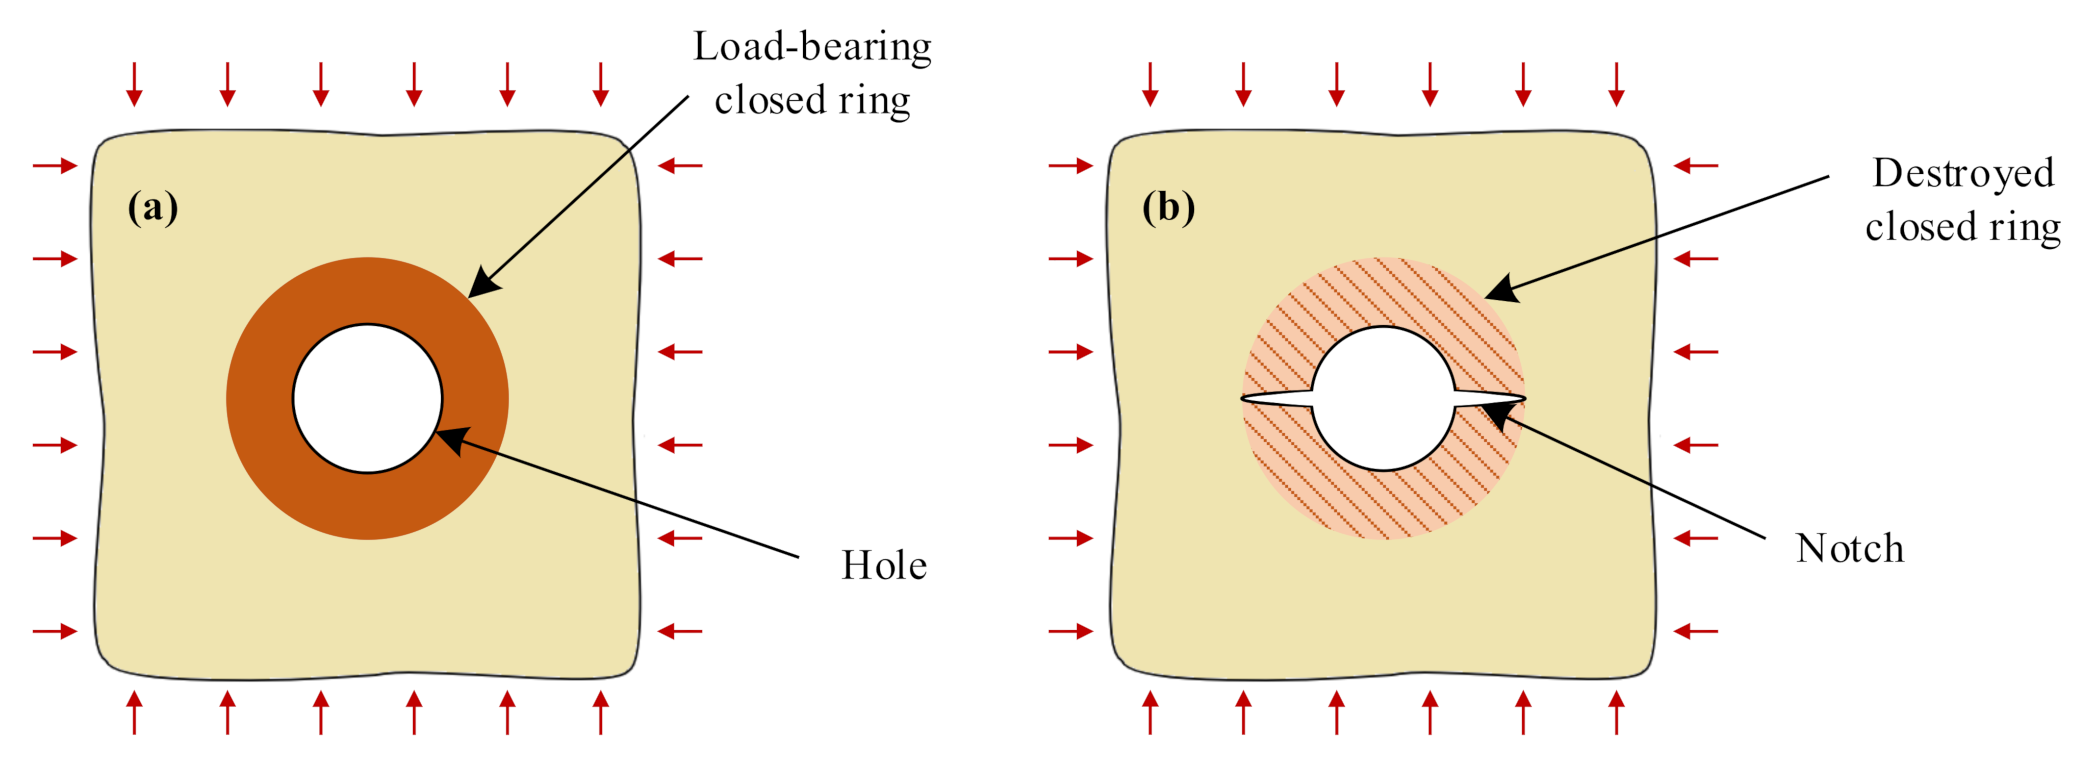
2. Stress State around Circular Holes and Cracks under Mode-I Loading Condition

Prior to any excavation, rock mass is subjected to lithostatic stress field. Upon excavation, the stresses around the excavation are redistributed to reach an equilibrium state. The stress state after excavation depends on the geometry of the opening, in addition to the rock material properties and the boundary and loading conditions. Generally, the geometry of openings is designed in a way to minimize the stress concentration at the boundaries of the excavation to prevent consequent instabilities. Among the basic geometrical shapes, a hole with a circular cross-section has the minimum stress concentration factor at its boundary in a homogeneous, continuous, and isotropic medium [26]. In the classical mechanics, the stress state around a circular hole in an infinite plate can be calculated using the closed form solution. Figure 2a shows an infinite plate with a hole subjected to a two-directional stress field in which σ x = K σ and σ y = σ . The stress state around a circular hole with a radius of a under a two-directional stress field in an infinite plate is [27]
σ r = σ 2 1 + K 1 a 2 r 2 1 K 1 4 a 2 r 2 + 3 a 4 r 4 c o s 2 θ
σ θ = σ 2 1 + K 1 + a 2 r 2 + 1 K 1 + 3 a 4 r 4 c o s 2 θ
τ r θ = σ 2 1 K 1 + 2 a 2 r 2 3 a 4 r 4 s i n 2 θ
where σr, σθ, and τ are radial, tangential, and shear stresses, respectively, and r is the distance to the hole center. It should be noted that the stress state around an opening is not dependent on the mechanical properties of the material. By placing r = a in Equations (1) through (3), the stress state at a circular hole boundary in an infinite plate is
σ r = 0
σ θ = σ 1 + K + 2 1 K c o s 2 θ
τ r θ = 0
According to Equation (5), in a stress field in which K < 1, the maximum principal stress is concentrated at the side walls ( θ = 0 ,   π ) and the minimum principal stress is located at the top ( θ = π 2 ) and bottom ( θ = 3 π 2 ) of the hole boundary.
The fracture mechanics provides solutions for calculation of the stress and displacement in the solids in which cracks exist. Generally, the fracture mechanics provides accurate solutions for brittle elastic materials. For a given crack, its extension may be accomplished in one or more modes (Figure 1). The near crack tip (r << l) stresses under opening mode loads (Mode-I), and can be calculated using Irwin’s concept of the stress intensity factors, which characterize the strength of the singularity at a crack tip (Figure 2b) [28], as follows:
σ x x = σ π b 2 π r c o s θ 2 1 s i n θ 2 s i n 3 θ 2
σ y y = σ π b 2 π r c o s θ 2 1 + s i n θ 2 s i n 3 θ 2
τ x y = σ π b 2 π r s i n θ 2 c o s θ 2 c o s 3 θ 2
where b is the half-length of the crack. Equations (7) through (9) suggest that the maximum stress concentration happens at the tips of the crack.
Usually, the analytical methods give solutions with a good accuracy for calculation of the stress state around the openings for simple geometry. For example, the stress state in a plate with a hole (Figure 3a) or a crack (Figure 3b) subjected to compression can be easily calculated. However, there is no analytical solution to calculate the stress state if these two basic geometries are combined (Figure 3c). In the real-world, engineering problems contain components with complex geometries which make it difficult to use analytical solutions for engineering designs.
Advanced computational models empower scientists and engineers to build more complex and more detailed models for solving problems. The presence of notches at the surface of a hole (Figure 3c) and its influence on the stress distribution around the hole can be simulated using advanced computational models. In a recent study, the authors used FEM models to study the stress distribution around a notched circular tunnel under compression. They showed that, when notches are created in a tunnel, the adjacent rock at the sides of the notches is destressed, and the stress concentration zones are transferred to a distance away from the wall (Figure 4). In that study, they concluded that the presence of notches at a tunnel wall might be capable of changing the failure pattern at the wall in a favorable manner [29]. In the present study, bonded particle models were used to simulate the fracturing process around a notched hole.

3. Simulation of Failure in a Rock Specimen with a Notched Hole
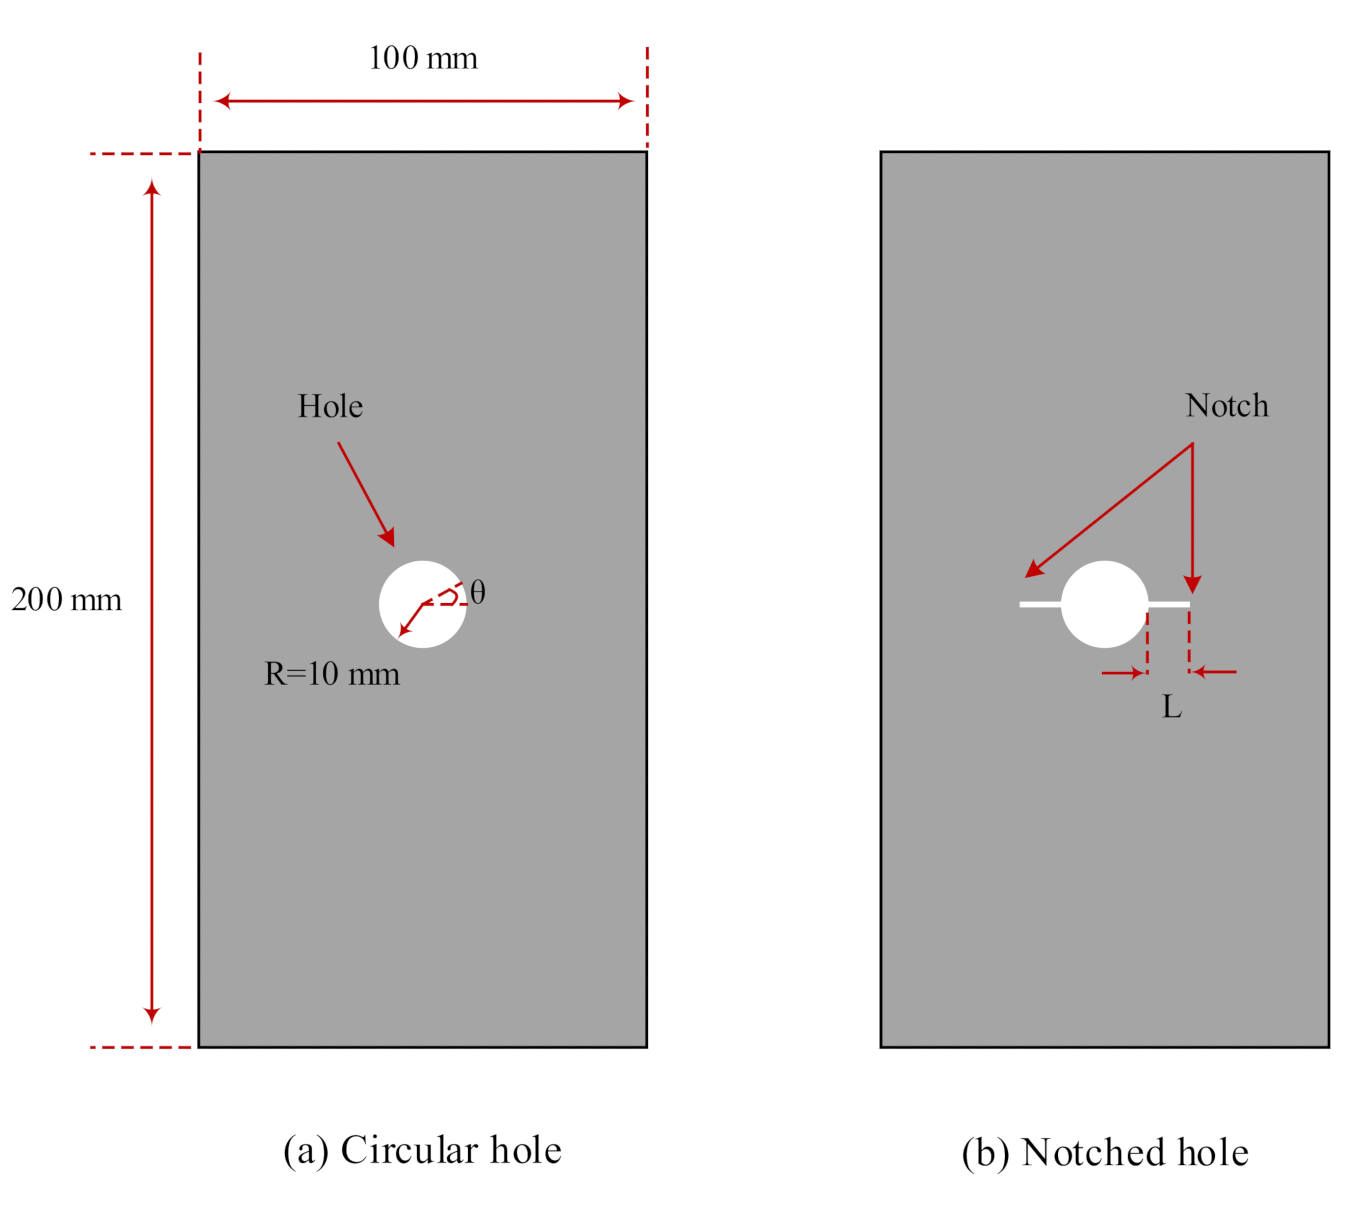
The available analytical solutions in the classical mechanics and the fracture mechanics are usually applicable for solving simple problems. To simulate complex engineering problems, advanced numerical models are needed. Successful application of different numerical methods such as the finite element method (FEM), extended finite element method (XFEM), discrete/distinct element method (DEM), boundary element method (BEM), and displacement discontinuity method (DDM) have proved the merits of numerical models for the simulation of fracture evolution in solids [19,30,31,32,33,34,35,36,37]. In this section, simulation of failure evolution in rock specimens with a notched hole is discussed.

3.1. Model Setup

In this study, the bonded particle models are developed to simulate the fracturing process in rock specimens. In the bonded particle models, the cracking process is simply simulated by breakage of bonds between particles. This is a simple approach for the simulation of cracking in comparison to some other methods, in which the crack evolution is simulated by solving complex mathematical equations related to fracture mechanics. For the implementation of the bonded particle models, Particle Flow Code (PFC) [38] is utilized. Because the purpose of this study is to simulate the fracturing behavior of rectangular prismatic specimens, the problem can be simplified to a plane strain problem. Therefore, in this study, the two-dimensional version of the code (PFC2D) is used.
In PFC modeling, it is not straightforward to assign the physical and mechanical properties of materials. The models need to be calibrated by changing several micro-parameter values to obtain macro-parameter values, such as for the elastic and the plastic properties of the material. For this purpose, usually the unconfined and confined compressive tests, as well as the Brazilian test, are simulated. In the calibration process, different micro-parameter values are varied to calibrate the model to get the desired macro-parameter values of the material. The procedures given by Yang et al. [39] and Mehranpour and Kulatilake [40] were used as guidance to perform the calibration process. The calibrated micro-parameter values and the used macro-parameter values for the simulated rock specimens in this study are listed in Table 1 and Table 2, respectively. The macro-parameter values of the simulated rock are in the ranges of the mechanical properties of some soft rock types such as coal, chalk, soft shales and marl, and rock-like materials such as concrete.
In this study, a rectangular rock specimen with a width of 100 mm and a height of 200 mm, and including the mechanical properties listed in Table 1, was simulated. The geometry of the models is shown in Figure 5. The simulated specimen includes a rectangular assembly of 18,892 circular particles. The radius of the particles follows a Gaussian distribution function with a minimum and maximum radii of 0.4 mm and 0.66 mm, respectively. The particles are densely packed with a low locked-in isotropic stress of 0.15 MPa, which is less than 1% of the uniaxial compressive strength of the specimen. After reproduction of the rectangular assembly, the circular hole and notches are created by removing the particles at the appropriate locations. Deletion of the particles does not have a significant influence on the stress distribution in the assembly because the locked-in isotropic stress is set to a low value relative to the material strength. The circular hole with a radius of R = 10 mm is created at the center of the specimen (See Figure 5). The notches are created by removing the particles in a narrow strip with a width of 1.5 mm. This approach is appropriate for the simulation of open cracks. Simulation of closed and filled cracks can be done by assigning zero tensile strength to the bonds of neighbor particles in a straight line or by using smooth joint models [40]. The particle assembly of a notched hole with the length of L = 10 mm is illustrated in Figure 6. The pushing forces to the specimen’s ends are applied by moving two parallel rigid walls toward each other in the direction of the loading. In this paper, the model containing a central circular hole is referenced as “the circular hole” (Figure 5a), and the model which includes notches at the surface of the hole is referenced as “the notched hole” (Figure 5b). It should be noted that in this study, one particle assembly is used in all models. In this way, only the influences of the geometry and the boundary condition changes are considered.

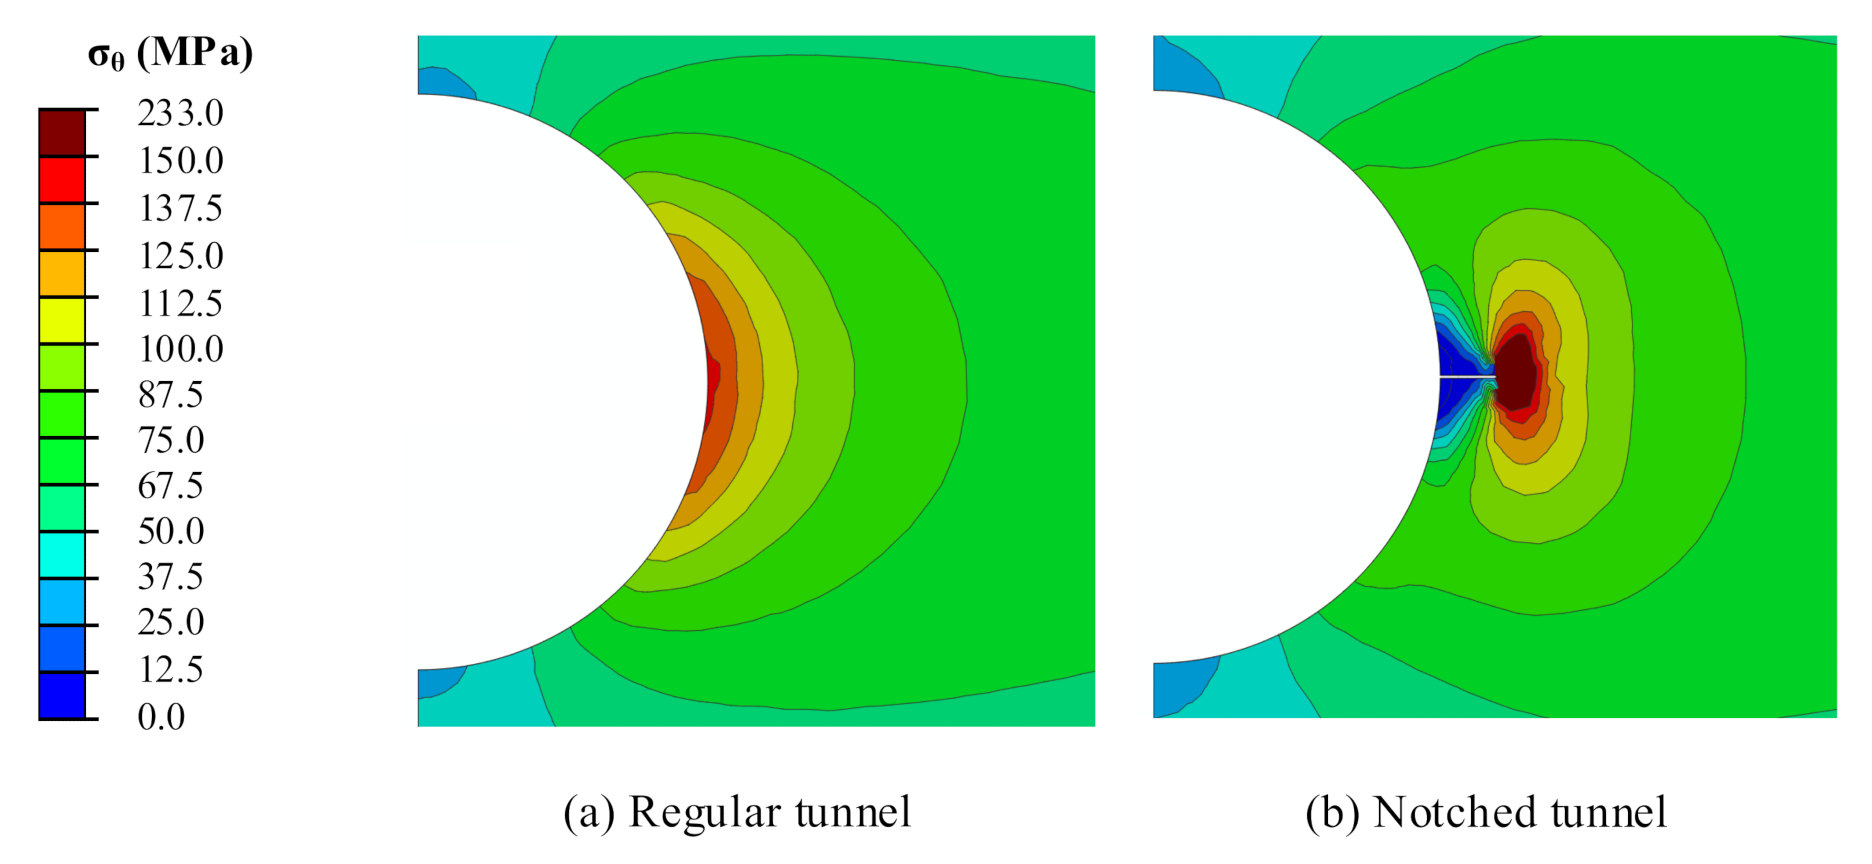
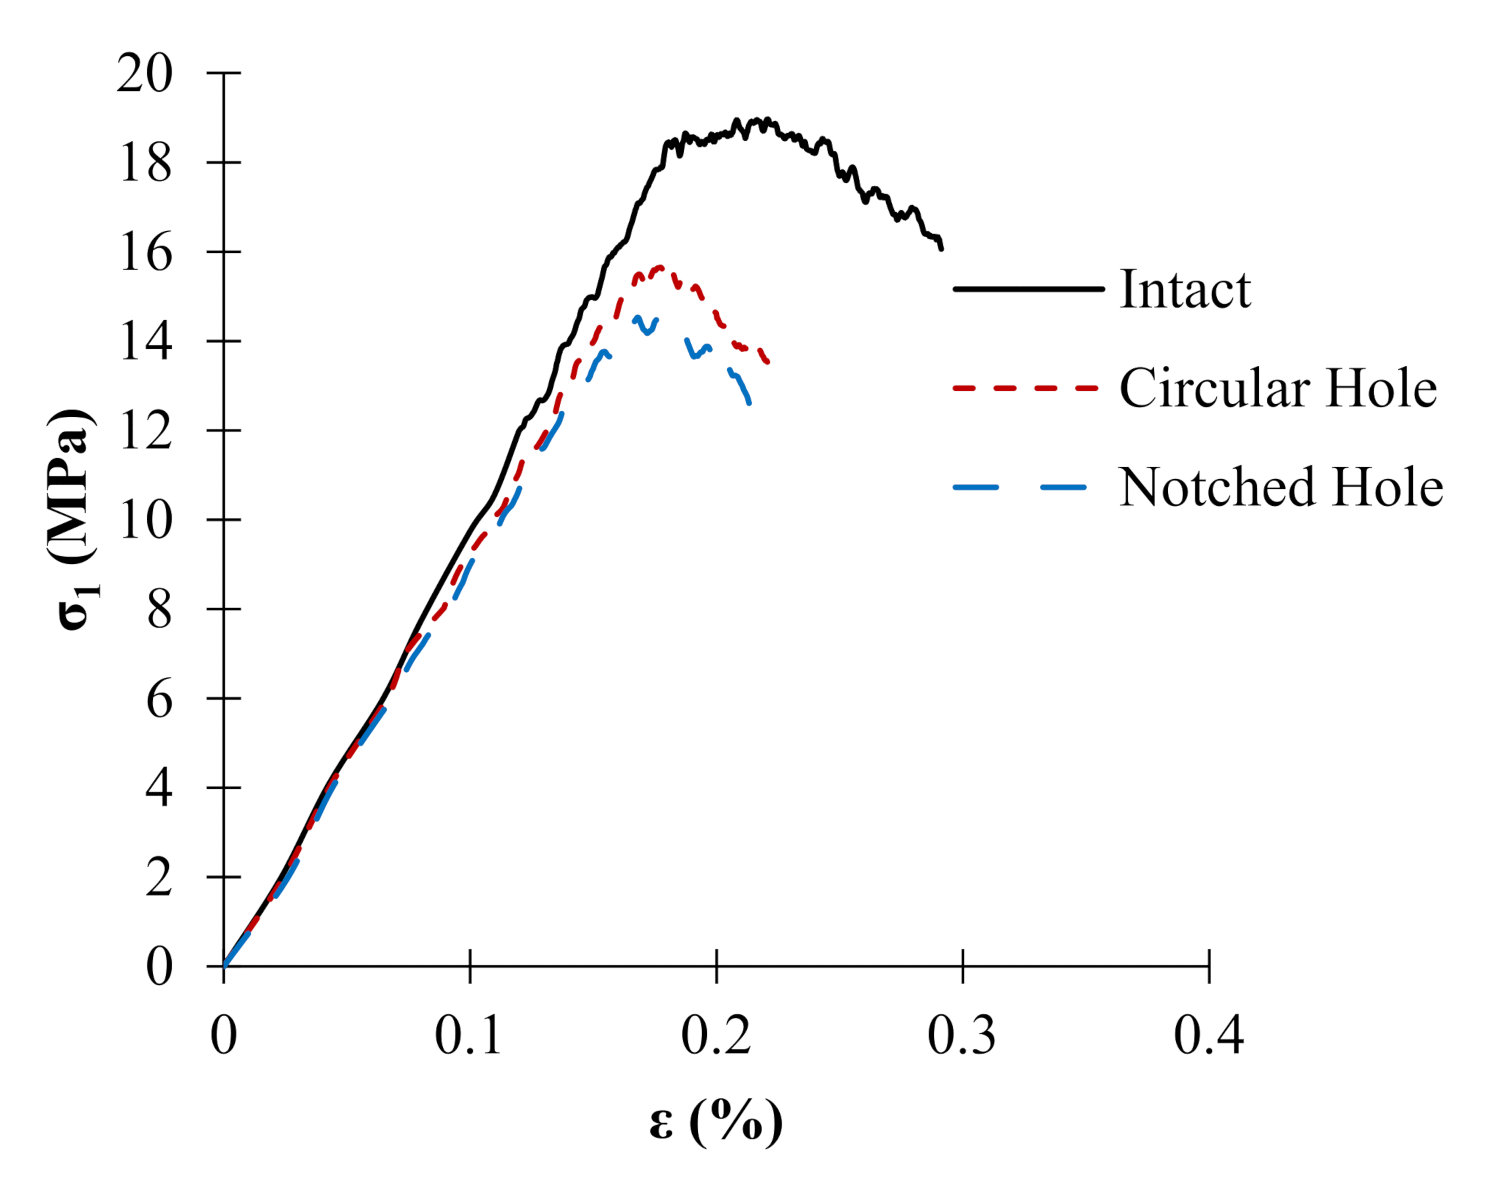
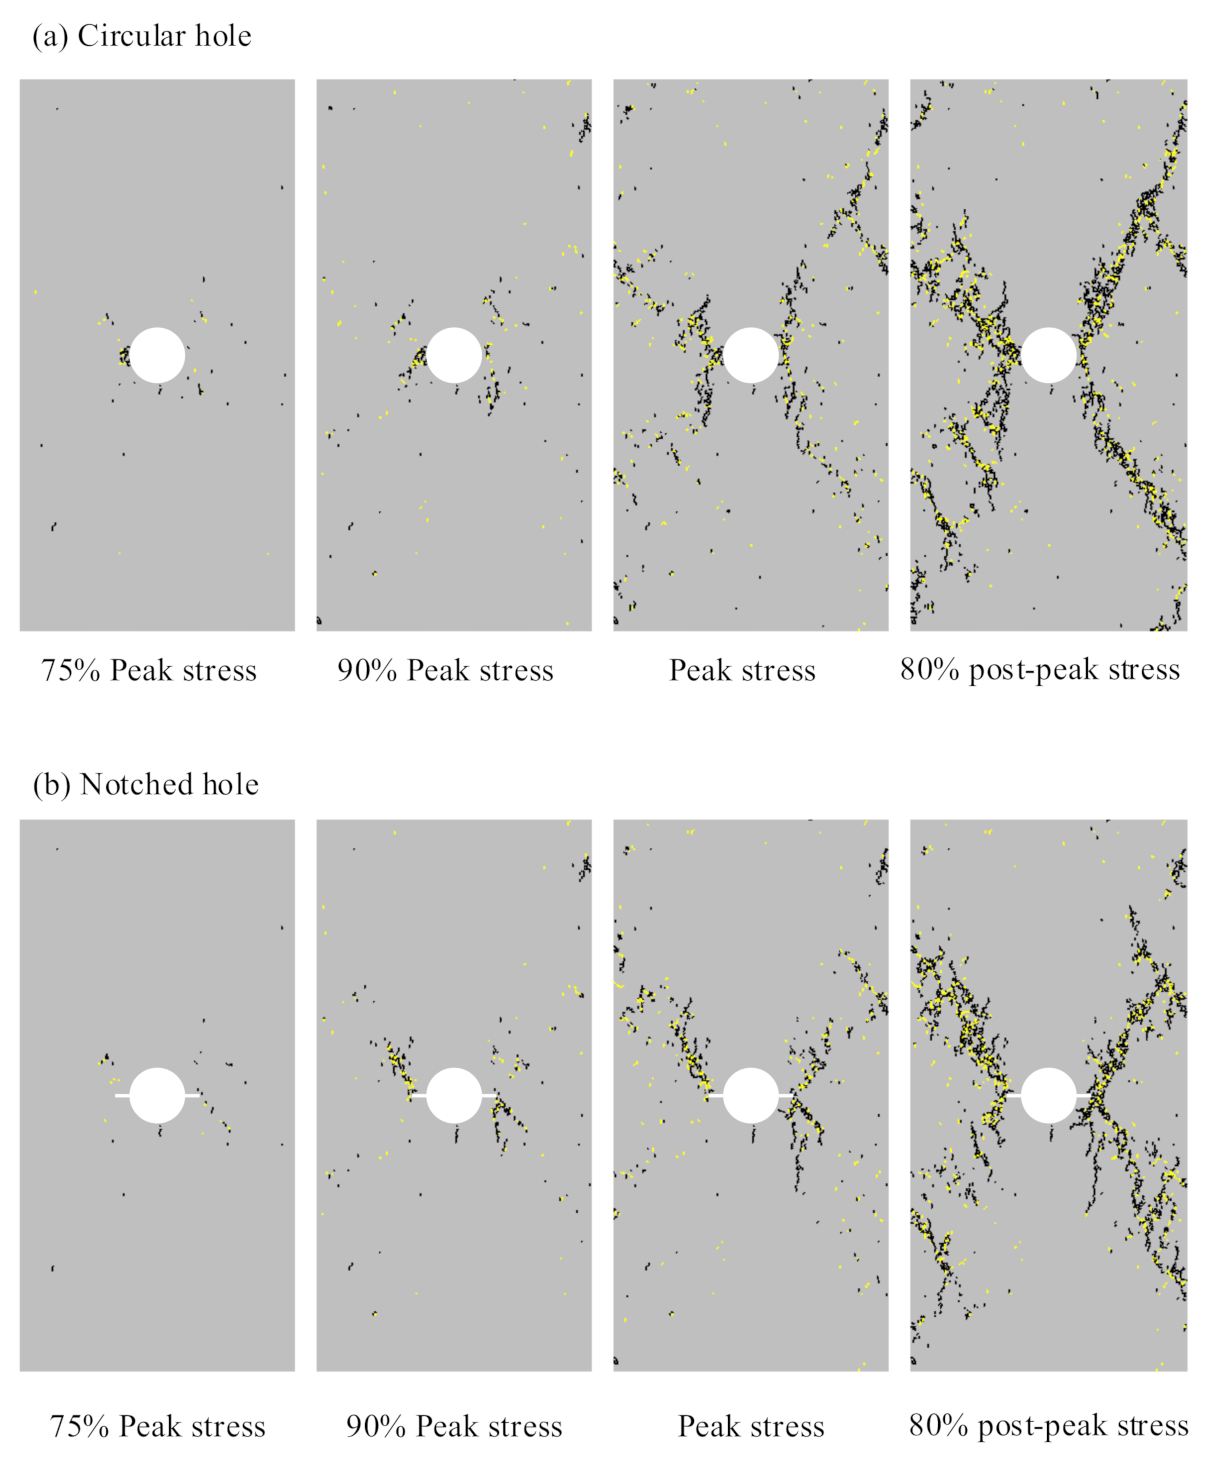
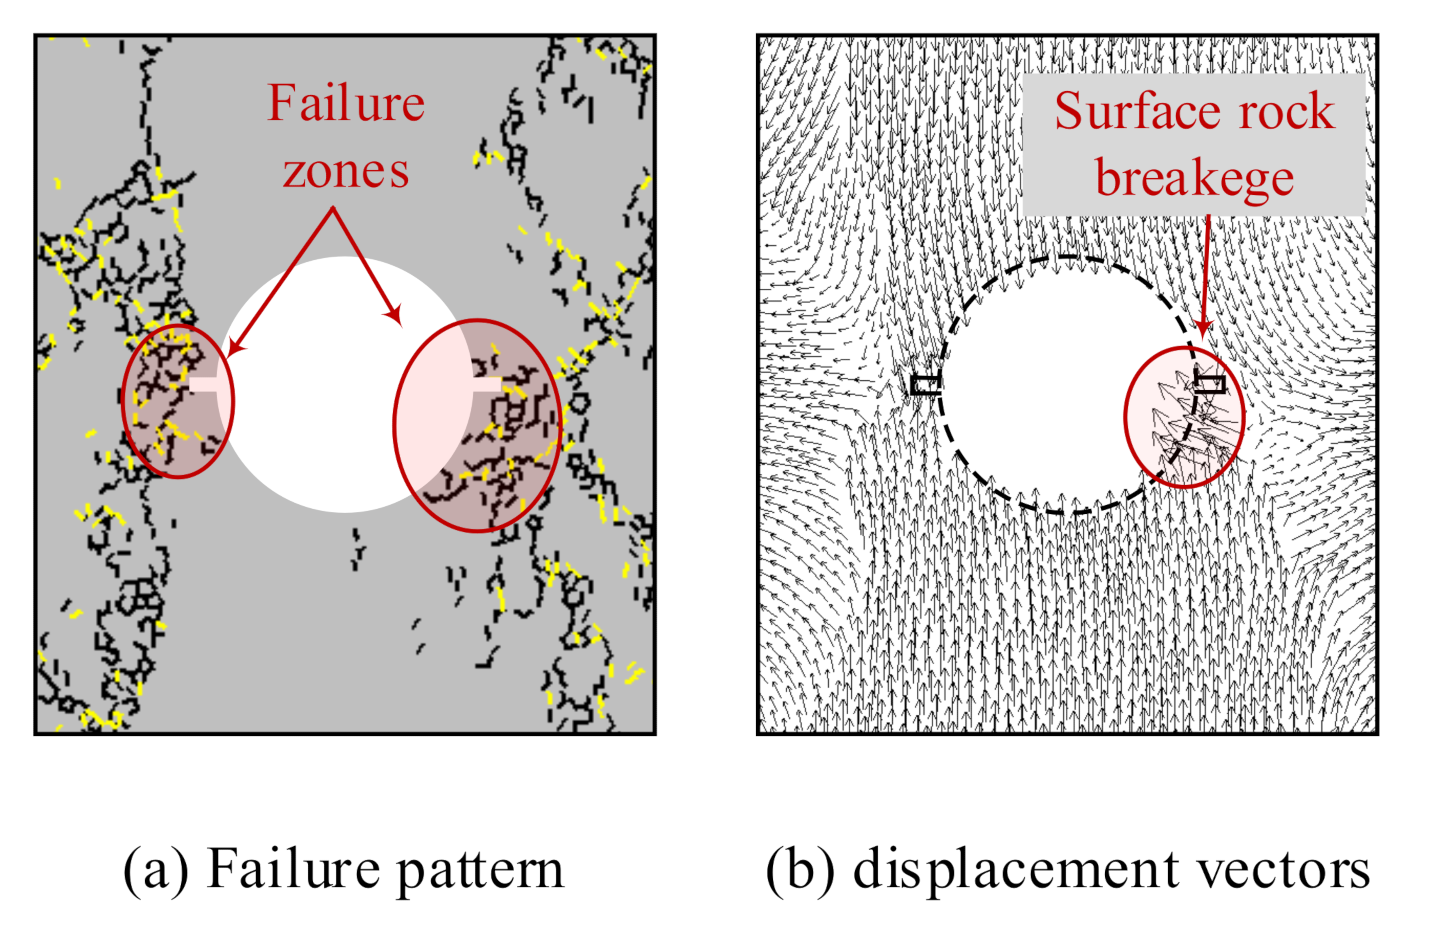
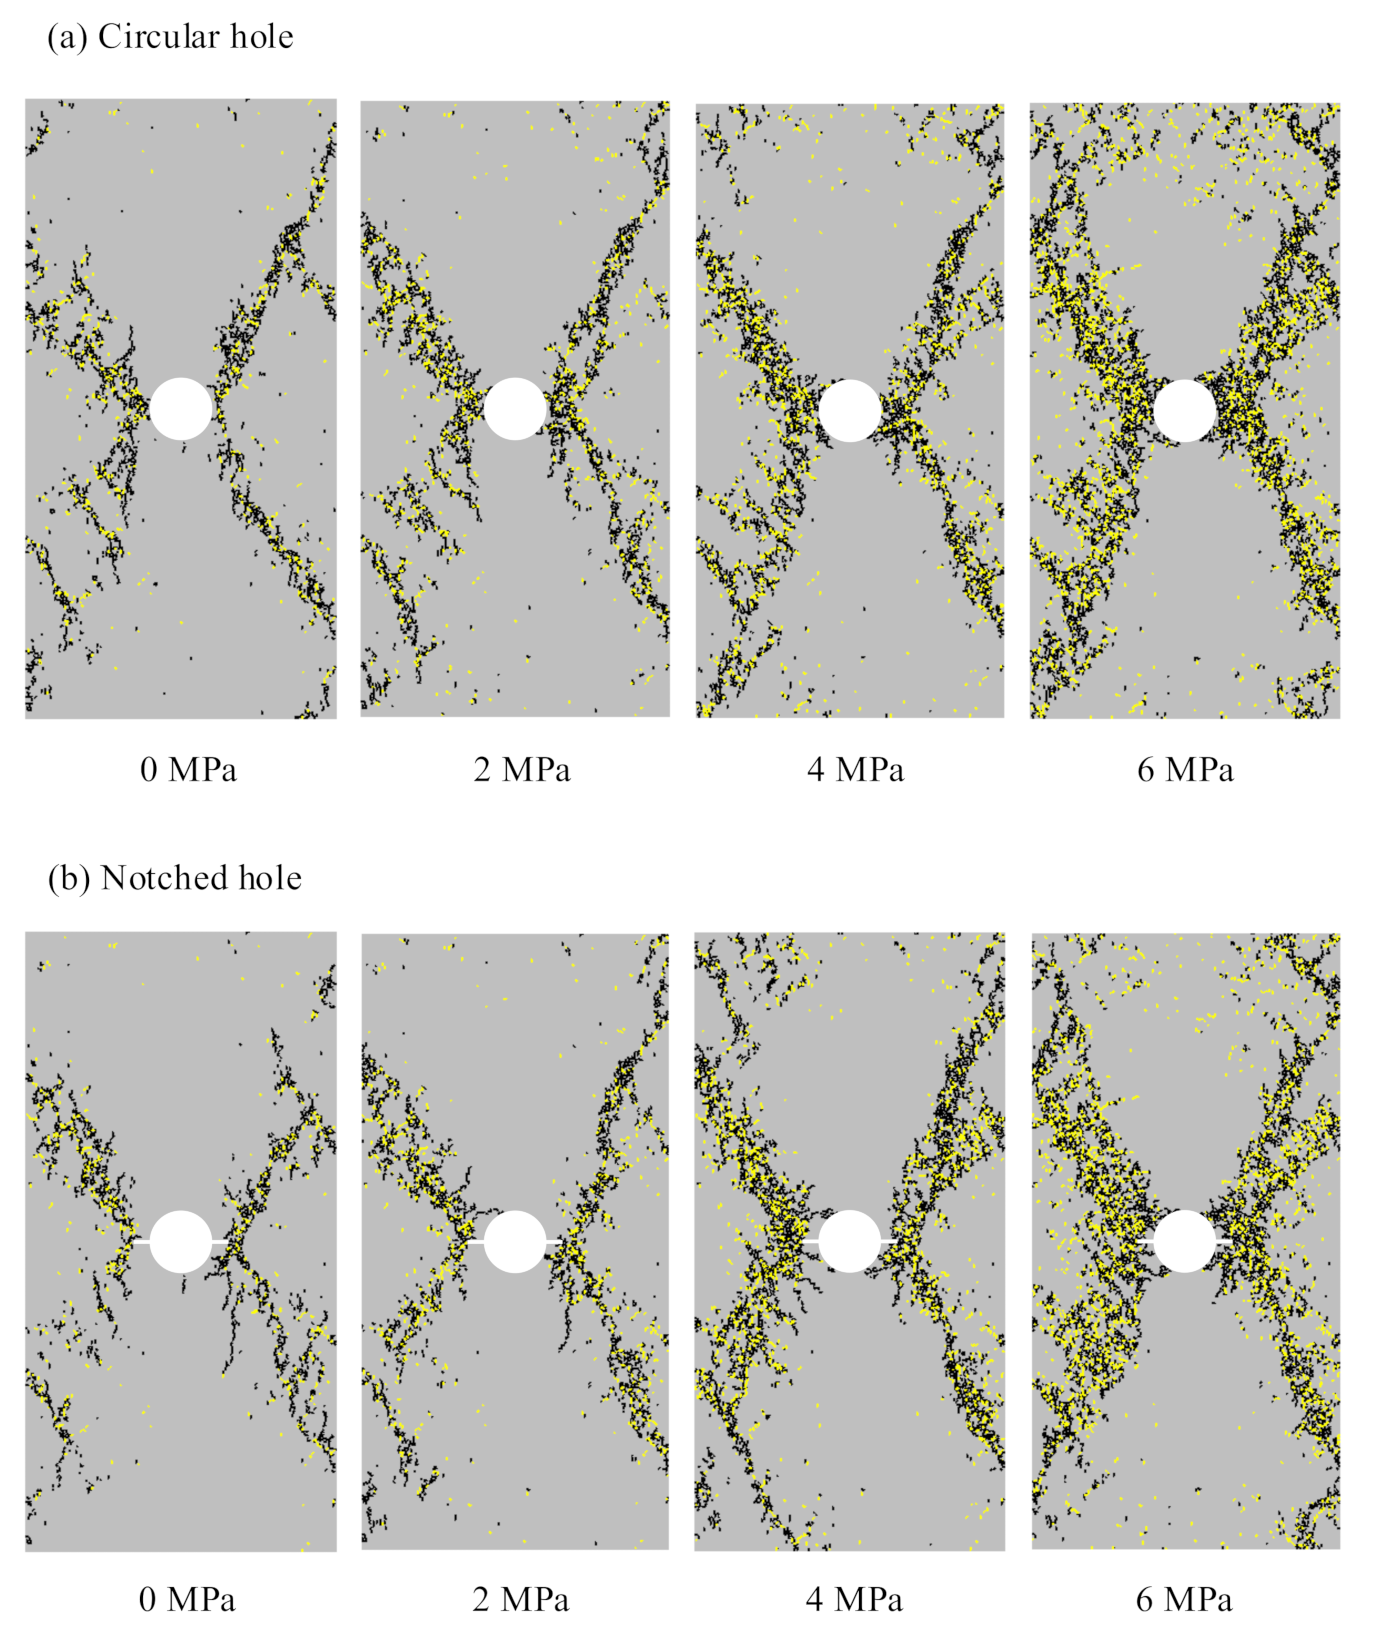
3.2. Failure Evolution in the Circular Hole and the Notched Hole

In this section, models with and without notches are built to study the effect of notches on the failure behavior of rock specimens under compression. Firstly, the uniaxial compression test on a rectangular specimen with a circular hole is simulated (Figure 5a). The stress–strain curve obtained for this specimen is plotted in Figure 7. In this figure, the stress–strain curve obtained from the uniaxial compressive test on the intact rock specimen (i.e., with no hole and no notches) is also plotted. The figure shows that the specimen with a central circular hole reaches a maximum stress of 15.65 MPa before it fails. This is 17.4% less than that in the intact specimen, in which the maximum uniaxial strength is 18.95 MPa, which is similar to laboratory experimental observations [20]. The uniaxial strength of the specimen with a notched hole is 14.53 MPa, which is 23.3% and 7.1% less than that of the intact specimen and the specimen with the circular hole, respectively.
Figure 8a shows the failure evolution in the specimen with the circular hole. In this figure, the failure patterns at the 75% peak stress, 90% peak stress, peak stress, and 80% post-peak stress are illustrated. The black and the yellow lines in Figure 8 represent the tensile and the shear cracks, respectively. When the specimen is loaded at 75% peak stress, a few cracks are nucleated at the left side of the hole (θ = 180°) where the tangential stress is concentrated (see Equation (5)). In addition, tensile cracks are formed at the bottom of the hole (θ = 270°). Moreover, some minor cracks appear, which are mainly distributed around the hole. At 90% of the peak stress level, more fractures are formed around the hole, and localized failure zones appear at the two sides of the hole (θ = 0° and 180°). At the peak stress, the cracks are coalesced and formed into obvious failure planes. Figure 9a shows a close view of the failure zone at the left side of the hole at the peak stress level. In this figure, the rock at the surface of the hole is crushed because it is the location of the maximum tangential stress around the circular hole (Equation (5)). By applying more strain to the model and bringing it to 80% of the peak stress (post-peak), the number of cracks is increased, and the failure planes become wider. Heterogeneity is a characteristic of rocks and rock-like materials. Therefore, the failure in a symmetric rock specimen under uniform loads is not necessarily symmetric. PFC models are heterogeneous models in which the particle sizes and the micro-parameters are non-uniform. Thus, the rock failure in the PFC models can be asymmetric. Figure 8 indicates that, despite slight differences in failure patterns around the hole, the overall failure patterns in the specimens are symmetric.
In a separate model, two notches with the length of L = 5 mm, which results in L/R = 0.5, were created on the wall of the hole at θ = 0° and 180° (see Figure 5b). This model is referenced as the notched hole. The same modeling procedure explained in Section 3.1 was used. The stress–strain curve for this model is shown in Figure 7. The figure shows a maximum strength of 14.53 MPa for the notched hole model. This is 7.1% and 23.3% less than that in the circular hole model and the intact model, respectively.
The failure evolution in the notched hole model is shown in Figure 8b. The figure indicates that first a minor tensile crack is formed at the bottom of the hole (θ = 270°). In the notched model, the free space at the wall created by notches allows more vertical displacement to the particles around the notches. Consequently, more tensile stress is induced at the top and bottom of the hole. Thus, the formed tensile cracks at the bottom of the model are longer than that in the circular hole model. Moreover, some minor cracks are formed in the specimen, which are mainly localized around the hole. The free space created by the hole and the notches allow the particles to slide toward the free space. At 90% peak stress, some cracks are nucleated from the tips of the notches where the stress concentration zones exist (Equations (7)–(9)). These cracks are coalesced and create two major fracture planes. At the peak stress, the cracks are propagated and form clear failure planes. At 80% post-peak stress, the failure planes become wider and are extended to the boundaries of the specimen.
A close view of the failure zones around the notched hole at the peak stress level is shown in Figure 9b. The figure indicates that the failure in the notched hole model is mainly developed from the tip of the notch, while the rock at the two sides of the notch is not fractured. In the circular hole, a load bearing a closed ring occurred in the rock around the hole (Figure 10a). When a notch is created, the free space provided by the notch destroys this closed ring of rock (Figure 10b) and destresses the adjacent rock (see Figure 4b). This explains the integrity of the rock that exists at the sides of the notch in Figure 9b. However, at high stresses, the notch may get closed, and the rocks at the notch sides may get reloaded [29].

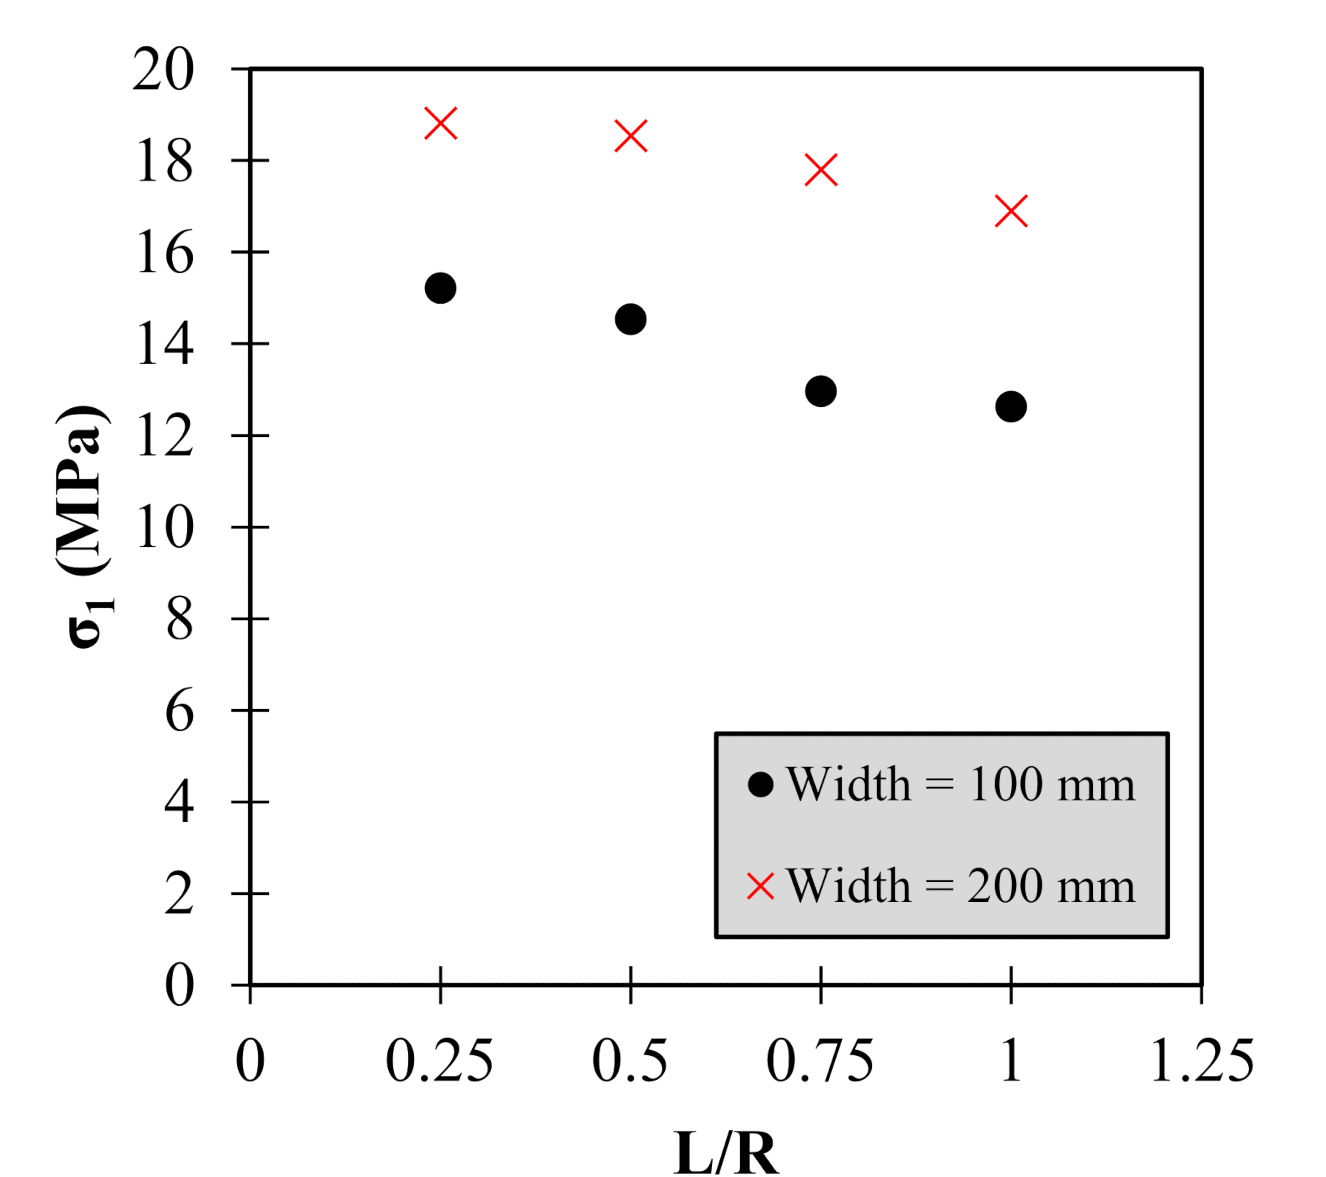
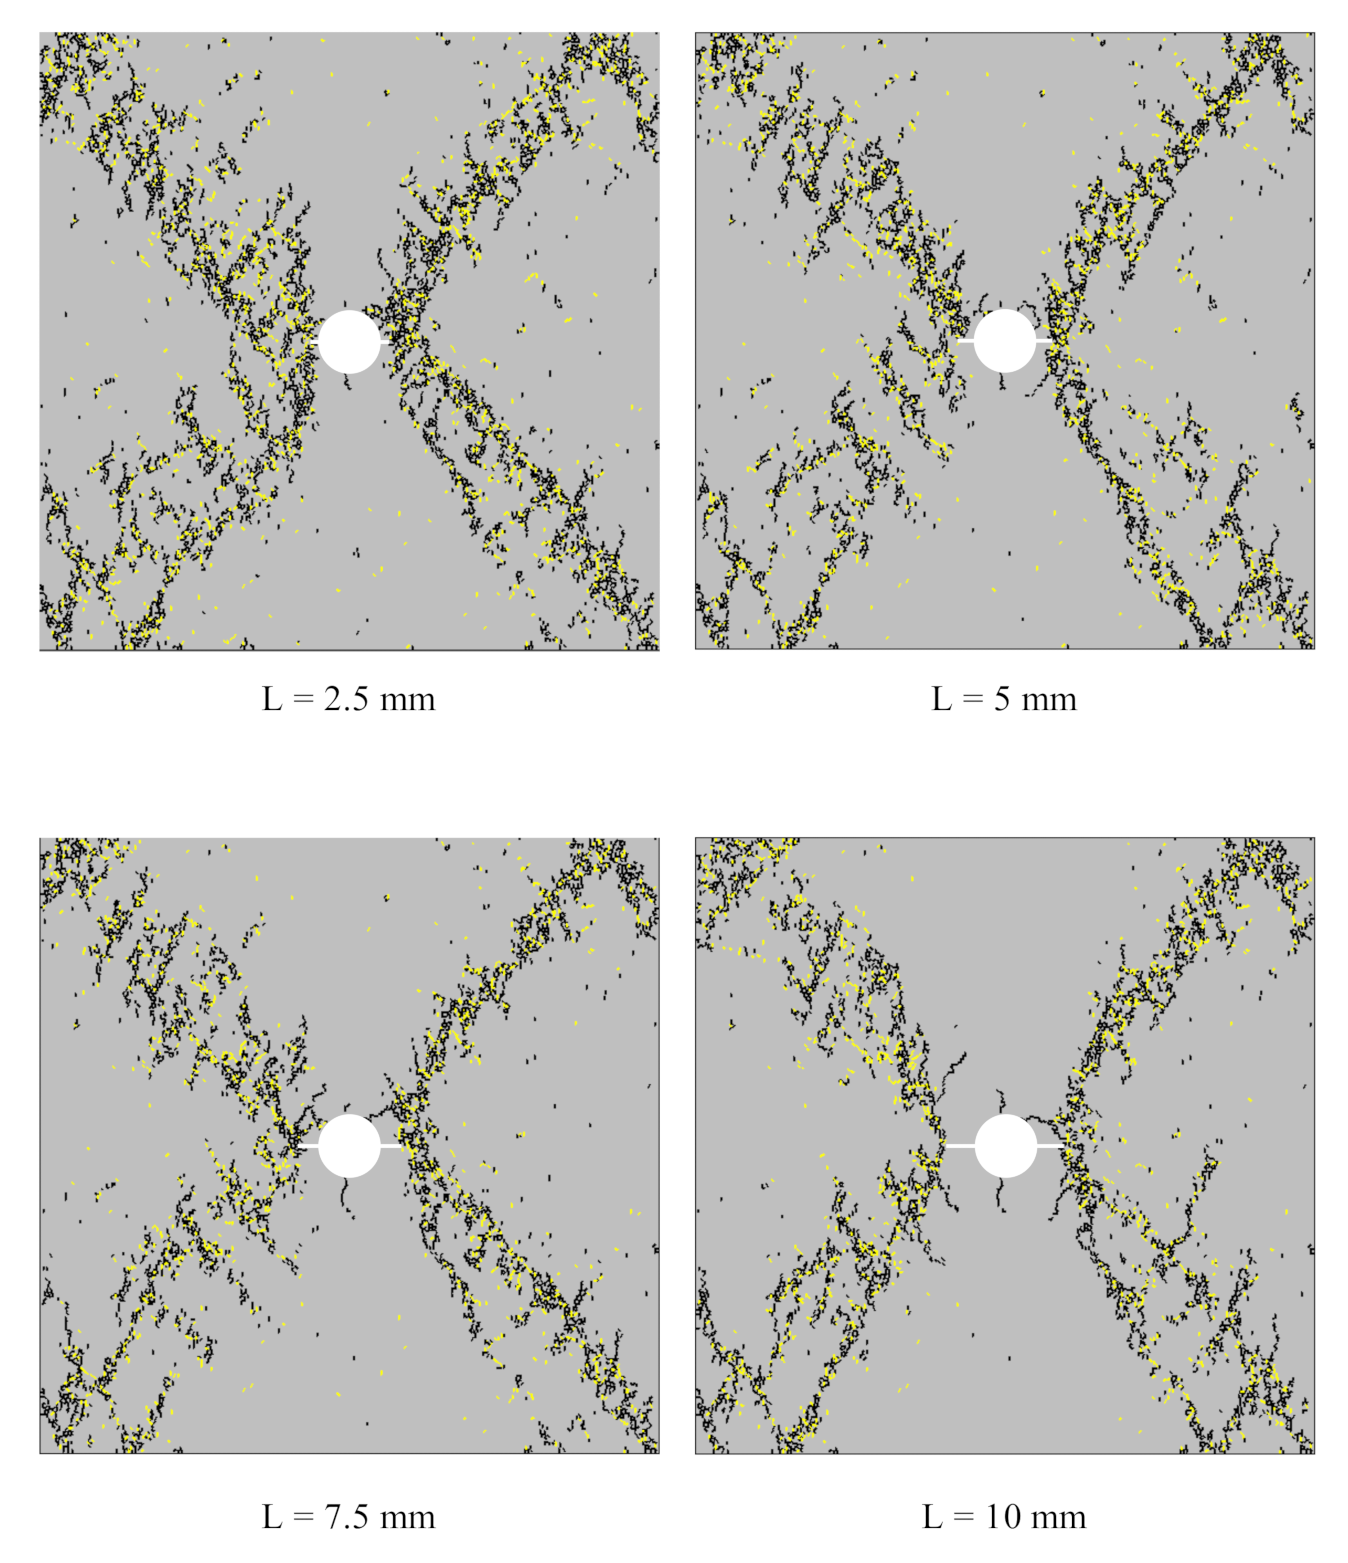
3.3. Influence of the Notch Length on the Failure Mechanism

A rectangular specimen including a hole with a radius of R = 10 mm is modeled. Two notches are created on the wall of the hole at θ = 0° and 180° in the model. The length of the notch is varied using L = 2.5, 5, 7.5, and 10 mm, resulting in L/R ratios of 0.25, 0.5, 0.75, and 1, respectively. The model size, material properties, and boundary conditions explained in Section 3.1 are used.
The failure patterns in the models with different notch lengths at 80% post-peak stress level are illustrated in Figure 11. The figure shows that, when the length of the notch is increased, the tensile failure at the bottom of the hole is longer. In the models with longer notches, the free space resulting from the notches is larger; therefore, a higher number of particles can move towards the free space. As a result, more tensile stress is induced at the top (θ = 90°) and bottom of the hole (θ = 270°). Figure 11 indicates that in the models with different notch lengths, cracks are mainly formed at the tips of the notches. In the models with longer notches, the failure zone is far away from the hole wall. When the length of the notch is decreased, the failure zone is closer to the wall of the hole. The failure pattern around the notched hole in the model with L = 2.5 mm (L/R ratio of 0.25) is shown in Figure 12a. The figure indicates that, in this model, the formed cracks are turned back towards the hole surface and result in the failure of the rock at the wall (θ = 0° and 180°). The displacement vectors of the particles in this model are shown in Figure 12b. The figure indicates higher displacements of the particles in the zone of θ = 315° to 0° compared to the other particles in the model domain. This means that, at the right wall of the hole, the particles moved toward the hole. This can be interpreted as a possible rock failure and fall in the hole in the real-world situation for circular holes with short notch lengths. The failure patterns given in Figure 12 indicate that it is possible to select L/R ratios, including a minimum value, which depends on the in-situ stresses, rock material properties, as well as the boundary and loading conditions, to prevent failure occurring at the wall of the hole. Relation between the peak strength of the specimens and the notch length is shown in Figure 13. The figure indicates that the maximum strength of the specimens decreases as the notch length increases. From the numerical results presented in this section, it can be concluded that the influence of the notches on the fracturing mechanism around a hole is a function of the notch dimensions.
So far, in this study, the specimen width and hole diameter were set to 100 mm and 20 mm, respectively, resulting in a ratio of 5 for the model width to the hole diameter. The models also included notches with a varying length, which may give rise to possibilities of producing results affected by the external boundaries. Therefore, wider specimens with a width of 200 mm, which results in a ratio of 10 for the model width to the hole diameter, are modeled to make sure that the presented results in Figure 11, Figure 12 and Figure 13 are not affected by the boundary effect. Figure 14 shows the failure patterns in the models with the width of 200 mm and a different notch length (80% post-peak stress). The figure indicates that, as the length of the notch increases, the failure zone around the hole is transferred into the rock away from the hole surface. The failure patterns shown in Figure 14 are similar to those in Figure 11. Moreover, Figure 13 indicates that the peak strength of the specimens decreases as the length of the notch increases, which is similar to the models with a width of 100 mm. However, because of the shape’s effect, the strength of the wider specimens is higher, which is in agreement with laboratory experiments [41]. Figure 13 and Figure 14 confirm that the presented results with the model width of 100 mm and the hole diameter of 10 mm are not affected by the boundary effect.

3.4. Influence of Confinement on the Failure Mechanism

In an underground rock structure, the rock mass is usually subjected to confined loading conditions. Therefore, the evaluation of rock behavior under confinement is an essential task for any rock engineering design. In this section, some models are built to study the failure behavior of rock specimens with a notched hole under different confining pressures. This type of loading condition can represent the stress state around an underground circular tunnel. Two notches with the length of L = 5 mm (L/R ratio of 0.50) at the wall of the hole are included in the model. The confining pressure is varied with σ3 = 0, 2, 4, and 6 MPa. The model size, material properties, and boundary conditions explained in Section 3.1 are used.
Firstly, the influence of the confinement on the failure mechanism in the specimens with a circular hole (Figure 5a) is investigated. The failure pattern in the specimens subjected to different confining pressures is shown in Figure 15a. The figure shows the failure patterns at 80% post-peak stress level. In Figure 15a, when the confinement is zero, the fractures are accumulated at the wall of the hole (θ = 0°, 180°). For this case, a minor tensile fracture is formed at the bottom of the hole. The failure planes are extended to the external boundaries of the models which represent the rupture of the specimen. With the increase in the confinement, larger volumes of rock around the hole are fractured. Moreover, the width of the shear bands becomes wider. The influence of the confinement on the peak strength of the specimens is shown in Figure 16. This figure indicates that the strength of a specimen with a circular hole increases with the increase of the confinement.
Next, the influence of the confinement on the failure mechanism in the specimens with a notched hole (Figure 5b) is studied. Two notches with the length of L = 5 mm (L/R ratio of 0.50) are created in the model. In Figure 15b, when the confinement is zero, the failures are nucleated from the notch tips. Some minor tensile fractures are formed at the bottom of the hole (θ = 270°), where the tensile stress is maximum. At higher confinements, this tensile cracking does not appear. When the confining pressure is increased to 2 MPa, a few cracks turned back toward the surface of the hole (θ = 135° and 315°). However, a larger volume of the rock at the sides of the notches remained unfractured. In the models with higher confinements, the damage to the rock at the wall of the hole increased. Figure 15 shows that, at higher confinements, the number of tensile and shear cracks is significantly increased, and the failures bands are wider. In Figure 15b, when the confinement is 6 MPa, cracks coalesced and created crushed zones around the hole, and the notches do not prevent failures at the surface of the hole. The peak strength of the specimens at different confining pressures is illustrated in Figure 16. The figure indicates an upward trend in the strength as the confining stress increases. In this figure, the strength of the specimens in the notched hole models is slightly smaller than that in the circular hole model. In the unconfined case, the difference between the strengths is 1.4 MPa. By increasing the confinement, the difference between the two aforementioned strengths decreases and becomes negligible at the confinement of 6 MPa (0.4 MPa). Figure 15b and Figure 16 show that in the simulated notched hole (L =5 mm; L/R ratio of 0.50), the notches have a meaningful effect on the failure mechanism at confinements up to 4 MPa. However, at higher confining pressures, the influence of the notches on fracturing mechanism becomes negligible.
Numerical simulations are only approximate imitations of real-world systems. Therefore, the accuracy and reliability of the model outputs should be examined. There are different approaches with which to validate a computer model. One approach which is commonly used is to compare the simulation results with real-world observations. However, sometimes it is difficult, expensive, or even impossible to conduct physical experiments. Moreover, in concept studies, the physical tests can be conducted only after a general picture of the mechanisms is drawn through numerical simulations. In these conditions, the numerical results are verified by examining the model output rationality [42].
In this study, no physical experimental results were used to validate the numerical results. However, the adopted numerical models capture some important characteristics and phenomena which are commonly observed in laboratory experiments including: (i) Laying the model macro-parameters in the ranges of the mechanical properties of materials such as soft rocks and concretes; (ii) The similarity of the simulated failure patterns with experimental observations [19,20,21,23]; (iii) A decrease in the specimen strength when a circular hole and notches are created [20]; (iv) An increase in the specimen strength when the width of the specimens is increased [41]. These similarities with laboratory experiments can be used to verify the model output’s reasonableness. The insight gained from the presented numerical simulations can be useful for understanding the failure behavior of defects under pure compression; however, the validity of the numerical results should be examined in practice through physical modeling.

4. Conclusions

Discontinuity is an intrinsic characteristic of rocks which may exist in rocks in different shapes and sizes. The failure behavior of defects such as cracks and notches in rocks and brittle materials under different loading conditions has been studied in previous rock mechanics and fracture mechanics studies. However, the failure behavior of defects under pure compression (negative Mode-I) has been neglected in the previous studies. In this research, a numerical study was conducted to understand how the failure mechanism of specimens containing a circular hole would change in the presence of notches at the surface of the hole. Firstly, the uniaxial compressive test on a rock specimen with a circular hole was modeled and the failure evolution in the specimen was simulated. The results showed that the uniaxial strength of this specimen was 17.4% less than that in the intact specimen. The major failure zones in the specimen with a circular hole formed at the two sides of the hole (θ = 0° and 180°). In a separate model, two notches were created at the surface of the hole. The uniaxial strength of the specimen with the notched hole was 23.3% and 7.1% less than that in the intact specimen and the specimen with the circular hole, respectively. The results showed that, when the notches were created in the model, failure zones around the hole were transferred to the tips of the notches, and the rock at the sides of the notches remained unfractured.
Next, a parametric study was carried out to investigate the influence of the notch length on the fracturing behavior of the specimen by varying the notch length at L = 2.5, 5, 7.5, and 10 mm. It was found that the influence of the notches on the fracturing mechanism around a hole is a function of the notch dimensions. By increasing the notch length, the major failure zones were transferred to a farther distance away from the hole surface. Moreover, it was shown that the maximum strength of the specimens decreased as the notch length increased. Wider specimens with a width of 200 mm, which results in the ratio of 10 for the model width to the hole diameter, were modeled. The results confirmed that the modeling results were not affected by the boundary effect. Then, the influence of the confinement on the failure mechanism in the specimens with a circular hole was investigated. The results showed an upward trend in the peak strength of the specimens as the confining pressure increased, in which the strength of the specimens in the notched hole models was slightly less than that in the circular hole model. This difference became negligible at the confinement of 6 MPa (0.4 MPa). The results showed that the presence of notches resulted in the transfer of failure zones at confinements of up to 4 MPa. However, under the higher confining pressures, the notches do not play any meaningful role in the fracturing mechanism.
The numerical modeling results presented in this study showed that the presence of defects (notches in this study) at the surface of a hole can affect the fracturing mechanism of the rock around that hole. In some cases, the failure at the boundary of the hole was prevented when the notches above L/R ratio of 0.5 were created in the model. It implies that the notches might be useful for controlling the failures at the underground excavation boundaries. It is important to point out that the minimum L/R ratio required to prevent failure at the boundary of the hole depends on the in-situ stresses, material properties, as well as on the boundary and loading conditions. Therefore, numerical modeling should be performed, incorporating the site-specific data to obtain the minimum L/R ratio. In addition, the validity of the numerical results should be examined in practice through physical modeling. In future, it is planned to conduct some laboratory experiments to verify the validity of the numerical results.

Author Contributions

Conceptualization, A.M. and P.H.S.W.K.; methodology, A.M.; software, A.M.; validation, A.M. and P.H.S.W.K.; resources, A.M., P.H.S.W.K. and R.W.; writing—original draft preparation, A.M. and P.H.S.W.K.; writing—review and editing, A.M., P.H.S.W.K. and R.W.; supervision, P.H.S.W.K. All authors have read and agreed to the published version of the manuscript.

Funding

This research is funded by the Jiangxi University of Science and Technology [Fund No. 205200100469], the Distinguished Foreign Expert Talent Program Funding and the National Natural Science Foundation of China [Fund No. 51604126].

Institutional Review Board Statement

Not Applicable.

Informed Consent Statement

Not Applicable.

Data Availability Statement

The data that support the findings of this study are available on request from the corresponding author.

Conflicts of Interest

The authors declare no conflict of interest.

References

  1. Brace, W.F. Dependence of Fracture Strength of Rocks on Grain Size. In Proceedings of the 4th U.S. Symposium on Rock Mechanics (USRMS), University Park, PA, USA, 30 March–1 April 1961. Paper Number: ARMA-61-099. [Google Scholar]
  2. Howarth, D.F.; Rowlands, J.C. Quantitative assessment of rock texture and correlation with drillability and strength properties. Rock Mech. Rock Engng. 1987, 20, 57–85. [Google Scholar] [CrossRef]
  3. Cai, M.; Kaiser, P.K.; Uno, H.; Tasaka, Y.; Minami, M. Estimation of rock mass deformation modulus and strength of jointed hard rock masses using the GSI system. Int. J. Rock Mech. Min. Sci. 2004, 41, 3–19. [Google Scholar] [CrossRef]
  4. Kemeny, J. Time-dependent drift degradation due to the progressive failure of rock bridges along discontinuities. Int. J. Rock Mech. Min. Sci. 2005, 42, 35–46. [Google Scholar] [CrossRef]
  5. Lee, H.; Jeon, S. An experimental and numerical study of fracture coalescence in pre-cracked specimens under uniaxial compression. Int. J. Solids Struct. 2011, 48, 979–999. [Google Scholar] [CrossRef] [Green Version]
  6. Gehle, C.; Kutter, H.K. Breakage and shear behaviour of intermittent rock joints. Int. J. Rock Mech. Min. Sci. 2003, 40, 687–700. [Google Scholar] [CrossRef]
  7. Zhang, P.; Li, N.; Li, X.-B.; Nordlund, E. Compressive failure model for brittle rocks by shear faulting and its evolution of strength components. Int. J. Rock Mech. Min. 2009, 46, 830–841. [Google Scholar] [CrossRef]
  8. Wong, R.H.C.; Chau, K.T. Crack coalescence in a rock-like material containing two cracks. Int. J. Rock Mech. Min. Sci. 1998, 35, 147–164. [Google Scholar] [CrossRef]
  9. Wong, L.N.Y.; Einstein, H.H. Systematic evaluation of cracking behavior in specimens containing single flaws under uniaxial compression. Int. J. Rock Mech. Min. Sci. 2009, 46, 239–249. [Google Scholar] [CrossRef]
  10. Lee, S.; Ravichandran, G. Crack initiation in brittle solids under multiaxial compression. Eng. Fract. Mech. 2003, 70, 1645–1658. [Google Scholar] [CrossRef]
  11. Wang, Q.Z.; Feng, F.; Ni, M.; Gou, X.P. Measurement of mode I and mode II rock dynamic fracture toughness with cracked straight through flattened Brazilian disc impacted by split Hopkinson pressure bar. Eng. Fract. Mech. 2011, 78, 2455–2469. [Google Scholar] [CrossRef]
  12. Park, C.H.; Bobet, A. Crack initiation, propagation and coalescence from frictional flaws in uniaxial compression. Eng. Fract. Mech. 2010, 77, 2727–2748. [Google Scholar] [CrossRef]
  13. Zhuang, X.; Chun, J.; Zhu, H. A comparative study on unfilled and filled crack propagation for rock-like brittle material. Theor. Appl. Fract. Mech. 2014, 72, 110–120. [Google Scholar] [CrossRef]
  14. Yang, S.-Q.; Liu, X.-R.; Jing, H.-W. Experimental investigation on fracture coalescence behavior of red sandstone containing two unparallel fissures under uniaxial compression. Int. J. Rock Mech. Min. Sci. 2013, 63, 82–92. [Google Scholar] [CrossRef]
  15. Manouchehrian, A.; Sharifzadeh, M.; Marji, M.F.; Gholamnejad, J. A bonded particle model for analysis of the flaw orientation effect on crack propagation mechanism in brittle materials under compression. Arch. Civ. Mech. Eng. 2014, 14, 40–52. [Google Scholar] [CrossRef]
  16. Kulatilake, P.H.S.W.; Malama, B.; Wang, J. Physical and particle flow modeling of jointed rock block behavior under uniaxial loading. Int. J. Rock Mech. Min. Sci. 2001, 38, 641–657. [Google Scholar] [CrossRef]
  17. Wu, H.; Zhao, G.; Kulatilake, P.H.S.W.; Liang, W.; Wang, E. Fracturing behaviour of sandstone specimens with a cavity formed by intersecting excavations under compression: Experimental study and numerical modelling. Strain 2019, 55, e12316. [Google Scholar] [CrossRef]
  18. Le, H.; Sun, S.; Kulatilake Pinnaduwa, H.S.W.; Wei, J. Effect of Grout on Mechanical Properties and Cracking Behavior of Rock-Like Specimens Containing a Single Flaw under Uniaxial Compression. Int. J. Geomech. 2018, 18, 04018129. [Google Scholar] [CrossRef]
  19. Wu, H.; Kulatilake, P.H.S.W.; Zhao, G.; Liang, W. Stress distribution and fracture evolution around a trapezoidal cavity in sandstone loaded in compression. Theor. Appl. Fract. Mech. 2019, 104, 102348. [Google Scholar] [CrossRef]
  20. Wu, H.; Zhao, G.; Liang, W. Investigation of cracking behavior and mechanism of sandstone specimens with a hole under compression. Int. J. Mech. Sci. 2019, 163, 105084. [Google Scholar] [CrossRef]
  21. Lin, Q.; Cao, P.; Liu, Y.; Cao, R.; Li, J. Mechanical behaviour of a jointed rock mass with a circular hole under compression-shear loading: Experimental and numerical studies. Theor. Appl. Fract. Mech. 2021, 114, 102998. [Google Scholar] [CrossRef]
  22. Han, W.; Jiang, Y.; Luan, H.; Du, Y.; Zhu, Y.; Liu, J. Numerical investigation on the shear behavior of rock-like materials containing fissure-holes with FEM-CZM method. Comput. Geotech. 2020, 125, 103670. [Google Scholar] [CrossRef]
  23. Berto, F.; Lazzarin, P.; Ayatollahi, M.R. Brittle fracture of sharp and blunt V-notches in isostatic graphite under pure compression loading. Carbon 2013, 63, 101–116. [Google Scholar] [CrossRef]
  24. Torabi, A.R.; Firoozabadi, M.; Ayatollahi, M.R. Brittle fracture analysis of blunt V-notches under compression. Int. J. Solids Struct. 2015, 67, 219–230. [Google Scholar] [CrossRef]
  25. Bura, E.; Derpeński, Ł.; Seweryn, A. Fracture in PMMA notched specimens under compression–Experimental study. Polym. Test. 2019, 77, 105923. [Google Scholar] [CrossRef]
  26. Sharma, D.S. Stress concentration around circular/elliptical/triangular cutouts in infinite composite plate. In Proceedings of the World Congress on Engineering, London, UK, 6–8 July 2011; p. 6. [Google Scholar]
  27. Hubbert, M.K.; Willis, D.G. Mechanics of Hydraulic Fracturing. Trans. AIME 1957, 210, 153–168. [Google Scholar] [CrossRef]
  28. Anderson, T.L. Fracture Mechanics: Fundamentals and Applications; CRC Press: Boca Raton, FL, USA, 2017. [Google Scholar]
  29. Manouchehrian, A.; Kulatilake, H.S.W.; Wu, R. Strainburst control in deep tunnels using a notched excavation method. Int. J. Geomech. 2021. revision submitted. [Google Scholar]
  30. Javanmardi, M.R.; Maheri, M.R. Extended finite element method and anisotropic damage plasticity for modelling crack propagation in concrete. Finite Elem. Anal. Des. 2019, 165, 1–20. [Google Scholar] [CrossRef]
  31. Peng, X.; Atroshchenko, E.; Kerfriden, P.; Bordas, S.P.A. Isogeometric boundary element methods for three dimensional static fracture and fatigue crack growth. Comput. Methods Appl. Mech. Eng. 2017, 316, 151–185. [Google Scholar] [CrossRef] [Green Version]
  32. Schöpfer, M.P.J.; Abe, S.; Childs, C.; Walsh, J.J. The impact of porosity and crack density on the elasticity, strength and friction of cohesive granular materials: Insights from DEM modelling. Int. J. Rock Mech. Min. Sci. 2009, 46, 250–261. [Google Scholar] [CrossRef] [Green Version]
  33. Tan, X.C.; Kou, S.Q.; Lindqvist, P.A. Application of the DDM and fracture mechanics model on the simulation of rock breakage by mechanical tools. Eng. Geol. 1998, 49, 277–284. [Google Scholar] [CrossRef]
  34. Manouchehrian, A.; Marji, M.F. Numerical analysis of confinement effect on crack propagation mechanism from a flaw in a pre-cracked rock under compression. Acta Mech. Sin. 2012, 28, 1389–1397. [Google Scholar] [CrossRef]
  35. Sukumar, N.; Moës, N.; Moran, B.; Belytschko, T. Extended finite element method for three-dimensional crack modelling. Int. J. Numer. Methods Eng. 2000, 48, 1549–1570. [Google Scholar] [CrossRef]
  36. Fatehi Marji, M.; Dehghani, I. Kinked crack analysis by a hybridized boundary element/boundary collocation method. Int. J. Solids Struct. 2010, 47, 922–933. [Google Scholar] [CrossRef] [Green Version]
  37. Wu, H.; Kulatilake, P.H.S.W.; Zhao, G.; Liang, W.; Wang, E. A comprehensive study of fracture evolution of brittle rock containing an inverted U-shaped cavity under uniaxial compression. Comput. Geotech. 2019, 116, 103219. [Google Scholar] [CrossRef]
  38. Itasca. PFC 3D Manual, version 3.1; Itasca Consulting Group: Minneapolis, MN, USA, 2004. [Google Scholar]
  39. Yang, X.; Kulatilake, P.H.S.W.; Jing, H.; Yang, S. Numerical simulation of a jointed rock block mechanical behavior adjacent to an underground excavation and comparison with physical model test results. Tunn. Undergr. Space Technol. 2015, 50, 129–142. [Google Scholar] [CrossRef]
  40. Mehranpour, M.H.; Kulatilake, P.H.S.W. Improvements for the smooth joint contact model of the particle flow code and its applications. Comput. Geotech. 2017, 87, 163–177. [Google Scholar] [CrossRef]
  41. Hudson, J.A.; Crouch, S.L.; Fairhurst, C. Soft, stiff and servo-controlled testing machines: A review with reference to rock failure. Eng. Geol. 1972, 6, 155–189. [Google Scholar] [CrossRef]
  42. Banks, J.; Carson II, J.; Nelson, B.; Nicol, D. Discrete Event System Simulation, 5th ed.; Pearson Education Inc.: Upper Saddle River, NJ, USA, 2010. [Google Scholar]
Figure 1. Basic modes of crack extension.
Applsci 11 07797 g001
Figure 2. The used coordinate system to express the stress state in a two directional stress field: (a) Around a circular hole and (b) near a crack tip.
Applsci 11 07797 g002
Figure 3. Failure zones in specimens with (a) a circular hole, (b) a crack, and (c) a notched hole under compression.
Applsci 11 07797 g003
Figure 4. The tangential stress distribution around (a) a regular tunnel and (b) a notched tunnel [29].
Applsci 11 07797 g004
Figure 5. Geometry of the models with (a) a circular hole and (b) a notched hole.
Applsci 11 07797 g005
Figure 6. Particle assembly in the notched hole model (L = 10 mm).
Applsci 11 07797 g006
Figure 7. The stress–strain curves obtained from PFC2d models.
Applsci 11 07797 g007
Figure 8. Failure evolution in (a) circular hole, and (b) notched hole (black and yellow lines represent tensile and shear cracks, respectively).
Applsci 11 07797 g008
Figure 9. The close views of failure zones around the left side of the hole at peak-stress in the models with (a) a circular hole, and (b) a notched hole with L = 5 mm.
Applsci 11 07797 g009
Figure 10. (a) The load bearing closed ring around a circular hole; (b) the destroyed closed ring around a notched hole.
Applsci 11 07797 g010
Figure 11. The failure patterns in the models with different notch lengths (80% post-peak stress).
Applsci 11 07797 g011
Figure 12. Failure pattern and displacement vector distribution around the notched hole with L = 2.5 mm (L/R ratio of 0.25).
Applsci 11 07797 g012
Figure 13. Relation between the peak strength and the notch length in the models with the widths of 100 mm and 200 mm.
Applsci 11 07797 g013
Figure 14. The failure patterns in the models with the width of 200 mm and different notch lengths (80% post-peak stress).
Applsci 11 07797 g014
Figure 15. Failure patterns in the (a) circular hole and (b) notched hole models at 80% post-peak stress level for different confining pressures.
Applsci 11 07797 g015
Figure 16. The peak strength at different confining pressures in the two models.
Applsci 11 07797 g016
Table 1. PFC2D-calibrated micro-mechanical parameters for the simulated rock specimen.
Micro-ParametersValue
Particle minimum radius, R (mm)0.4
Particle radius ratio, Rmax/Rmin1.66
Particle density (kg/m3)2000
Particle contact modulus, Ec (GPa)6.1
Particle stiffness ratio, kn/ks1.0
Particle friction coefficient, μ 0.5
Parallel-bond modulus, E ¯ c (GPa)6.1
Parallel-bond stiffness ratio, k ¯ n / k ¯ s 1.0
Parallel-bond radius multiplier, λ ¯ 1.0
Parallel-bond normal strength, mean (MPa)12
Parallel-bond normal strength, std. dev. (MPa)2.0
Parallel-bond shear strength, mean (MPa)12
Parallel-bond shear strength, std. dev. (MPa)2.0
Table 2. The macro-mechanical parameters for the simulated rock specimen.
Macro-ParametersValue
Uniaxial compressive strength, σ c (MPa)18.95
Brazilian tensile strength, σ t (MPa)2.92
Young’s modulus, E (GPa)10.02
Poisson ratio, υ 0.11
Cohesion, c (MPa)7.03
Internal friction angle, φ (°)18
Publisher’s Note: MDPI stays neutral with regard to jurisdictional claims in published maps and institutional affiliations.

