Article

Deformation Behavior of Saturated Marine Silt under Principal Stress Rotation as Induced by Wave Loading

1
State Key Laboratory of Geomechanics and Geotechnical Engineering, Institute of Rock and Soil Mechanics, Chinese Academy of Sciences, Wuhan 430071, China
2
University of Chinese Academy of Sciences, Beijing 100049, China
3
College of Marine Science and Technology, China University of Geosciences, 388 Lumo Road, Wuhan 430074, China
4
School of Civil Engineering and Architecture, Anhui University of Science & Technology, Huainan 232001, China
*
Author to whom correspondence should be addressed.
Appl. Sci. 2021, 11(20), 9458; https://doi.org/10.3390/app11209458
Submission received: 6 August 2021 / Revised: 27 September 2021 / Accepted: 29 September 2021 / Published: 12 October 2021

Abstract

:
An experimental study aimed at providing insights into the cyclic deformation behavior of saturated marine silt under principal rotation, as induced by wave loading, is presented. Using the GDS hollow cylinder apparatus, a series of undrained tests are performed and the specimens at identical initial states are subjected to combined axial–torsional cyclic loading that imposes different levels of stress rotation. The cumulative generalized shear strain γg is used to describe the deformation of the silt under complex stress paths. The test results show that the cumulative generalized shear strain is significantly dependent on the cyclic stress ratio (CSR) and cyclic loading amplitude ratio δ. The cumulative generalized shear strain increases with the increase in CSR and decreases with the increase in δ. The development trend of γg can be well predicted through the correct Monismith model in the non-liquefaction silt, with a low error that is generally less than 10%.

1. Introduction

Soft silty soils are widespread in deltas, estuaries and coastal zones, and are prone to liquefaction under cyclic wave loading because of their high natural water content and weak permeability [1,2], which may result in serious damage to marine structures, such as the instability of gravity platforms [3], large horizontal displacements of immersed tunnels [4], tilting of caissons [5], shear failure of breakwater slopes [6], shear and tensile failures of bolts [7], and floating up of pipelines [8]. Such silty soils are also characterized by high anisotropy of strength properties, mainly manifested as stress path dependence. In nature, the wave-induced cyclic loading is non-proportional and multiaxial in a saturated seabed of finite thickness, accompanied by simultaneous changeover in the magnitude and direction of the principal stress. It has been recognized that the rotation of the principal stress axis plays a crucial role in wave-induced liquefaction of sand beds; for example, the resistance to liquefaction under progressive waves is considerably smaller than the resistance exhibited under standing waves for sand beds [9]. However, the effects of fabric anisotropy and non-proportional loading on silt beds still require further study.
Soil anisotropy has been widely examined in numerous laboratory tests, under proportional and non-proportional loading, and has also been considered in a variety of soil constitutive models [10,11,12,13,14,15,16]. It also has been found that sandy and silty soils exhibit more complex undrained behavior under cyclic loading than under monotonic loading [17]; for example, ref. [18] carried out a string of triaxial tests and concluded that with the increase in the degree of soil anisotropy, the shear strength of sand increases in the monotonic triaxial test, while the liquefaction resistance decreases in the cyclic triaxial test. This can be interpreted by the fact that under axial stress-controlled cyclic loading, sand exhibits a considerably higher contraction on the triaxial extension side, which is definitive evidence of soil anisotropy being related to the orientation of the major principal stress direction. However, the cyclic triaxial test is a typical case of proportional loading, which cannot involve either continuous principal stress rotations or their orientation with regard to the axis of anisotropy.
In most practical cases, the stress path tends to deviate from the proportional loads significantly, such as wave loads on seabed sediments [19], multi-directional seismic loads on the ground [20], and train moving loads in railway track foundations, involving continuous rotation of the principal stress axes during cyclic shear deformation. At the same time, the use of hollow cylinder torsional shear tests offers an effective way to investigate soil anisotropic behavior, considering that the orientation and magnitude of the principal stress can be independently controlled in these tests. Most of the previous studies on the torsional shear testing of hollow cylinders have concentrated on situations where the major principal stress direction was fixed at specific values, or the deviatoric stress was continuously rotated during the cyclic shear process. However, when allowing for soil that is highly anisotropic and nonlinear, the study of the coupling effect of the principal stress magnitude and principal stress direction is still in its infancy. Indeed, the stress path involving simultaneous changeover in the magnitude and directions of the principal stress is an even more general case of non-proportional loading, as compared with rotational shear, defined as the shear stress that is perpendicular to the mirror image generated by a thin-walled hollow cylindrical specimen, caused by torsion. This condition can be best demonstrated by the fact that the stress path of finite seabed deposits is related to wave loading [21].
This paper aims to explore the influence of wave-induced non-proportional loading patterns on the undrained deformation behavior of saturated marine silt, based on a series of undrained cyclic tests using a hollow cylinder apparatus. The test samples are from the coastal area of Nantong, Jiangsu Province (Figure 1). The correspondent cyclic shear mode and stress path are replicated by simultaneous changeover in the magnitudes and directions of the principal stress. The emphasis of this study is placed on the effects of the changeover in the magnitudes and directions of the principal stress on the cyclic behavior of saturated silt, characterized by the cyclic stress ratio (CSR) and the ratio (δ) of the amplitude of deviatoric stress components (i.e., deviator stress and torsional shear stress).

2. Test Procedures

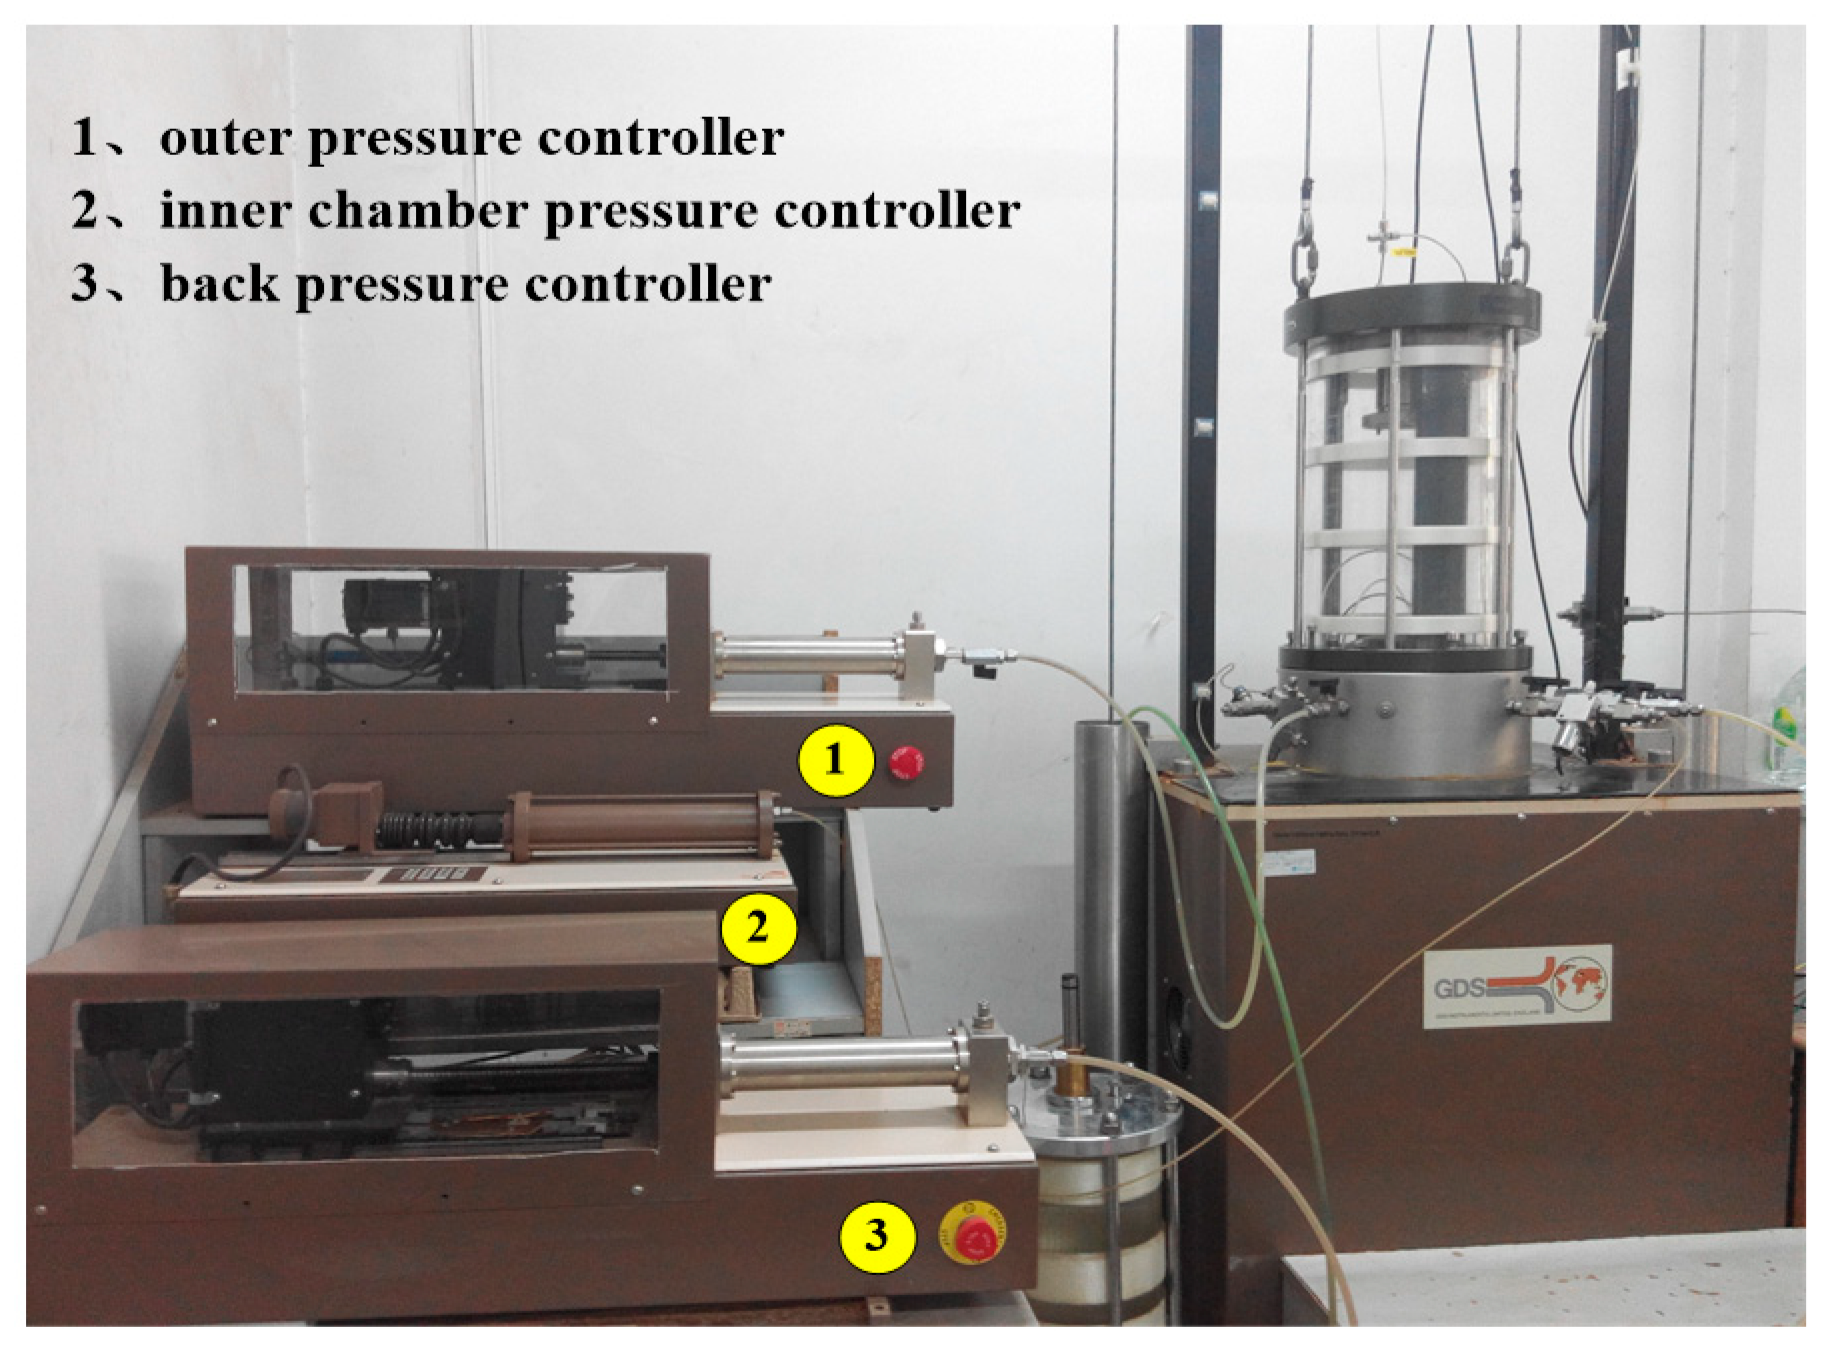
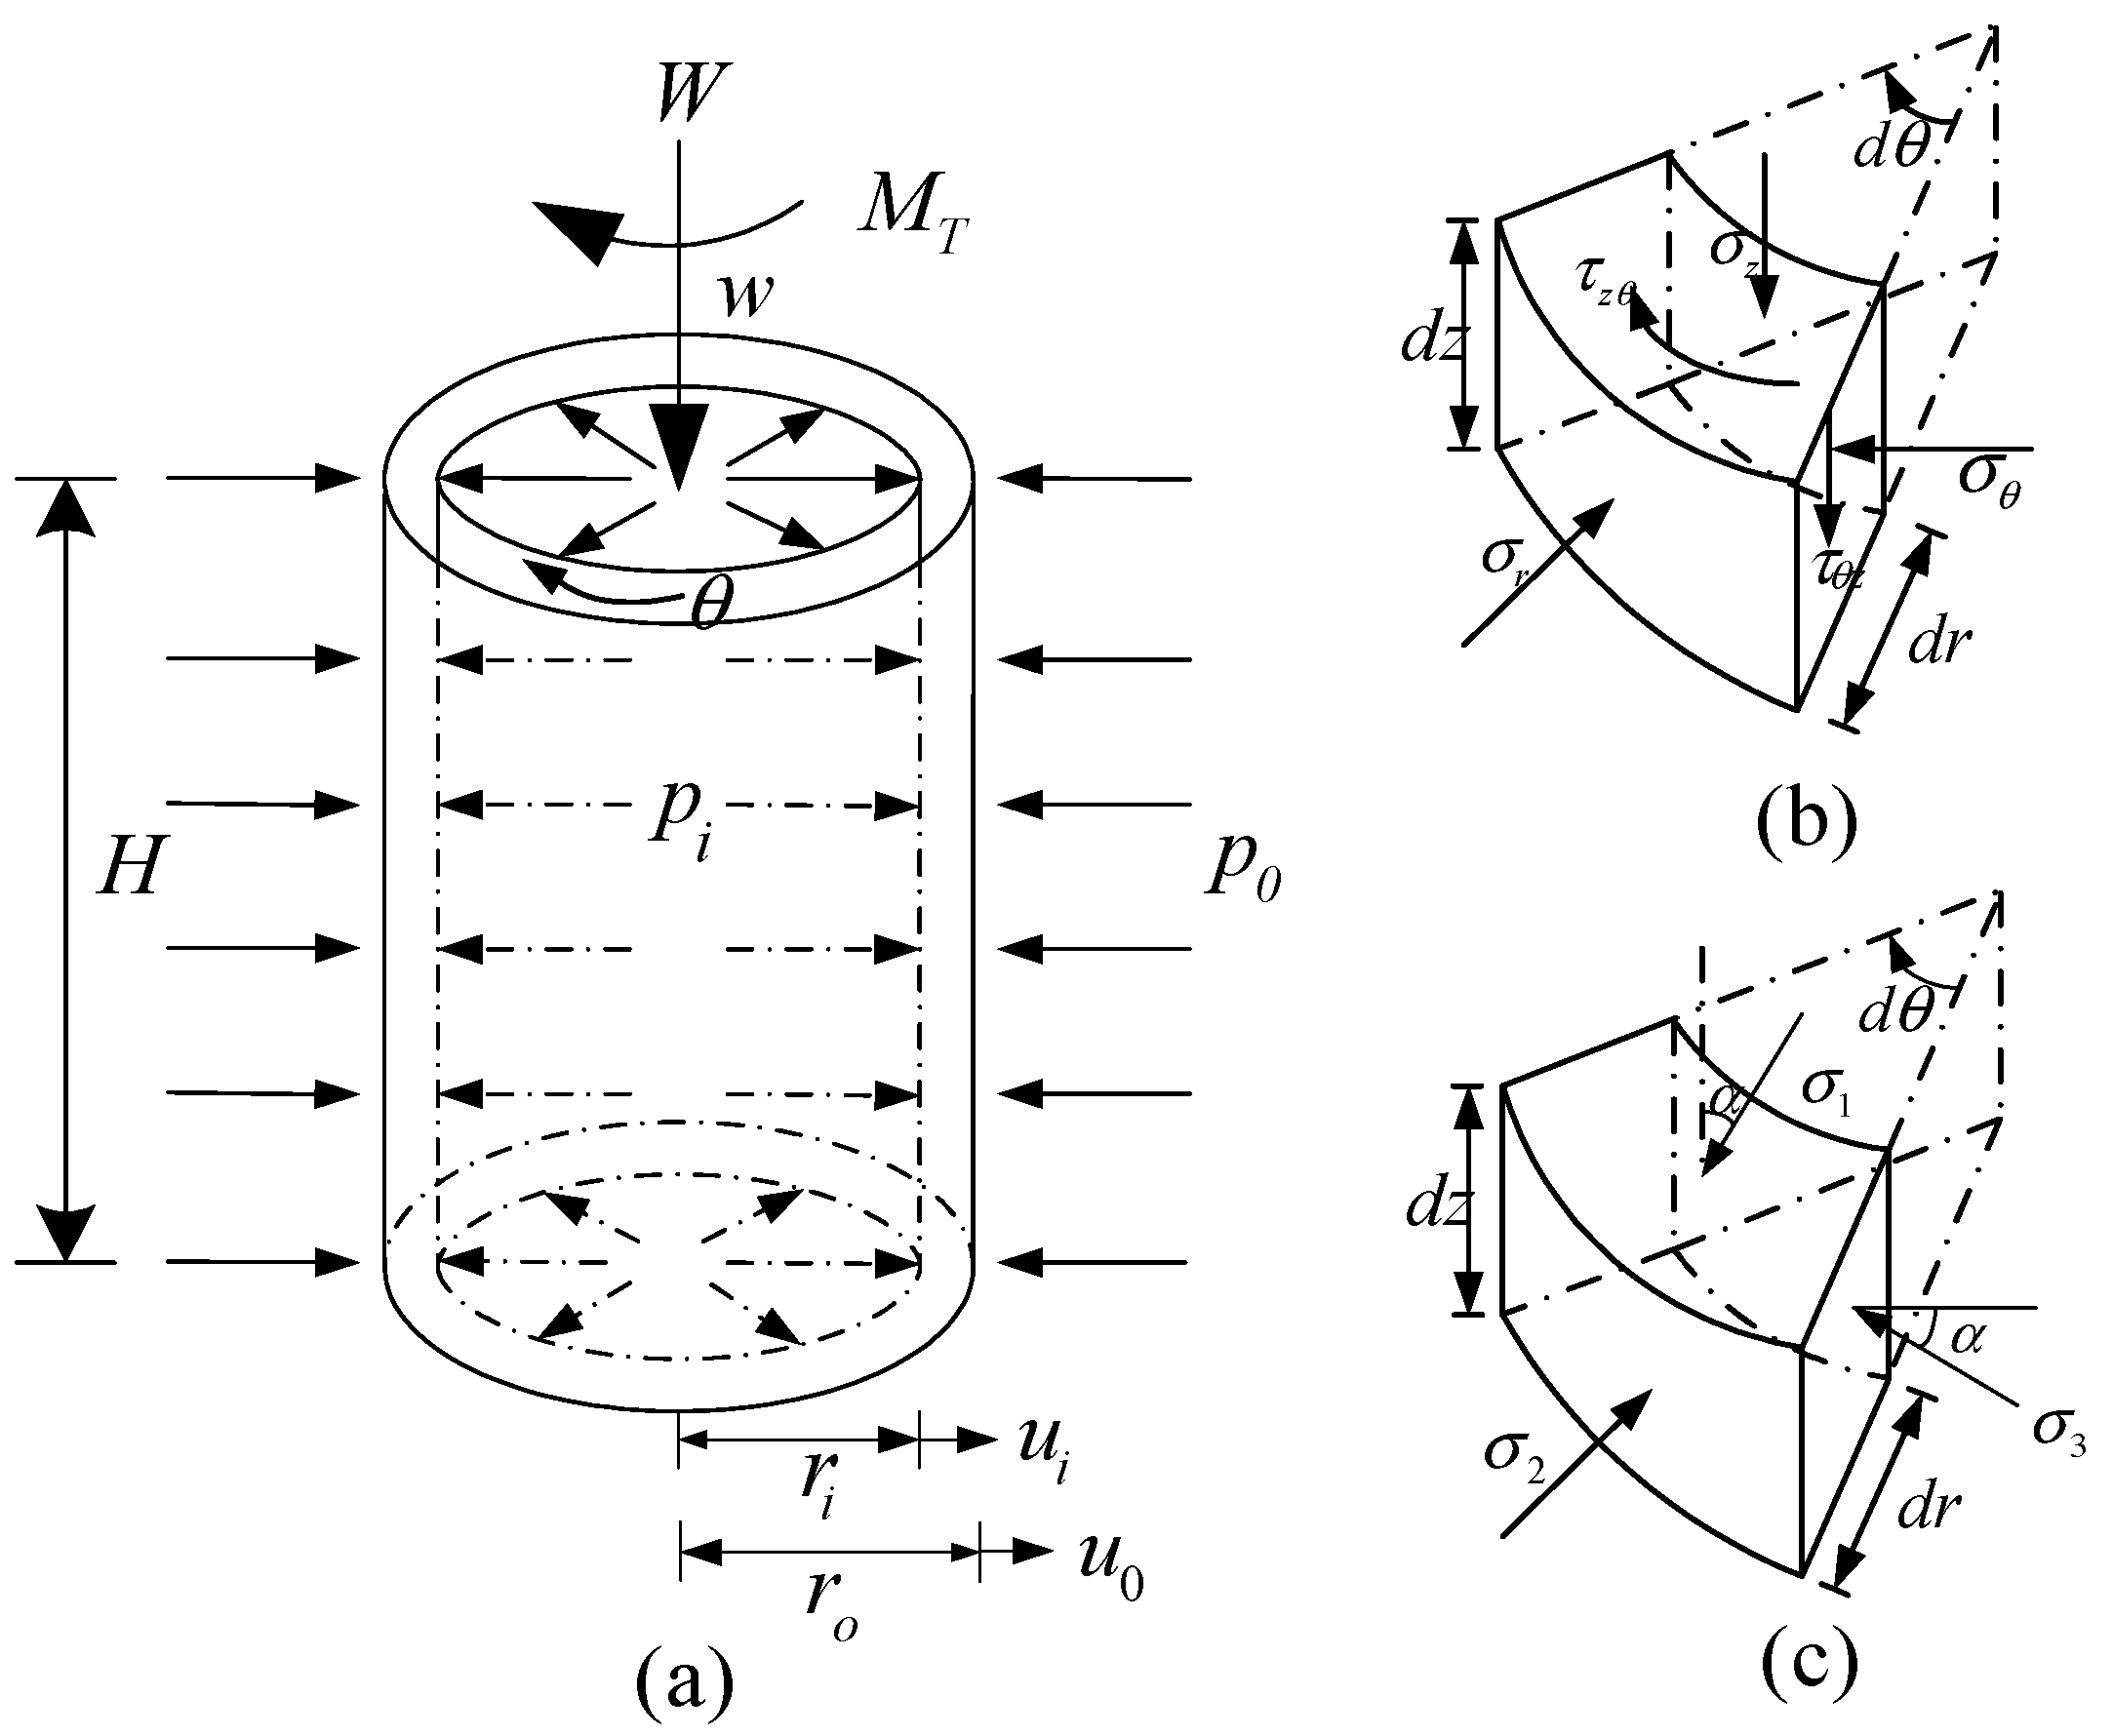
2.1. Experiment Equipment

A hollow cylinder apparatus (HCA) manufactured by GDS Instruments is adopted in this study (Figure 2). The capability of GDS HCA to accurately measure and control such small stress differences has been discussed in detail and fully confirmed [22,23]. The HCA can cyclically and independently control the vertical/torque load (W/MT) and outer/inner cell pressure po/pi (Figure 3a). Inner wall radial displacement ui and outer wall radial displacement uo are calculated from the volume change in the inner and outer pressure, respectively, axial displacement w and rotation angle θ are measured by an axial displacement sensor and a rotation angle displacement sensor, respectively. The application of W, po, and pi on the specimen contributed to developing the stress components of vertical (axial) stress σz, and MT contributed to developing the stress components of torsional shear stress τ; whereas, simultaneous application of loads po and pi was used to control the stress components of radial stress σr and circumferential or tangential stress σθ in the hollow cylindrical specimen element. The stress components of σz, σr, σθ, and τ in an element of a hollow cylinder specimen are illustrated in Figure 3b. By adjusting these stresses, the major principal stress σ1, intermediate principal stress σ2, and minor principal stress σ3 can be independently controlled (Figure 3c). Furthermore, the corresponding vertical strain ɛz, radial strain ɛr, circumferential strain ɛθ, and shear strain γ can be determined by the application of the formulas, assuming that the outer and inner surfaces of specimens retain their correct cylinder shape during torsion [24], compressive stresses and contractive strains are positive in accordance with the geomechanics sign convention.

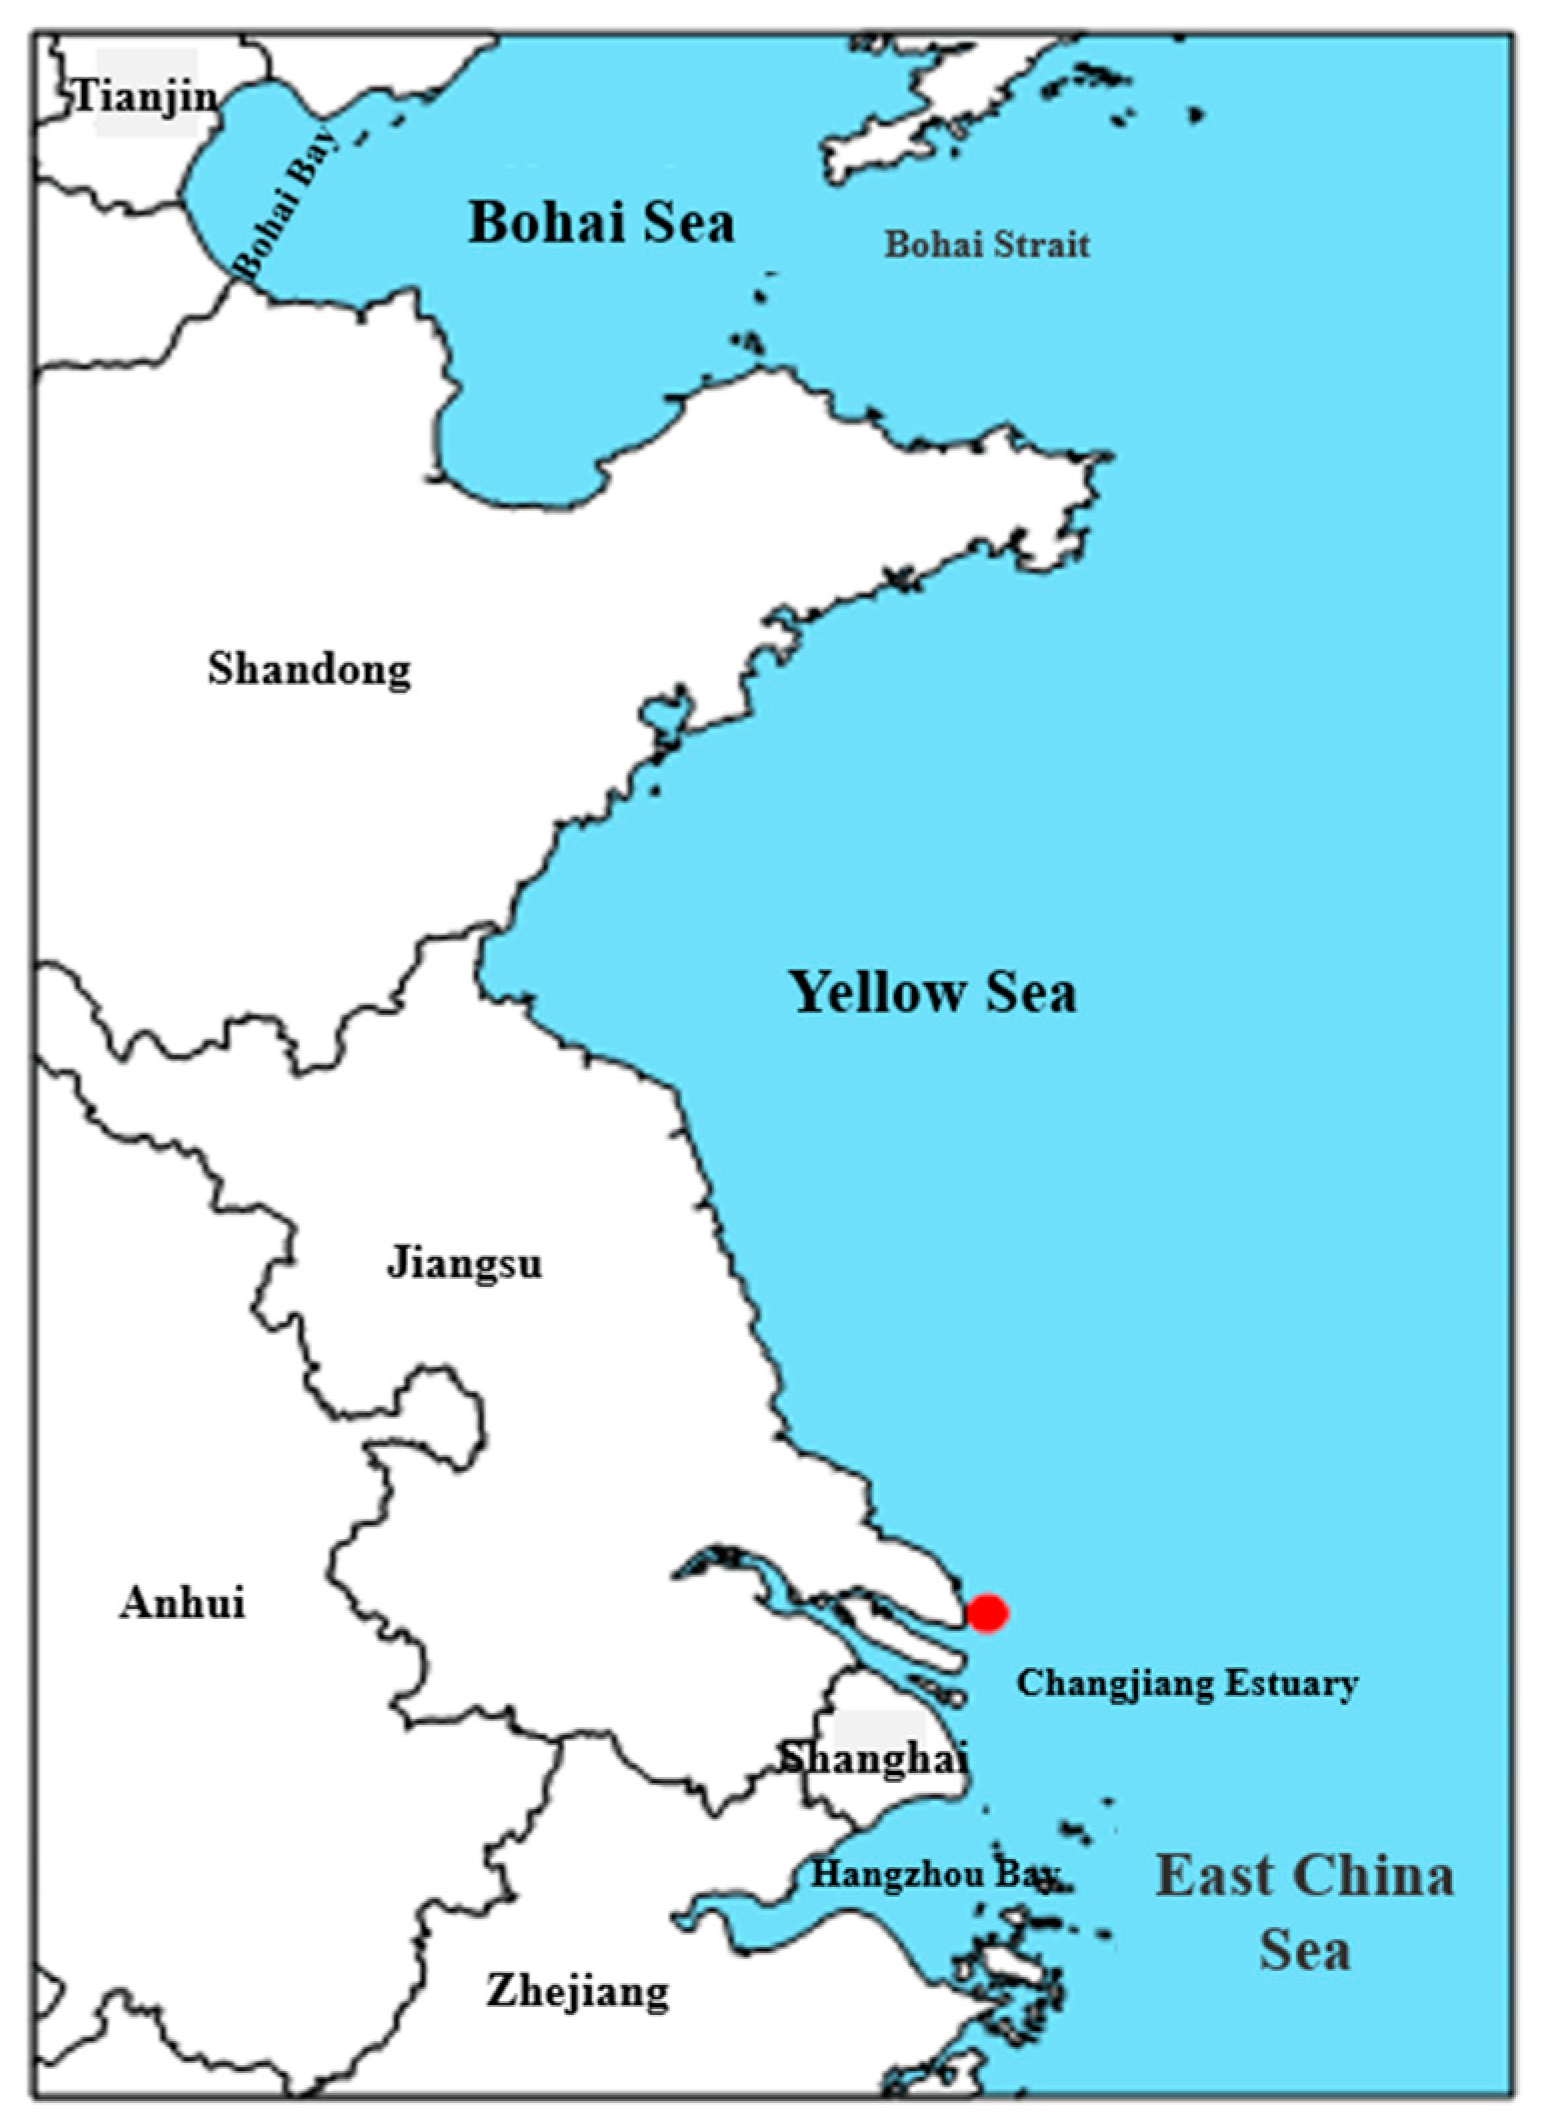
2.2. Tested Material, Specimen Preparation and Saturation Method

The quartzitic silt soil in powdered form used in the tests was taken from Nantong tidal flat area, China. The Nantong silt was taken from within 2~5 m below the seabed. The detailed location is shown in Figure 3. Figure 4 shows the particle size distribution of Nantong silt, including 57.7% silt, 1.3% clay, and 41.0% fine sand particles. The natural void ratio is 0.935. The index properties of the silt are summarised in Table 1. Specimens with an outer radius of ro = 50 mm, inner radius of ri = 30 mm, and height of H = 200 mm were tested. The specimens were prepared by dry deposition method in eight equal-mass layers; a more detailed process of sample preparation was presented in [25]. All specimens were tested under saturated, carbon dioxide flushing, and de-aired water flushing was carried out first, then back pressure saturation followed [25]. When Skempton’s B-value > 0.95, the specimen was considered fully saturated [26]. Following saturation, p0 = 100 kPa was applied to all specimens to complete the isotropic consolidation.

2.3. Test Program

The wave-induced stress path in the seabed is traditionally considered as a circle, which only occurs in an infinite seabed [11]. A nonstandard elliptical rotation stress path is shown to be a more common stress state based on the analytical solutions for a finite seabed [27]. The elliptical rotation stress path and the loading waveform are shown in Figure 5. For both the circular and elliptical stress paths, the mean total stress, p, is fixed at a constant within one loading cycle, but the intermediate principal stress ratio, b, changes in a sinusoidal form between 0 and 1. The cyclic stress ratio (CSR) is defined as qmax/p’0, where qmax is max(σmax,τmax) and p’0 is the initial confining pressure. The cyclic loading amplitude ratio is δ = σmax/τmax. Considering that the period of a typical ocean wave ranges from 5 to 20 s [28], the loading frequency is set as 0.1. Table 2 details the case of 15 undrained cyclic shears.

3. Test Results and Analysis

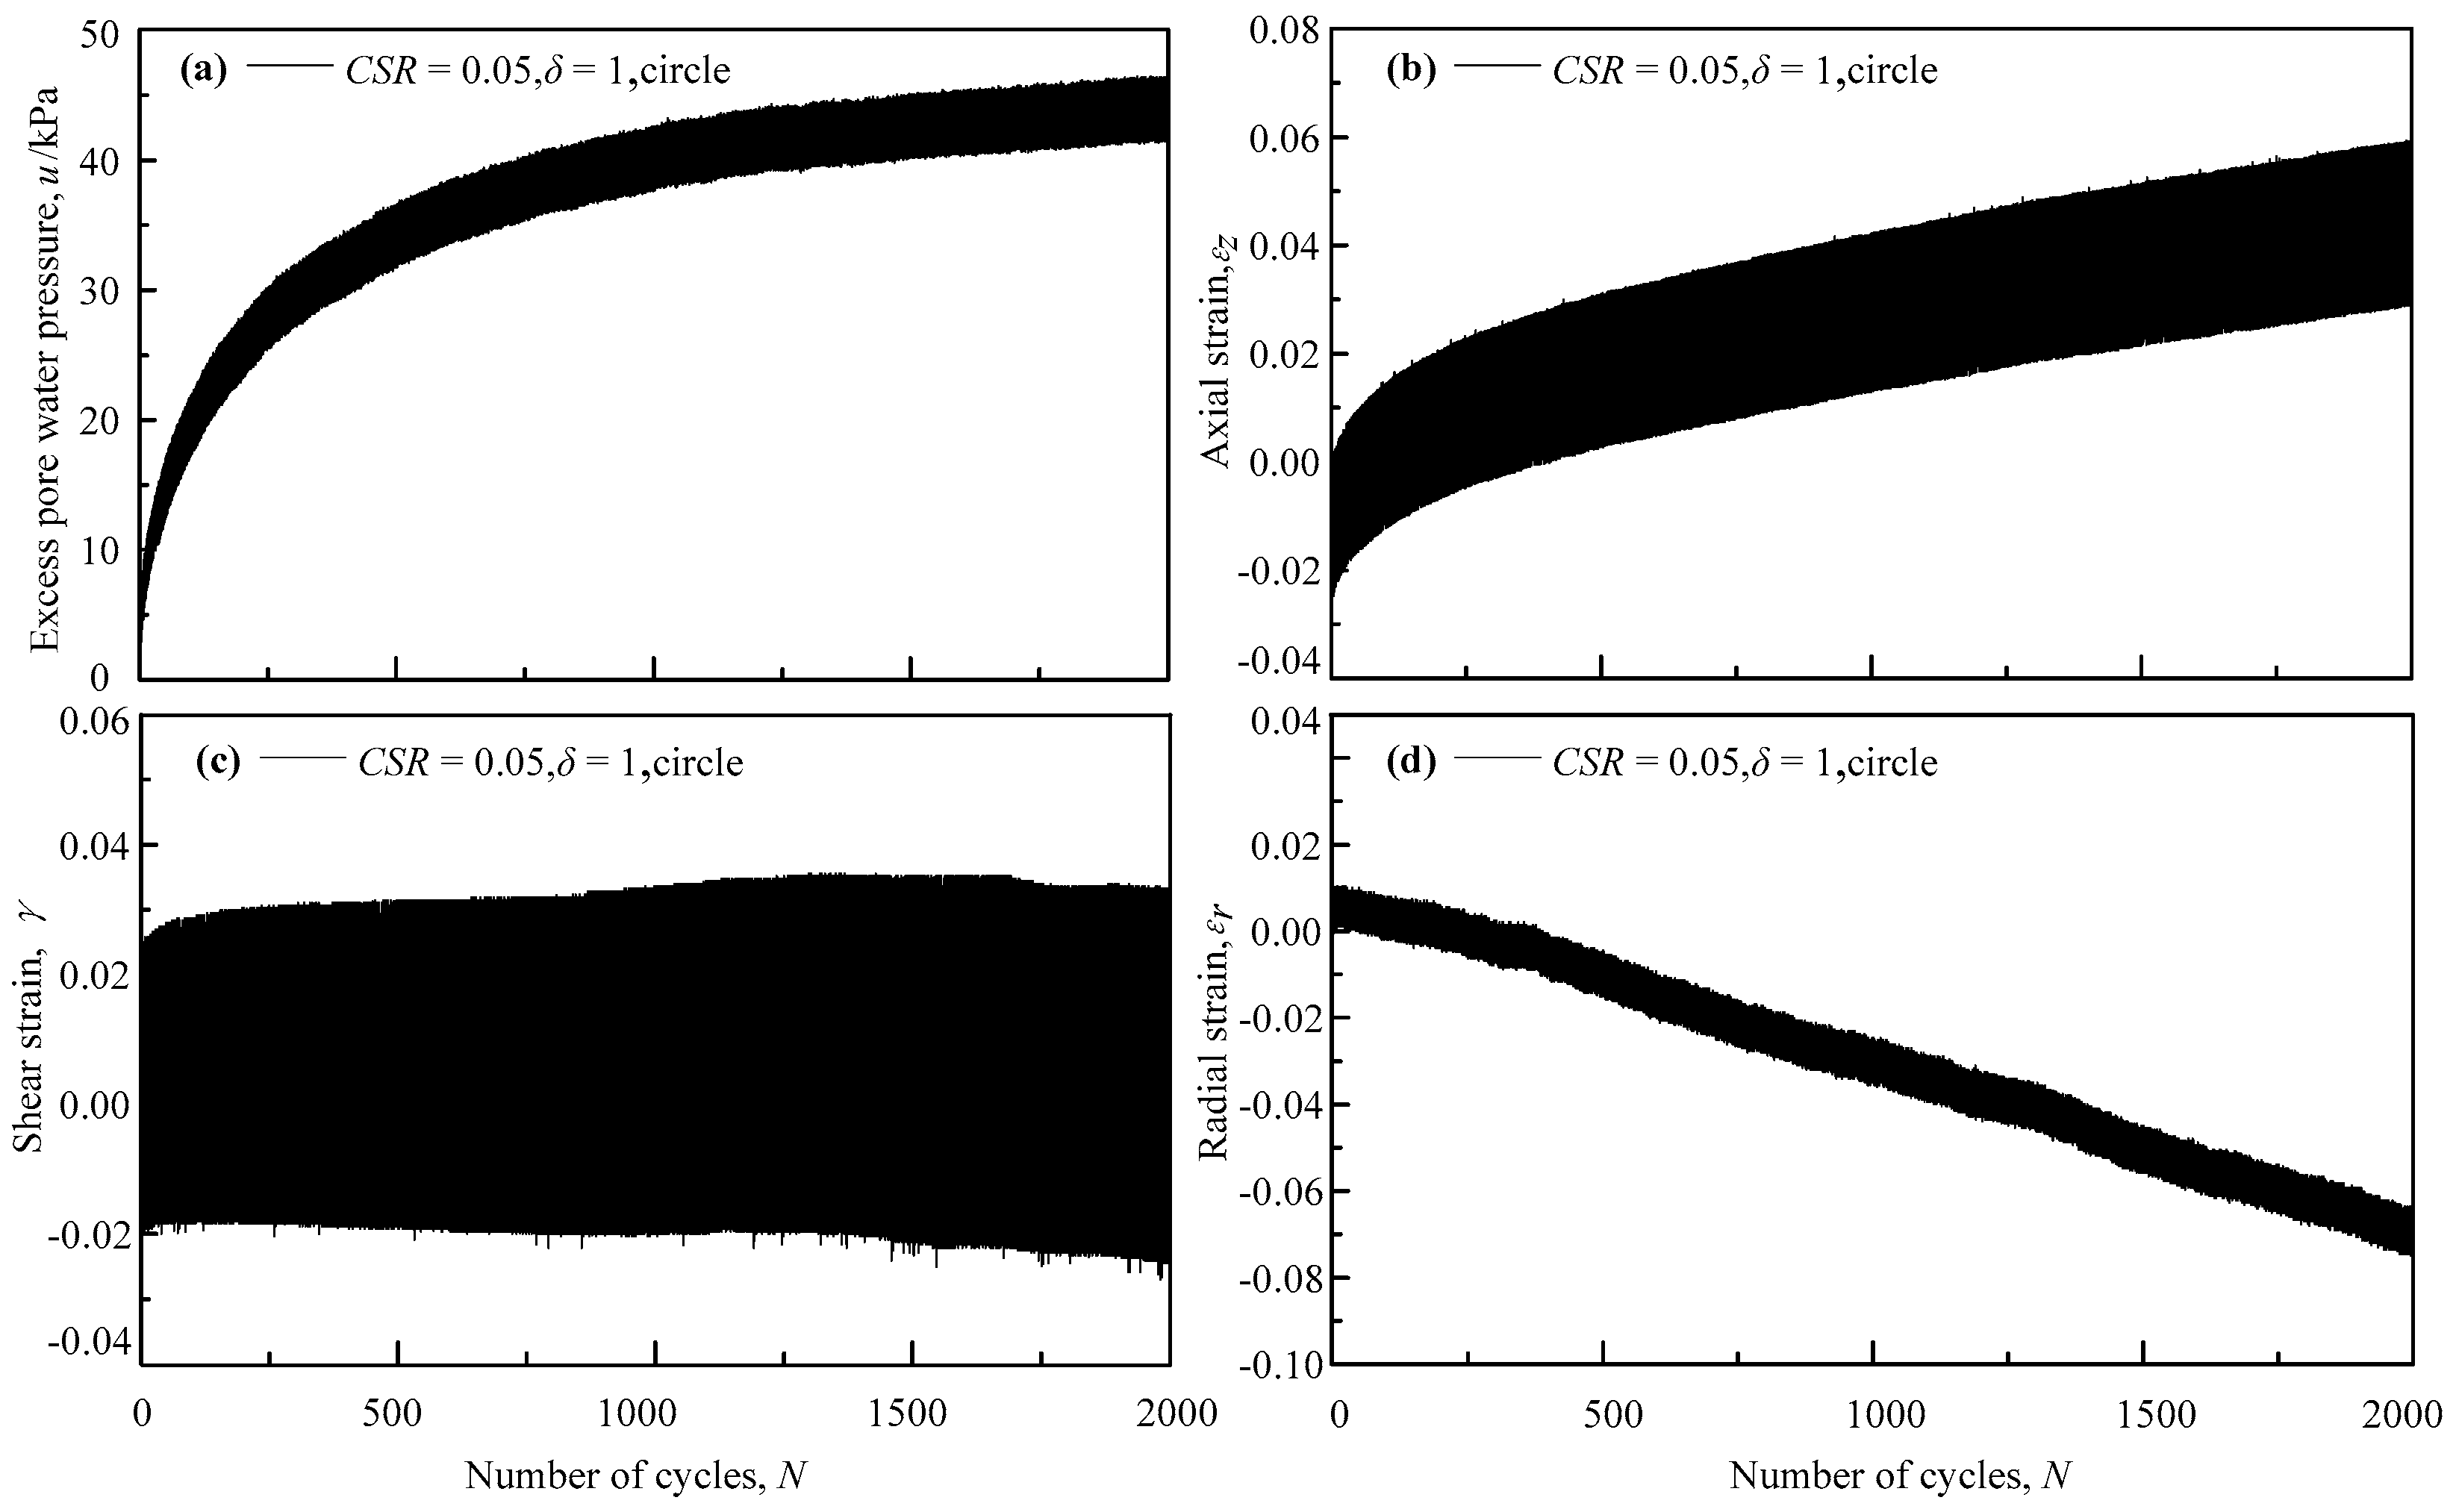
3.1. Typical Test Results of Saturated Silt Sample under Cyclic Axial–Torsional Combined Loading

The typical results of the silt tested under wave loading (CSR = 0.05, δ = 1) are shown in Figure 6; the excess pore pressure u rises more rapidly at the beginning of loading. Then, the increasing rate gradually decreases to zero. When the number of cycles N is greater than 1600, u gradually stabilizes and does not reach the effective confining pressure. Under the circular stress path, the specimen produces shear, axial, radial and other strains in different directions. The shear strain γ changes a little with the increase in N, and the axial strain εz develops rapidly in the initial stage of loading, and then εz gradually slows down with the increase in N. This test specifies that the direction of radial strain εr is consistent with the direction of radial stress σr.
During axial–torsional cyclic loading, the silt sample will simultaneously generate shear strain γ, axial strain εz, hoop strain εθ, and radial strain εr. Therefore, a single strain parameter as described with deformation has a certain one-sidedness. Based on the Mohr circle, the major, intermediate, and minor principal strains, ε1, ε2, and ε3, respectively, corresponding to large, medium, and small principal stresses, σ1, σ2, and σ3, respectively, can be calculated. In order to comprehensively reflect the development of the sample deformation, the cumulative generalized shear strain γg is introduced to describe the deformation of the silt [29]. The formula of γg is as follows:
γ g = 2 3 ( ε 1 ε 2 ) 2 + ( ε 1 ε 3 ) 2 + ( ε 2 ε 3 ) 2

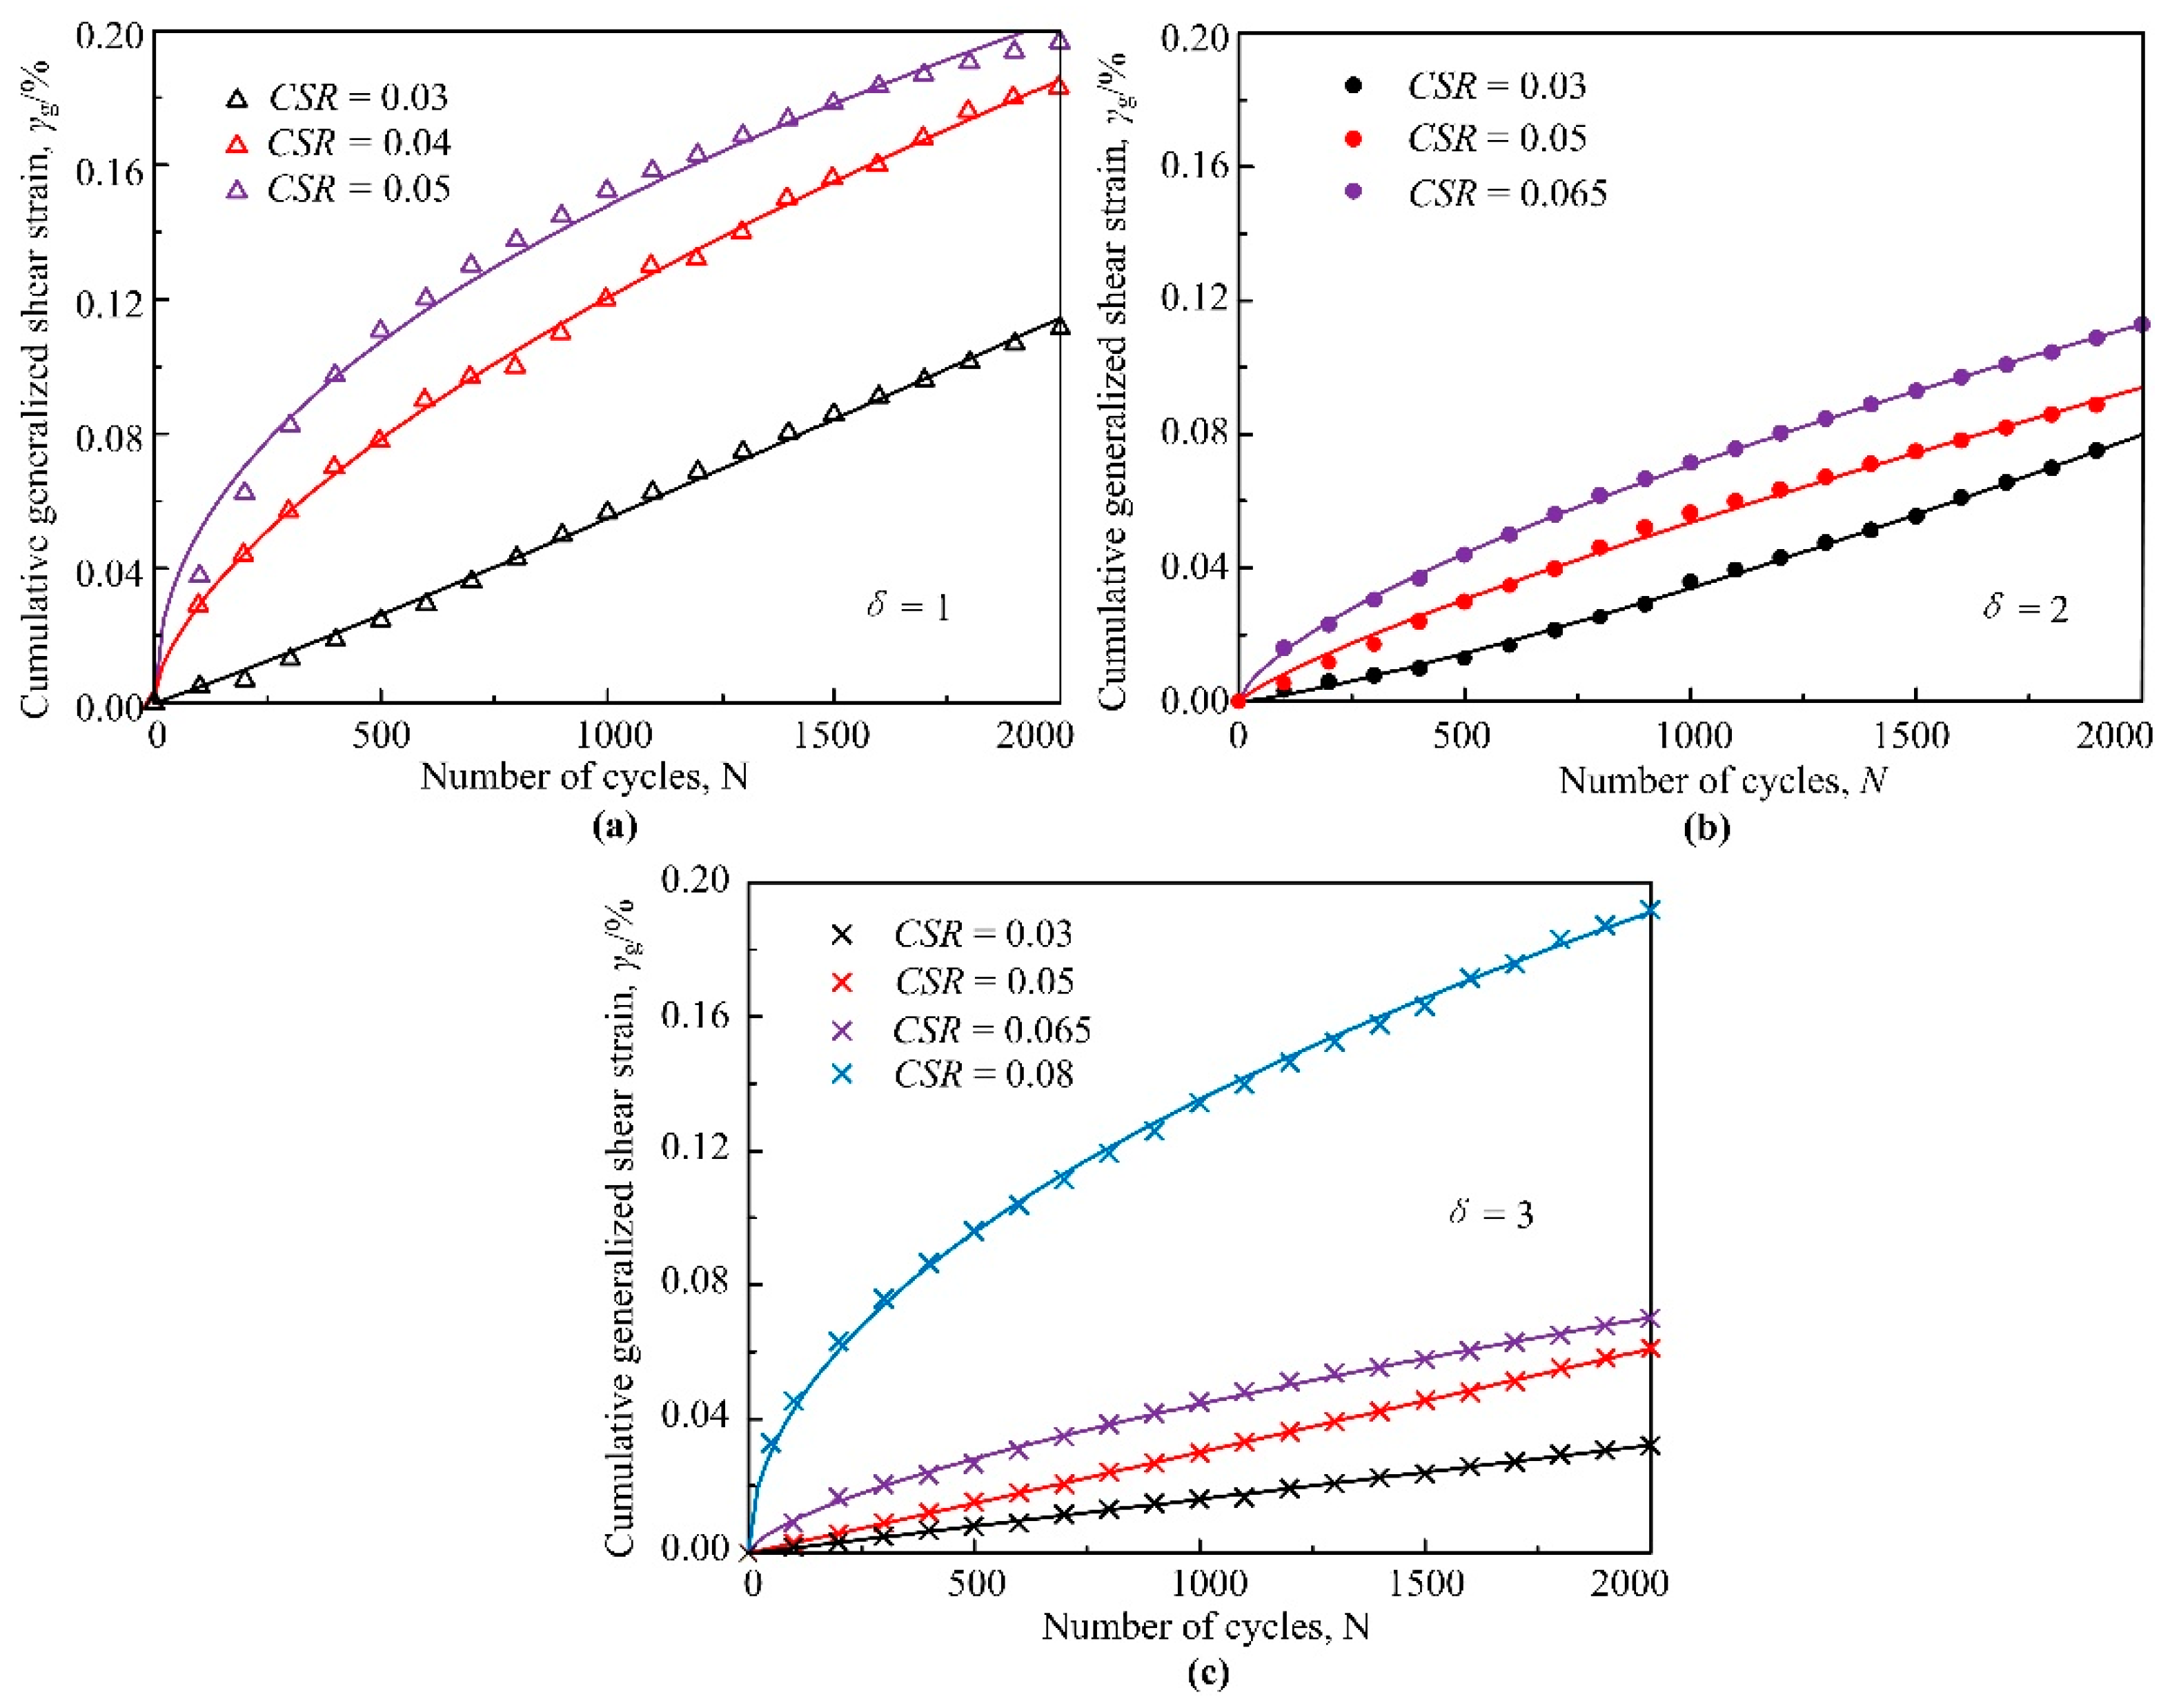
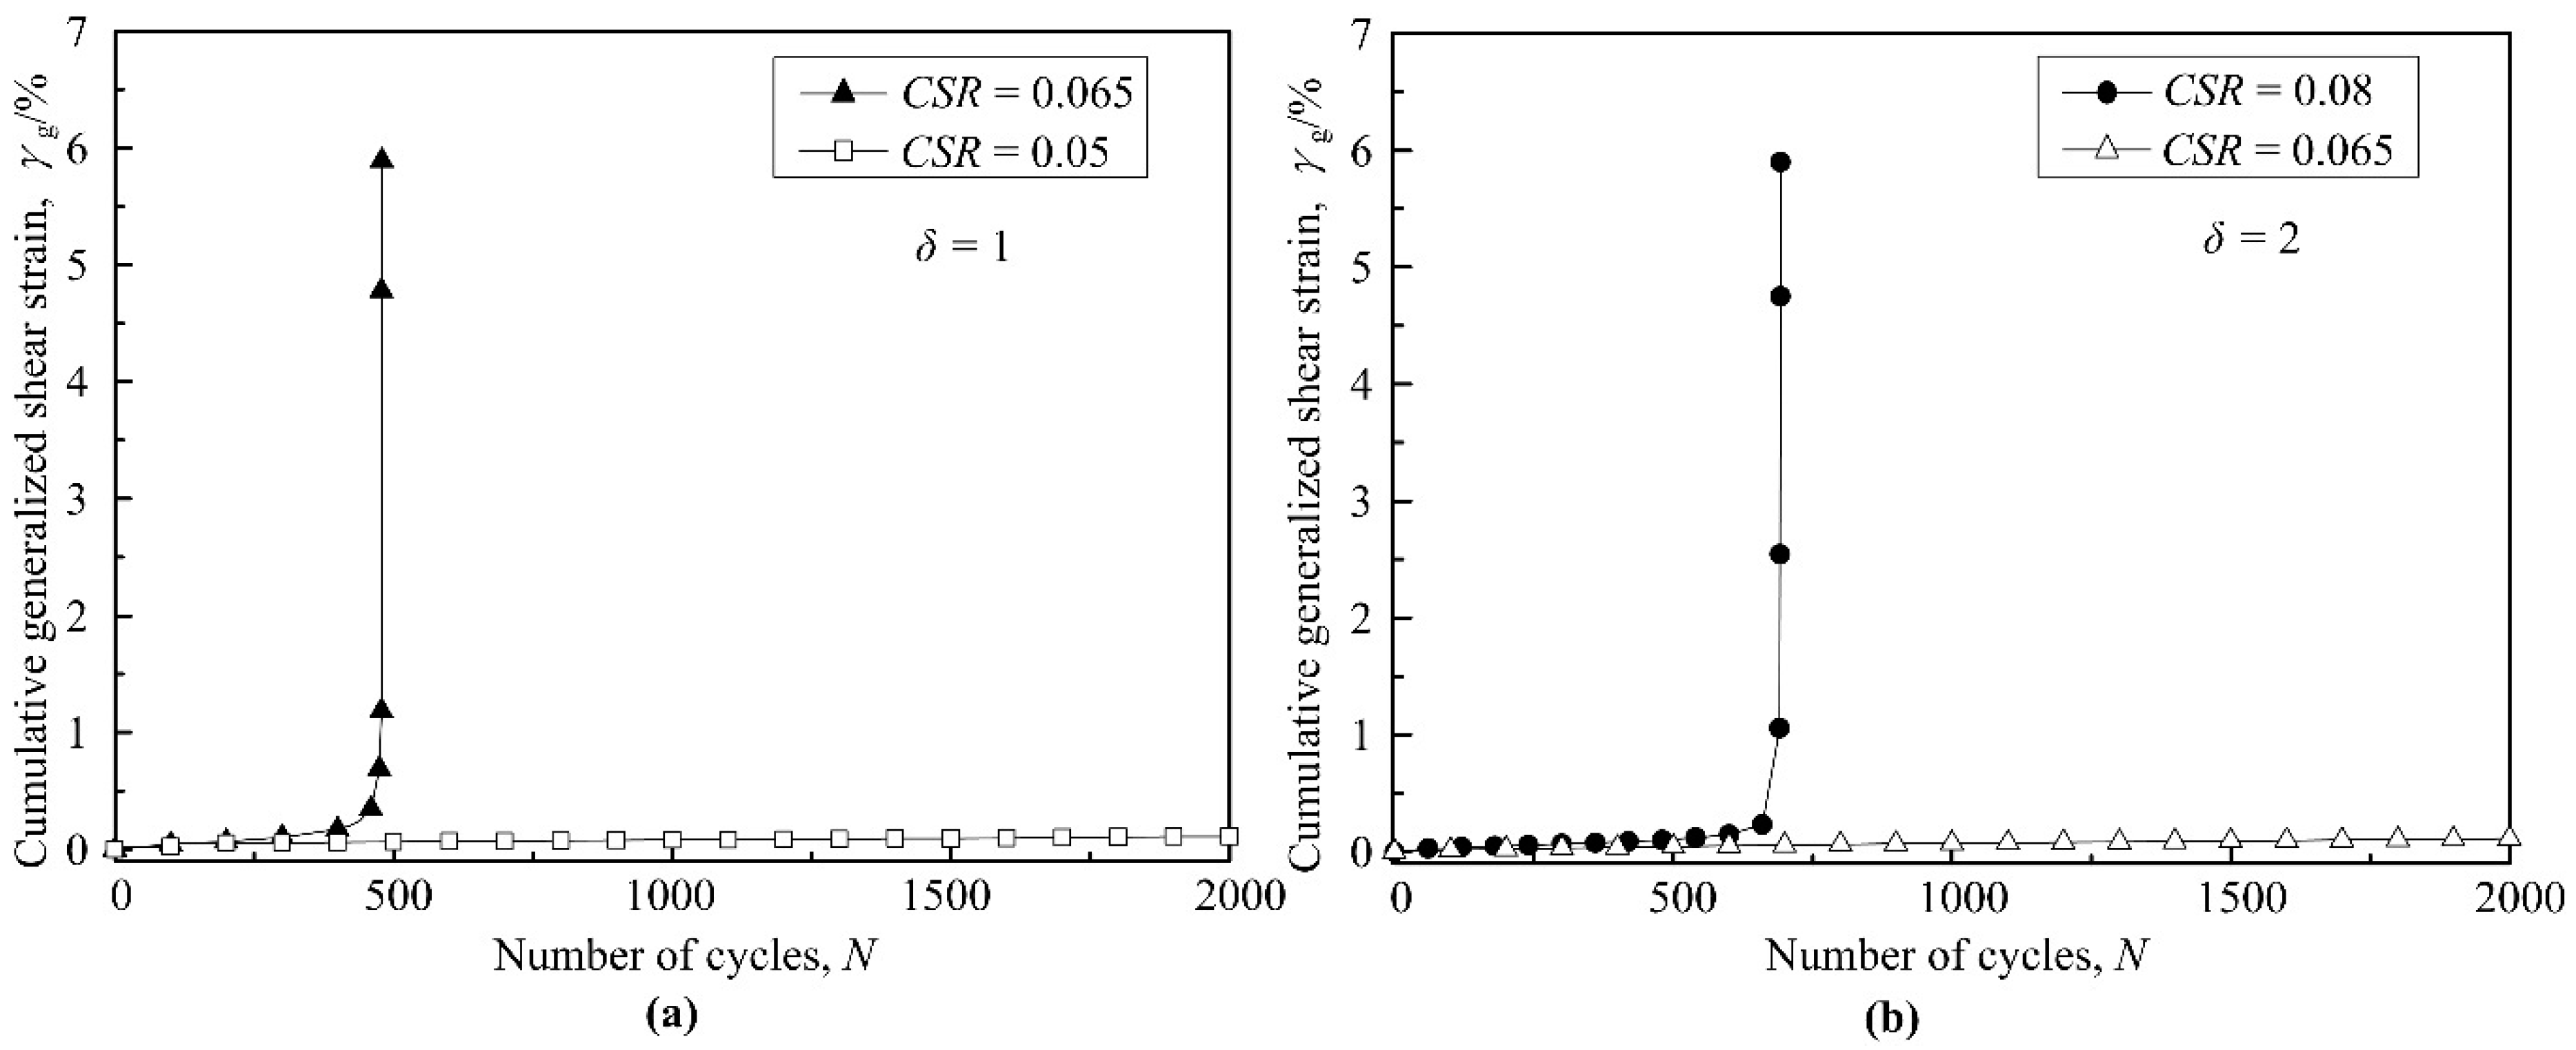
3.2. Effect of CSR on the Development of Cumulative Generalized Shear Strain

To predict the rate of cumulative strain, Ref. [30] developed an empirical model that is given in Equation (2), as follows:
γ g = a N b
where a and b are the stress-specific fitting parameters. Figure 7 presents the test data points and the best-fit line of the Monismith model; in view of the γg variations within a loading cycle, showing an absolute sine form wave-like growth, the value of γg within the loading cycle shown in Figure 6 is the maximum value within a loading cycle. As illustrated in Figure 7, the Monismith model can appropriately describe the development law of γg. Under various stress paths, γg increases with increasing N, and CSR and δ have significant effects on the rate of increase. For the circular stress path, when CSR = 0.03, γg increases almost linearly with increasing N. When CSR = 0.04 and 0.05, the growth rate of γg decreases with the increase in N. For elliptical stress paths, when CSR = 0.03, 0.05, and 0.065, γg increases almost linearly with increasing N. When CSR = 0.08 and 0.05, the growth rate of γg gradually slows down with the increase in N. It is observed that γg increases with increasing CSR, when δ is the same. Of the many criteria used in the undrained dynamic tests, to determine when sand liquefaction occurs, the most commonly used is initial liquefaction, which is the state of the Ru at 100% [31], and the more widely used 2–3% SA or 5% DA axial strain [32]. However, in the axial–torsion coupling cyclic loading test, the sample will not only produce γ, but also εz and εr. It is somewhat one-sided to use the development of a single strain parameter as the criterion for liquefaction. Therefore, this study uses the generalized shear strain γg to describe the deformation of the soil, and “γg = 5%” is used as the criterion for the liquefaction failure of the specimen in this article. Figure 8 presents the relationship between γg and N under various stress paths. Note that the development of γg is different under different combinations of CSR and δ. According to Figure 8, when CSR ≤ 0.05, regardless of whether δ = 1 or 2, γg is less than 0.2%, the plastic deformation of the sample is very small, and γg does not meet the cyclic failure. When CSR = 0.065, δ = 1 and N > 460, γg develops rapidly, and γg reaches 5% for N = 478. The critical cycle stress ratio CSRth is defined as the minimum CSR required for the specimen to reach liquefaction failure. When δ = 1, 0.05 < CSRth ≤ 0.065; when δ = 2, 0.065 < CSRth ≤ 0.08; and when δ = 4, no liquefaction occurs in the silt samples.

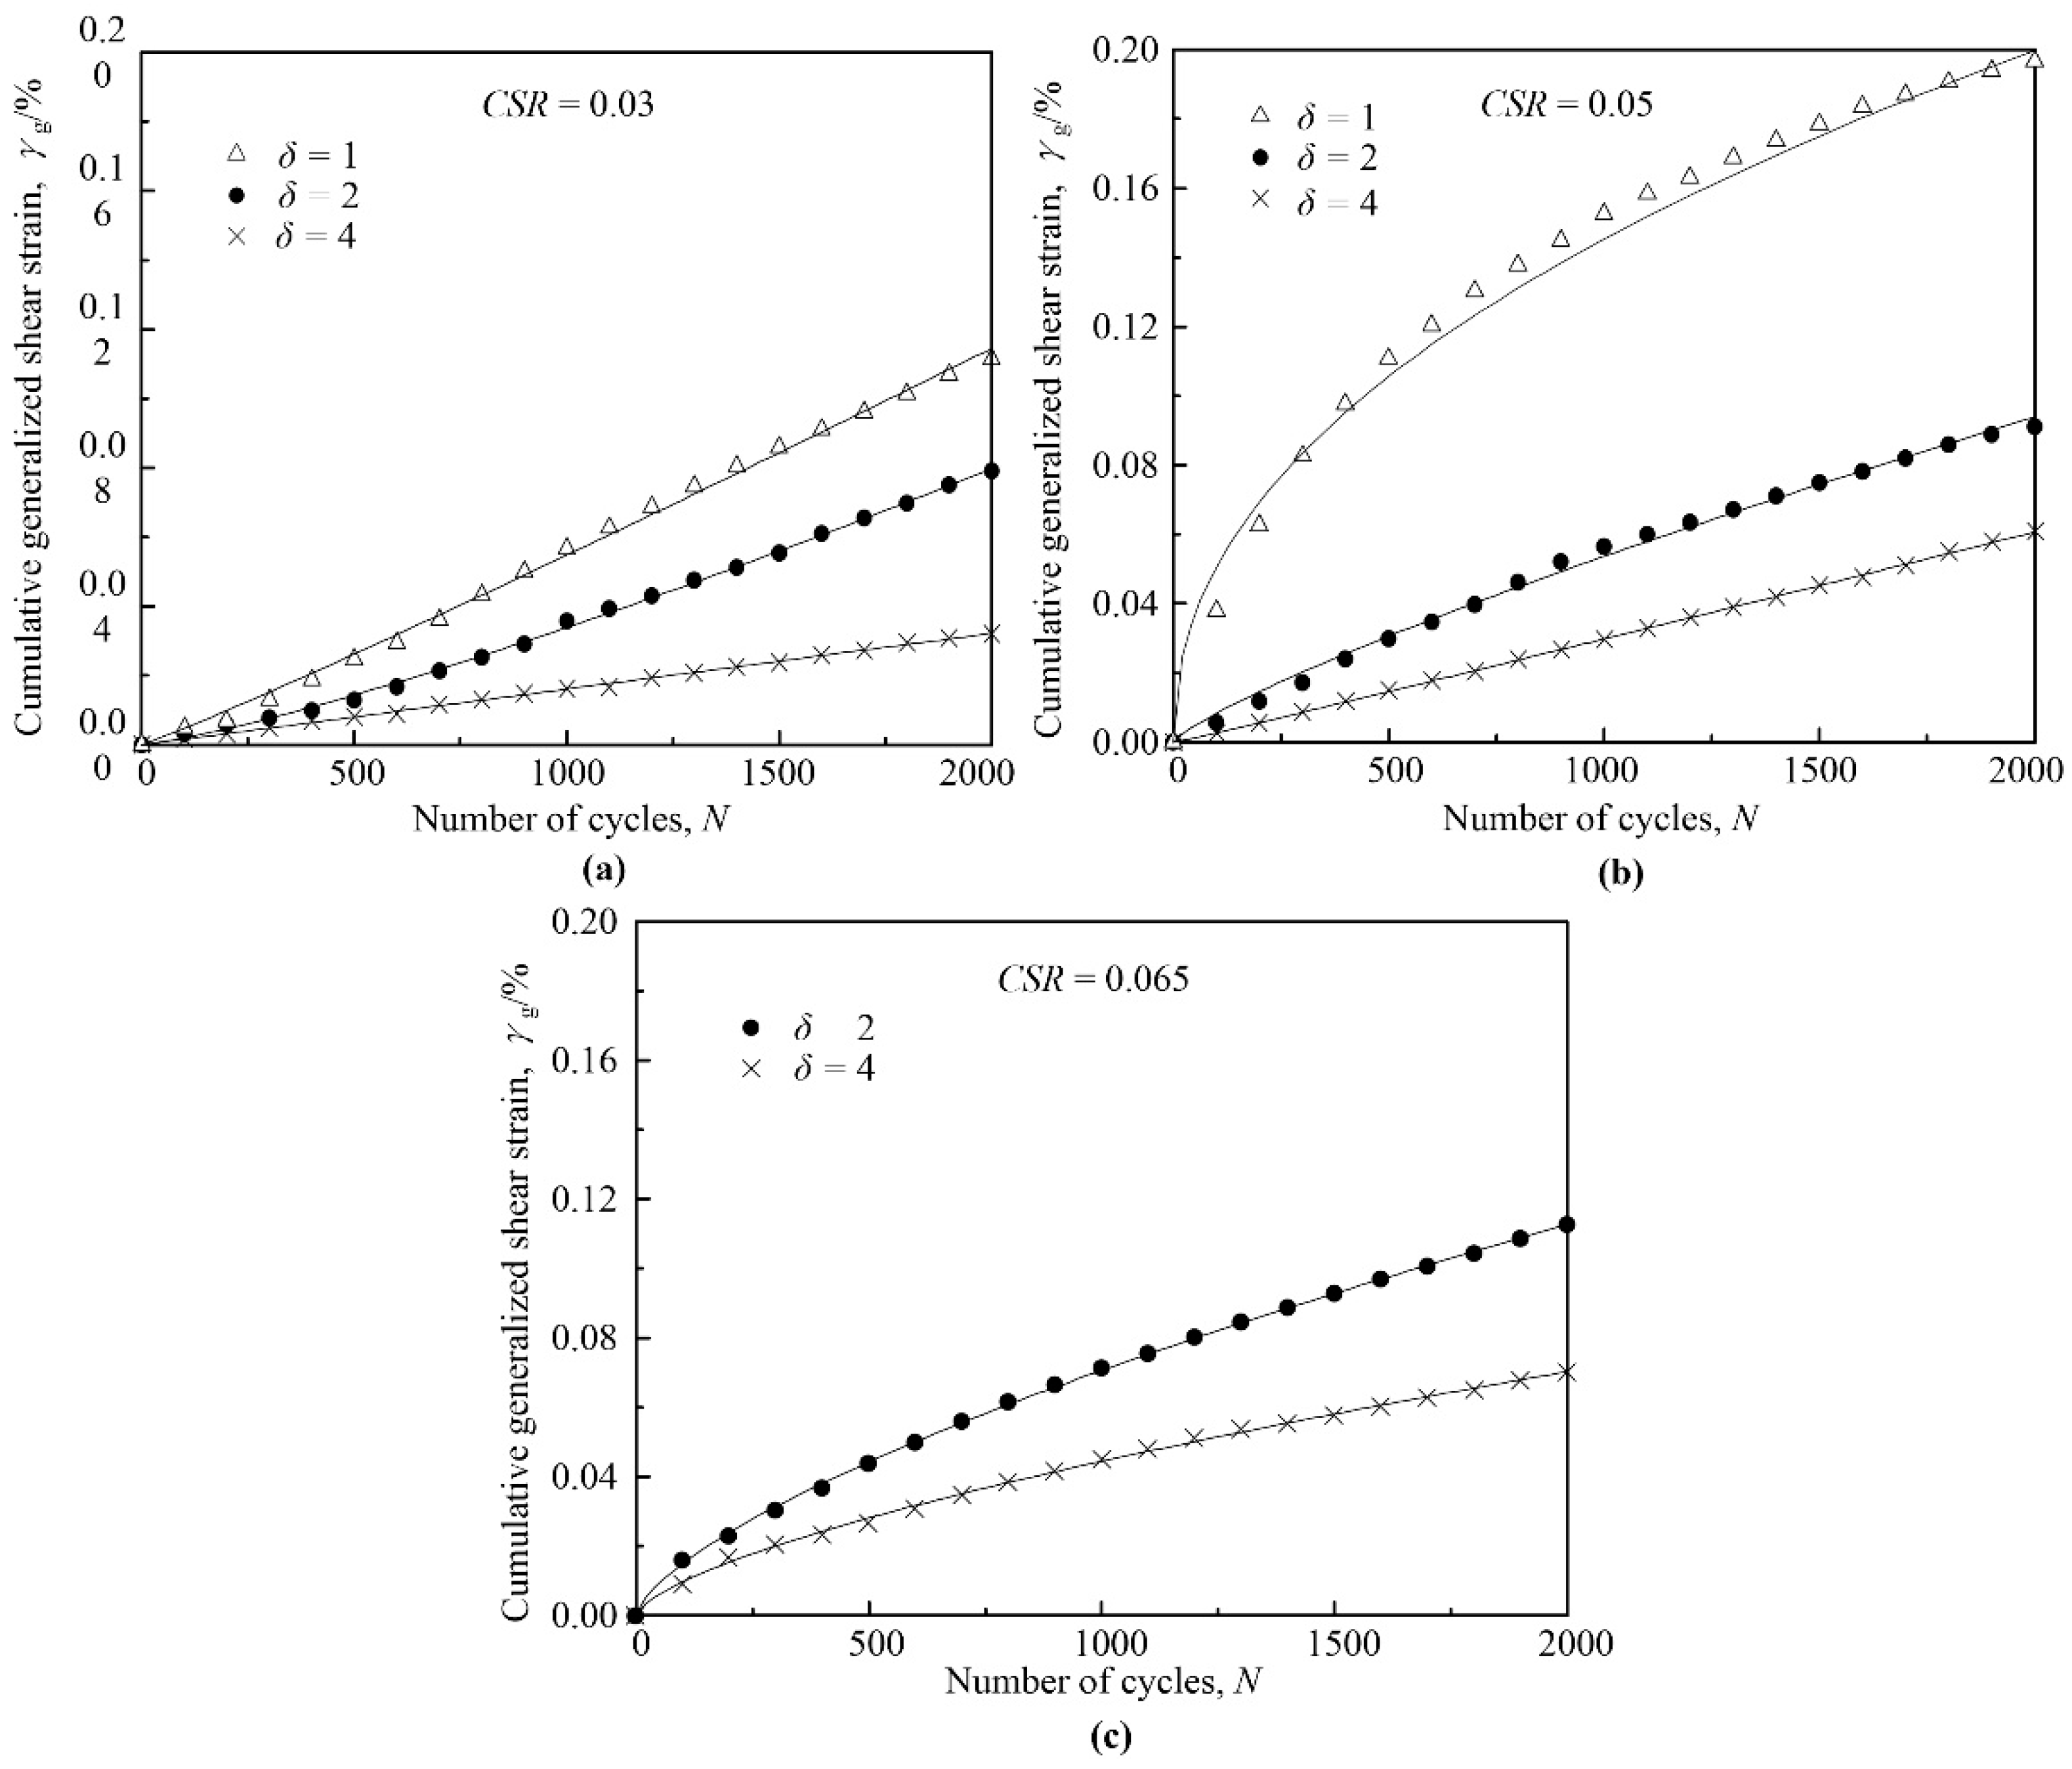
3.3. Effect of δ on the Development of Cumulative Generalized Shear Strain

Figure 9 illustrates the relationship between cumulative generalized shear strain and the number of cycles under the same CSR. According to Figure 9a, it is noted that γg develops almost linearly with N for a different value of δ when CSR = 0.03. When CSR = 0.05, γg increases almost linearly with the increase in N for δ = 2 and 4, while γg increases nonlinearly with the increase in N for δ = 1. When the sample is subjected to the small external dynamic stress level, the soil presents an inelastic working state and the cumulative generalized shear strain exhibits linear growth; however, when the sample is subjected to the large external dynamic stress level, the soil presents an elasto-plastic working state in the initial loading stage, the specimen undergoes plastic failure locally, and the axial deformation gradually increases. However, as the loading continues, the skeleton reorganizes after the failure of the specimen to form a relatively stable fabric, which leads to an increase in the rate of axial deformation, slowing shrinking. Furthermore, when CSR = 0.065, nonlinear developing trends of γg are observed with the increase in N for δ = 2 and 4. It can be observed that the value of generalized shear strain decreases with increasing δ. This is because when δ = 1, the stress path is a circular one. At this time, the seabed soil undergoes the highest stress level, which shows that the circular stress path generated by the wave load causes the deformation of the soil to be greater than that caused by a single normal stress or shear stress.
When N reaches 2000, the cumulative generalized shear strain of the specimen is defined as the terminal generalized shear strain γg2000. Figure 10 presents the variation in the terminal generalized shear strain versus the cyclic stress ratio of saturated silt under different stress paths. According to Figure 10, when the CSR is the same, γg2000 decreases in sequence as δ increases. For δ = 1, the stress path is circular, and γg2000 is the largest. For δ, the stress path is the same, and γg2000 increases with the increase in CSR. It is noteworthy that the above tendency is only correct when CSR < CSRth; when CSR approaches or exceeds CSRth, liquefaction occurs and the silt appears to be unstable, and the terminal generalized shear strain will lose its physical meaning.

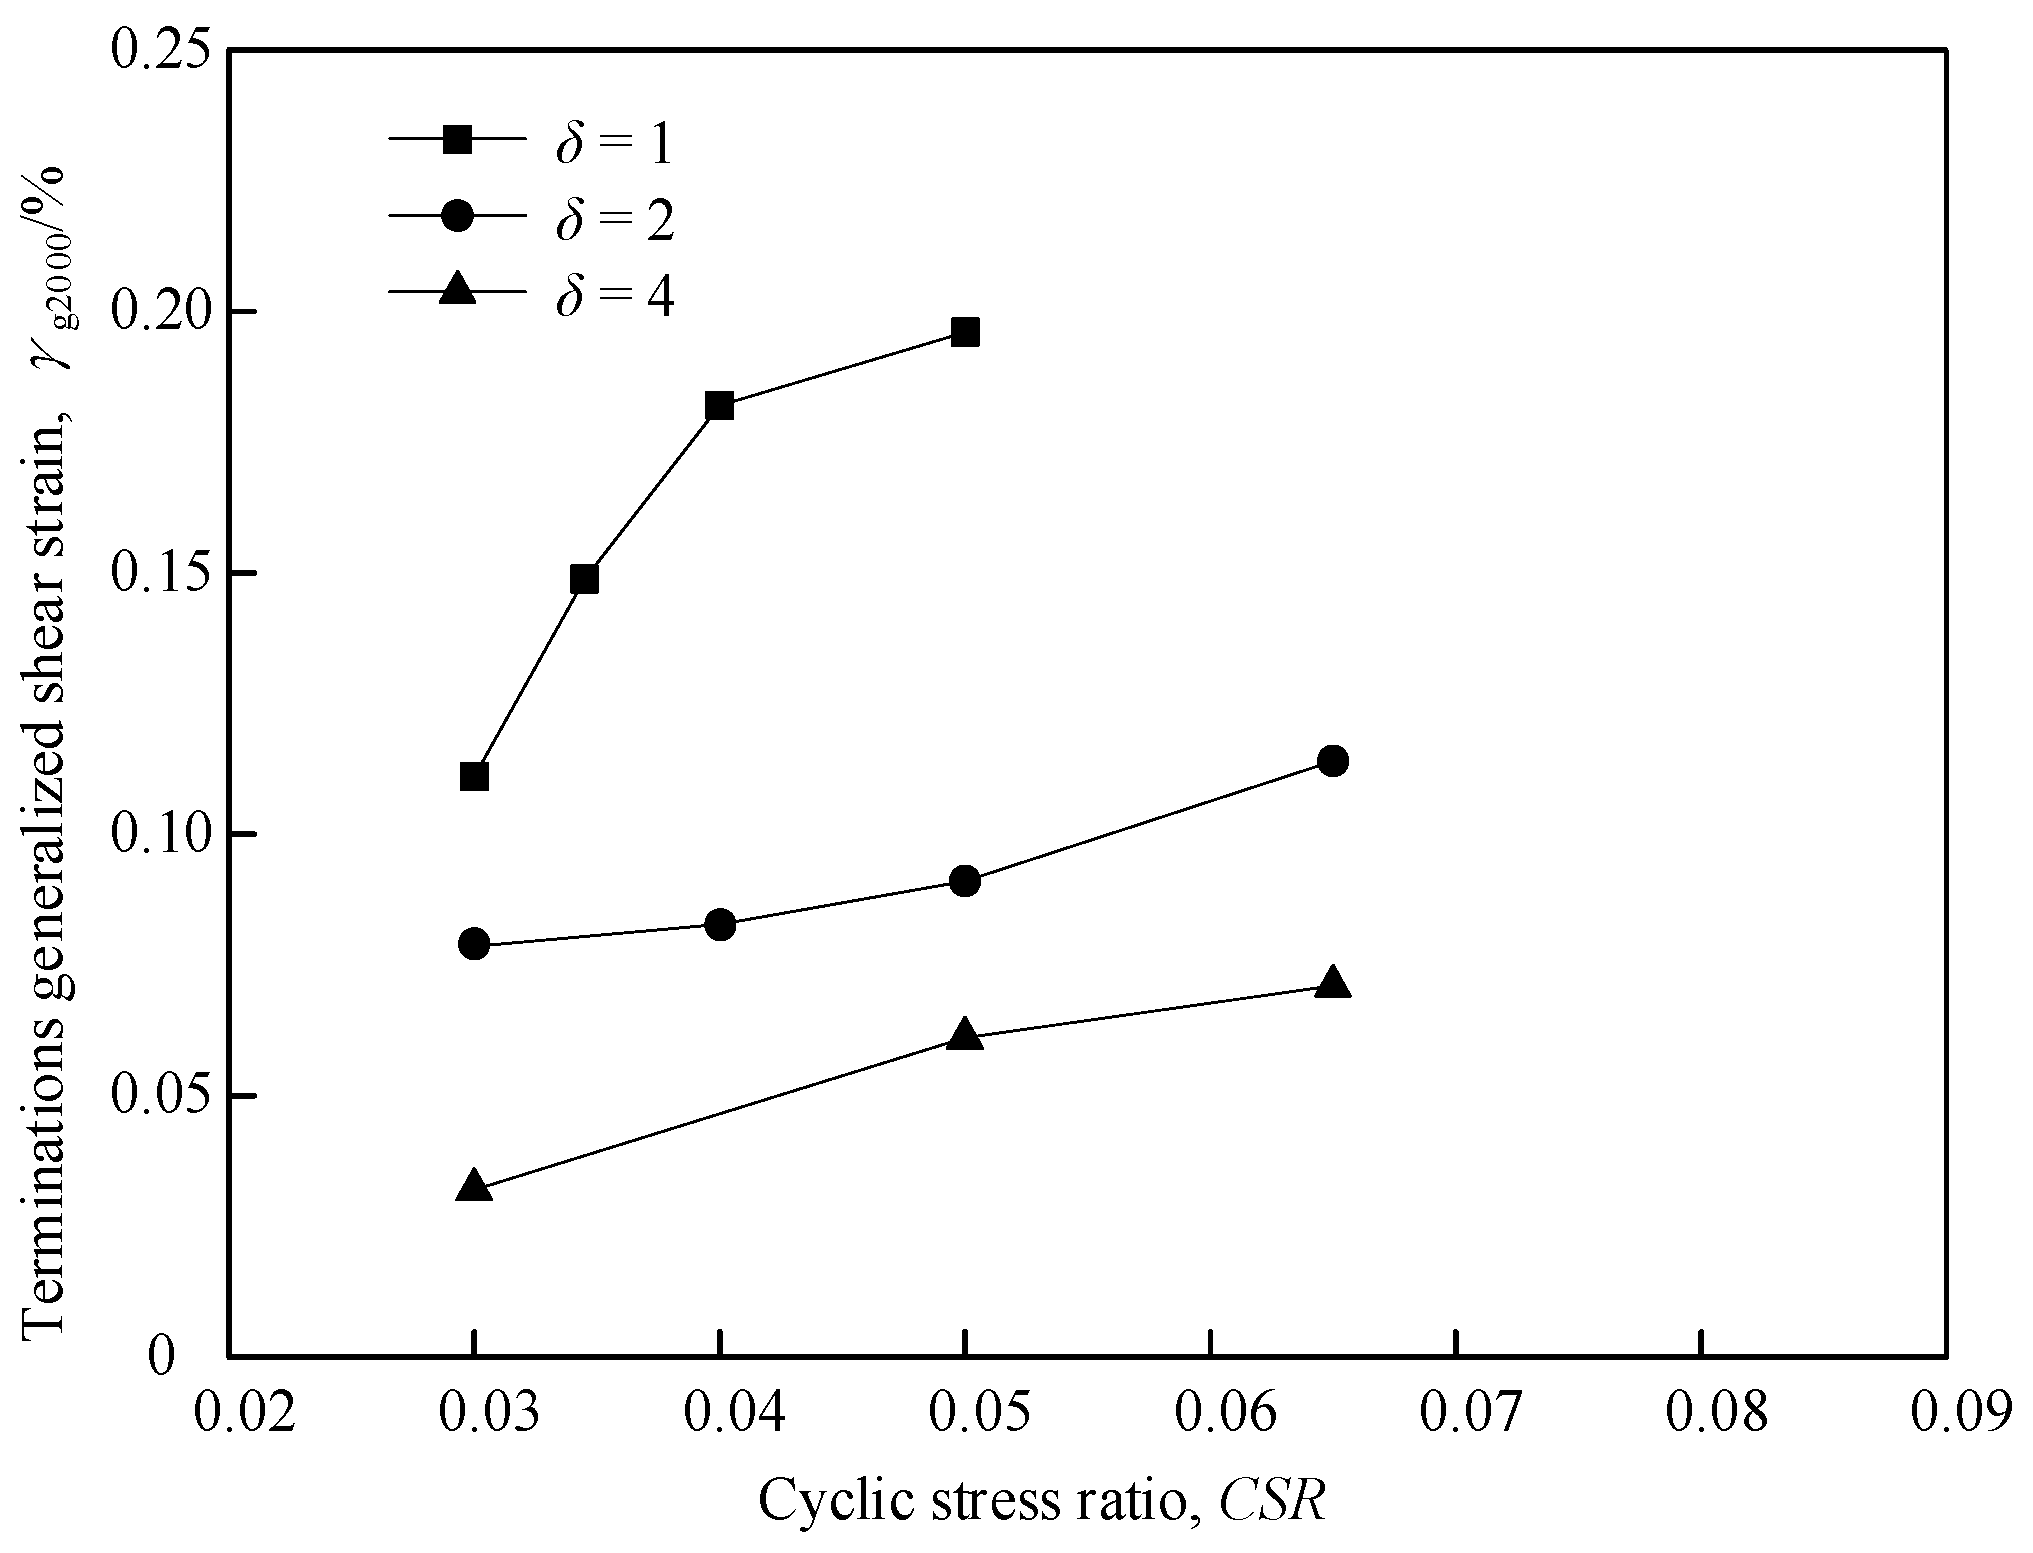
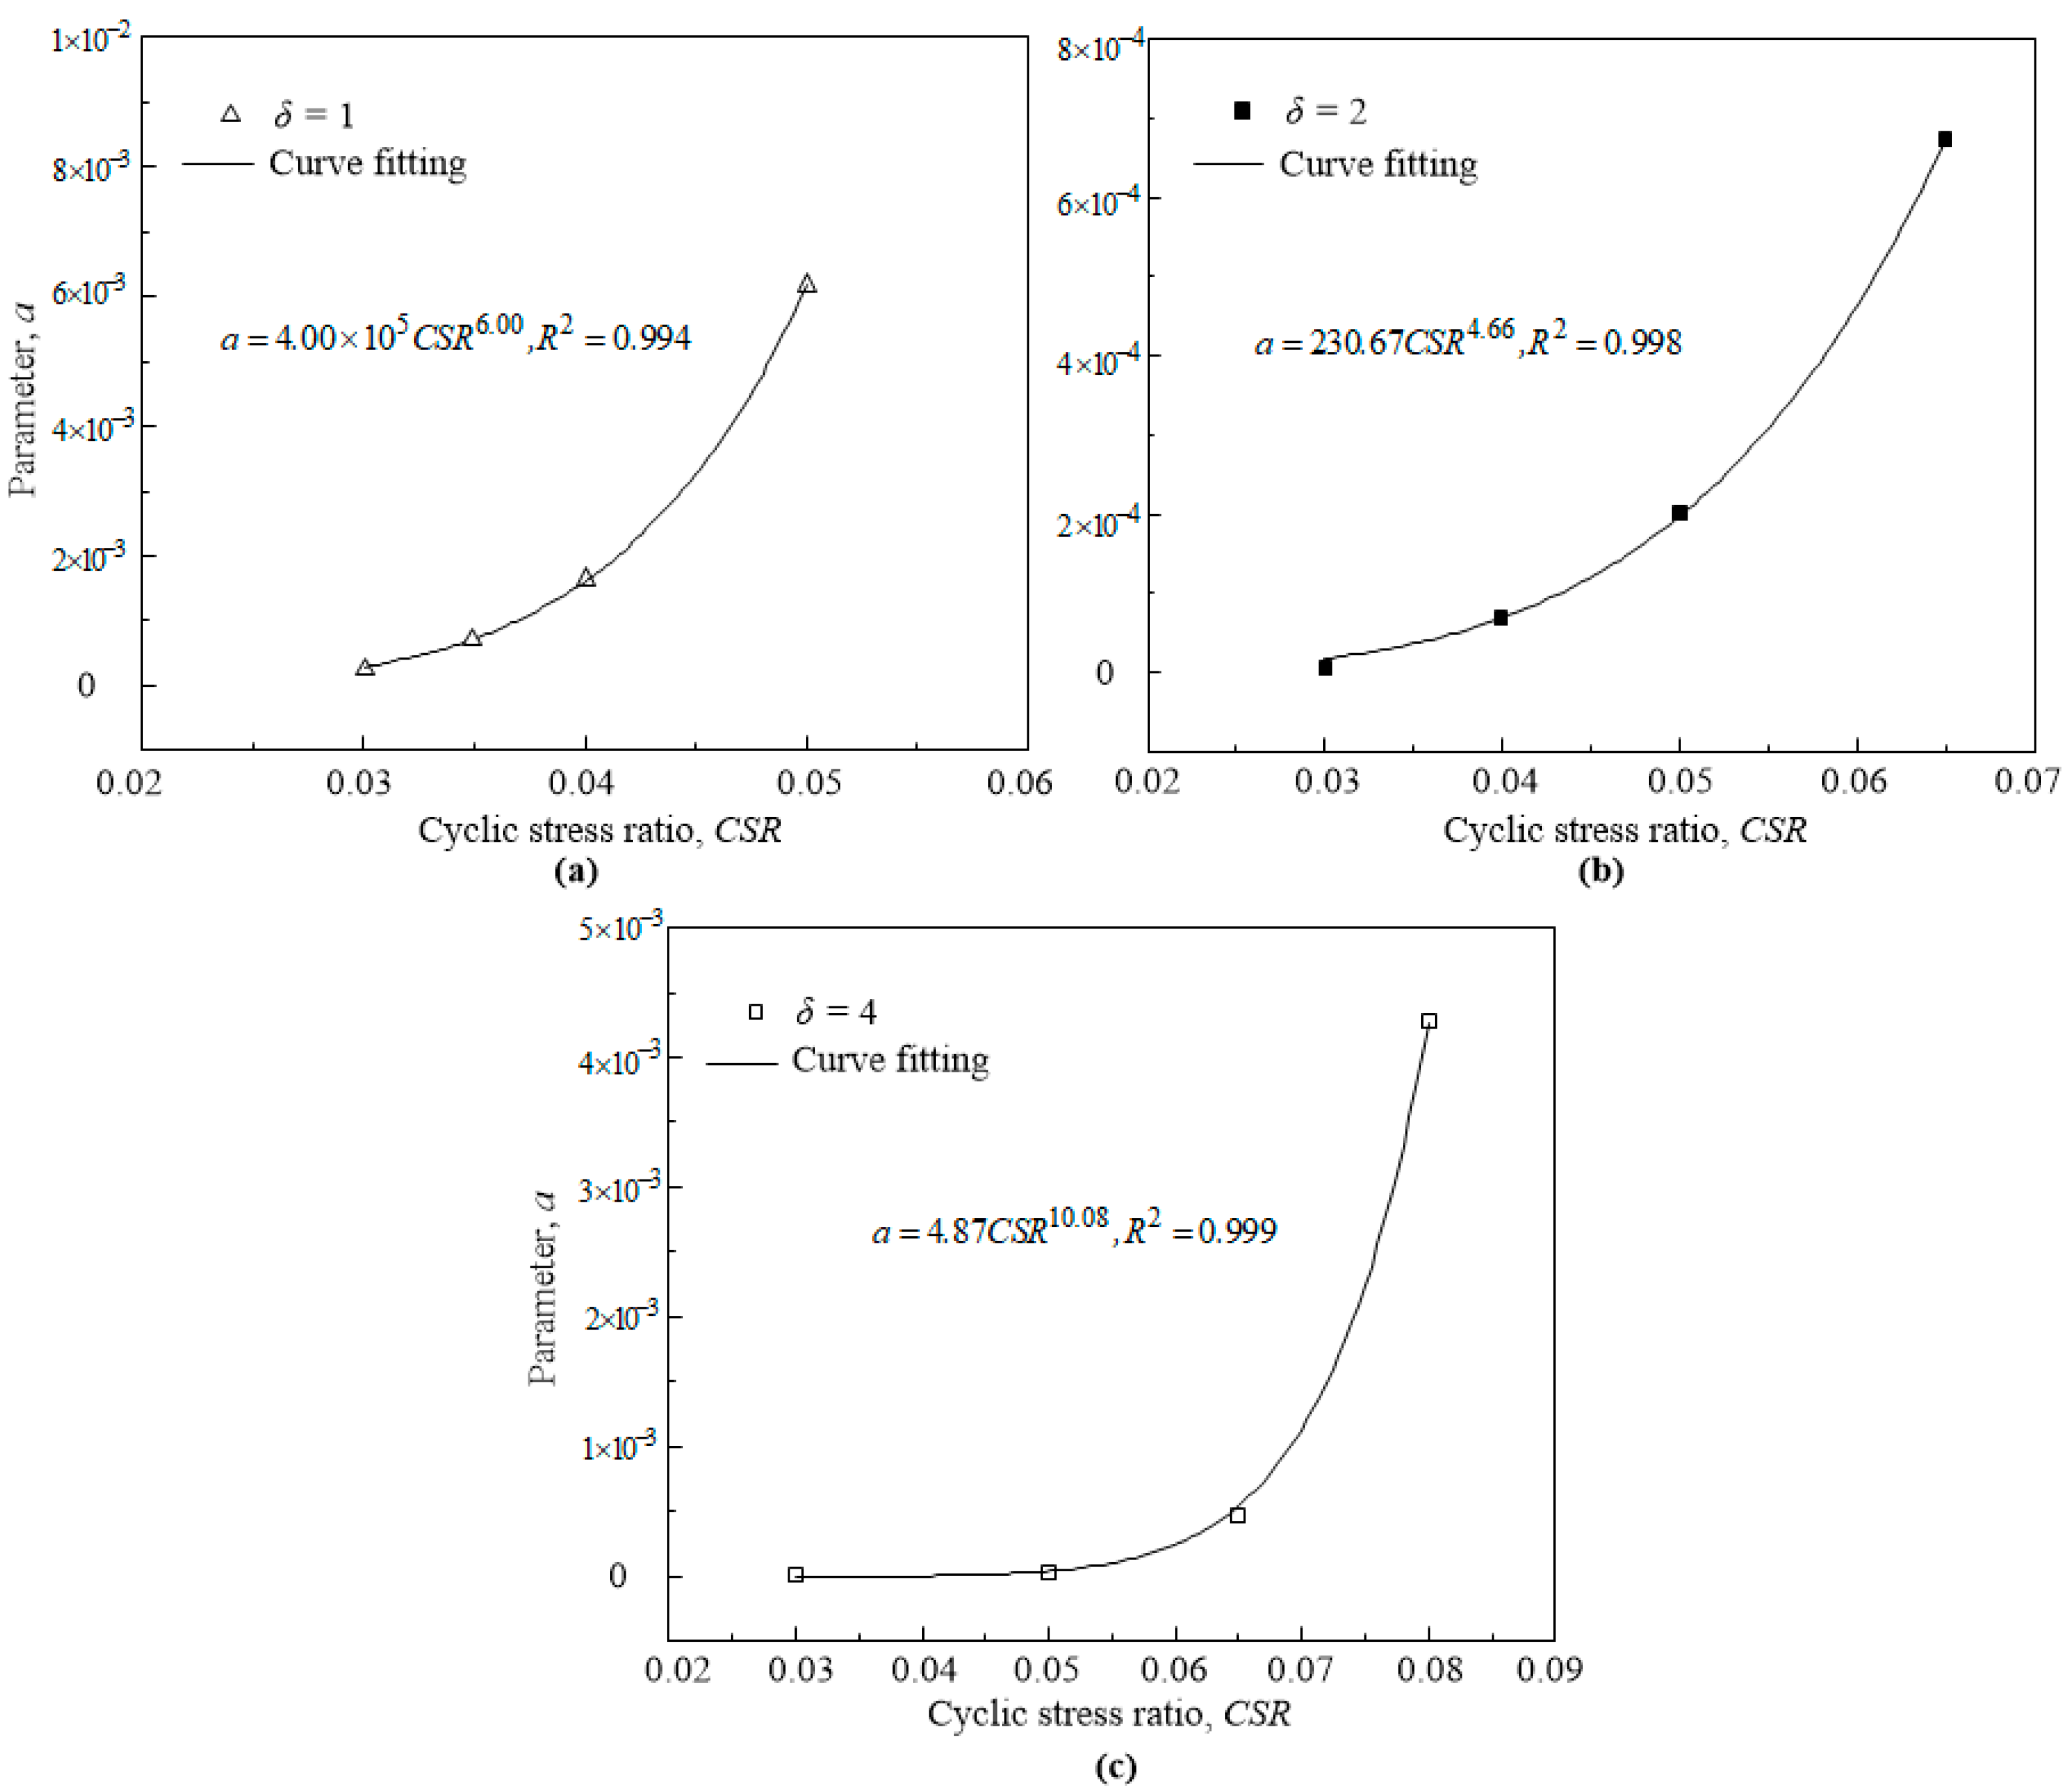
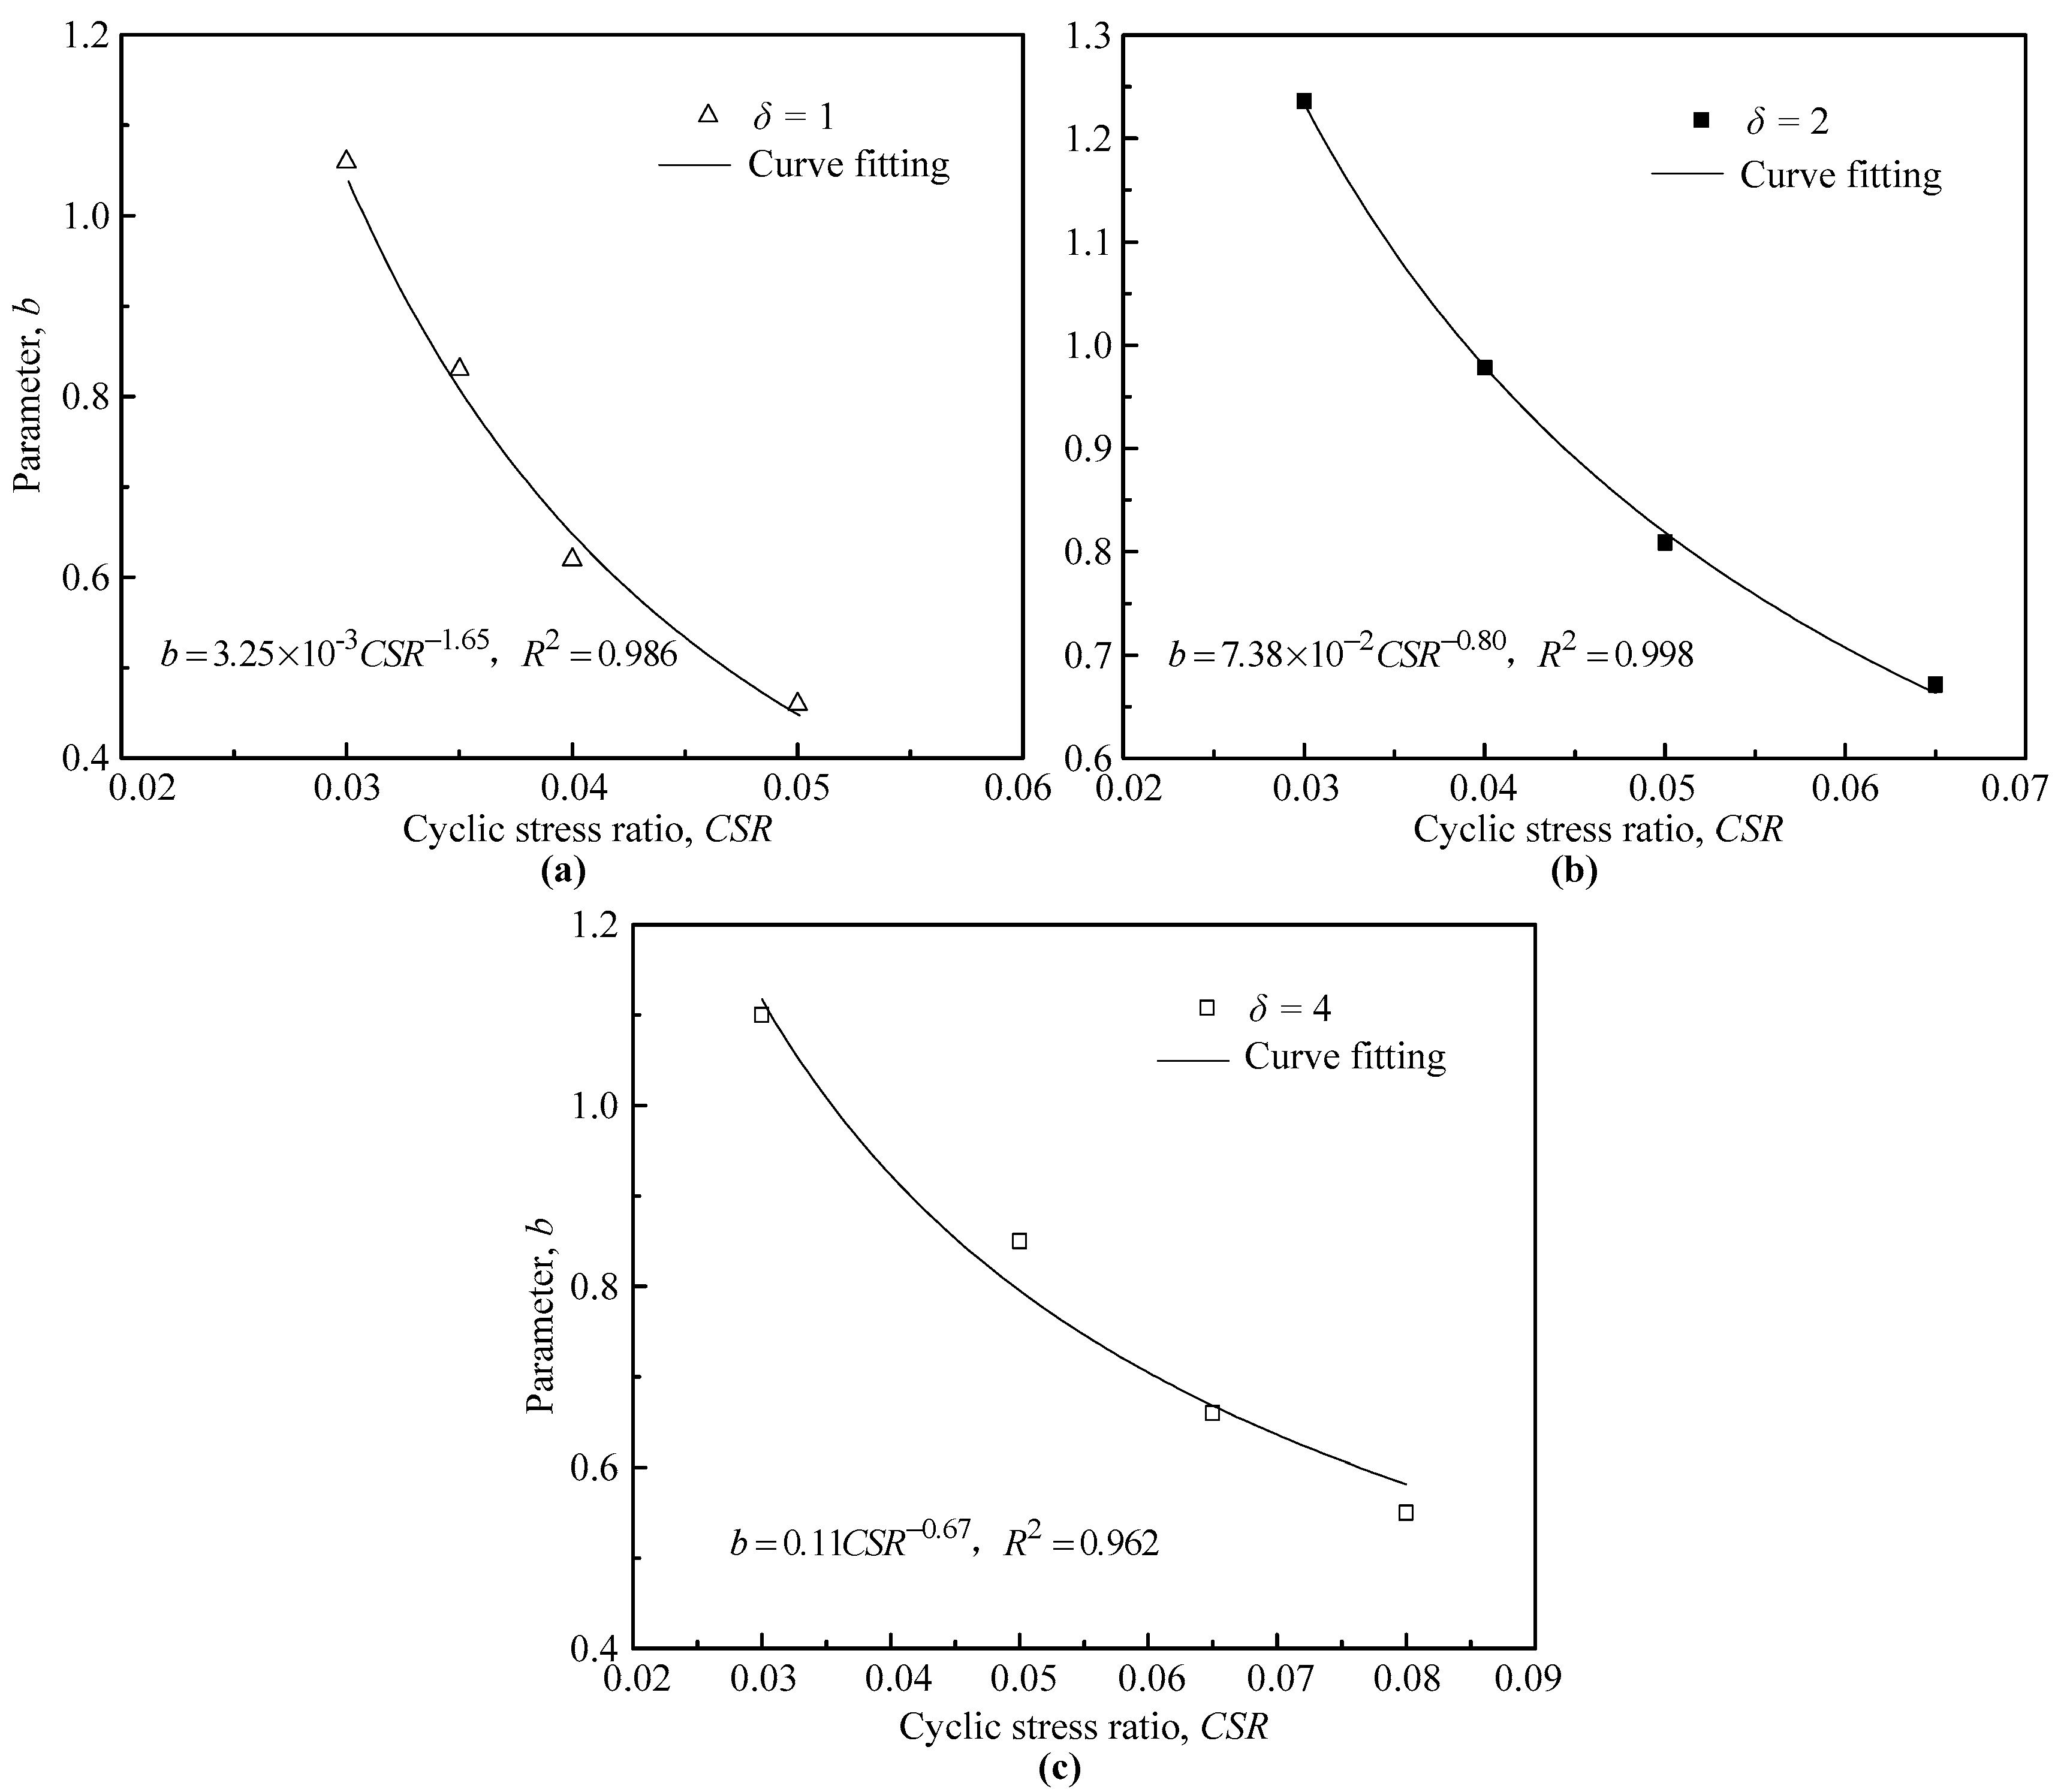
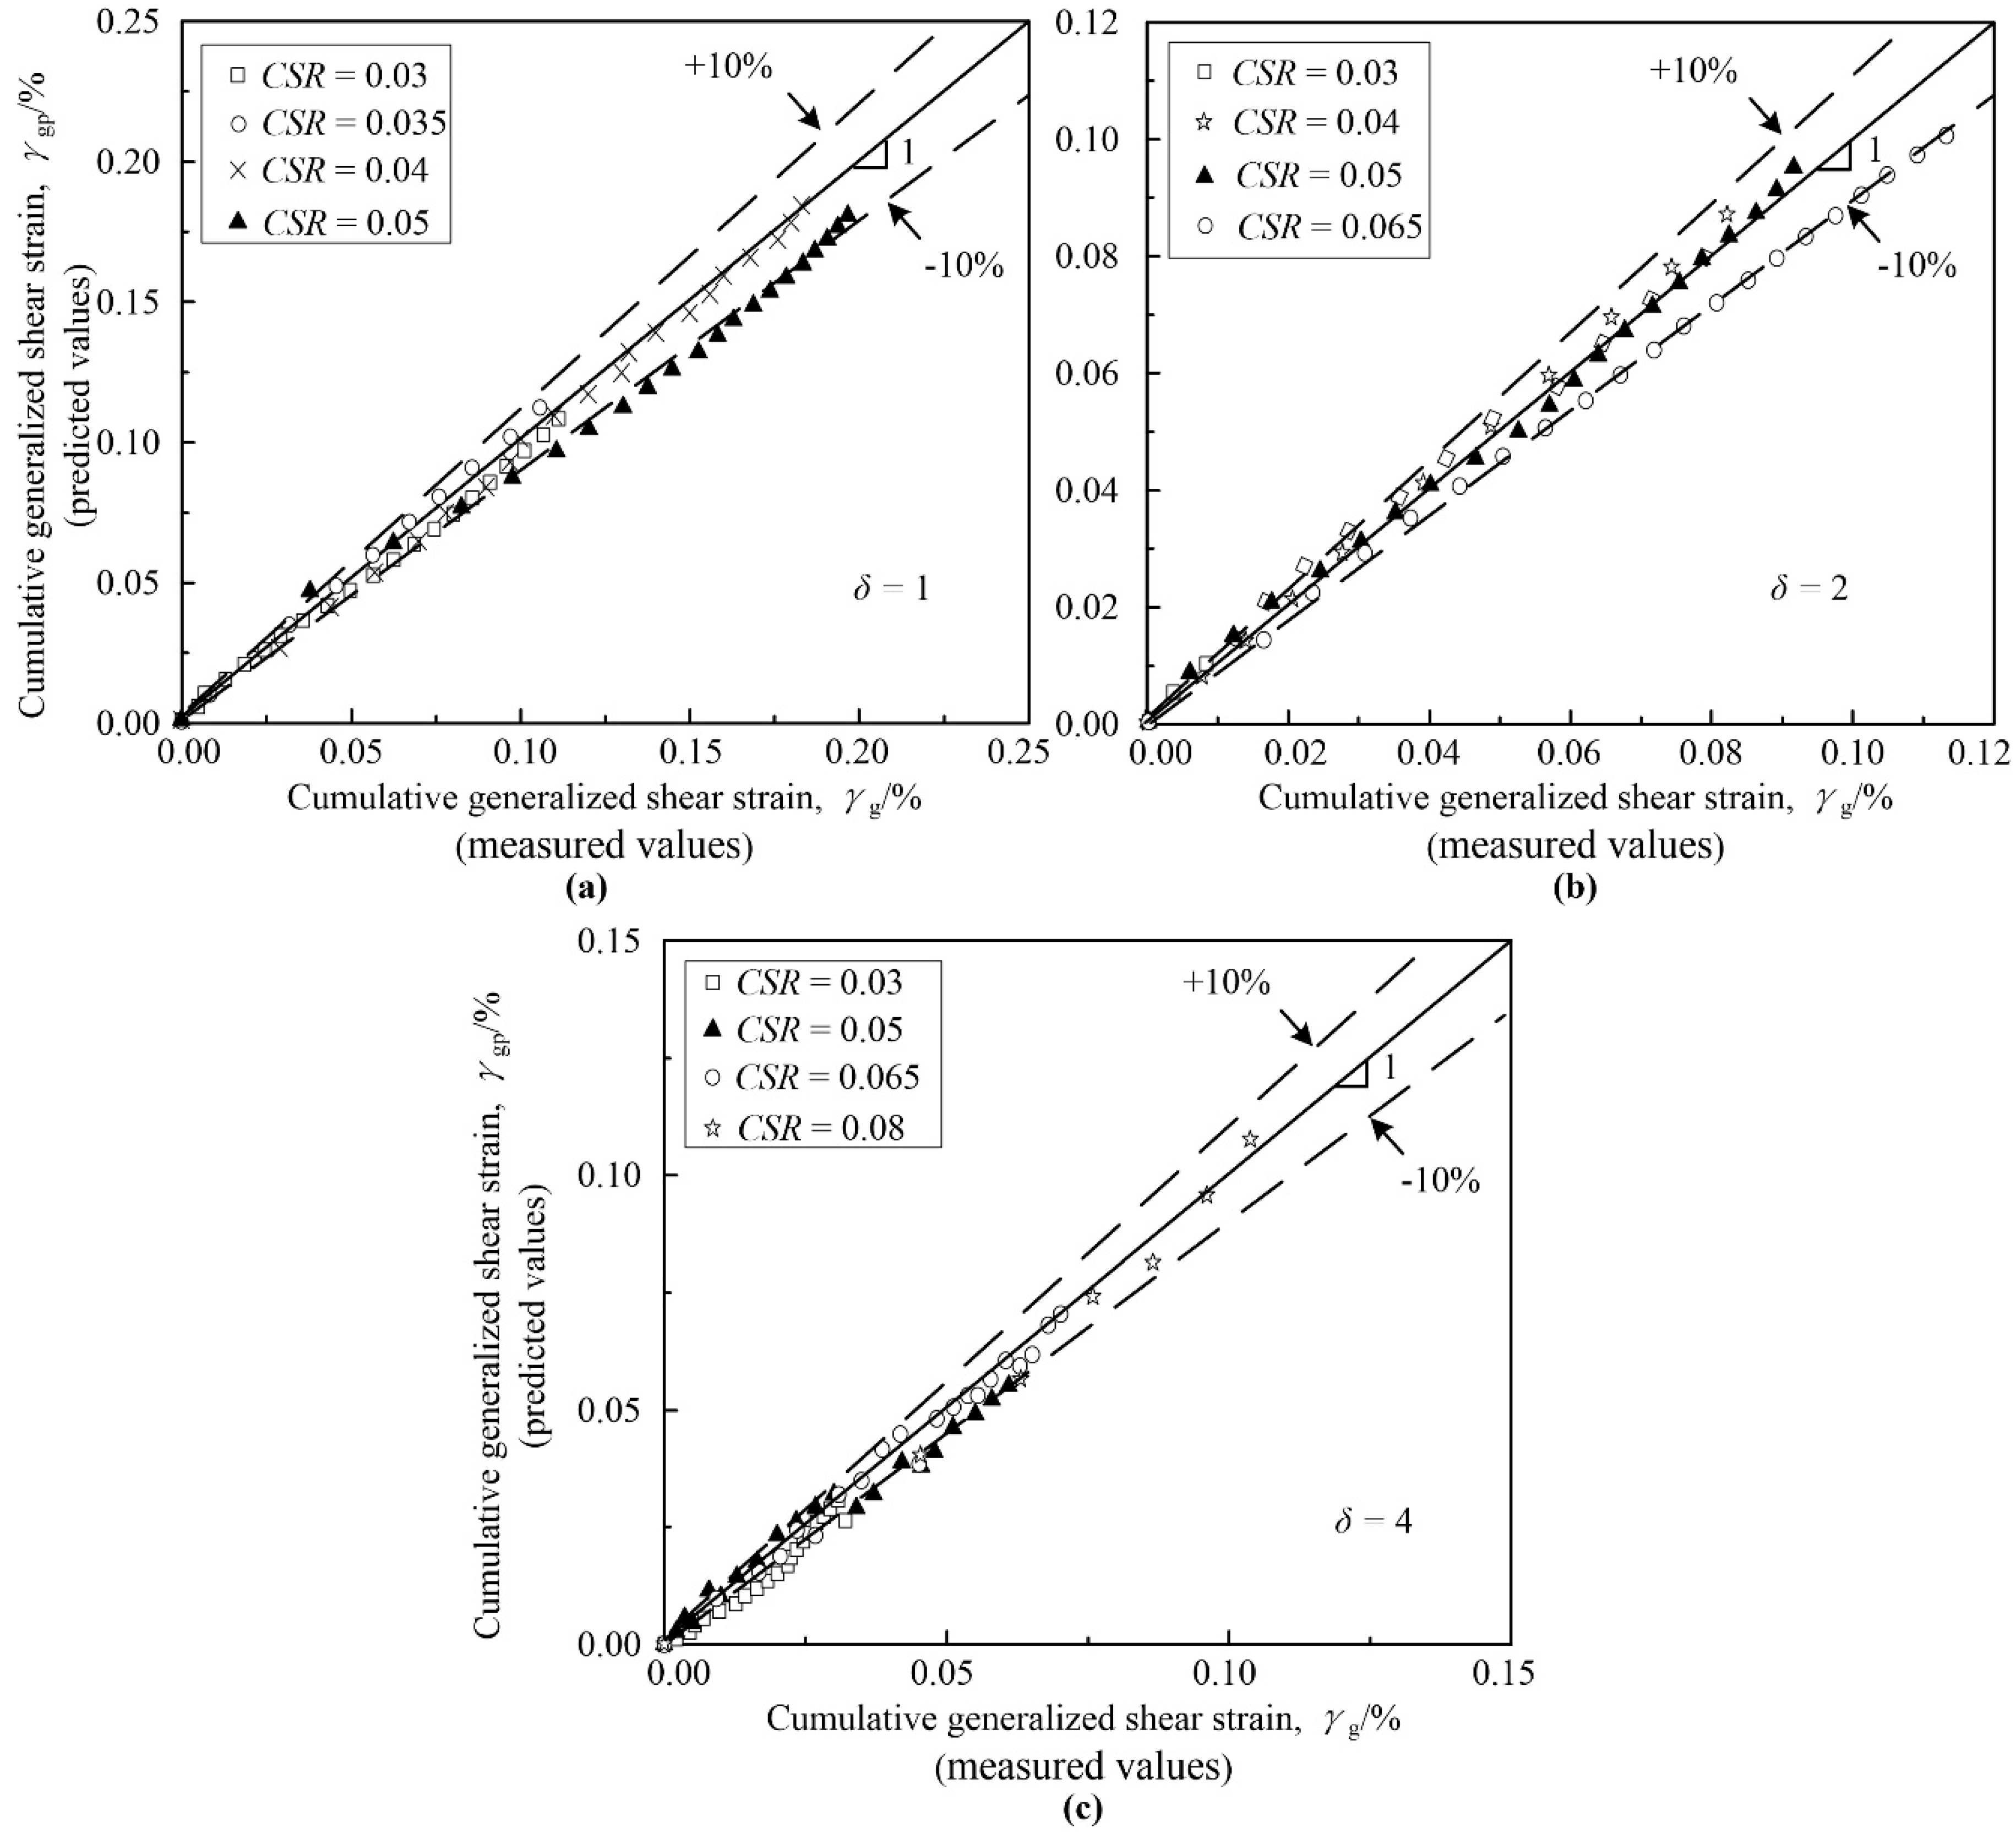
3.4. The Predict Model of Cumulative Generalized Shear Strain

Figure 11 and Figure 12 show the variation curves of the fitting parameters a and b with CSR. For different δ (i.e., different stress path), a increases with increasing CSR. The values of the Monismith model parameters a and b in Figure 11 and Figure 12 have been used in Figure 6. The growth rate gradually increases with increasing CSR, and a has a good power function relationship with CSR. b decreases with increasing CSR, and the rate gradually decreases with increasing CSR. b has a good negative power function relationship with CSR. γg, calculated by the modified Monismith model, is defined as the cumulative generalized shear strain prediction γgp. Then, the empirical relationship between a/b and CSR is as follows:
a = A 1 × C S R A 2
b = B 1 × C S R B 2
In summary, the cumulative deformation of seabed silt soil under various stress levels and loading models can be predicted by combining Equations (2)–(4).
Figure 13 shows the relationship between the measured value of γg and the predicted value calculated by the modified Monismith model. It can be observed that the error between the predicted value and the measured value is roughly within 10%. The results show that the modified Monismith model can reasonably describe the γgp and CSR of saturated silt under different cyclic stress paths.

4. Conclusions

An experimental comparison between the circular stress path and the elliptical stress path was conducted, and the experimental results demonstrated the necessity of adopting the elliptical rotation stress path to evaluate the cyclic deformation of marine silt. In addition, the following conclusions can be drawn from the results:
(1)
When CSR is small, the generalized shear strain of marine silt is small under wave loading. However, with the increase in CSR, the value of generalized shear strain is larger under the same confining pressure.
(2)
The influence of the cyclic loading amplitude ratio δ on the generalized shear strain of marine silt is significant. With the increase in δ, the value of generalized shear strain is smaller. When the δ = 1, the generalized shear strain is the most significant.
(3)
The modified Monismith model exerts a significant advantage in the evaluation of the generalized shear strain behavior of the non-liquefaction marine silt in geotechnical engineering practice. The variables a and b both present a moderately strong power correlation with CSR. In addition, the proposed prediction method, based on the modified Monismith model, is in good agreement with our measurements, with an error that is generally less than 10%.

Author Contributions

L.C. (Lan Cui) proposed the general framework of the paper, was responsible for drafting the paper, and sorted out and analyzed the subsequent data; Q.S. mainly made important modifications to the paper and gave some key opinions. Z.N. mainly sorted out the experimental materials and literature, and approved the final version of the paper to be published. L.C. (Liuming Chang) was mainly involved in the experiment process and helped with the drawing. All authors have read and agreed to the published version of the manuscript.

Funding

This research was funded by [National Natural Science Foundation of China] grant number [52009129].

Institutional Review Board Statement

Not applicable.

Informed Consent Statement

Not applicable.

Data Availability Statement

The data presented in this study are available on request from the corresponding author.

Acknowledgments

The authors acknowledge the financial support provided by National Natural Science Foundation of China (Grant No. 52009129). The authors would also like to thank referees for their valuable comments and contributions.

Conflicts of Interest

The authors declare no conflict of interest.

References

  1. De Groot, M.B.; Bolton, M.D.; Foray, P.; Meijers, P. Physics of liquefaction phenomena around marine structures. J. Waterw. Port Coast. Ocean Eng. 2006, 132, 227–243. [Google Scholar] [CrossRef]
  2. Suleman, K.F.; Shahid, A. Determination of the desiccation behavior of clay slurries. Int. J. Min. Sci. Technol. 2017, 27, 981–988. [Google Scholar]
  3. Kjekstad, O.; Lunne, T. Soil parameters used for design of gravity platforms in the North Sea. Appl. Ocean Res. 1981, 3, 50–58. [Google Scholar] [CrossRef]
  4. Kasper, T.; Steenfelt, J.S.; Pedersen, L.M.; Jackson, P.G. Stability of an immersed tunnel in offshore conditions under deep water wave impact. Coast. Eng. 2008, 55, 753–760. [Google Scholar] [CrossRef]
  5. Puzrin, A.M.; Alonso, E.E.; Pinyol, N.M. Caisson Failure Induced by Liquefaction: Barcelona Harbour, Spain Geomechanics of Failures; Springer: Dordrecht, The Netherlands, 2010; pp. 85–148. [Google Scholar]
  6. Del Campo, J.M.; Negro, V. Failures of harbour walls at Malaga and Barcelona. Bull. Eng. Geol. Environ. 2011, 70, 1–6. [Google Scholar] [CrossRef] [Green Version]
  7. Cui, L.; Sheng, Q.; Ruan, B.; Xu, D.D.; Dong, Y.K. A quantitative analysis of the effect of end plate of fully-grouted bolts on the global stability of tunnel. Tunn. Undergr. Space Technol. 2021, 114, 104010. [Google Scholar] [CrossRef]
  8. Fredsøe, J. Pipeline–seabed interaction. J. Waterw. Port Coast. Ocean Eng. 2016, 142, 03116002. [Google Scholar] [CrossRef] [Green Version]
  9. Sassa, S.; Sekiguchi, H. Analysis of wave-induced liquefaction of sand beds. Géotechnique 2001, 51, 115–126. [Google Scholar] [CrossRef]
  10. Arthur, J.R.F.; Menzies, B.K. Inherent anisotropy in a sand. Geotechniqu 1972, 22, 115–128. [Google Scholar] [CrossRef]
  11. Ishihara, K.; Towhata, I. Sand response to cyclic rotation of principal stress directions as induced by wave loads. Soils Found. 1983, 23, 11–26. [Google Scholar] [CrossRef] [Green Version]
  12. Nakata, Y.; Hyodo, M.; Murata, H.; Yasufuku, N. Flow deformation of sands subjected to principal stress rotation. Soils Found. 1998, 38, 115–128. [Google Scholar] [CrossRef] [Green Version]
  13. Gutierrez, M.; Ishihara, K. Non-coaxiality and energy dissipation in granular materials. Soils Found. 2000, 40, 49–59. [Google Scholar] [CrossRef] [Green Version]
  14. Zdravković, L.; Jardine, R.J. The effect on anisotropy of rotating the principal stress axes during consolidation. Geotechnique 2001, 51, 69–83. [Google Scholar] [CrossRef]
  15. Petalas, A.L.; Dafalias, Y.F.; Papadimitriou, A.G. SANISAND-FN: An evolving fabric-based sand model accounting for stress principal axes rotation. Int. J. Numer. Anal. Methods Geomech. 2019, 43, 97–123. [Google Scholar] [CrossRef]
  16. Triantafyllos, P.K.; Georgiannou, V.N.; Dafalias, Y.F.; Georgopoulos, I.-O. Novel findings on the dilatancy and noncoaxiality of sand under generalised loading. Acta Geotech. 2021, 16, 1699–1734. [Google Scholar] [CrossRef]
  17. Georgiannou, V.N.; Konstadinou, M.; Triantafyllos, P. Sand behavior under stress states involving principal stress rotation. J. Geotech. Geoenviron. Eng. 2018, 144, 04018028. [Google Scholar] [CrossRef]
  18. Sze, H.Y.; Yang, J. Failure modes of sand in undrained cyclic loading: Impact of sample preparation. J. Geotech. Geoenviron. Eng. 2014, 140, 152–169. [Google Scholar] [CrossRef] [Green Version]
  19. Jeng, D.S.; Hsu, J.S.C. Wave-induced soil response in a nearly saturated sea-bed of finite thickness. Geotechnique 1996, 46, 427–440. [Google Scholar] [CrossRef]
  20. Huang, B.; Chen, X.; Zhao, Y. A new index for evaluating liquefaction resistance of soil under combined cyclic shear stresses. Eng. Geol. 2015, 199, 125–139. [Google Scholar] [CrossRef]
  21. Liang, F.; Zhang, H.; Chen, S. Effect of vertical load on the lateral response of offshore piles considering scour-hole geometry and stress history in marine clay. Ocean Eng. 2018, 158, 64–77. [Google Scholar] [CrossRef]
  22. Chen, G.X.; Zhou, Z.L.; Pan, H.; Sun, T.; Li, X.J. The influence of undrained cyclic loading patterns and consolidation states on the deformation features of saturated fine sand over a wide strain range. Eng. Geol. 2016, 204, 77–93. [Google Scholar]
  23. Zhuang, H.Y.; Wang, R.; Chen, G.X.; Miao, Y.; Zhao, K. Shear modulus reduction of saturated sand under large liquefaction-induced deformation in cyclic torsional shear tests. Eng. Geol. 2018, 240, 110–122. [Google Scholar] [CrossRef]
  24. Hight, D.W.; Gens, A.; Symes, M.J. The development of a new hollow cylinder apparatus for investigating the effects of principal stress rotation in soils. Geotechnique 1983, 33, 355–383. [Google Scholar] [CrossRef]
  25. Chen, G.; Wu, Q.; Zhou, Z.; Ma, W.; Chen, W.; Khoshnevisan, S.; Yang, J. Undrained anisotropy and cyclic resistance of saturated silt subjected to various patterns of principal stress rotation. Géotechnique 2020, 70, 317–331. [Google Scholar] [CrossRef]
  26. Skempton, A.W. The pore-pressure coefficients A and B. Geotechnique 1954, 4, 143–147. [Google Scholar] [CrossRef]
  27. Wang, Z.; Liu, P.; Jeng, D.; Yang, Q. Cyclic strength of sand under a nonstandard elliptical rotation stress path induced by wave loading. J. Hydrodyn. 2017, 29, 89–95. [Google Scholar] [CrossRef]
  28. O’Reilly Mike, P.; Stephen, F.B. (Eds.) Cyclic Loading of Soils: From Theory to Design; Blackie: Glasgow, UK, 1991. [Google Scholar]
  29. Xia, K.; Wang, J. Shear principal, and equivalent strains in equal-channel angular deformation. Metall. Mater. Trans. A 2002, 33, 467. [Google Scholar] [CrossRef]
  30. Monismith, C.L.; Ogawa, N.; Freeme, C.R. Permanent deformation characteristics of subgrade soils due to repeated loading. Transp. Res. Rec. 1975, 537, 1–17. [Google Scholar]
  31. Seed, H.B.; Lee, K.L. Liquefaction of saturated sands during cyclic loading. J. Soil Mech. Found. Div. 1966, 92, 105–134. [Google Scholar] [CrossRef]
  32. EIMohtar, C.S. Evaluation of the 5% double amplitude strain criterion. In Proceedings of the 17th International Conference on Soil Mechanics and Geotechnical Engineering, Alexandria, Egypt, 5–9 October 2009; IOS Press: Amsterdam, The Netherlands, 2009; pp. 80–83. [Google Scholar]
Figure 1. The area for obtaining the test samples.
Applsci 11 09458 g001
Figure 2. GDS hollow cylinder apparatus test system.
Applsci 11 09458 g002
Figure 3. Idealized stress and strain components within HCA subjected to axial and torsional loads. (a) The HCA can cyclically and independently control the vertical/torque load (W/MT) and outer/inner cell pressure po/pi; (b) The stress components of σz, σr, σθ, and τ in an element of a hollow cylinder specimen; (c) The stress components of σ1, σ2 and σ3 in an element of a hollow cylinder specimen.
Applsci 11 09458 g003
Figure 4. The grain size distribution of silt soil.
Applsci 11 09458 g004
Figure 5. Stress path for cyclic shear loading.
Applsci 11 09458 g005
Figure 6. Typical test results of saturated silt sample under cyclic axial–torsional combined loading. (a) The relationship between excess pore water pressure and number of cycles; (b) The relationship between axial strain and number of cycles; (c) The relationship between shear strain and number of cycles; (d) The relationship between radial strain and number of cycles.
Applsci 11 09458 g006
Figure 7. (ac) Relationship between cumulative generalized shear strain and number of cycles under the same δ.
Applsci 11 09458 g007
Figure 8. (a,b) Relationship between cumulative generalized shear strain and number of cycles under different stress paths.
Applsci 11 09458 g008
Figure 9. Relationship between cumulative generalized shear strain and number of cycles under the same CSR. (a) The relationship between cumulative generalized shear strain and number of cycles when CSR = 0.03; (b) The relationship between cumulative generalized shear strain and number of cycles when CSR = 0.05; (c) The relationship between cumulative generalized shear strain and number of cycles when CSR = 0.065.
Applsci 11 09458 g009
Figure 10. Relationship between terminal generalized shear strain and cyclic stress ratio.
Applsci 11 09458 g010
Figure 11. Relationship between parameter a and CSR in Monismith model. (a) The relationship between parameter a and CSR when δ = 1; (b) The relationship between parameter a and CSR when δ = 2; (c) The relationship between parameter a and CSR when δ = 4.
Applsci 11 09458 g011
Figure 12. Relationship between parameter b and CSR in Monismith model. (a) The relationship between parameter b and CSR when δ = 1; (b) The relationship between parameter b and CSR when δ = 2; (c) The relationship between parameter b and CSR when δ = 4.
Applsci 11 09458 g012
Figure 13. (ac) Comparison of measured values and predicted values of cumulative generalized shear strain.
Applsci 11 09458 g013
Table 1. Physical properties of the silt soil tested in this study.
Physical ParametersSymbolValue
Specific gravityGs2.70
Plastic IndexPI3
Maximum void ratioemax1.22
Minimum void ratioemin0.65
Table 2. Undrained cyclic shear tests.
Case No.σmax
(kPa)
τmax
(kPa)
ΔCSRStress PathCase No.σmax
(kPa)
τmax
(kPa)
δCSRStress Path
S13310.03CircleS952.520.05Oval
S23.53.510.035CircleS106.53.2520.065Oval
S34410.04CircleS118420.08Oval
S45510.05CircleS1230.7540.03Oval
S56.56.510.065CircleS1351.2540.05Oval
S68810.08CircleS146.51.62540.065Oval
S731.520.03OvalS158240.08Oval
S84220.04Oval
Publisher’s Note: MDPI stays neutral with regard to jurisdictional claims in published maps and institutional affiliations.

