Abstract
The lower rocker arm is an important part of the vertical roller mill and its lightweight design is of great significance for reducing the mass and production cost of the roller mill. Firstly, the strength and deformation distribution of the lower rocker arm under working load were analyzed by ANSYS Workbench to determine the maximum stress and maximum deformation. The parts with large strength margin were used as the basis for the optimal design. During the analysis, firstly, the arm body of the lower rocker arm was determined part of the lightweight design. Secondly, the mass of the lower rocker arm was taken as the optimization target, the stress and displacement generated by the load of the lower rocker arm were taken as the constraint conditions, the structural size of the internal cavity of the lower rocker arm was taken as the optimization design parameter, and the mathematical model of the optimization design was established. Finally, the structural size of the internal cavity of the lower rocker arm was optimized by using the response surface optimization module and multi-objective genetic algorithm in ANSYS Workbench. The optimum results show that, compared with the original design model, the lower rocker mass was reduced by 346.3 kg and the decrease was about 5.29%, while the strength and deformation were nearly unchanged. Therefore, by optimizing the design, the material is saved and the cost is reduced, which can provide a reference basis for the design and light weight of the lower rocker arm.
1. Introduction
The Vertical Roller Mill (VRM) is a large piece of equipment for grinding materials and is usually used in the production fields of milling slag, cement raw material, clinker, and coal. With the development of social productivity, the grinding industry is making increasing demands on the production capacity and efficiency of equipment, and the size of VRMs is also increasing. Relatively conservative methods are usually adopted for calculations in the design process of VRMs. These methods are adopted in order to improve the structural strength of VRMs, but lead to a waste of materials resulting from the VRM’s excessively large structure [1,2].
The lower rocker arm is an important pressure-applying part of VRMs. Its tail is connected to a hydraulic device, its middle is fixed on the shaft of the rocker arm, and its top is connected with the upper rocker arm. The stability of the structural strength of the lower rocker arm plays a decisive role in ensuring that the vertical grinding is in a working state, thereby guaranteeing the grinding quality of the material [3,4]. In light of experience, the product size parameters and the structure designed are relatively conservative; it is important to optimize the structure by means of computer-aided design and finite element analysis [5,6,7,8]. In this study, a 3D model of the lower rocker arm was established by SolidWorks and a structural optimization design was carried out. ANSYS Workbench was used to carry out a finite element analysis on the strength and deformation of the lower rocker arm before optimization. By analyzing the strength and deformation before optimization, the strength margin was obtained, so as to determine the optimal design position, and the multi-objective genetic algorithm was used to optimize the position. In order to meet the requirements of strength and deformation, the quality of the lower rocker arm was reduced through optimal design to achieve the lightweight goal of the vertical mill, so as to save materials, reduce costs and improve the market competitiveness of the product.
2. Finite Element Analysis
2.1. Modeling and Meshing
In this study, the lower rocker arm was modeled and simplified by SolidWorks, and the established model was imported into the static structural module of the workbench. The selected material was 270–480 w. Its elastic modulus was 2.05 × 10¹¹ Pa, its Poisson’s ratio was 0.3, its density was 7850 kg/m3, its yield strength was 270 MPa, its tensile strength was 500 MPa, and its allowable strain was 0.27% [9].
To reduce the calculation cost while maintaining calculation accuracy, tetrahedral elements with intermediate nodes were used for mesh generation. The maximum equivalent stress of the lower rocker arm was compared and analyzed when the number of grids was 90,761, 273,406, 812,723, and 2,064,886. When the number of grids was 812,723, the relative error was 1.04%, and the maximum equivalent stress on the lower rocker arm was slightly affected by the grid, so the lower rocker arm was meshed with this number of grids, as shown in Figure 1.
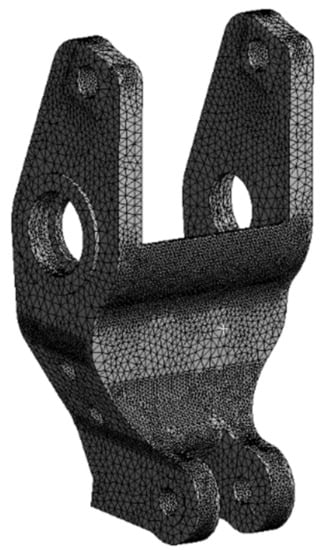
Figure 1.
Grid division of the lower rocker arm.
2.2. Load Calculation
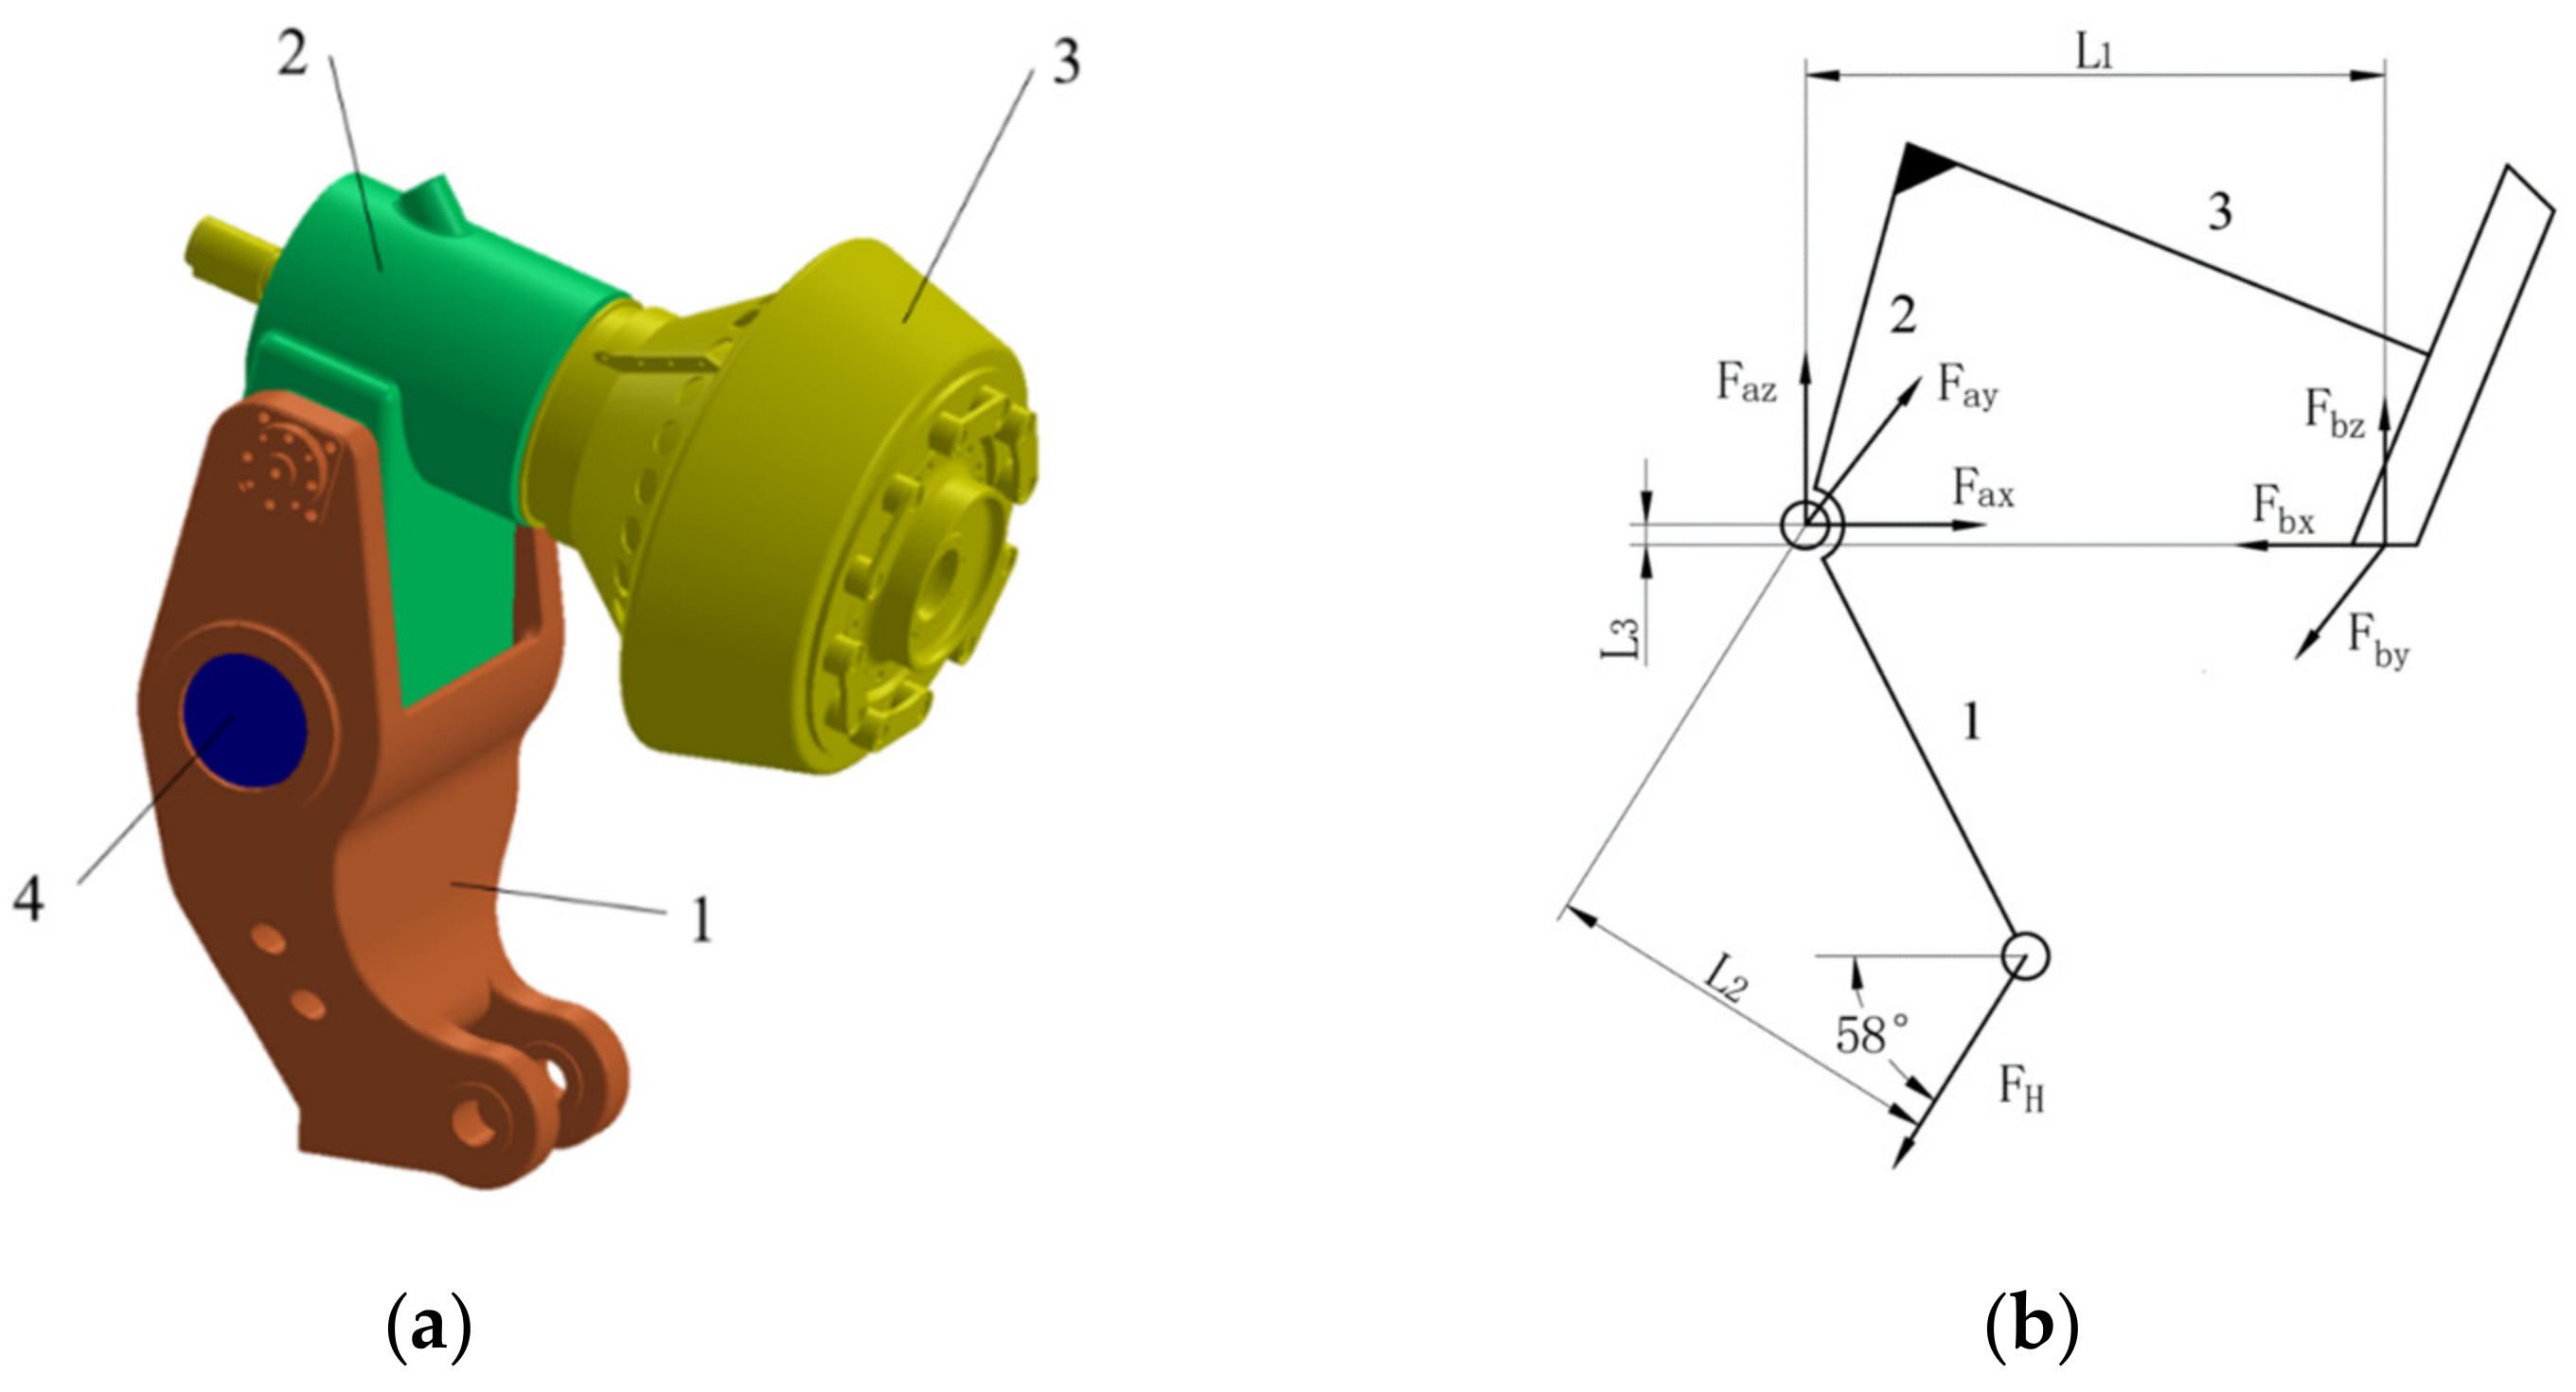
The force system needs to be analyzed before calculating the force on the lower rocker arm. In Figure 2a, the marked components 1, 2, 3 and 4 in the figure are represented as the lower rocker arm, upper rocker arm, grinding roller and rocker arm shaft, respectively. The rocker shaft is connected to the bearing base through the bearing, the upper rocker arm and lower rocker arm are connected to the rocker arm shaft through the expansion sleeves, the tail of the lower rocker arm is connected to the hydraulic device, and the upper rocker arm is rigidly connected to the grinding roller. Assuming that the VRM works under ideal conditions, the force acting on the force system can be appropriately simplified. As shown in Figure 2b, FH is the pulling force provided by the hydraulic cylinder, and Fax, Fay and Faz are loads in three directions on the connection of the two rocker-arm bearings respectively. Fax1 and Fax2 represent the force component of Fax acting on the joint of the two rocker-arm bearings. Fbx is the sliding friction between the grinding roller and the material, Fby is the rolling friction in the tangential direction of the outer circle of the grinding roller, while Fbz is the reaction force of the grinding disc to the grinding roller (including the self-weight of the grinding roll G = 1.30 × 10⁵ N).

Figure 2.
Force analysis of the force system of the VRM: (a) 3D structure of the force application system; (b) force diagram of force application system.
Input the known parameters into Formula (1) to obtain the pulling force FH of the hydraulic cylinder on the rocker arm as follows:
where A is the rod cavity area of the hydraulic cylinder, taken as 0.109 m2, and P is the working pressure of the hydraulic cylinder, taken as 12 MPa [10].
Input the known parameters into Formula (2) to obtain the sliding friction force Fbx between the grinding roller and the material as follows:
where f is the sliding friction coefficient between the grinding roller and the material, which is taken as 0.25 [11].
Input the known parameters into Equation (3); the reaction force Fbz of grinding disc to grinding roll is obtained as follows:
where fr is the rolling friction coefficient between the grinding roller and the material, which is taken as 0.05 [11].
According to the equilibrium conditions:
In Figure 3, L1 = 1536 mm, L2 = 1287 mm, L3 = 54.3 mm, L4 = 1268 mm, θ = 58°, and the weight of the grinding roller G = 1.30 × 10⁵ N.
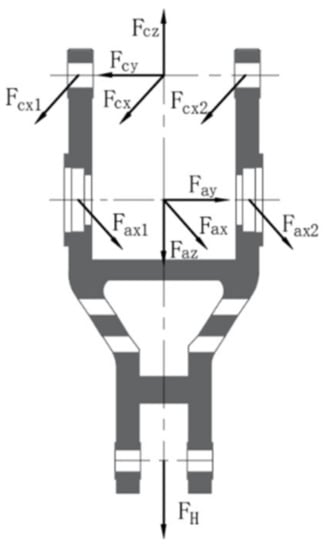
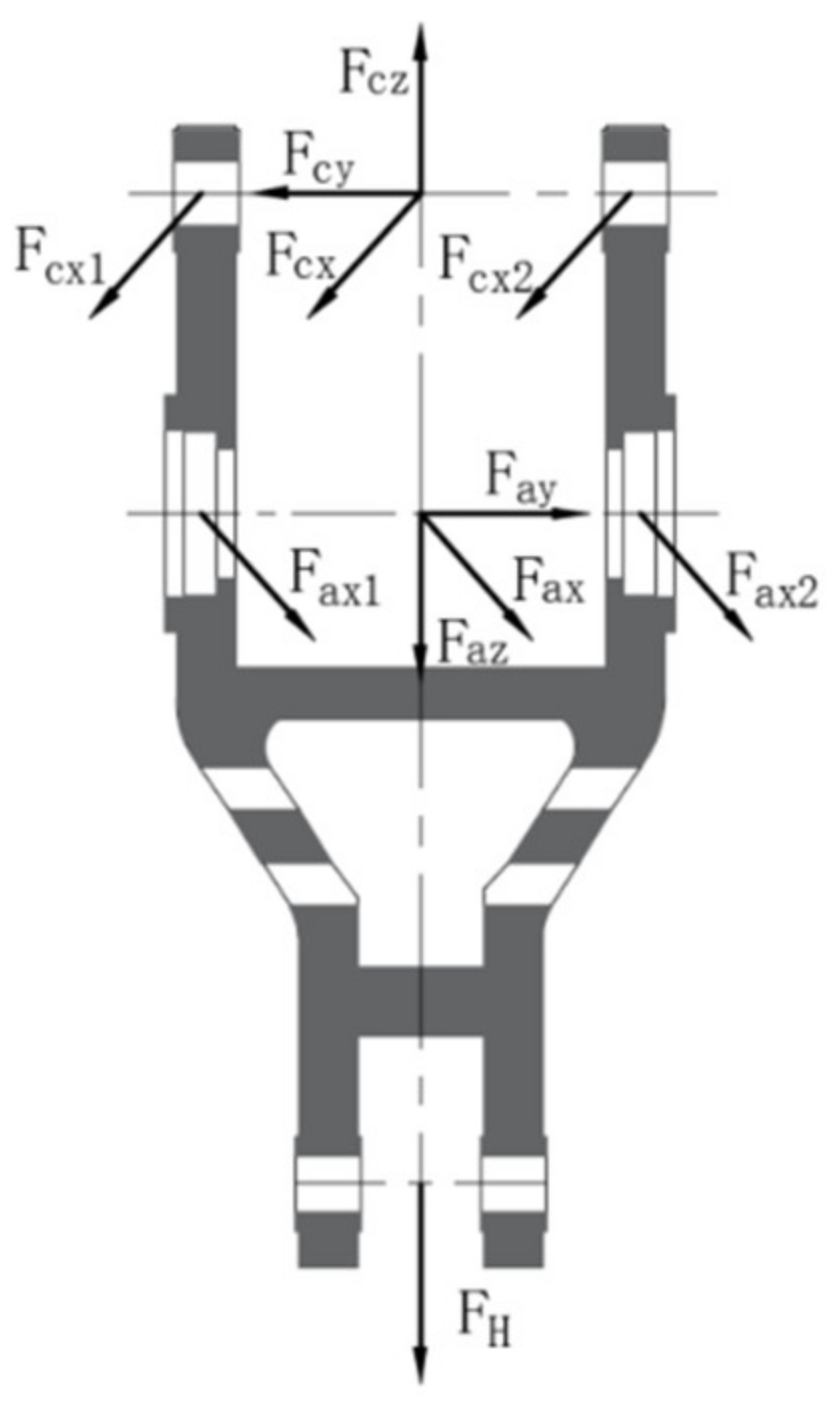
Figure 3.
Force analysis diagram of the lower rocker arm.
Input the parameters into Equation (4) to obtain: Fax = 998 KN, Fay = 60.8 KN, Faz = −129 KN, Fax1 = 572.7 KN, Fax2 = 425.3 KN, Fbx = 304 KN, Fby = 60.8 KN, and Fbz = 1216 KN.
As shown in Figure 3, Fcx, Fcy, and Fcz are the forces exerted by the upper and lower rocker arms at the connection holes; Fcx1 and Fcx2 represent the force component distributed by Fcx to the two connecting holes.
According to the equilibrium conditions:
where Fby = 60.8 KN, Fbz = 1216 KN, L1 = 1536 mm, and L4 = 1268 mm.
The forces in the connecting holes of the upper and lower rocker arms are calculated as follows: Fcx = 304 KN, Fcy = 60.8 KN, Fcz = 1216 KN, Fcx1 = 304 KN, and Fcx2 = 60.8 KN.
2.3. Applying Boundary Conditions
The load is applied to the lower rocker arm in the static structural module of ANSYS workbench. The pulling force FH of the hydraulic cylinder is loaded to the pull ring at the tail of the lower rocker arm, and Fay, Faz, Fcy, Fcz, Fax, and Fcx are loaded to the corresponding connecting holes. The degrees of freedom (DOF) of the lower rocker in all directions should be limited according to the actual working conditions. Since the rocker arm shaft is fixed to the body column and the lower rocker can rotate around the rocker arm shaft, the DOF of displacement in three directions at the main shaft hole of the lower rocker should be restricted. The pull ring at the tail of the lower rocker arm is pulled downward by the hydraulic cylinder. Its axial displacement is limited according to actual working conditions.
2.4. Static Analysis
After applying loads and constraints to the design simulation (DS) in ANSYS workbench, the static analysis of the lower rocker arm was carried out. The stress and displacement are shown in Figure 4.
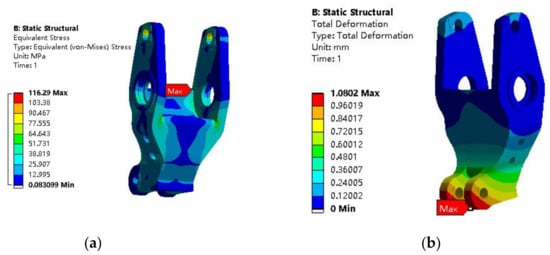
Figure 4.
Results of the static analysis of the lower rocker arm: (a) equivalent stress distribution; (b) displacement distribution.
The analysis shows that before optimization, the maximum equivalent stress of the lower rocker arm is 116.29 MPa, and the maximum stress occurs at the transition between the front casting of the lower rocker arm and the web plate; the maximum displacement is 1.082 mm, which occurs at the pull ring at the tail of the lower rocker arm. The material of the lower rocker arm is ZG270-500 and the safety factor is 1.4, so the allowable stress of the lower rocker arm is 192.8 MPa. The maximum deformation is approximately 0.045% of the total height of the rocker arm and the allowable strain of the material of the lower rocker arm is 0.27%. The maximum stress and maximum deformation of the lower rocker arm are less than the allowable value, so the structure of the lower rocker arm is reliable. At the same time, the arm body of the lower rocker arm undergoes a small stress; the maximum stress is no more than 30 MPa, as shown in Figure 5. Therefore, the size parameters of the internal cavity structure of the arm body are selected as the object of the lower arm’s lightweight design.
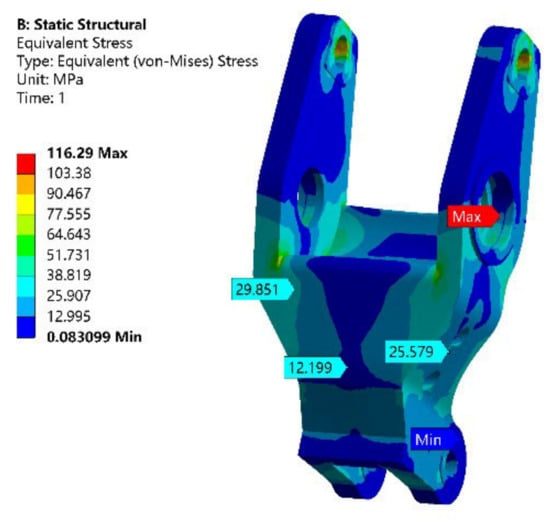
Figure 5.
Equivalent stress distribution at several points in the arm body of the lower rocker arm.
3. Optimum Design of Response Surface Analysis Method
3.1. Mathematical Model of Optimal Design
(1) Input variables
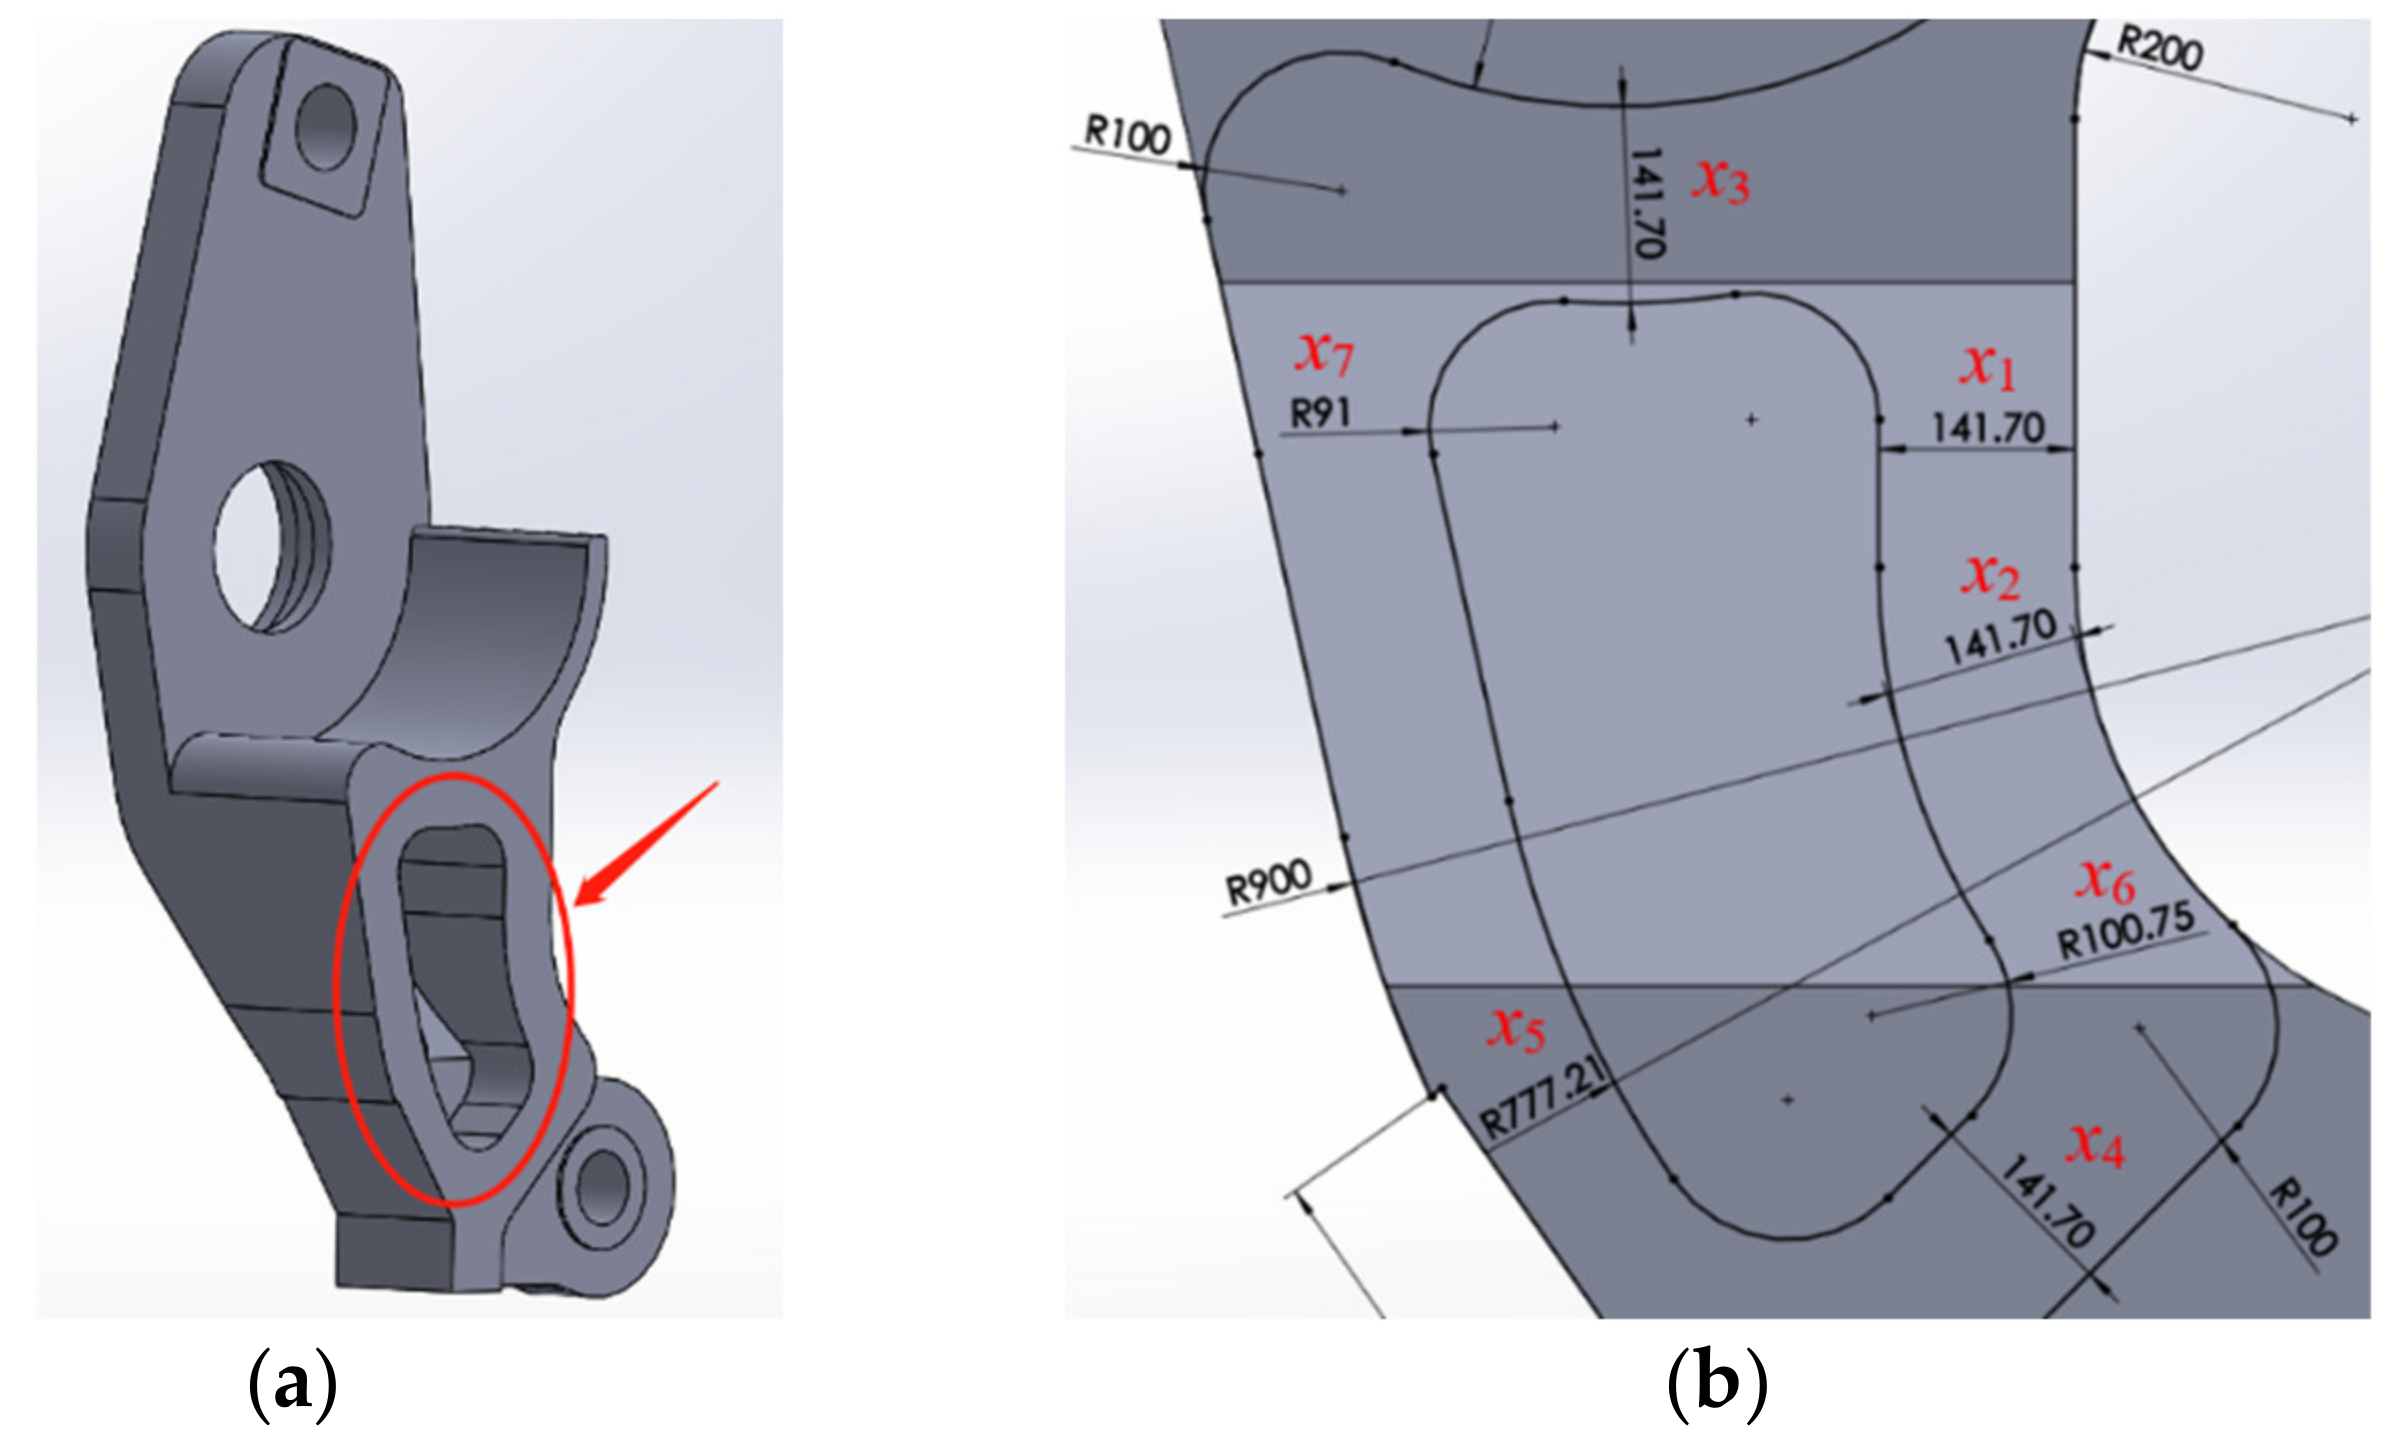
The structural size of the internal cavity can be completely defined by selecting seven dimensional parameters: x1, x2, x3, x4, x5, x6, and x7, as shown in Figure 6. Additionally, since the input variables x1, x2, x3, and x4 all represent the thickness of the cavity wall and feature the same size values, it is possible to set x2, x3, and x4 = x1.
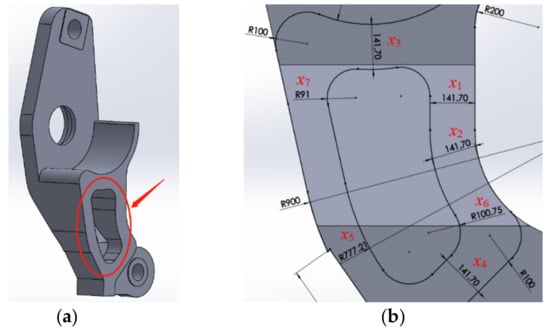
Figure 6.
Definition of input variables: (a) position of the internal cavity; (b) internal cavity size parameters.
The expression of the input variable can be expressed as a vector.
Taking into account the assembly relationships and process constraints, the range of constraints for each input variable is as follows:
127.5 mm ≤ x1 ≤ 155.8 mm
705.0 mm ≤ x5 ≤ 849.4 mm
94.5 mm ≤ x6 ≤ 107.0 mm
163.8 mm ≤ x7 ≤ 200.2 mm
705.0 mm ≤ x5 ≤ 849.4 mm
94.5 mm ≤ x6 ≤ 107.0 mm
163.8 mm ≤ x7 ≤ 200.2 mm
(2) Objective function
Under the requirement of deformation and strength, the optimal design goal of the lower rocker arm is to make its mass as small as possible. Therefore, the objective function is the mass of the lower rocker arm, which can be expressed as follows.
(3) Constraints
The material of the lower rocker arm is ZG270-500 and the safety factor is 1.4 [12]. Therefore, the allowable stress of the lower rocker arm is 192.8 MPa and the strength constraint of the lower rocker arm is:
In order to reserve optimum space for the model and to minimize the effect of deformation, the allowable displacement of the lower arm is set to no more than 1.5 mm:
To sum up, the mathematical model of this optimization design is:
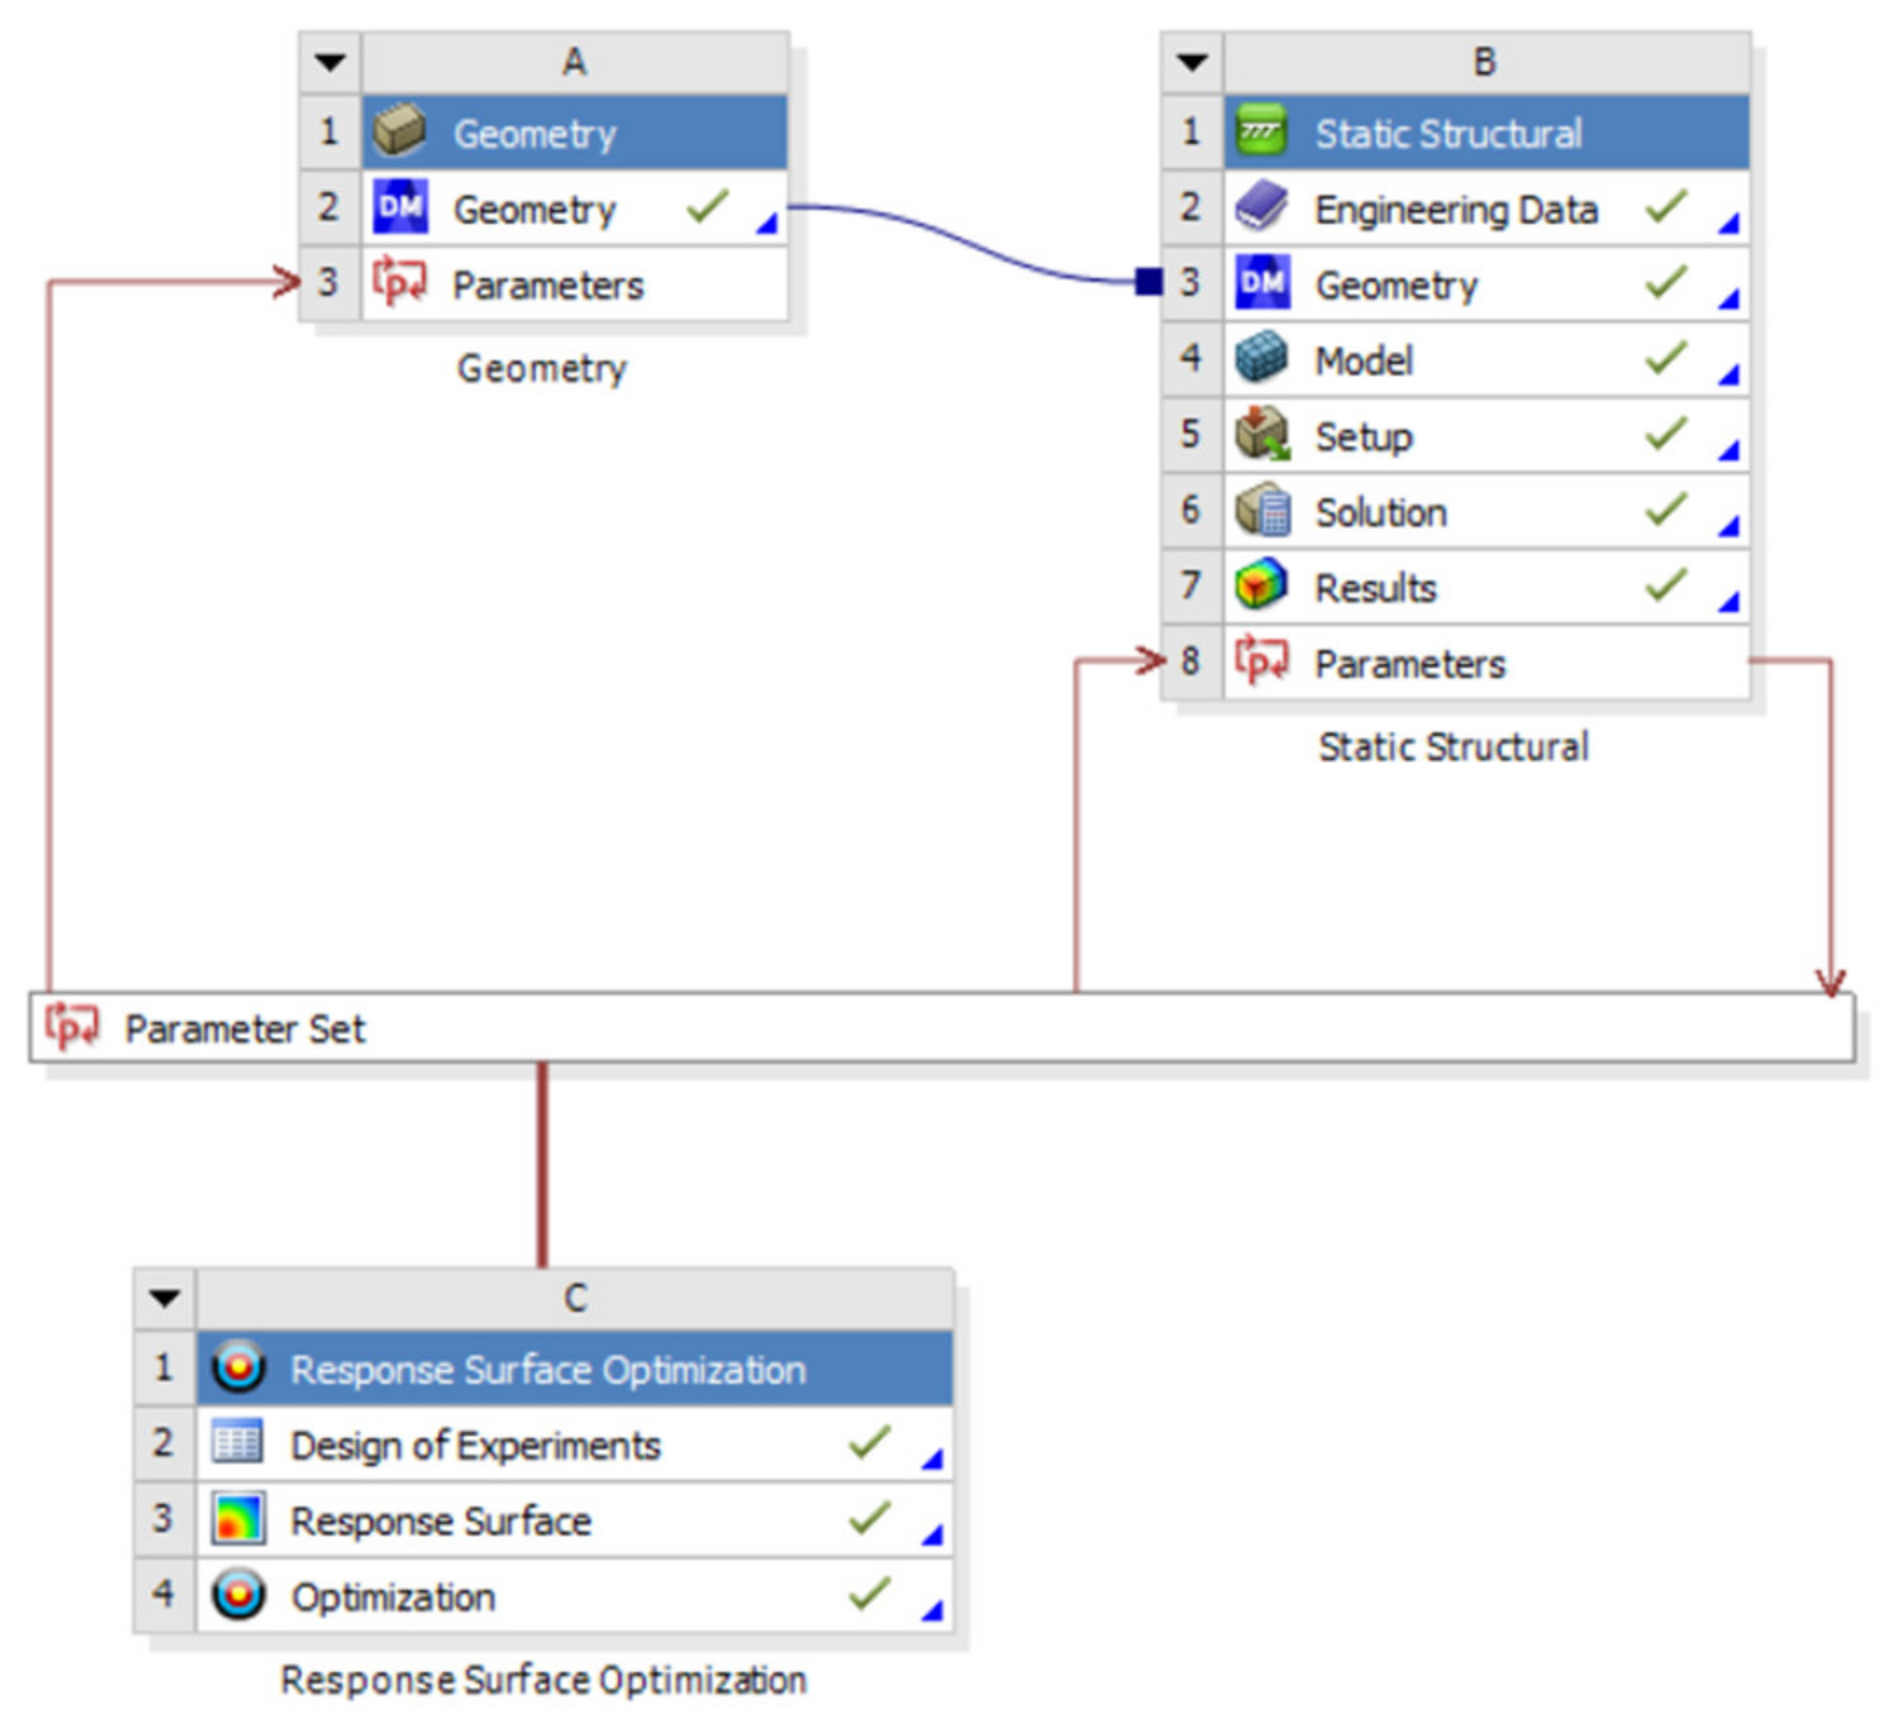
The analysis interface of the rocker arm in this paper is shown in Figure 7.

Figure 7.
Response surface optimization design flow chart.
3.2. Optimization of the Response Surface
(1) Response surface analysis
The response surface offers high accuracy and good prediction performance, and can study the interaction between several random variables [13,14]. Optimize the experimental design through the steps outlined in the Design of Experiments section; the design scope is shown in Table 1. After setting the parameters, 25 groups of experimental design points are updated, and the response results of the experimental design points are shown in Table 2 [15]. Parameter P1 corresponds to x1, P5 corresponds to x5, P6 corresponds to x6, and P7 corresponds to x7. Parameter P8 is the total mass of the lower rocker arm, P9 is the maximum stress, and P10 is the maximum displacement.

Table 1.
Constraint range of design variables.
Table 2.
Response results of experimental design points.
After updating 25 groups of experimental points, the standard response surface-full second-order polynomial was selected to fit the response surface model [15]. After fitting, the relationship between the input variable and the target variable of the response surface was obtained; that is, the mathematical relationship between the four input variables and the mass, the maximum displacement, and the maximum stress of the lower arm [16,17]. The Kriging was used to generate 2D curves between parameters P1, P5, P6, P7,P8, P9, and P10, respectively.
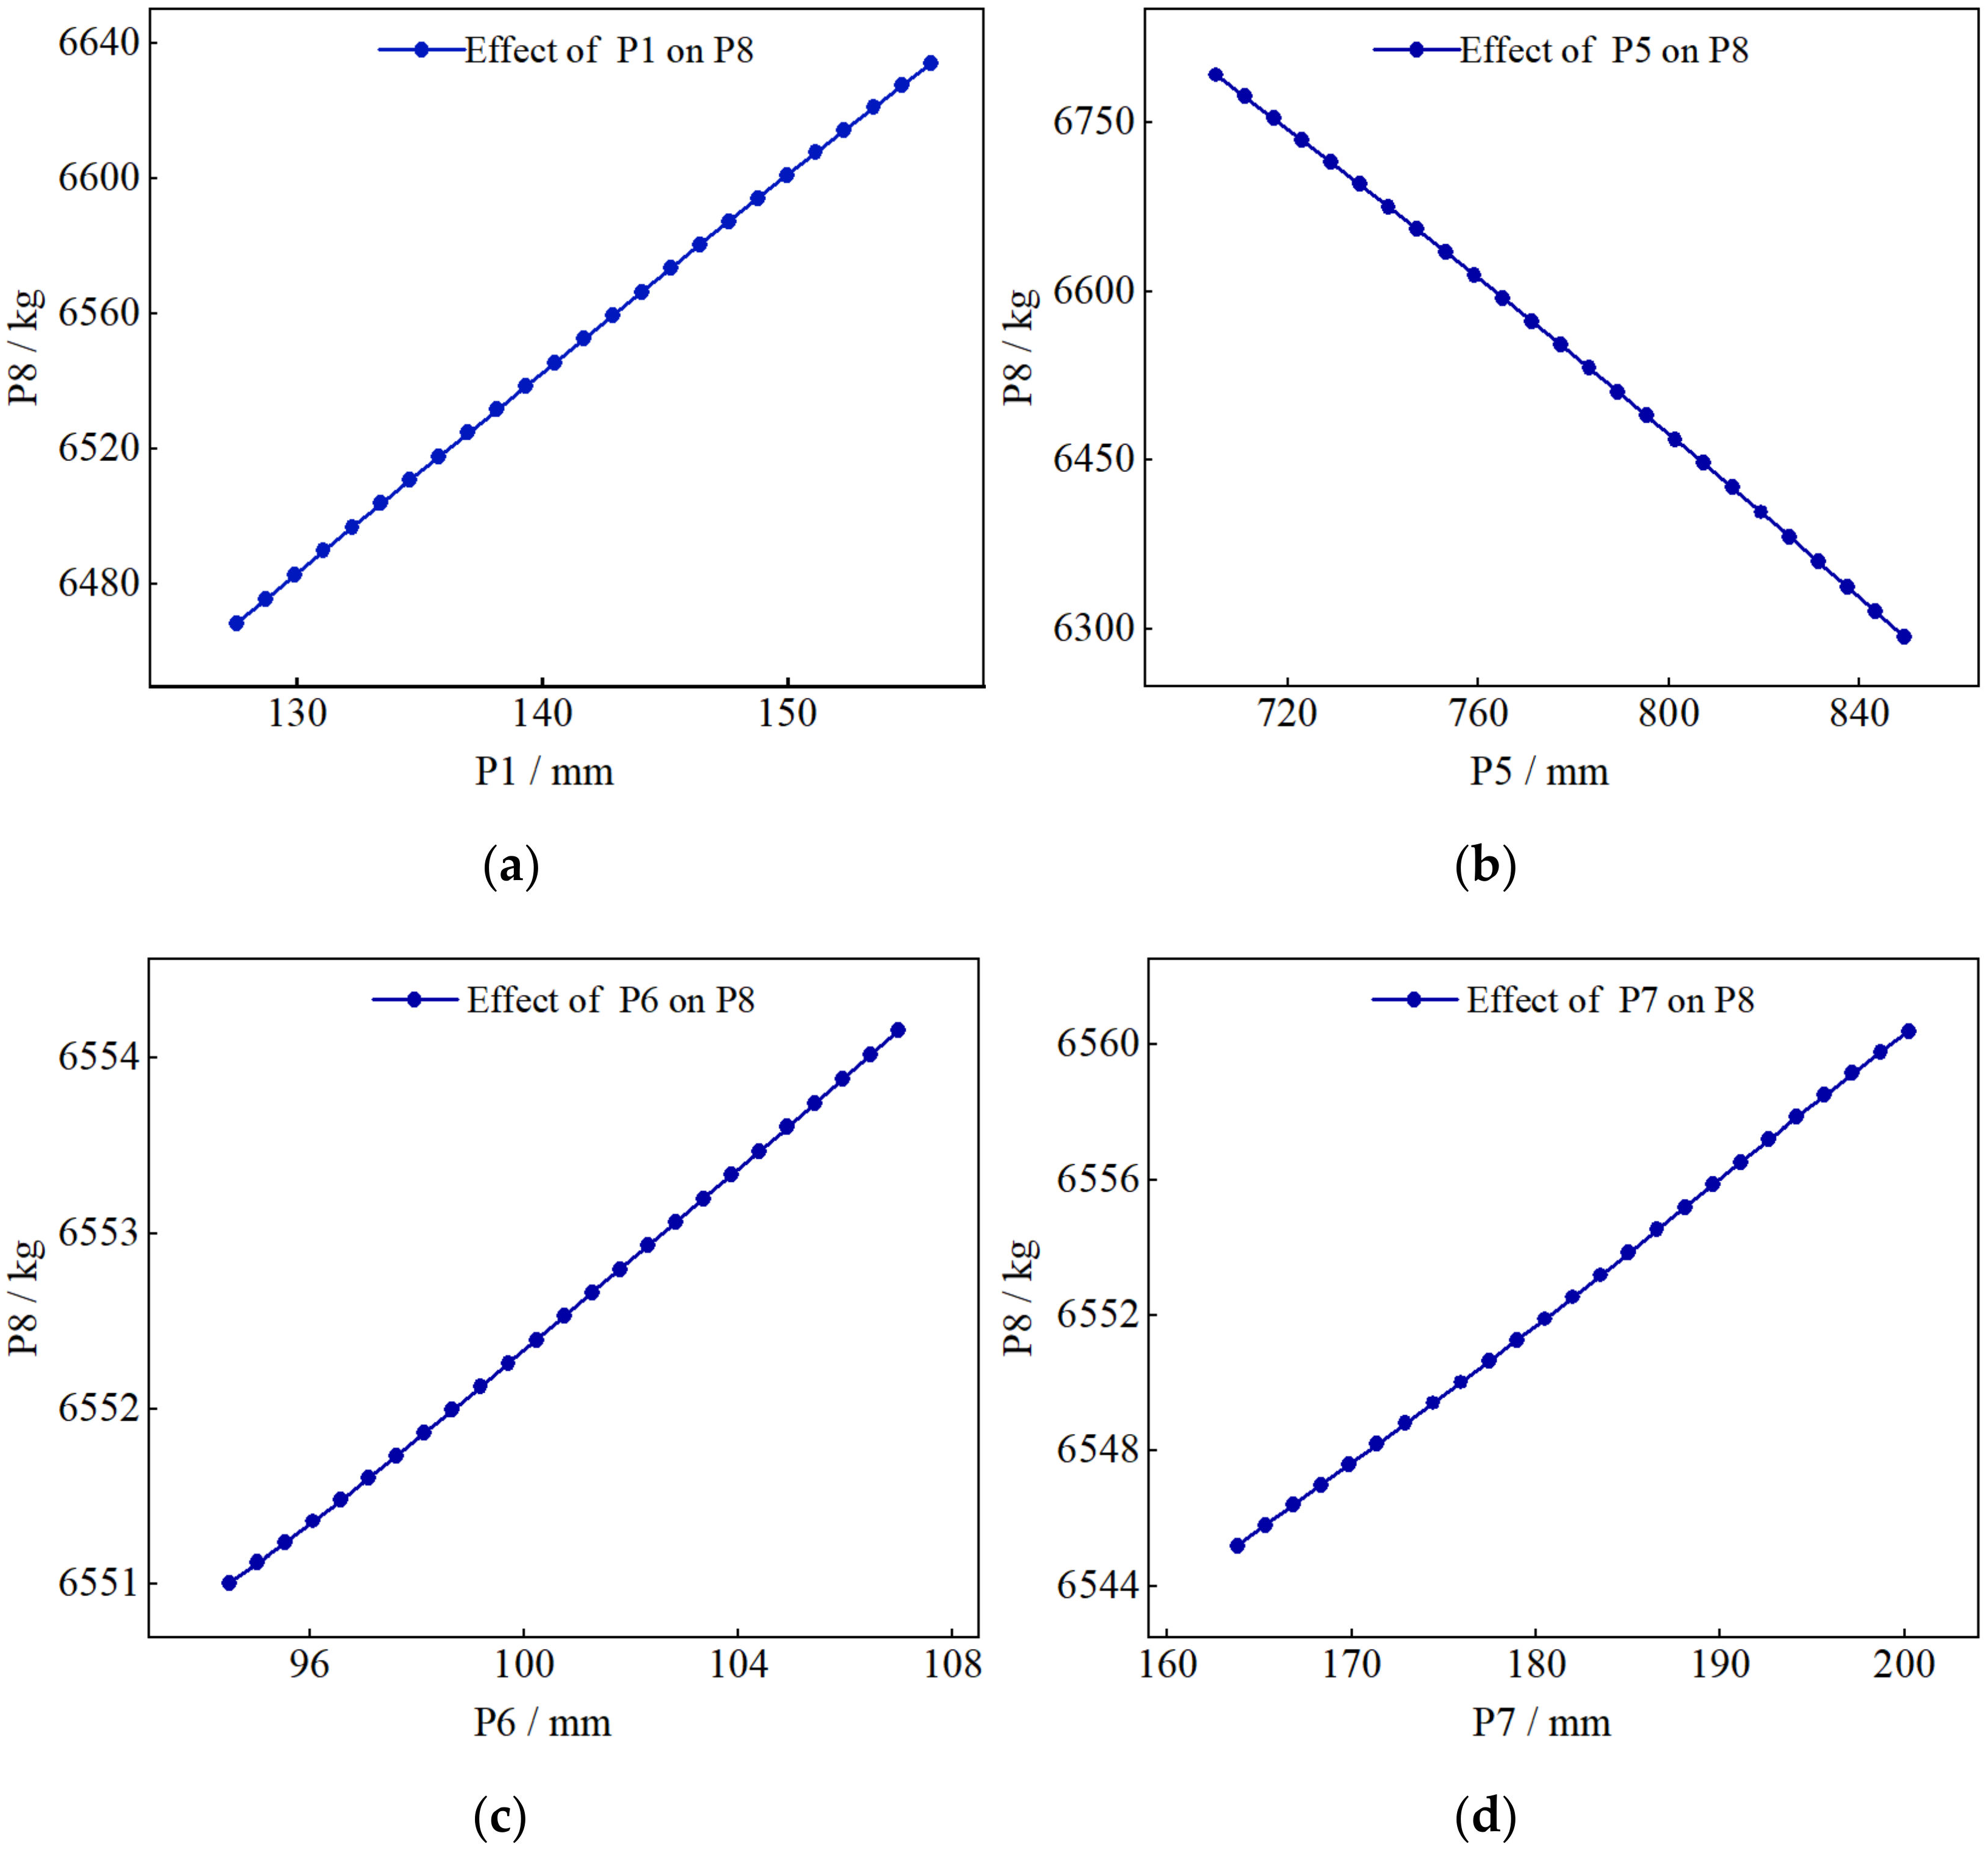
The relationship between the four input variables of the lower arm and the mass of the lower arm is shown in Figure 8.
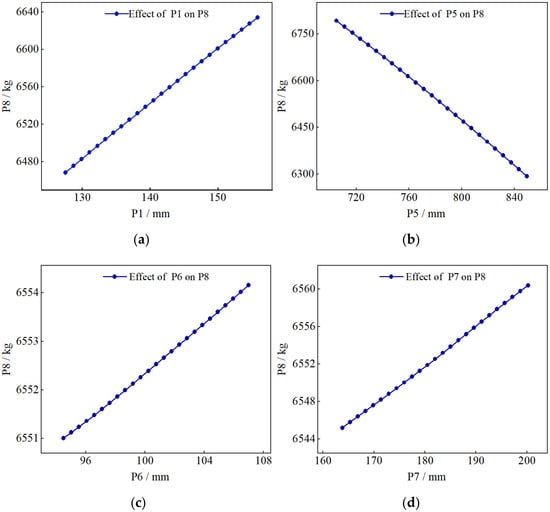
Figure 8.
Relationship between the mass of the lower rocker arm and the four input variables: (a) relationship curve between P8 and P1; (b) relationship curve between P8 and P5; (c) relationship curve between P8 and P6; (d) relationship curve between P8 and P7.
It can be seen from Figure 8 that P8 increases with the increase of input variables P1, P6 and P7, and decreases with the increase of input variable P5. The reason for this rule is that the wall thickness of the lower rocker arm decreases with the increase of P5. The thinner the wall thickness, the lighter the total mass of the lower rocker arm.
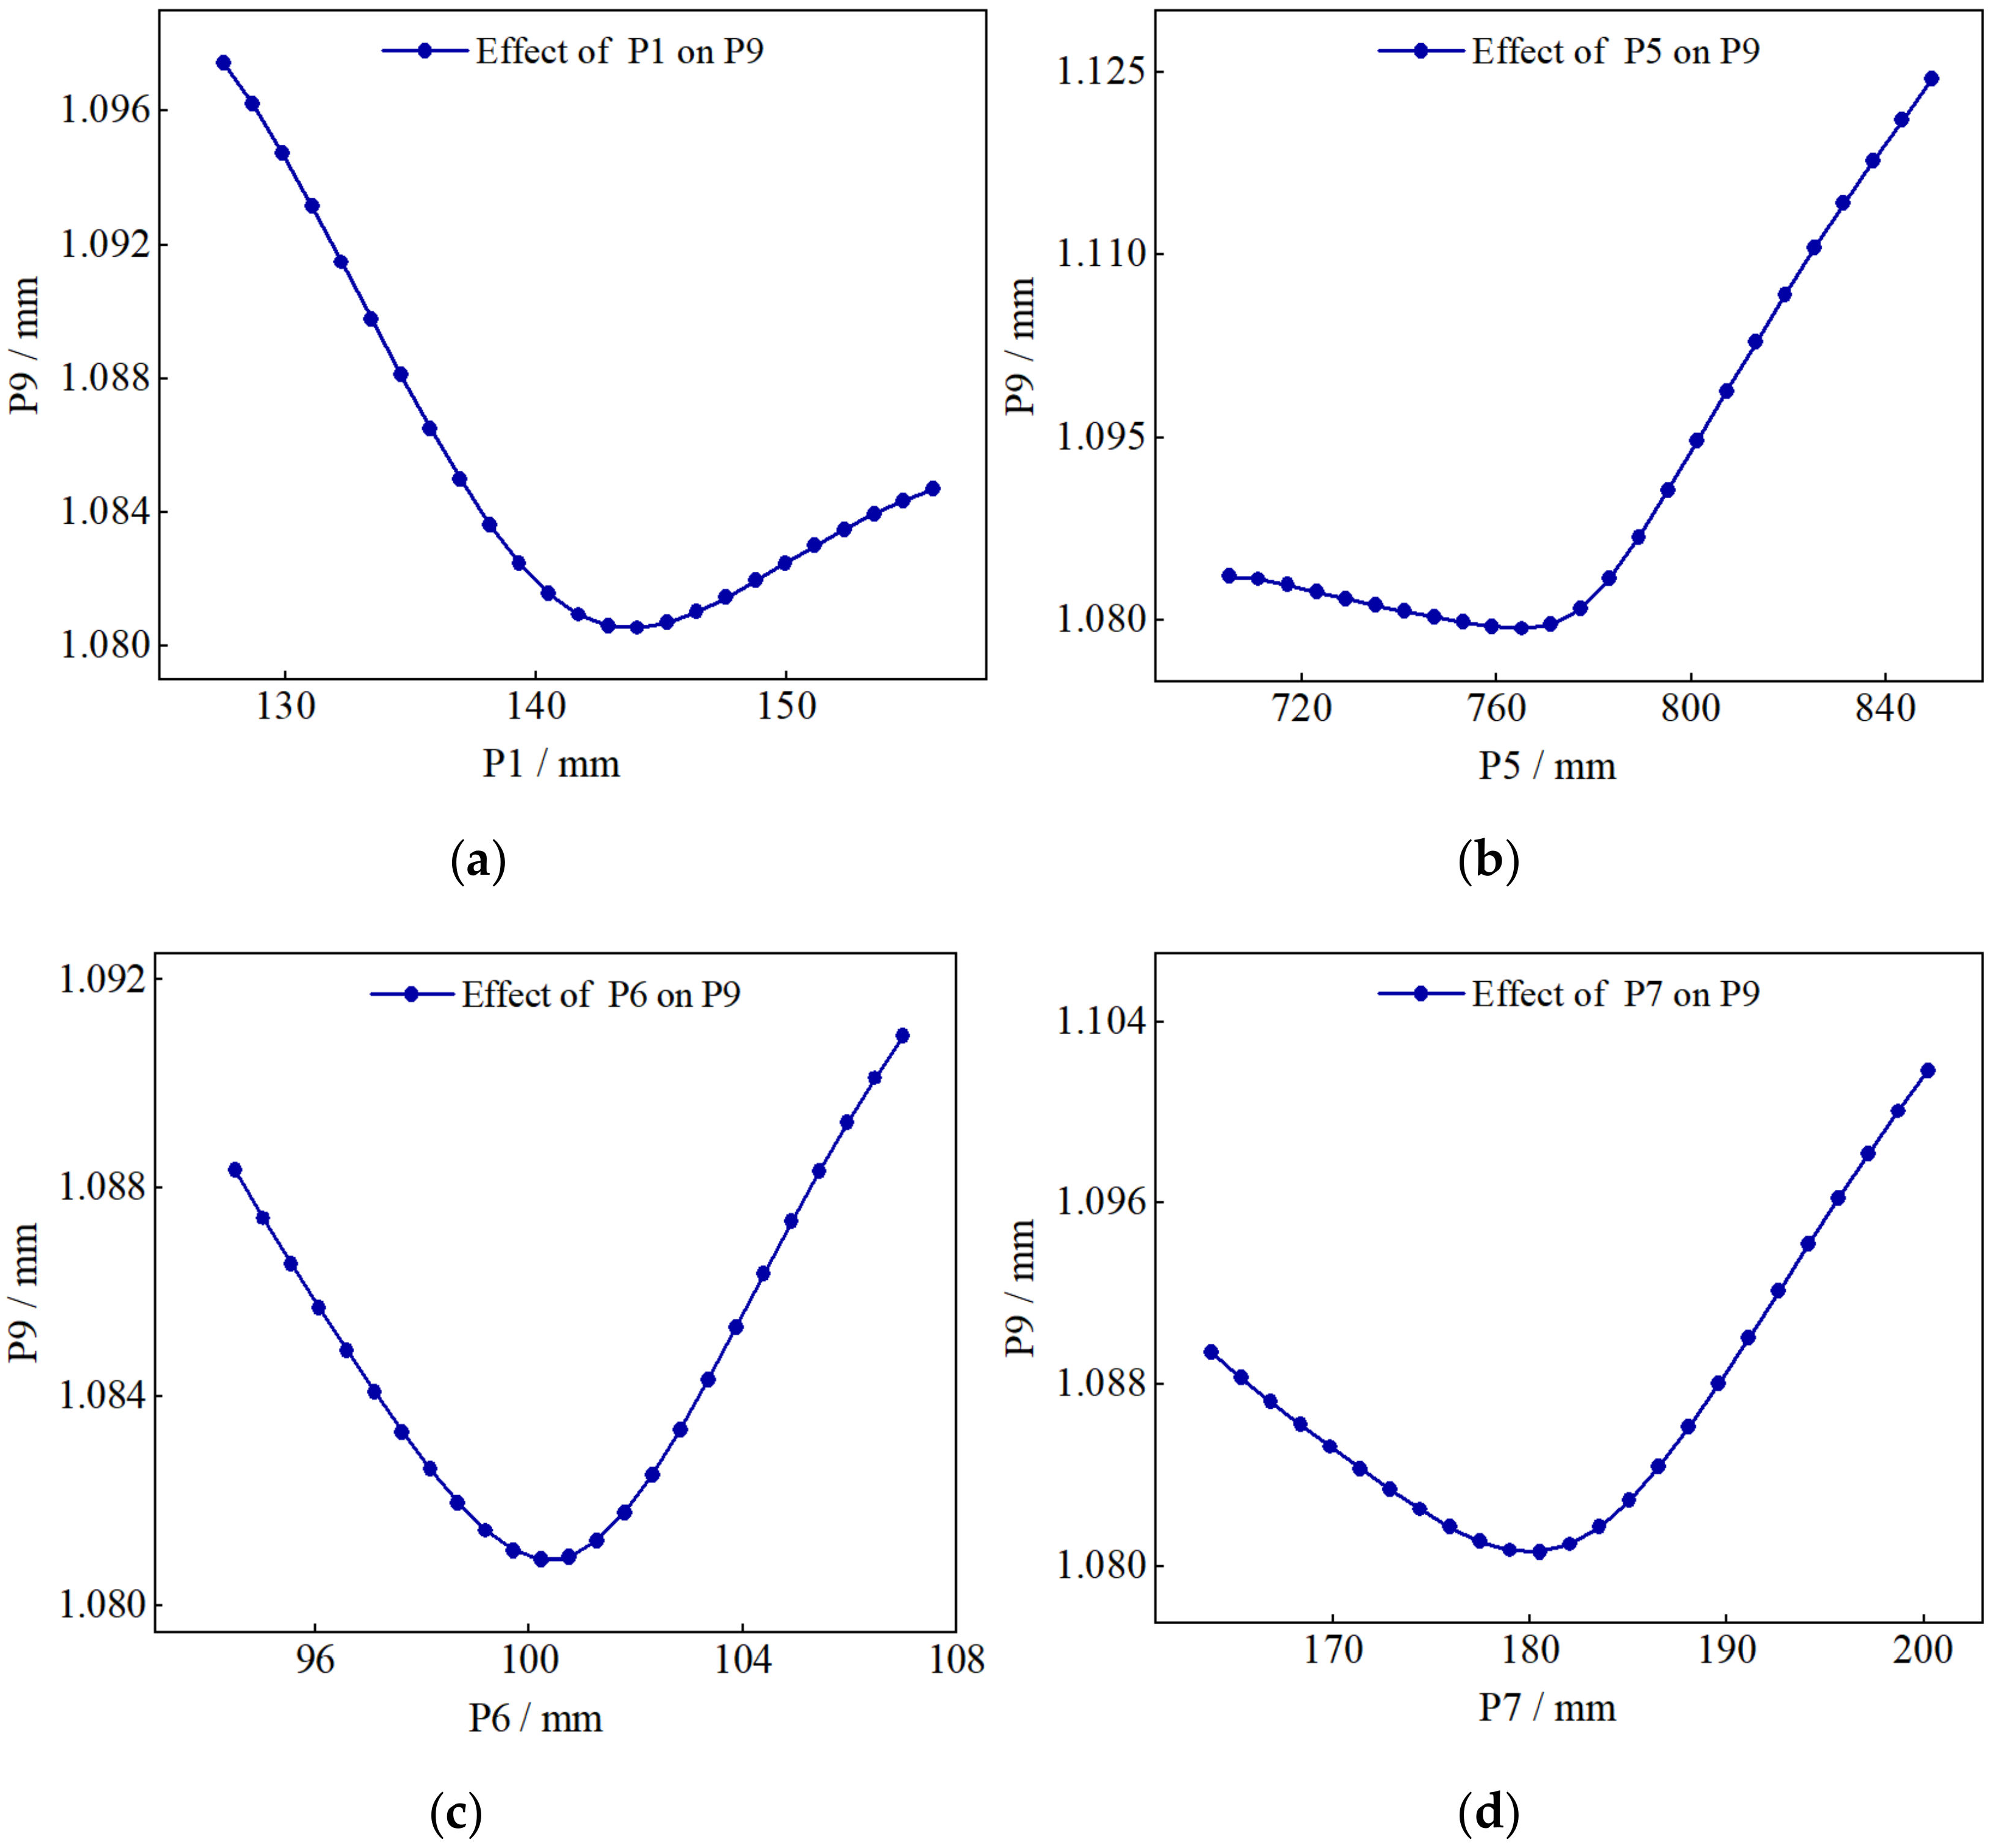
The curve relationship between the four input variables and the maximum displacement of the lower arm is shown in Figure 9.
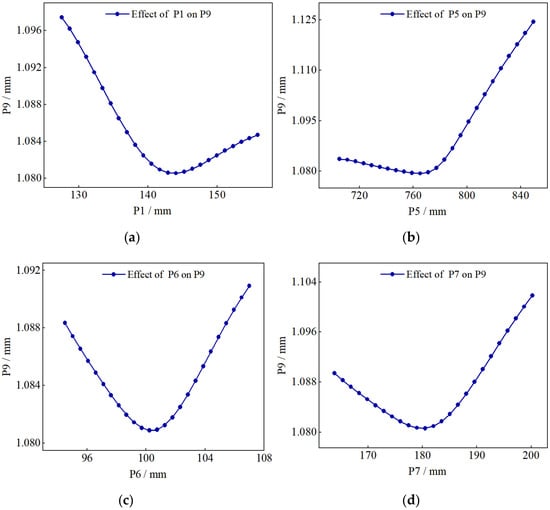
Figure 9.
Relationship between the maximum displacement of the lower rocker arm and four input variables: (a) relationship curve between P9 and P1; (b) relationship curve between P9 and P5; (c) relationship curve between P9 and P6; (d) relationship curve between P9 and P7.
In Figure 9, it can be observed that the input variables P1, P5, P6, P7 exert the same influence on P9, and they all first decrease and then increase. The lower arm displacement reaches the minimum value when the variables P1, P5, P6, P7 are 143 mm, 775 mm, 100 mm, and 180 mm, respectively.
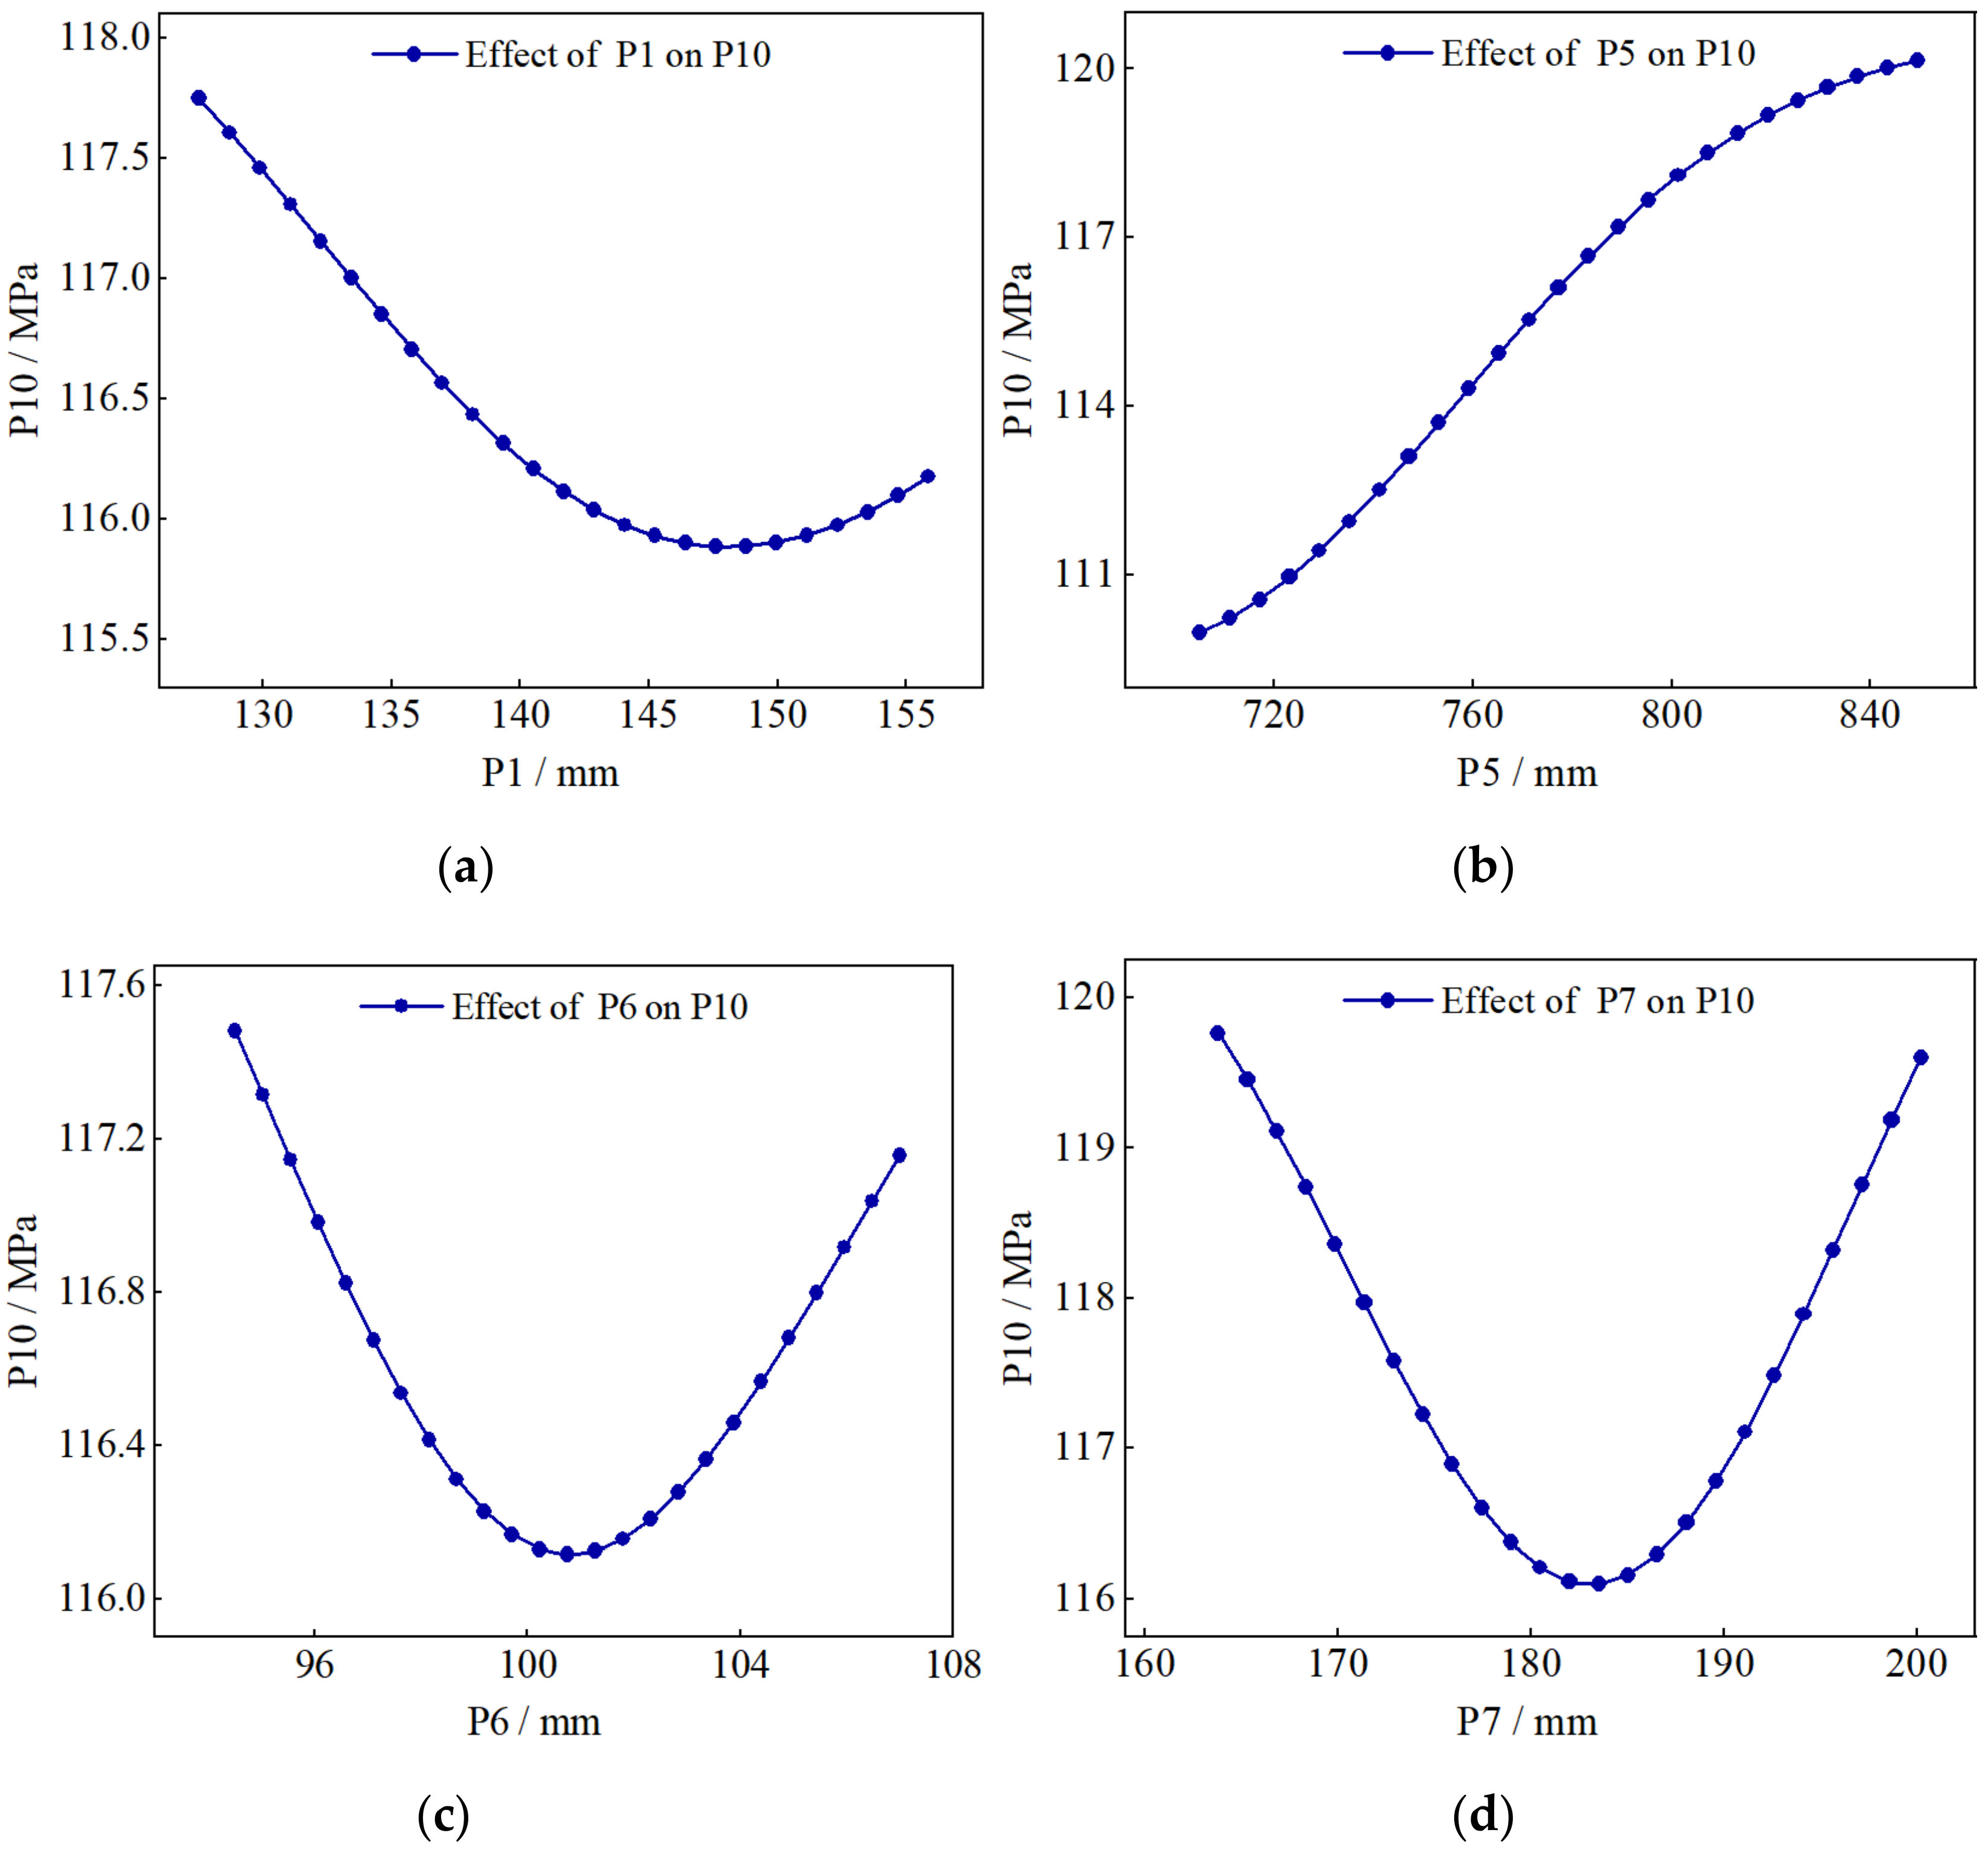
The relationship curve between the four input variables of the lower rocker arm and the maximum stress of the lower rocker arm is shown in Figure 10.
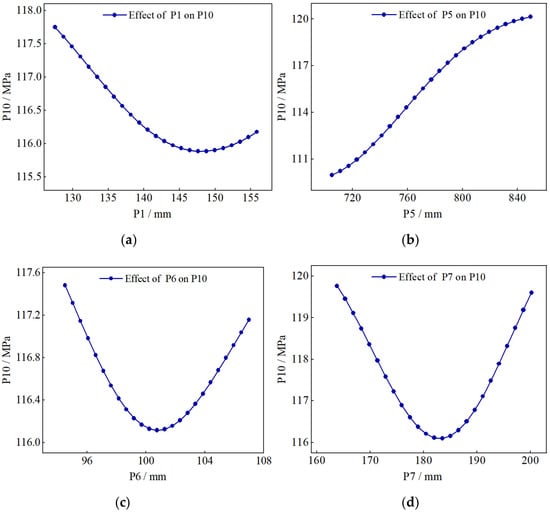
Figure 10.
Relationship between the maximum equivalent stress of the lower rocker arm and the four input variables: (a) relationship curve between P10 and P1; (b) relationship curve between P10 and P5; (c) relationship curve between P10 and P6; (d) relationship curve between P10 and P7.
It can be seen from Figure 10 that among the influence laws of four input variables on P10, there are approximate monotonic function curves and convex function curves. Among them, P10 is slightly affected by the input variables P1, P6 and P7, the range of change is about 1–3 MPa, while changes to the variable P5 have the greatest effect on P10; the range of changes is close to 10 MPa.
(2) Sensitivity analysis
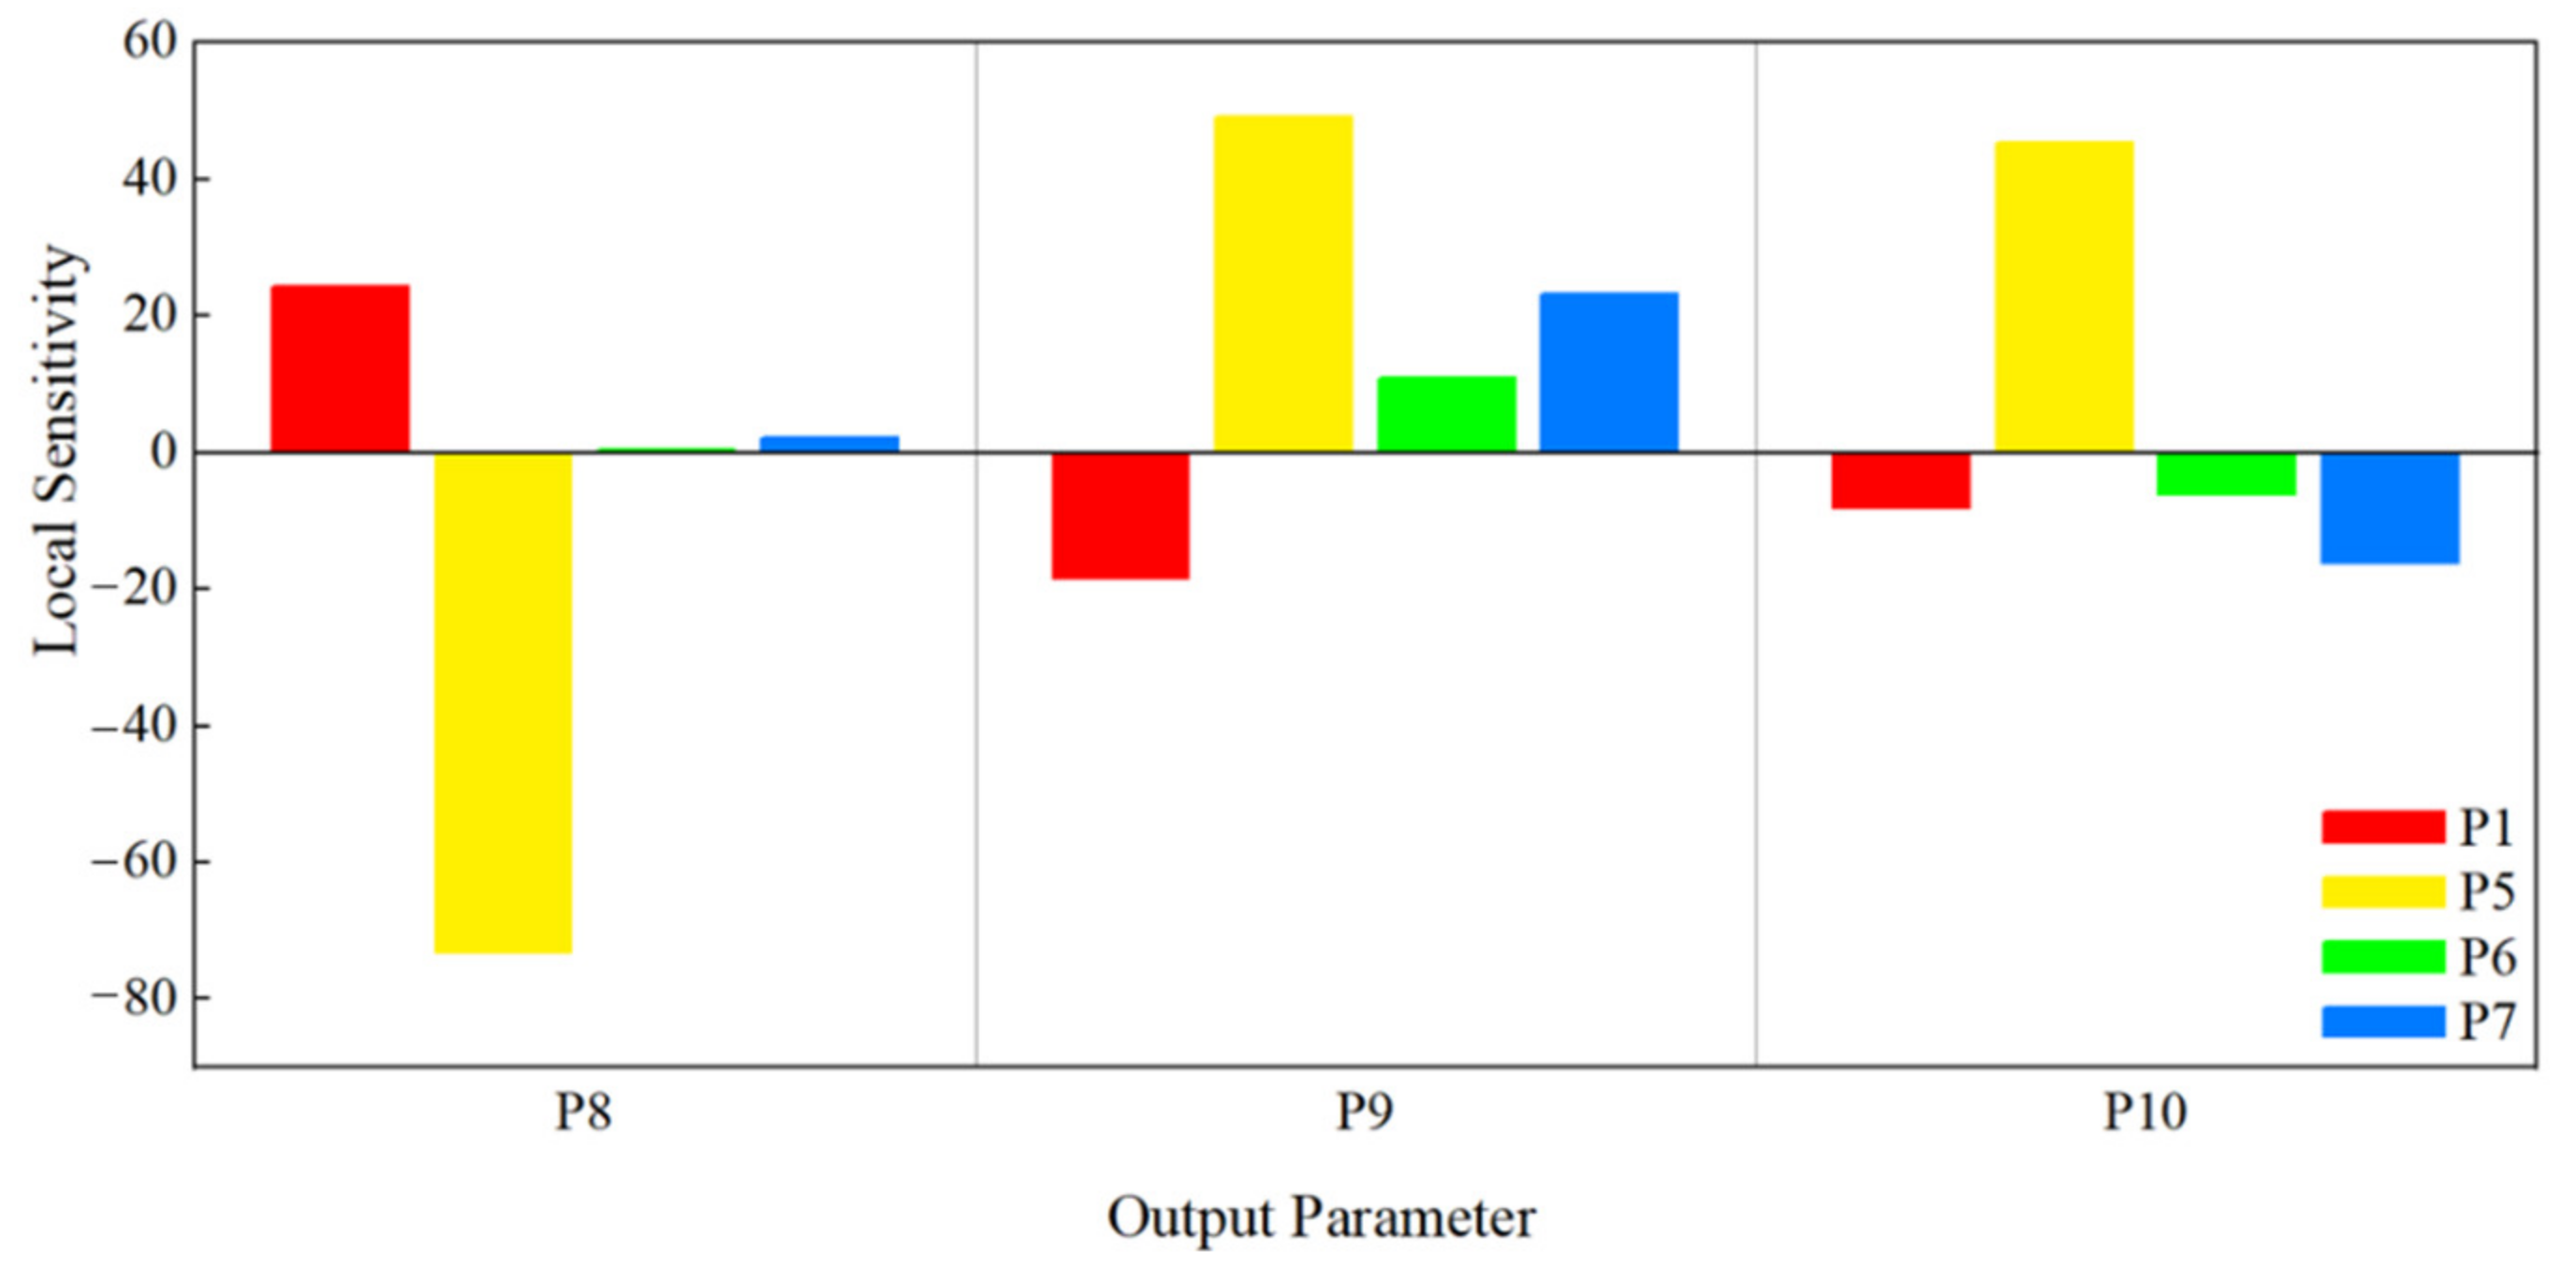
In order to fully understand the influence of the input variables on the mass, displacement, and equivalent stress of the lower rocker arm, the key factors affecting the objective function were found through the local sensitivity provided in Response Surface [18,19]. The results of the sensitivity analysis of each input variable for the objective function are shown in Figure 11.

Figure 11.
Sensitivity of the input variables to the mass (P8), maximum displacement (P9), and maximum equivalent stress (P10) of the lower arm.
As can be seen in the Figure 11, the input variable features a positive or negative sensitivity to the mass of the lower rocker. Parameter P5 exerts the greatest influence on the mass sensitivity of the lower arm and correlates negatively. Figure 11 further shows that the mass of the lower rocker decreases with the increase of variable P5, which can be used as the focus of weight reduction optimization for the lower arm. Parameters P5, P6, and P7 correlate positively with the sensitivity of the maximum displacement of the lower rocker arm, while P1 correlates negatively, and P6 exerts the least influence on the sensitivity of the maximum displacement of the lower rocker arm. Parameters P1, P6, and P7 are negatively correlated with the maximum stress sensitivity of the lower arm, while P5 correlates positively with the sensitivity of the maximum stress and has the greatest influence on the sensitivity of the maximum stress. Therefore, the maximum equivalent stress of the lower arm can be improved by changing the value of P5.
3.3. Selection of the Optimized Scheme
After fitting the response surface, the parameters were optimized using the optimization module. The Multi-Objective Genetic Algorithm (MOGA) method is a variant of the popular NSGA, which is suitable for calculating the global maximum or minimum [20,21]. We selected the MOGA in the response surface to optimize the parameter model of the lower rocker arm. Finally, the minimum mass of the lower rocker arm was set as the goal of this optimization design; the maximum stress of the lower rocker arm was less than 192.8 MPa and the maximum displacement was less than 1.5 mm. These were set as the constraints of this optimization design. The initial sample number was set to 100 groups and 70 samples were iterated each time to improve the accuracy of the optimization model. When solving, the maximum number of iterations was 20, and finally three groups of the best candidate points were set to output. The three groups of optimal design points obtained from the optimized response surface model are shown in Table 3.
Table 3.
Three groups of optimal design points after optimization of the lower rocker arm.
The rounded values of the input variables in the first group were selected as the actual dimensions for the lower arm optimization, as shown in Table 4.
Table 4.
Size parameters of the optimized lower rocker arm.
It is clear, from Table 3, that the optimized P5 increased while the other input variables decreased. After optimization, the mass of the lower rocker arm was reduced from the original 6552.5 kg to 6206.2 kg; the mass decreased by 346.3 kg, and the reduction was of approximately 5.29%.
3.4. Comparison of Results before and after Optimization
In order to accurately compare the static analysis results of the lower rocker arm before and after optimization, the mesh division, material selection, and boundary condition addition must be consistent with the original model. According to the actual optimized values, the size of the initial model was modified, and the static analysis was carried out. The comparison of the results before and after optimization is shown in Table 5.
Table 5.
Comparison of response surface optimization results.
(1) Strength comparison before and after optimization of lower rocker arm
Figure 12 shows the equivalent stress distributions of the lower rocker arm before and after optimization. It can be seen from the diagram that the position of maximum equivalent stress did not change before and after optimization, which occurred at the transition between the front end of the lower rocker arm casting and the web welding. The maximum equivalent stress of the lower rocker arm was 116.29 MPa before optimization, and the maximum equivalent stress after optimization was 119.18 MPa. It was observed that the maximum equivalent stress value increased slightly, but both of them were lower than the allowable stress value of the material (198.2 MPa); its strength meets the design requirements.
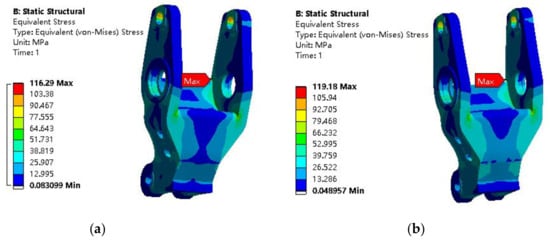
Figure 12.
Equivalent stress distributions of the lower rocker arm before and after optimization: (a) equivalent stress distribution before lower rocker arm optimization; (b) equivalent stress distribution after lower rocker arm optimization.
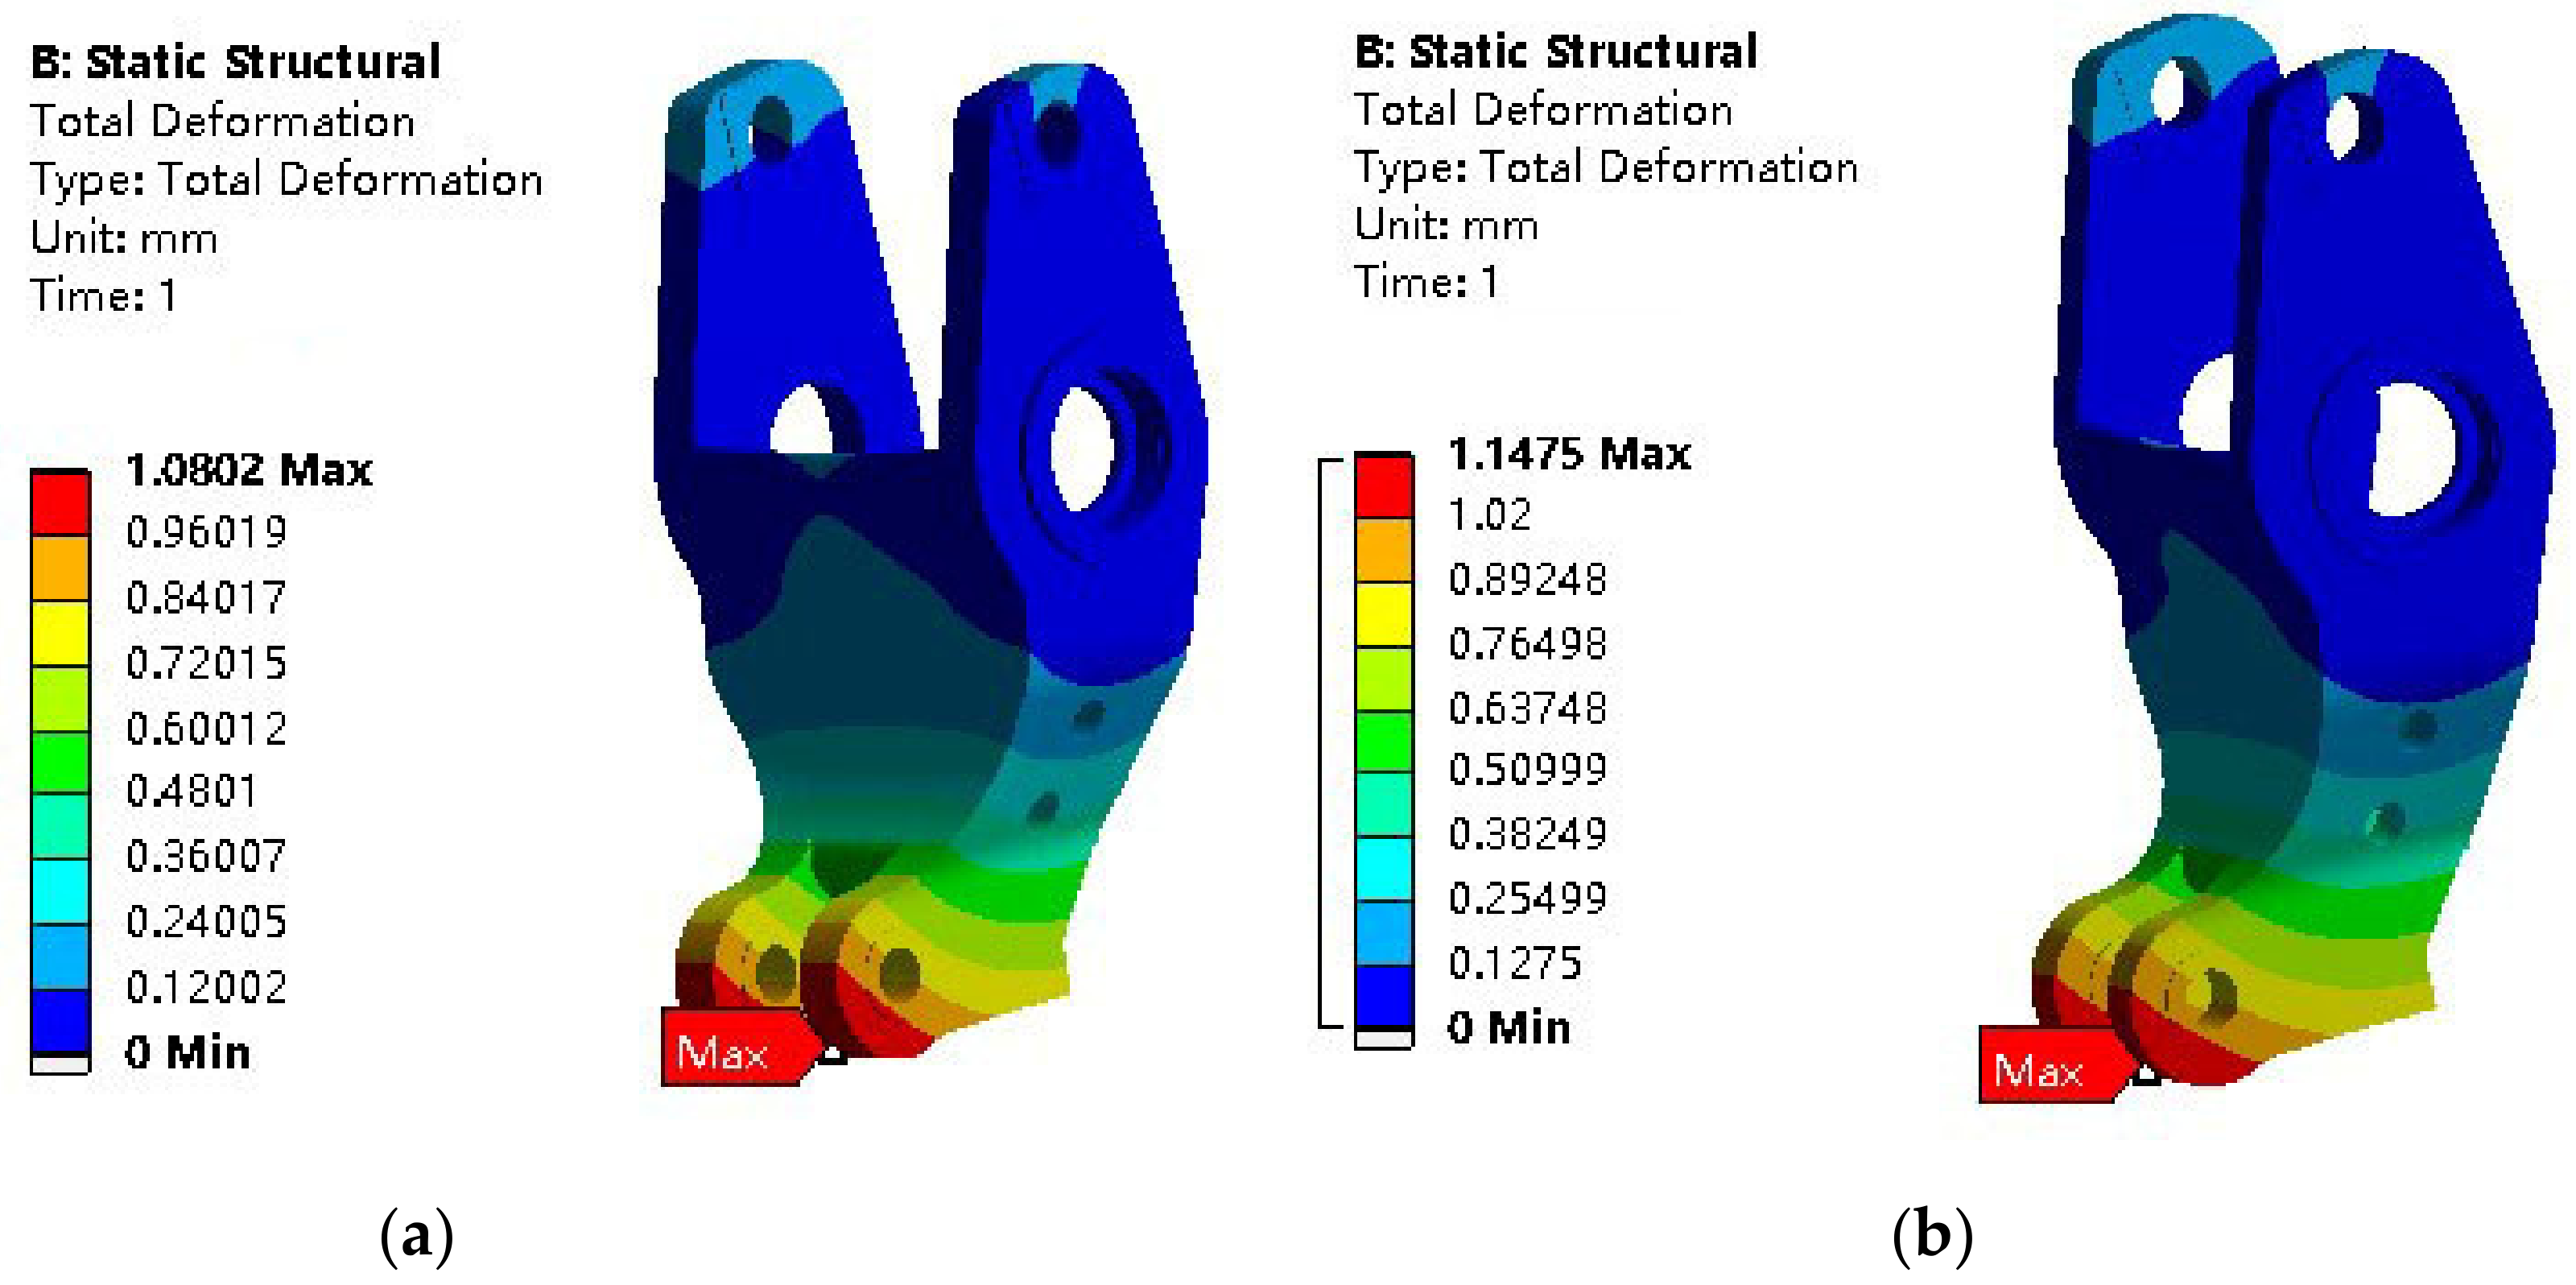
(2) Comparison of total deformation before and after optimization of the lower rocker arm
Figure 13 depicts the displacement distribution before and after the lower rocker arm optimization, respectively. As demonstrated in Figure 13a,b, the maximum displacement in both occurs at the pull ring, which is at the tail of the lower rocker arm, and the optimized displacement value increases. The optimized displacement value increased to 1.147 mm, which is less than the set allowable displacement of 1.5 mm. It can therefore be concluded that its deformation meets the design requirements.

Figure 13.
Displacement distribution before and after the lower rocker arm optimization: (a) displacement distribution before the lower rocker arm optimization; (b) displacement distribution after the lower rocker arm optimization.
4. Conclusions
(1) The static analysis of the lower rocker arm was carried out by using ANSYS Workbench. The results show that the maximum equivalent stress occurred at the transition between the casting at the front end of the lower rocker arm and the web welding, and the maximum displacement occurred at the pull ring at the tail of the lower rocker arm. The maximum equivalent stress and maximum displacement meet the design requirements. Furthermore, the stress distribution of the lower rocker arm was small, which means that the strength margin was large and that, consequently, there is space for lightweight design.
(2) Taking the minimum mass of the lower rocker arm as the optimization objective, the structural size of the internal cavity as the input variable, and the maximum equivalent stress and maximum displacement as less than the allowable value as the constraint condition, the mathematical model of the optimization design was established (Formula (10)).
(3) Combined with the response surface optimization module and multi-objective genetic algorithm in the workbench, the structural size of the internal cavity of the lower rocker arm was optimized. The first group of data in the three groups of optimal parameter combinations was selected as the optimization design point, and static analysis was carried out (Table 3). The results show that in order to meet the strength and deformation requirements, the mass of the optimized lower rocker arm was reduced from the original 6552.5 kg to 6206.2 kg, and the optimization goal of reducing the mass by 5.29% was achieved. The structural optimization method of the lower rocker arm can provide a reference for the structural optimization of other mechanical devices with complex geometry and bearing complex loads.
Author Contributions
Conceptualization, W.W. and J.S.; methodology, W.W. and H.Y.; software, J.S. and H.Y.; validation, B.C.; formal analysis, B.C.; investigation, J.S. and W.W.; resources, Y.W.; data curation, H.Y.; writing—original draft preparation, J.S. and H.Y. and W.W.; writing—review and editing, W.W.; visualization, B.C.; supervision, W.W.; project administration, W.W. and Y.W.; funding acquisition, W.W. All authors have read and agreed to the published version of the manuscript.
Funding
This research was financially supported by the Jiangsu Key Laboratory of Precision and Micro-Manufacturing Technology (2019), the Jiangsu “Six Talent Peak” Project (JXQC-022), and the Jiangsu University Students’ Practice Innovative Training Project (202010298054Z).
Institutional Review Board Statement
Not applicable.
Informed Consent Statement
Not applicable.
Data Availability Statement
The data presented in this study are available on request from the corresponding author.
Conflicts of Interest
The authors declare no conflict of interest.
References
- Schaefer, H.U. Loesche vertical roller mills for the comminution of ores and minerals. Miner. Eng. 2001, 14, 1155–1160. [Google Scholar] [CrossRef]
- Altun, D.; Benzer, H.; Aydogan, N.; Gerold, C. Operational parameters affecting the vertical roller mill performance. Miner. Eng. 2017, 103, 67–71. [Google Scholar] [CrossRef]
- Tontu, M. An investigation of performance characteristics and energetic efficiency of vertical roller coal mill. Int. J. COAL Prep. Util. 2021, 41, 248–262. [Google Scholar] [CrossRef]
- Wei, W.; Peng, Y.; Du, L.; Li, Y.; Cai, Y.; Chen, Z. Finite element analysis of the rolling ring and riding wheel for cement rotary kiln. UPB Sci. Bull. Ser. D Mech. Eng. 2019, 81, 253–266. [Google Scholar]
- Li, C.; Wang, Y.; Chen, J.; You, J.; Rajnathsing, H. Fault diagnosis in a gyroscope-based six-axis accelerometer. Trans. FAMENA 2018, 42, 103–114. [Google Scholar] [CrossRef]
- Wei, W.; Zhu, H.; Li, Y.; Jin, P. Finite element analysis of the vertical roller mill based on ANSYS Workbench. Int. J. Eng. Syst. Model. Simul. 2019, 11, 102–111. [Google Scholar] [CrossRef]
- Chen, J.; Jiang, H.; Fu, Y.; Qian, N. Heat Transfer Performance of an Axially Rotating Heat Pipe for Cooling of Grinding. Energy 2020, 13, 5745. [Google Scholar] [CrossRef]
- Zhang, Z.; Ibhadode, O.; Ali, U.; Dibia, C.F.; Rahnama, P.; Bonakdar, A.; Toyserkani, E. Topology optimization parallel-computing framework based on the inherent strain method for support structure design in laser powder-bed fusion additive manufacturing. Int. J. Mech. Mater. Des. 2020, 16, 897–923. [Google Scholar] [CrossRef]
- Zhang, Q.; Zhang, R.; Jin, M. Experimental study of ZG 270–500 material characteristics under strain control modes. J. Yanshan Univ. 2019, 43, 449–454. (In Chinese) [Google Scholar] [CrossRef]
- Xu, X.; Quan, L.; Li, B.; Guo, J. Modeling, Simulation and Experiment of Electro-hydraulic Screw Down Servo System of Seamless Tube Rolling Mill. Chin. J. Mech. Eng. 2011, 24, 113–120. [Google Scholar] [CrossRef]
- Heidari, A.; Forouzan, M.R.; Akbarzadeh, S. Effect of Friction on Tandem Cold Rolling Mills Chattering. ISIJ Int. 2014, 54, 2349–2356. [Google Scholar] [CrossRef] [Green Version]
- Zhao, D. Finite Element Analysis on Rocker Arms of Vertical Roller Mill. Sci. Technol. Rev. 2013, 31, 53–56. [Google Scholar] [CrossRef]
- Hoon, H.; Ho, K.S. Optimum Process Design in Sheet-Metal Forming with Finite Element Analysis. J. Eng. Mater. Technol. 2001, 123, 476–481. [Google Scholar] [CrossRef]
- Feng, R.; Wang, T.; Dai, S.; Chen, Y.; Qiu, L. Comparison of Four Methods on Optimizing Conditions by Using the Central Composite Design. Chin. J. Health Stat. 2014, 31, 387–389. (In Chinese) [Google Scholar]
- Kitayama, S.; Yamazaki, K. Sequential approximate robust design optimization using radial basis function network. Int. J. Mech. Mater. Des. 2014, 10, 313–328. [Google Scholar] [CrossRef]
- Ismail, A.Y.; Na, G.; Koo, B. Topology and Response Surface Optimization of a Bicycle Crank Arm with Multiple Load Cases. Appl. Sci. 2020, 10, 2201. [Google Scholar] [CrossRef] [Green Version]
- Huang, Y.; Hsieh, C. Influence analysis in response surface methodology. J. Stat. Plan. Inference 2014, 147, 188–203. [Google Scholar] [CrossRef]
- Serageldin, A.A.; Radwan, A.; Katsura, T.; Sakata, Y.; Nagasaka, S.; Nagano, K. Parametric analysis, response surface, sensitivity analysis, and optimization of a novel spiral-double ground heat exchanger. Energy Convers. Manag. 2021, 240, 114251. [Google Scholar] [CrossRef]
- Lee, D.; Lee, J. Structural optimization concept for the design of an aluminium control arm. Proc. Inst. Mech. Eng. Part D J. Automob. Eng. 2003, 217, 647–656. [Google Scholar] [CrossRef]
- Meziane-Tani, I.; Métris, G.; Lion, G.; Deschamps, A.; Bendimerad, F.T.; Bekhti, M. Optimization of small satellite constellation design for continuous mutual regional coverage with multi-objective genetic algorithm. Int. J. Comput. Intell. Syst. 2016, 9, 627–637. [Google Scholar] [CrossRef] [Green Version]
- Balaguru, S.; Natarajan, E.; Ramesh, S.; Muthuvijayan, B. Structural and modal Analysis of Scooter Frame for Design Improvement. Mater. Today Proc. 2019, 16, 1106–1116. [Google Scholar] [CrossRef]


Publisher’s Note: MDPI stays neutral with regard to jurisdictional claims in published maps and institutional affiliations. |
© 2021 by the authors. Licensee MDPI, Basel, Switzerland. This article is an open access article distributed under the terms and conditions of the Creative Commons Attribution (CC BY) license (https://creativecommons.org/licenses/by/4.0/).