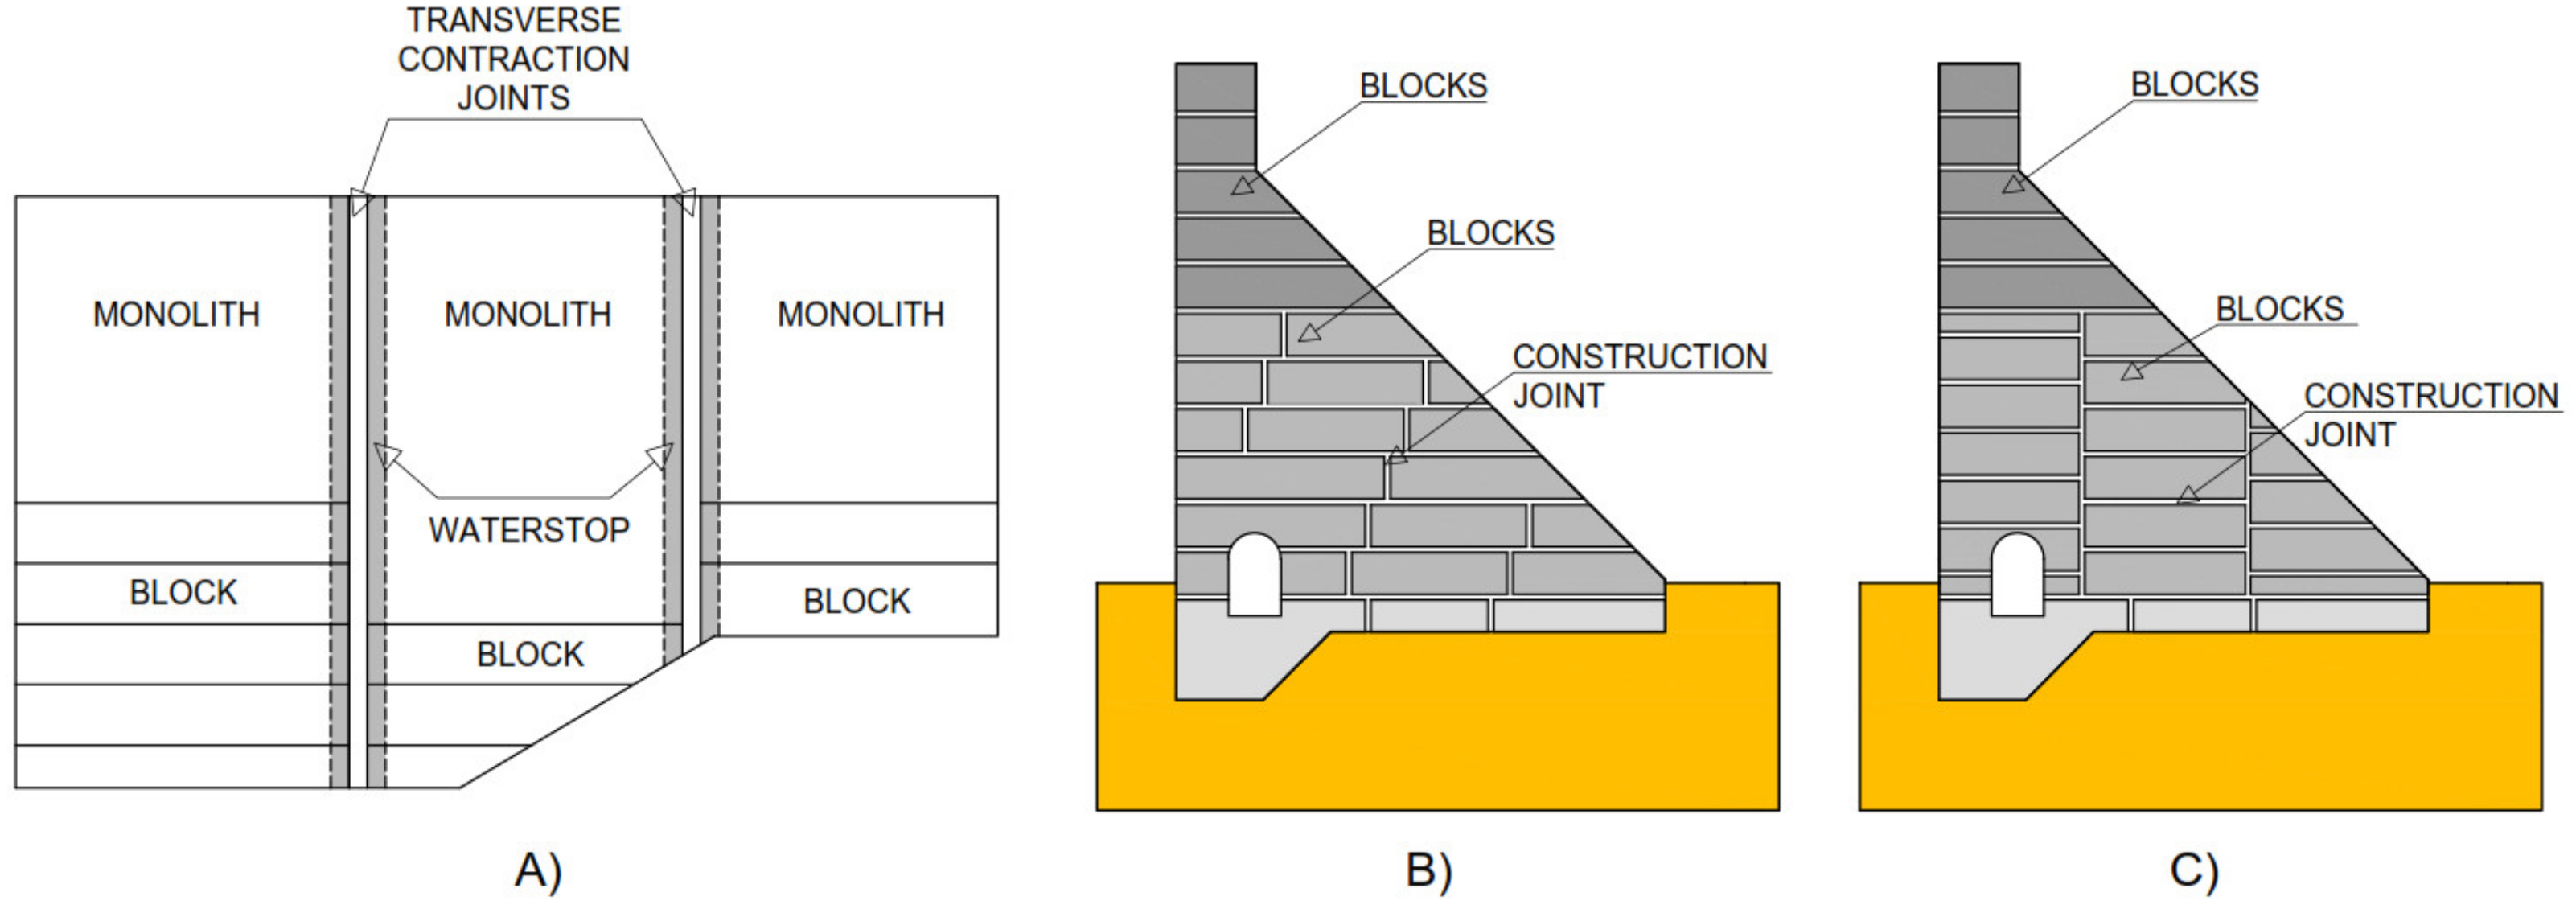
Figure 1.
Waterstops, blocks, and joints of a concrete gravity dam: (A) waterstops between adjacent monoliths; (B) combination of long blocks and staggered joints; (C) combination of long blocks and vertical joints.
Figure 1.
Waterstops, blocks, and joints of a concrete gravity dam: (A) waterstops between adjacent monoliths; (B) combination of long blocks and staggered joints; (C) combination of long blocks and vertical joints.
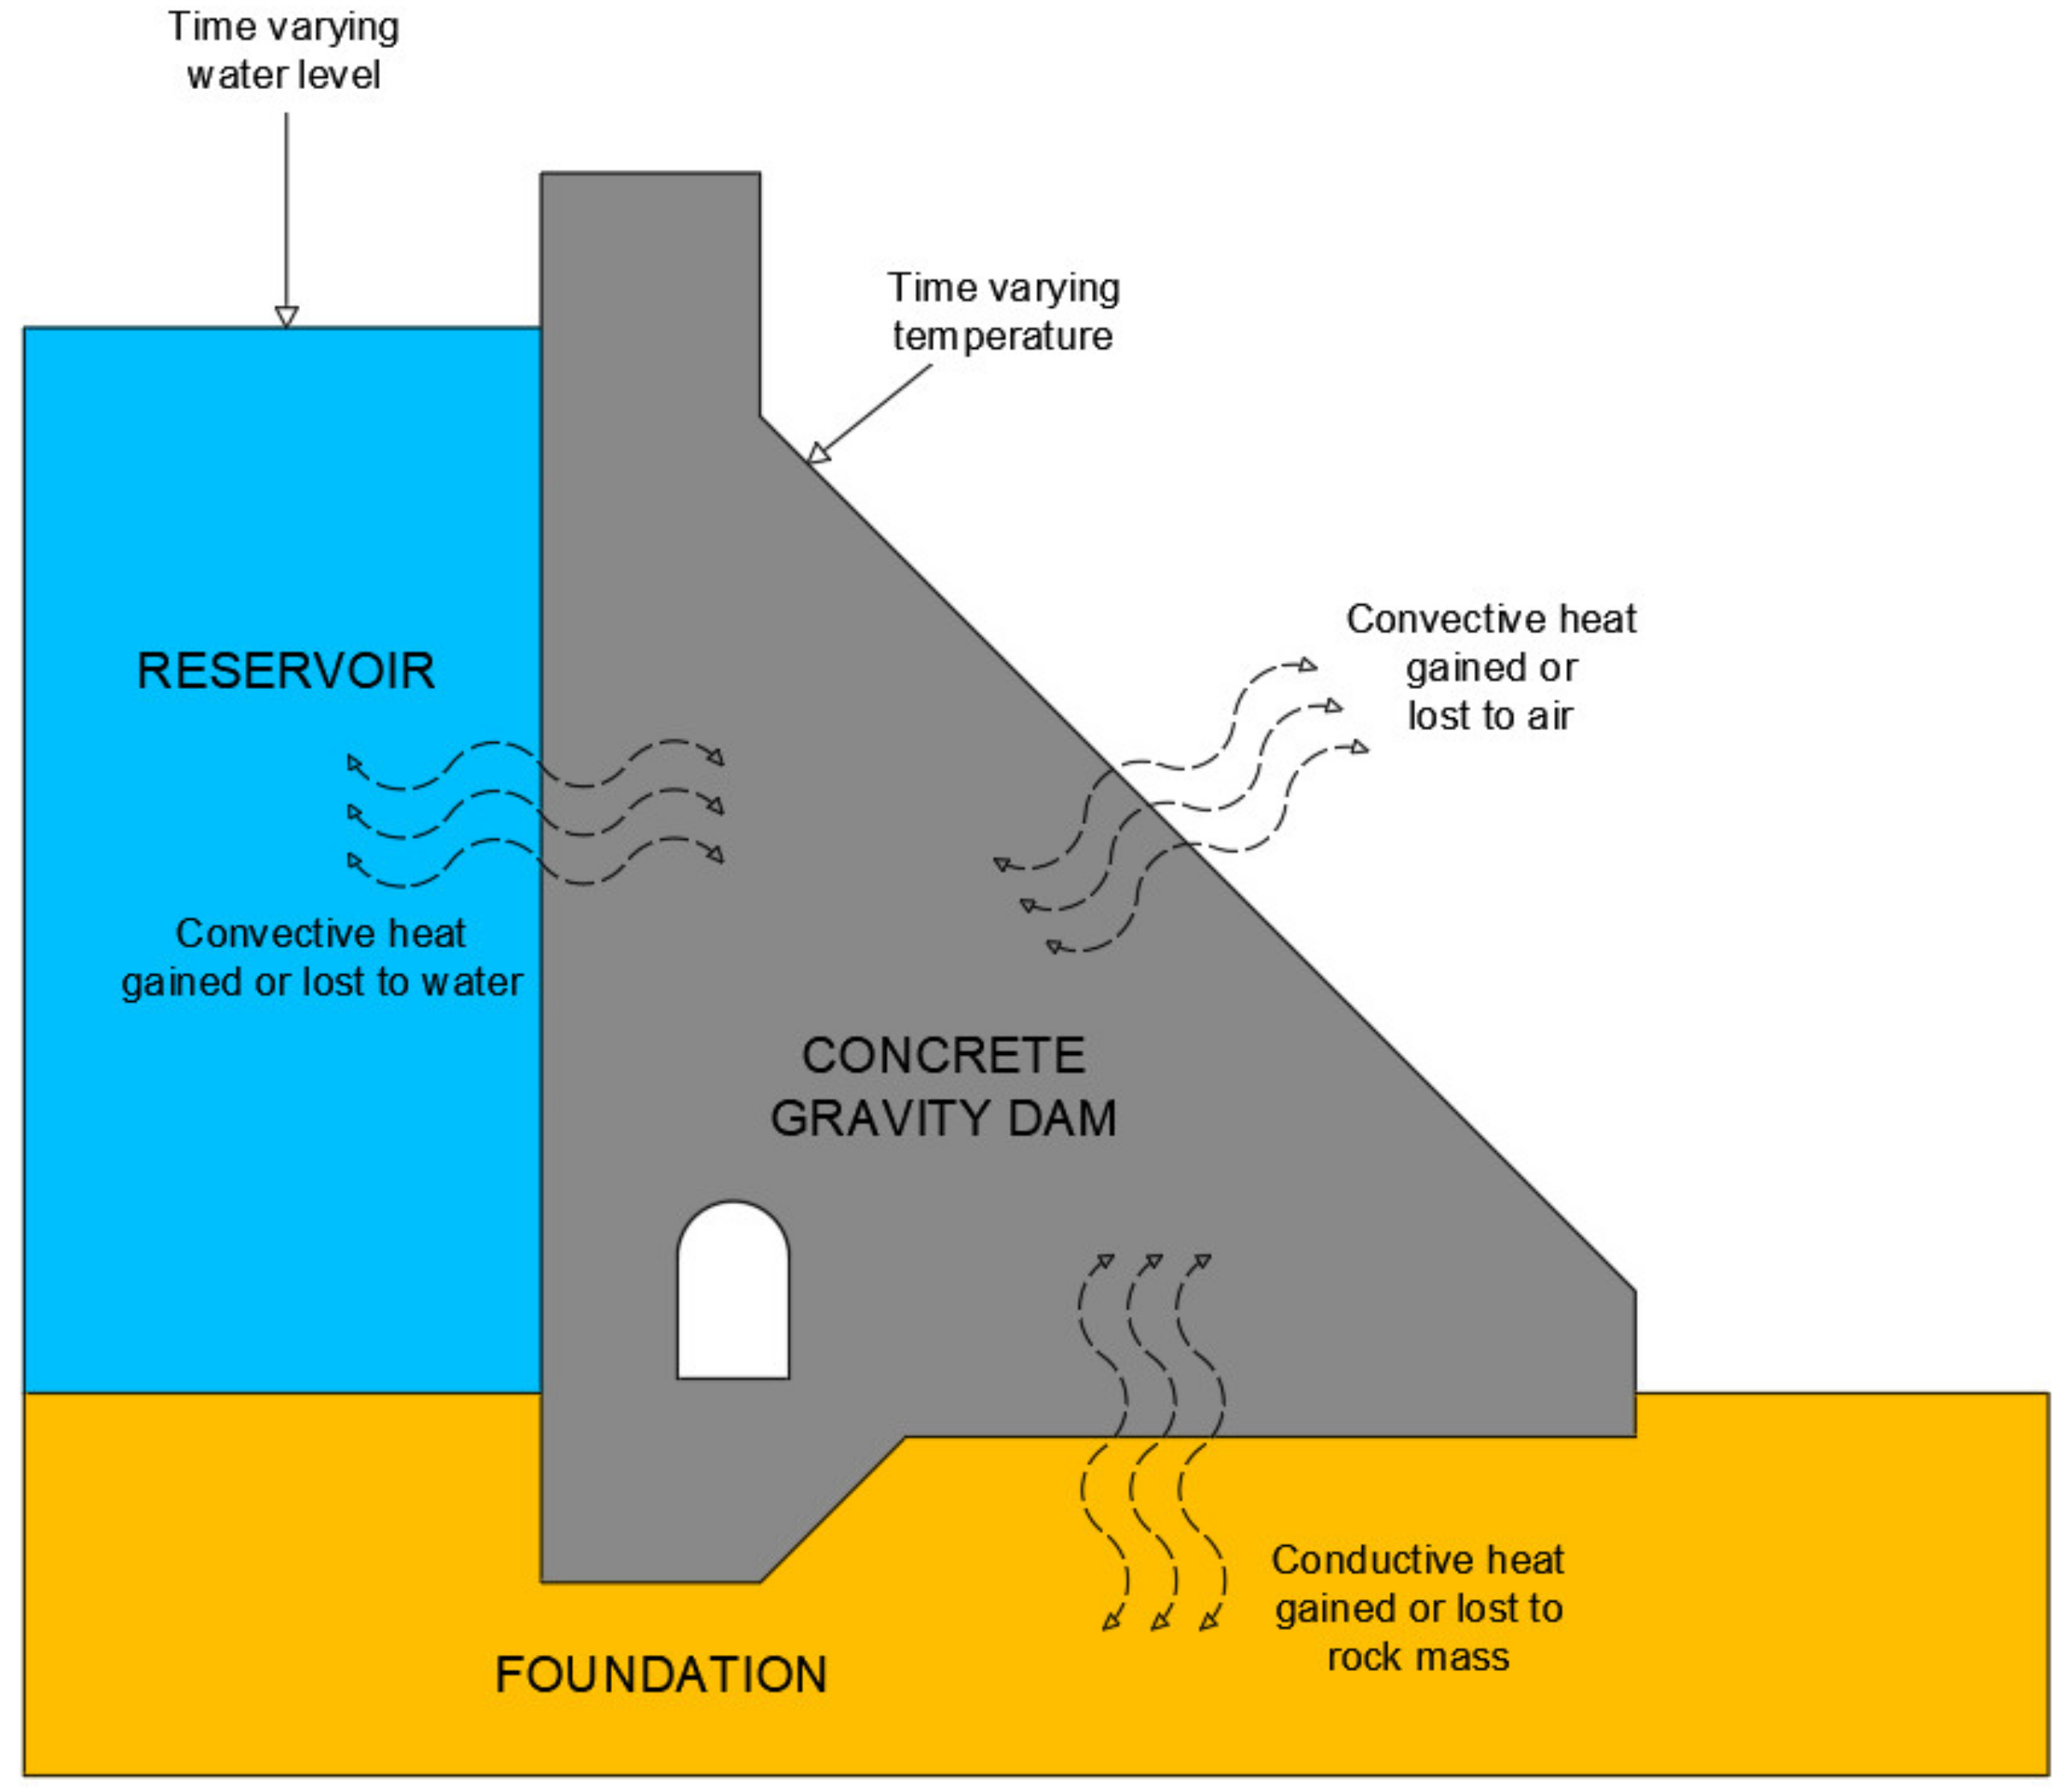
Figure 2.
Heat transfer processes represented in this paper.
Figure 2.
Heat transfer processes represented in this paper.
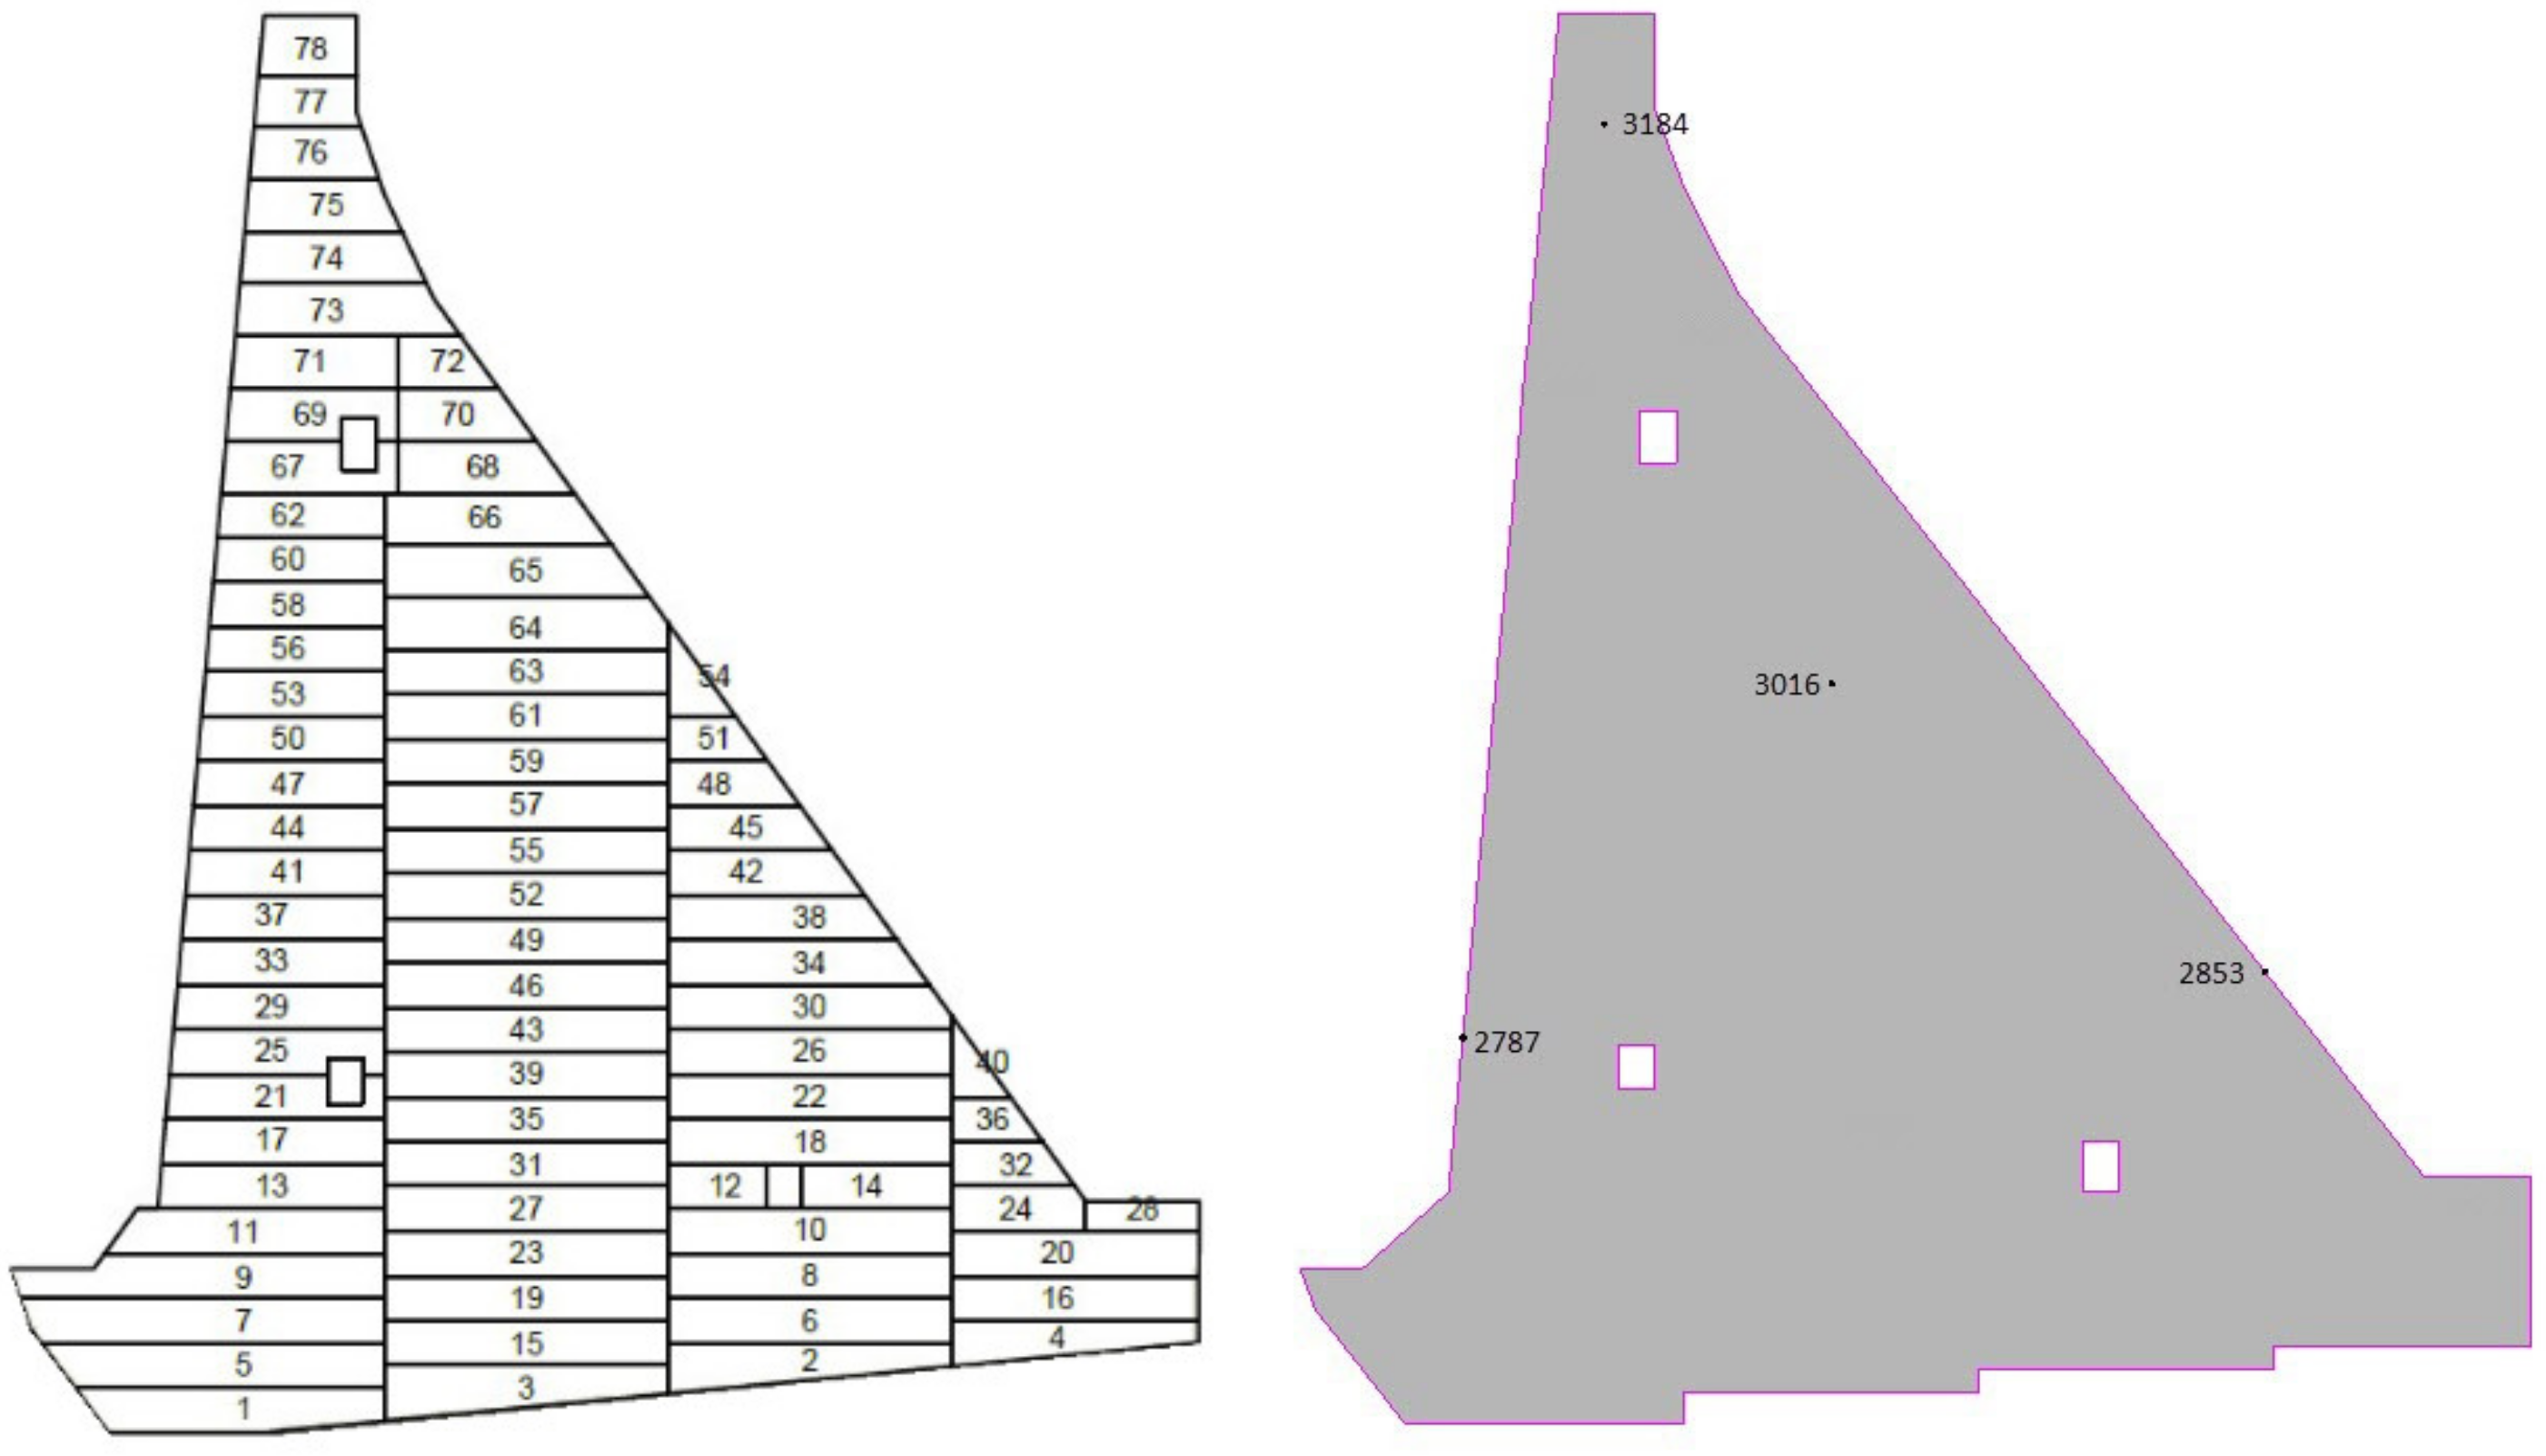
Figure 3.
(Left): Characteristic cross-section; (right): 3D model of the monolith with 78 blocks and the surrounding rock mass for thermal stress analysis.
Figure 3.
(Left): Characteristic cross-section; (right): 3D model of the monolith with 78 blocks and the surrounding rock mass for thermal stress analysis.
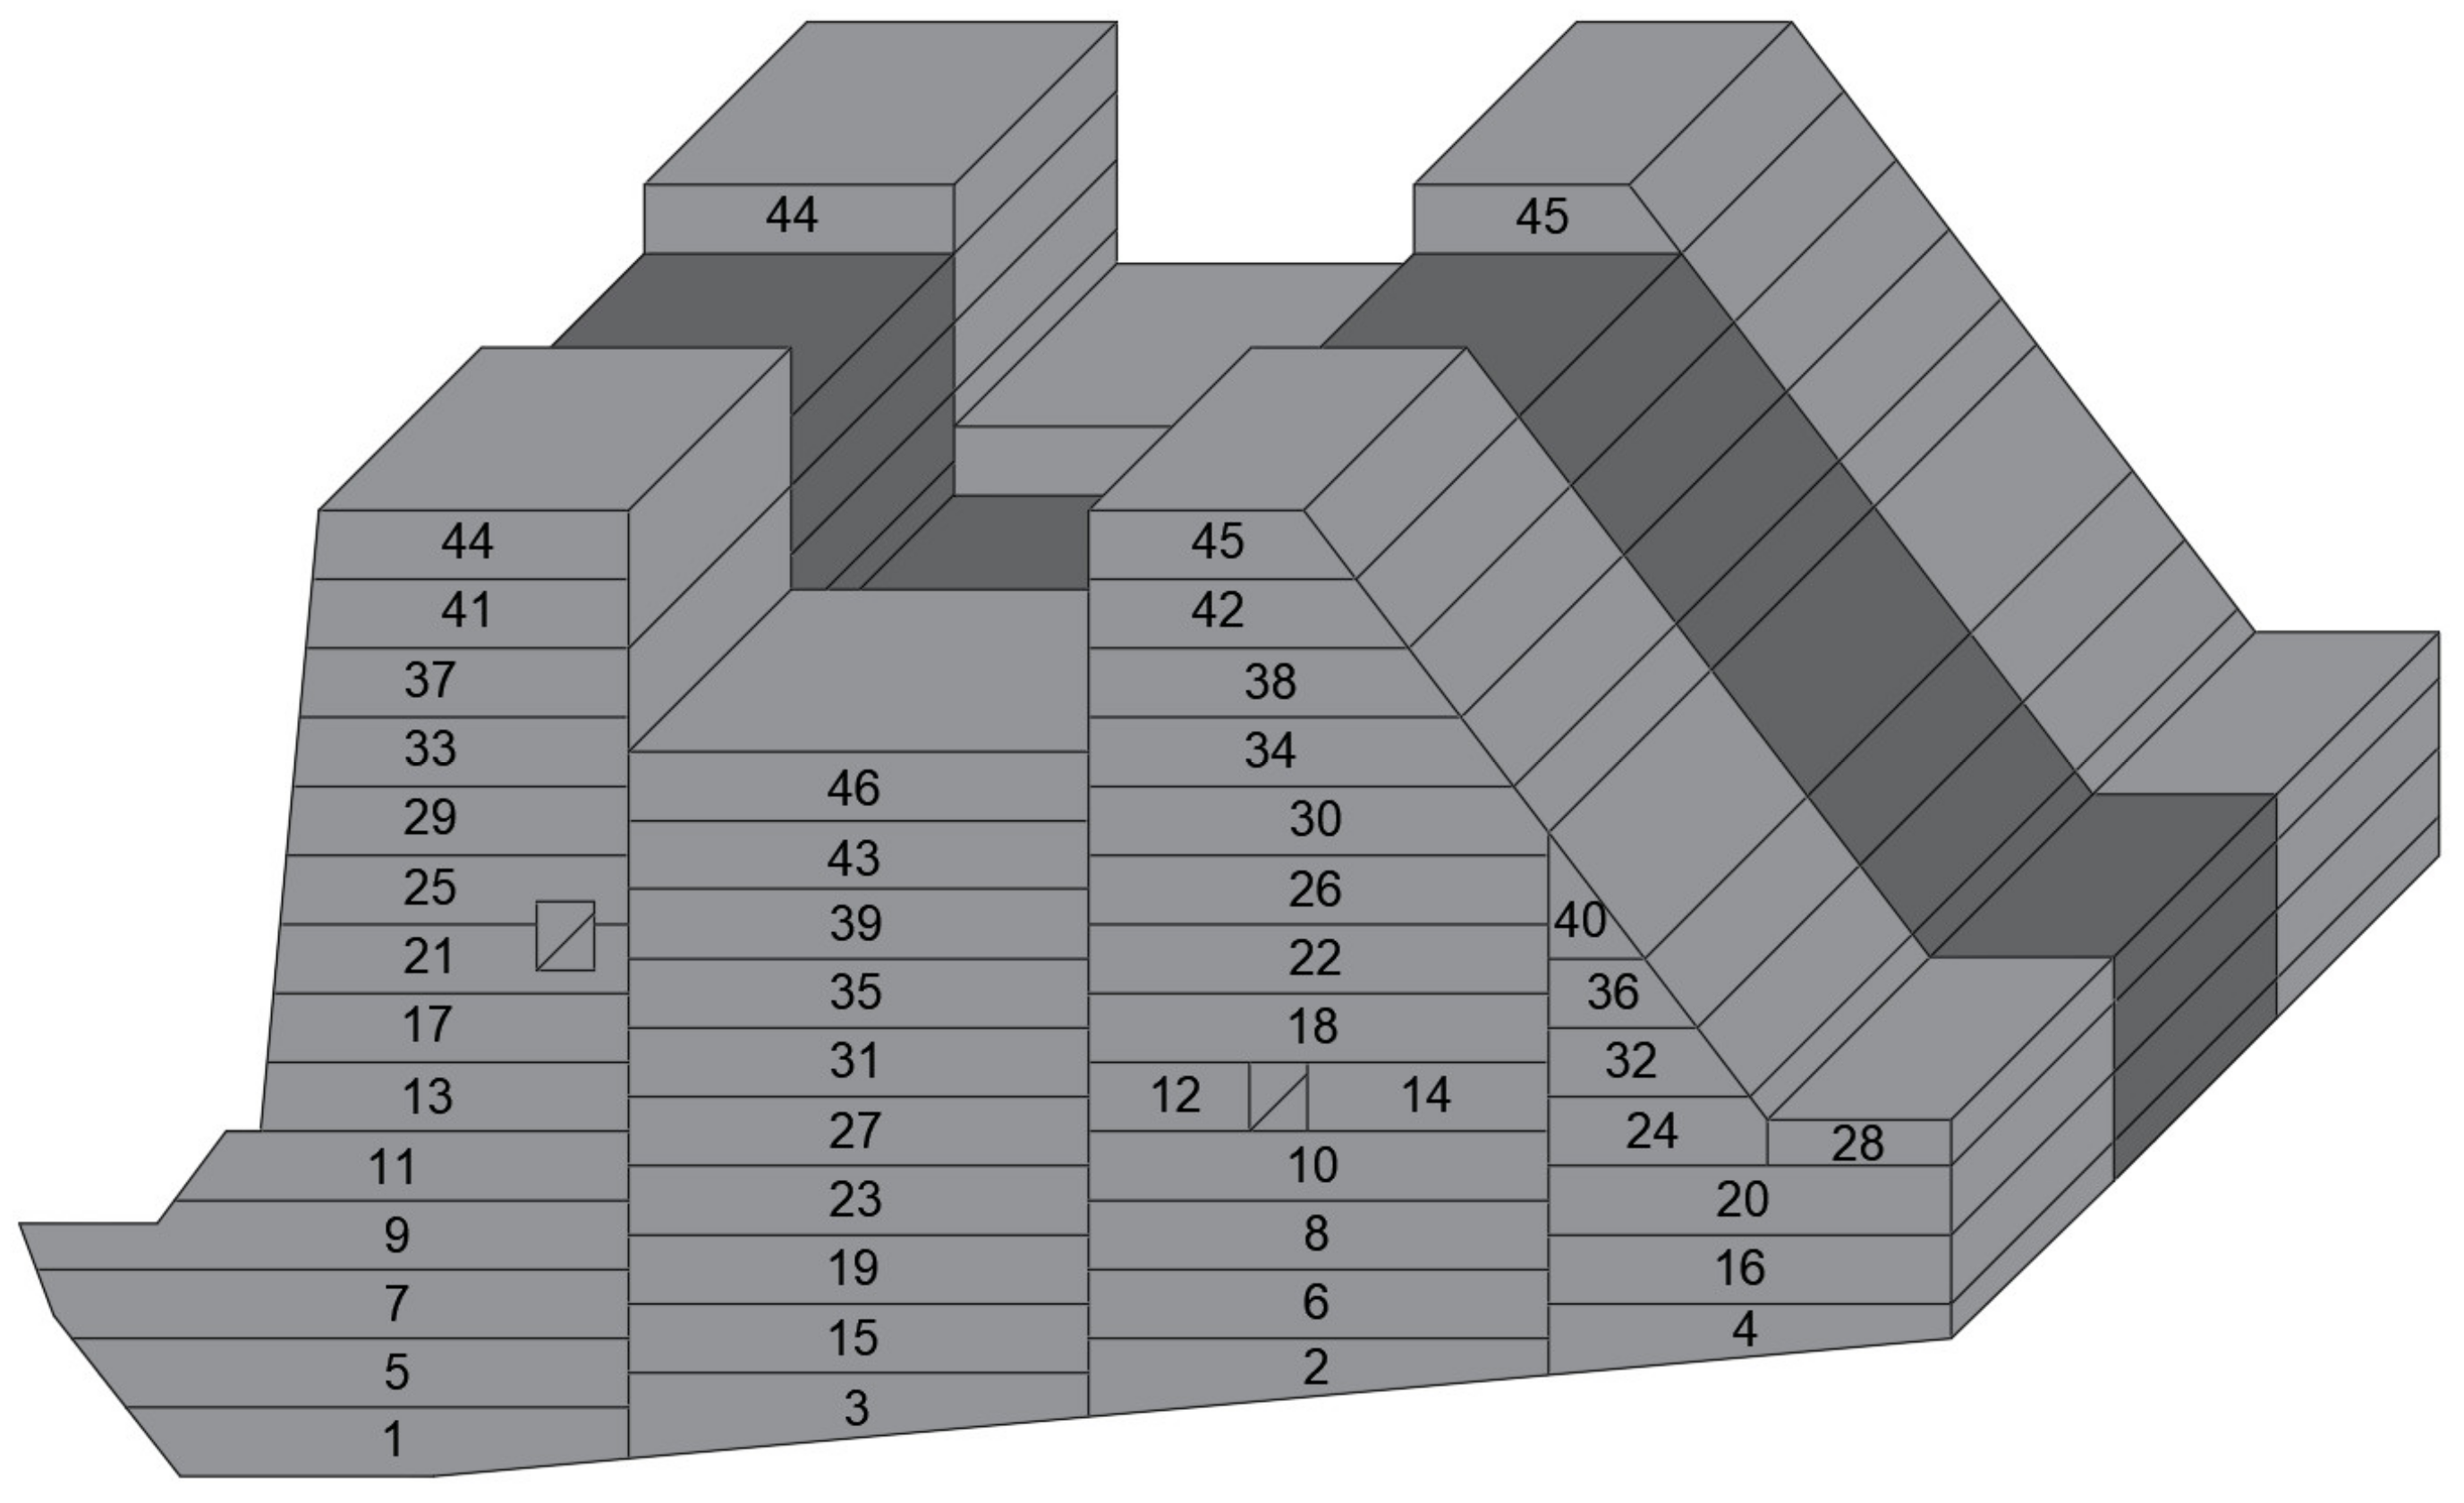
Figure 4.
Concrete blocks in the gravity dam (numbers coincide with the sequence of pouring).
Figure 4.
Concrete blocks in the gravity dam (numbers coincide with the sequence of pouring).
Figure 5.
The sequence of pouring the blocks of the odd (light grey) and even (dark grey) monoliths.
Figure 5.
The sequence of pouring the blocks of the odd (light grey) and even (dark grey) monoliths.
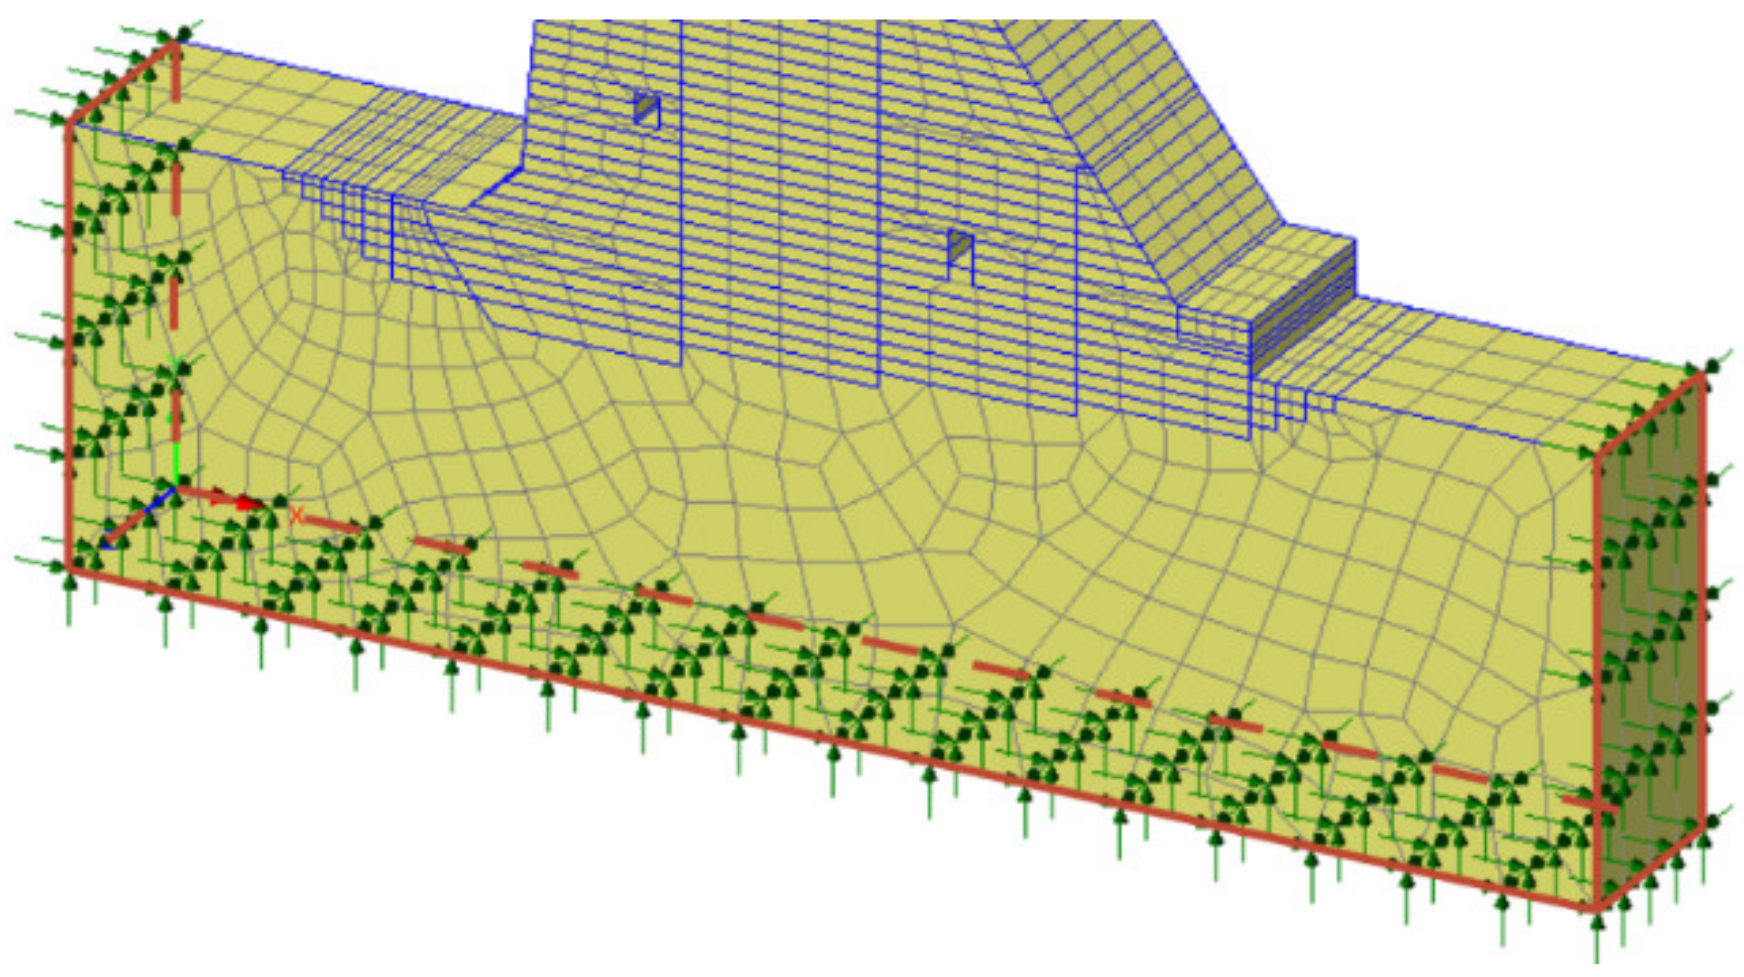
Figure 6.
The boundary condition for conducting stress analysis.
Figure 6.
The boundary condition for conducting stress analysis.
Figure 7.
Filling and water level in the reservoir in the exploitation phase.
Figure 7.
Filling and water level in the reservoir in the exploitation phase.
Figure 8.
Distinctive control nodes of the model in the mid-plane of the monolith.
Figure 8.
Distinctive control nodes of the model in the mid-plane of the monolith.
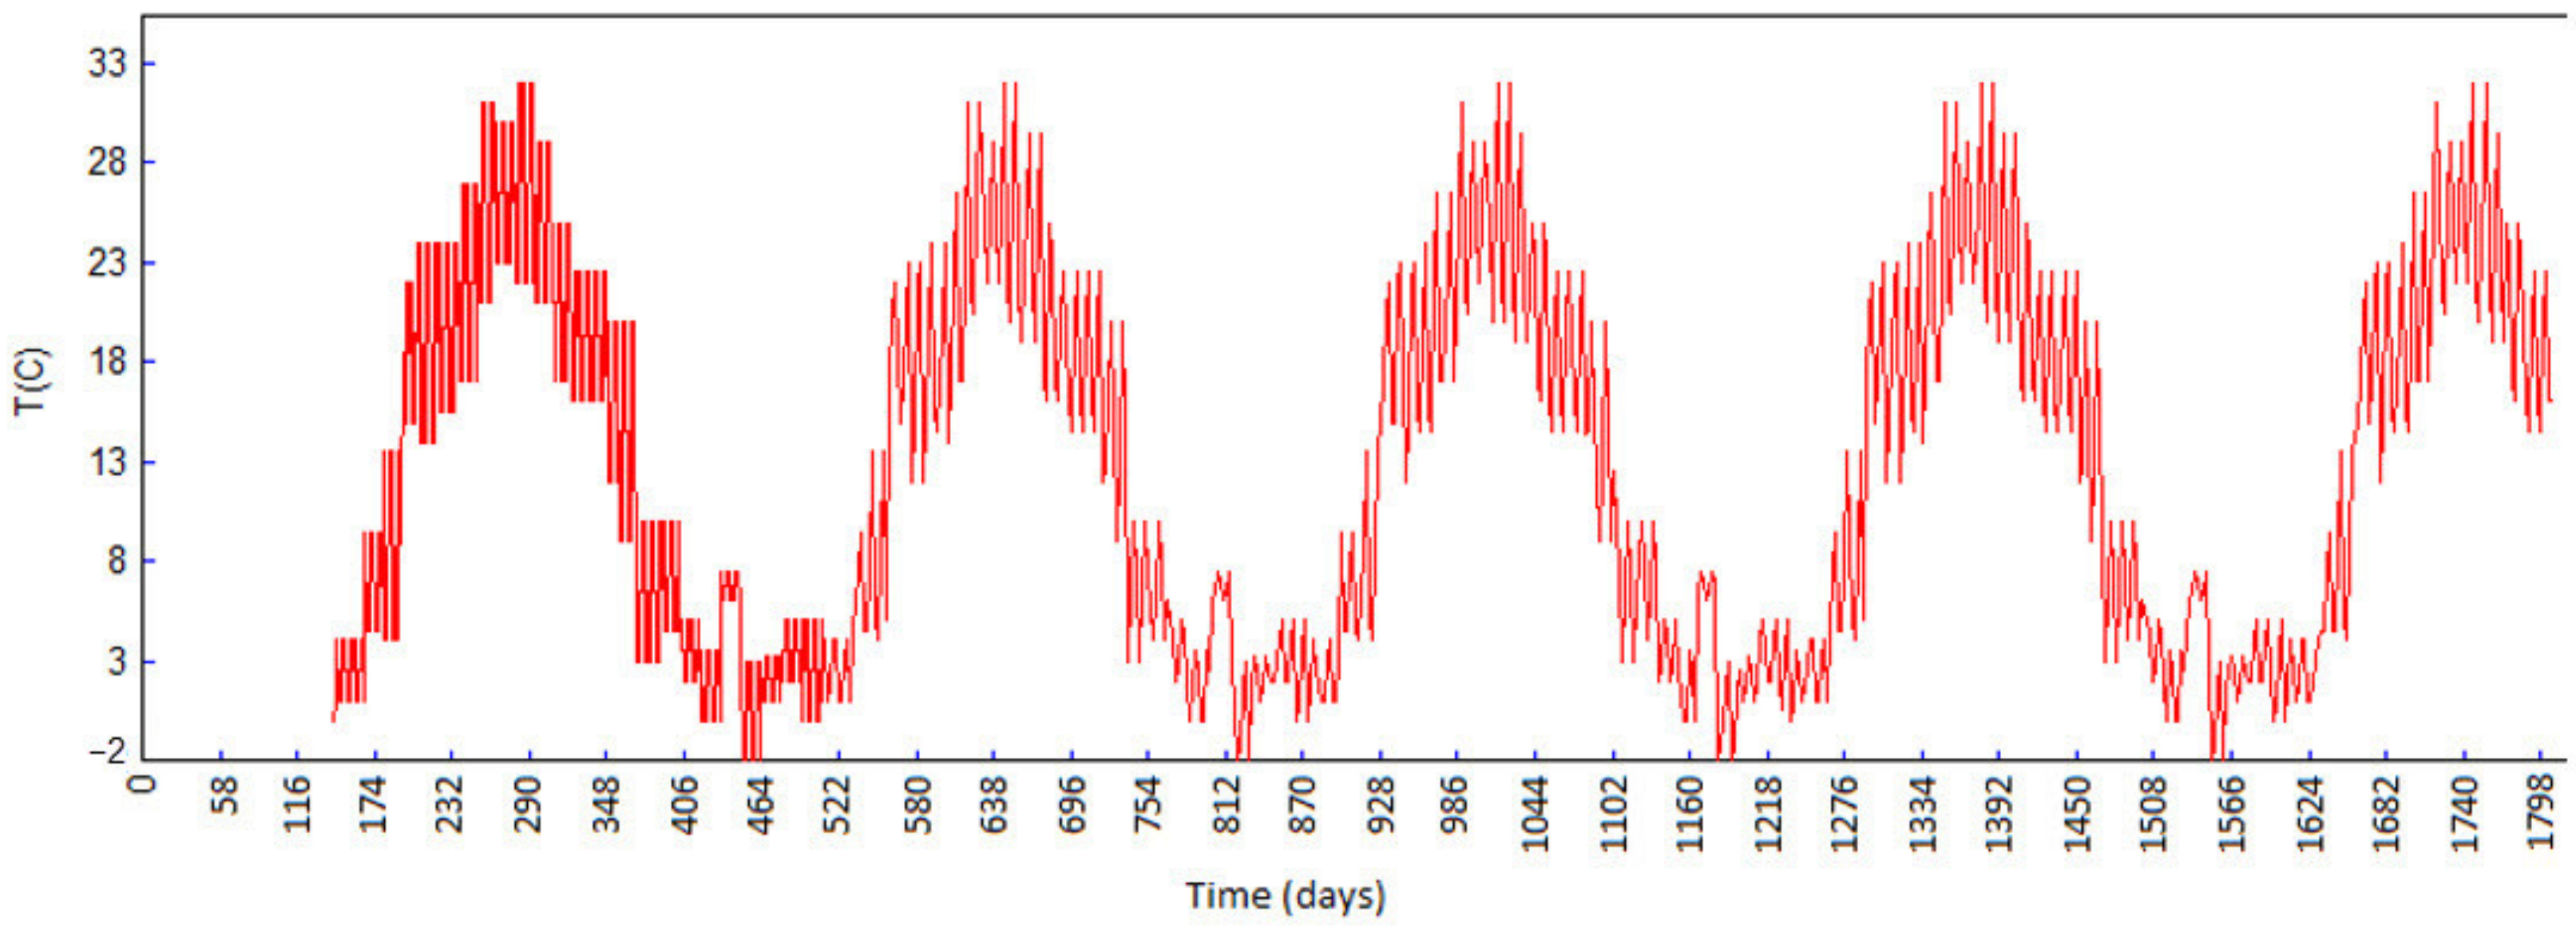
Figure 9.
Concrete temperature (°C) in node 2787 (upstream face).
Figure 9.
Concrete temperature (°C) in node 2787 (upstream face).
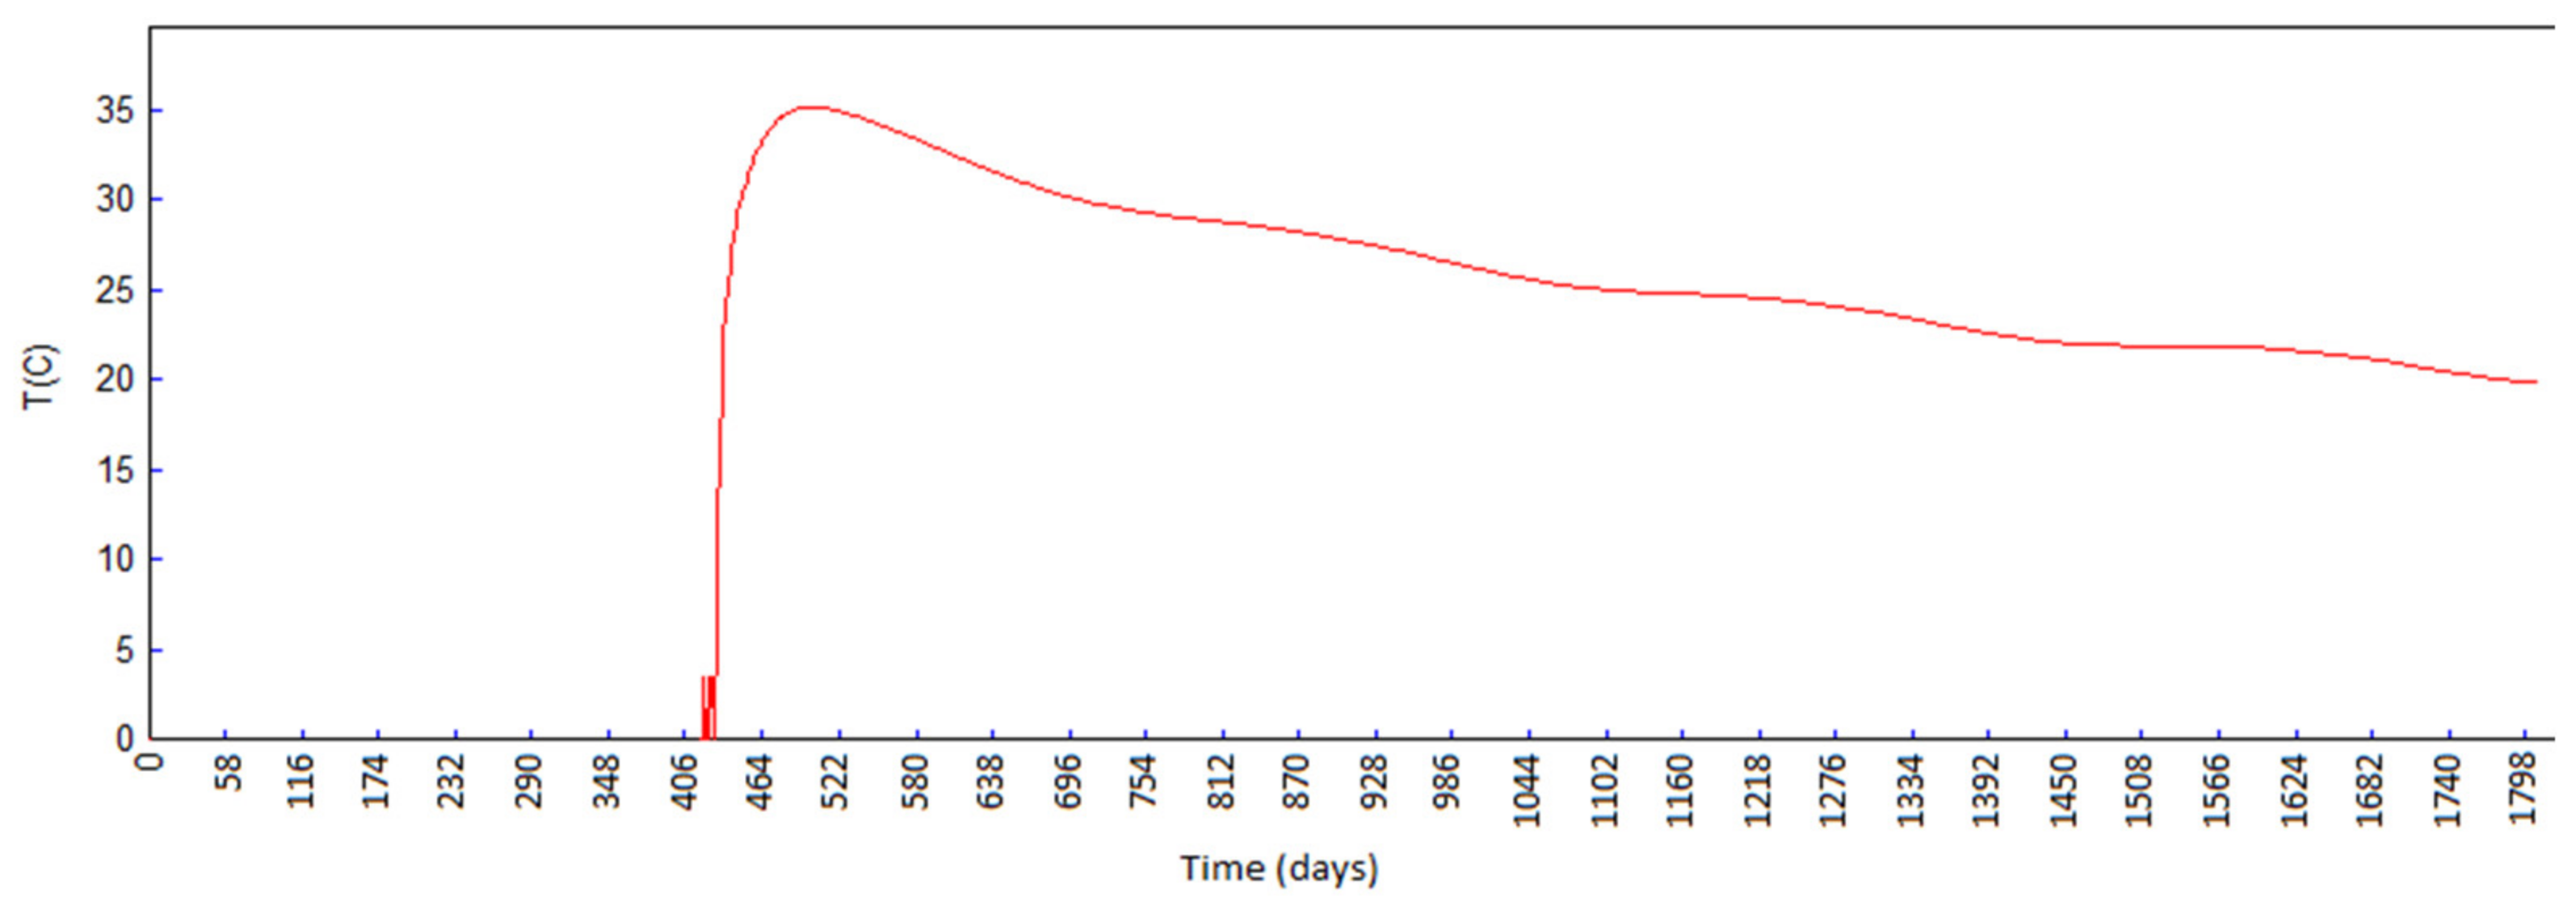
Figure 10.
Concrete temperature (°C) in node 2853 (downstream face).
Figure 10.
Concrete temperature (°C) in node 2853 (downstream face).
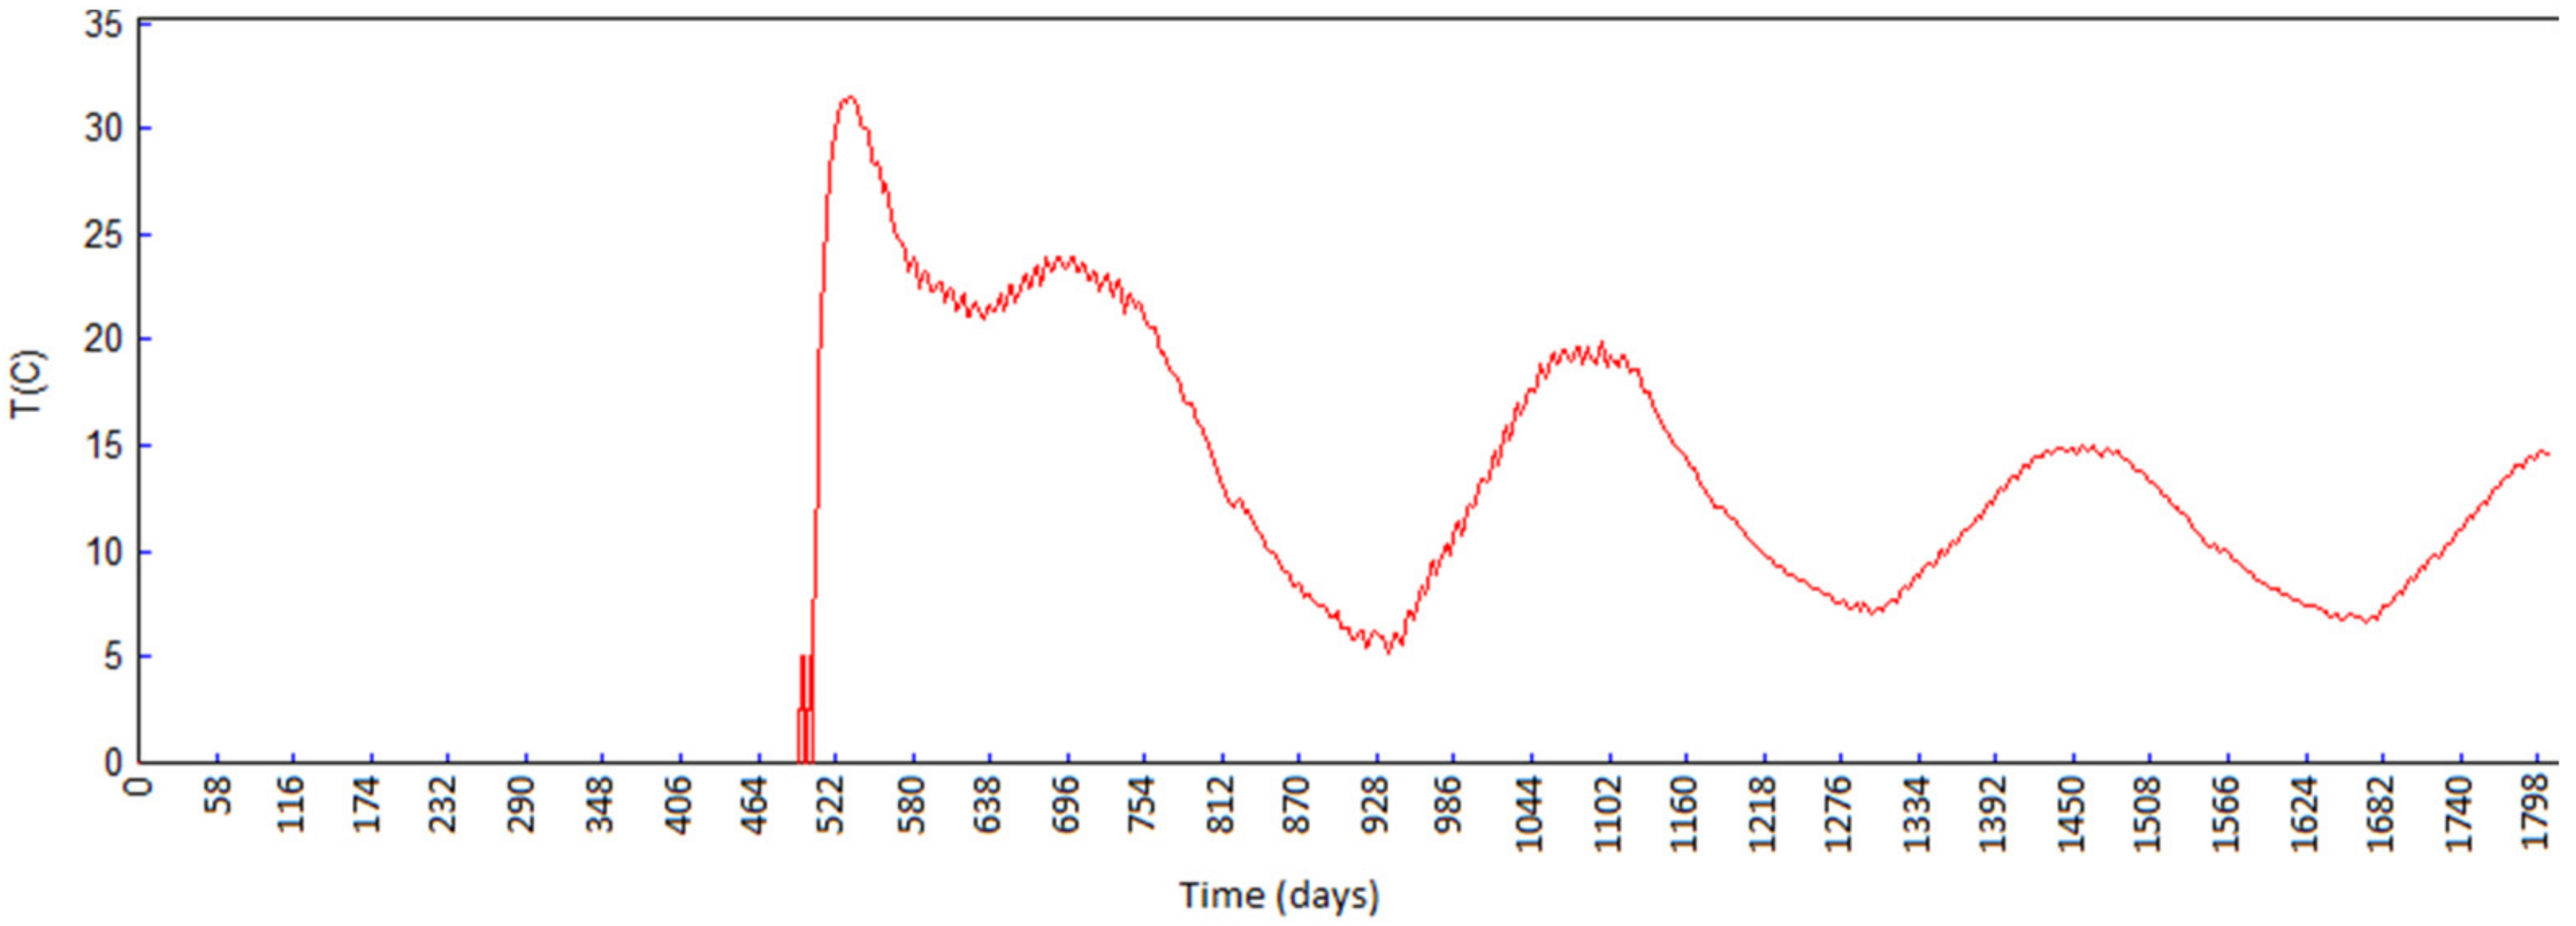
Figure 11.
Concrete temperature (°C) in node 3016 (middle of the monolith).
Figure 11.
Concrete temperature (°C) in node 3016 (middle of the monolith).
Figure 12.
Concrete temperature (°C) in node 3184 (zone of the dam’s crest).
Figure 12.
Concrete temperature (°C) in node 3184 (zone of the dam’s crest).
Figure 13.
Presentation of the temperature field in the rock mass.
Figure 13.
Presentation of the temperature field in the rock mass.
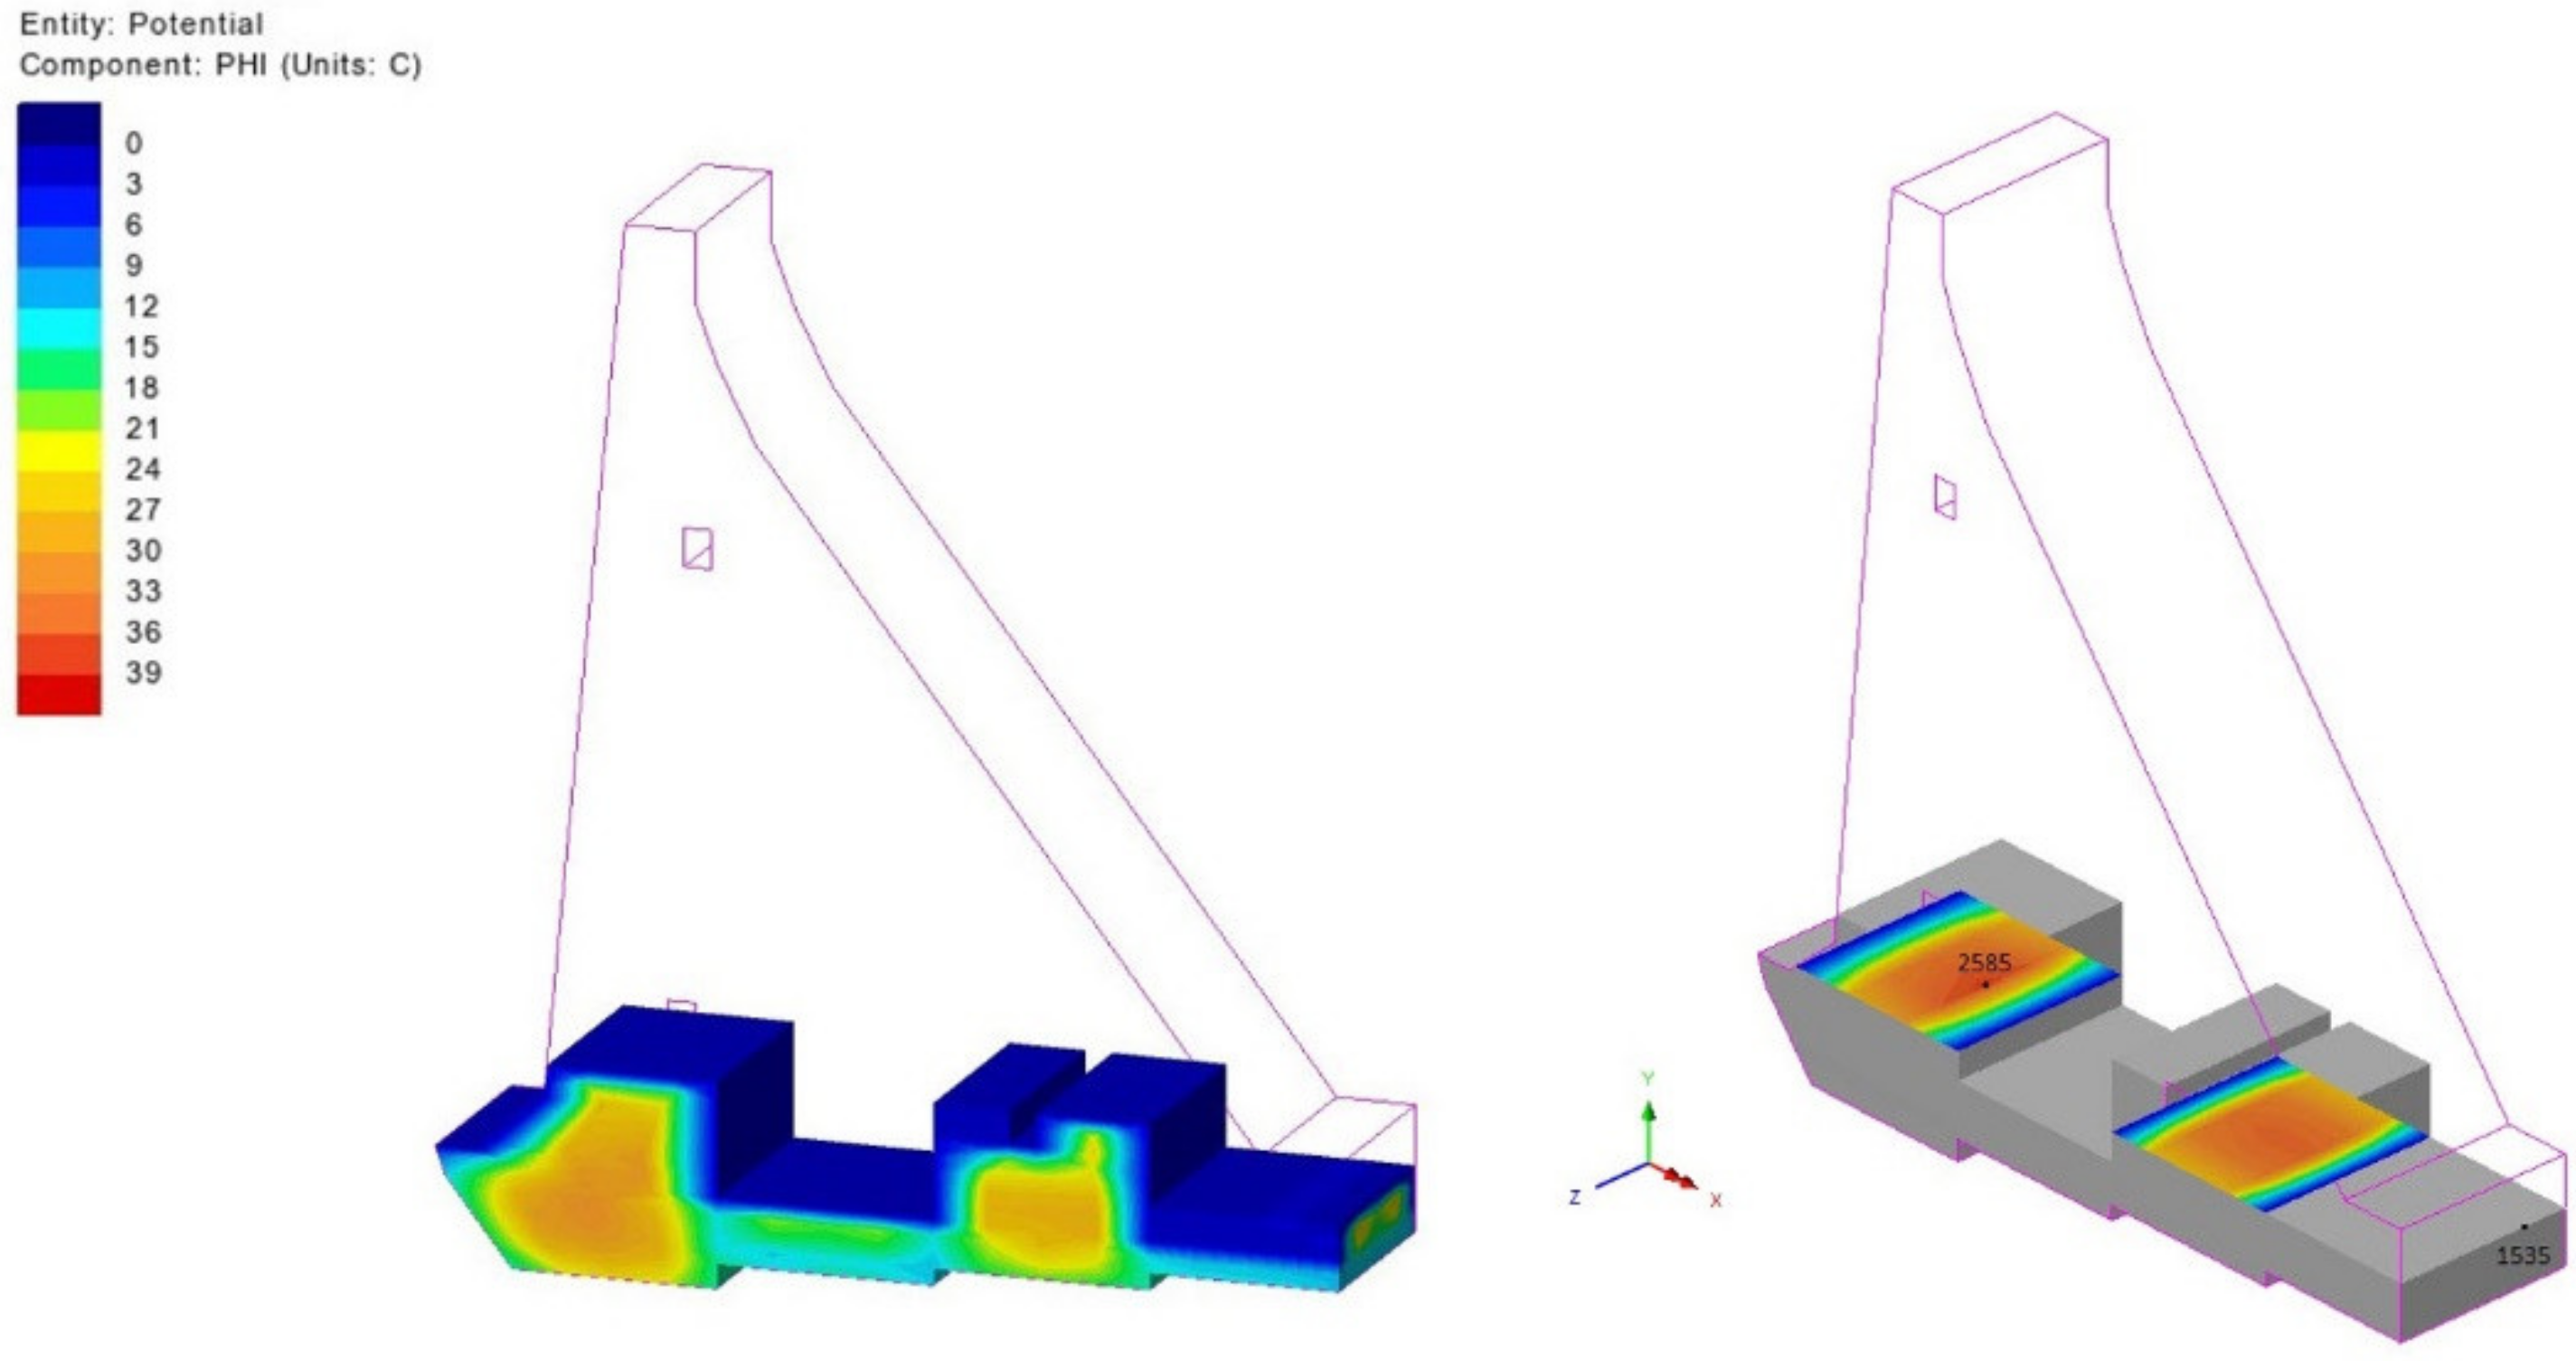
Figure 14.
Temperature field for day 84 (10th of January of the second year) with horizontal cross-section at 146.50 masl; maximum: node 2585, minimum: node 1535.
Figure 14.
Temperature field for day 84 (10th of January of the second year) with horizontal cross-section at 146.50 masl; maximum: node 2585, minimum: node 1535.
Figure 15.
Temperature field for day 283 (27th of July of the second year) with horizontal cross-section at 169.0 masl; maximum: node 2872, minimum: node 1334.
Figure 15.
Temperature field for day 283 (27th of July of the second year) with horizontal cross-section at 169.0 masl; maximum: node 2872, minimum: node 1334.
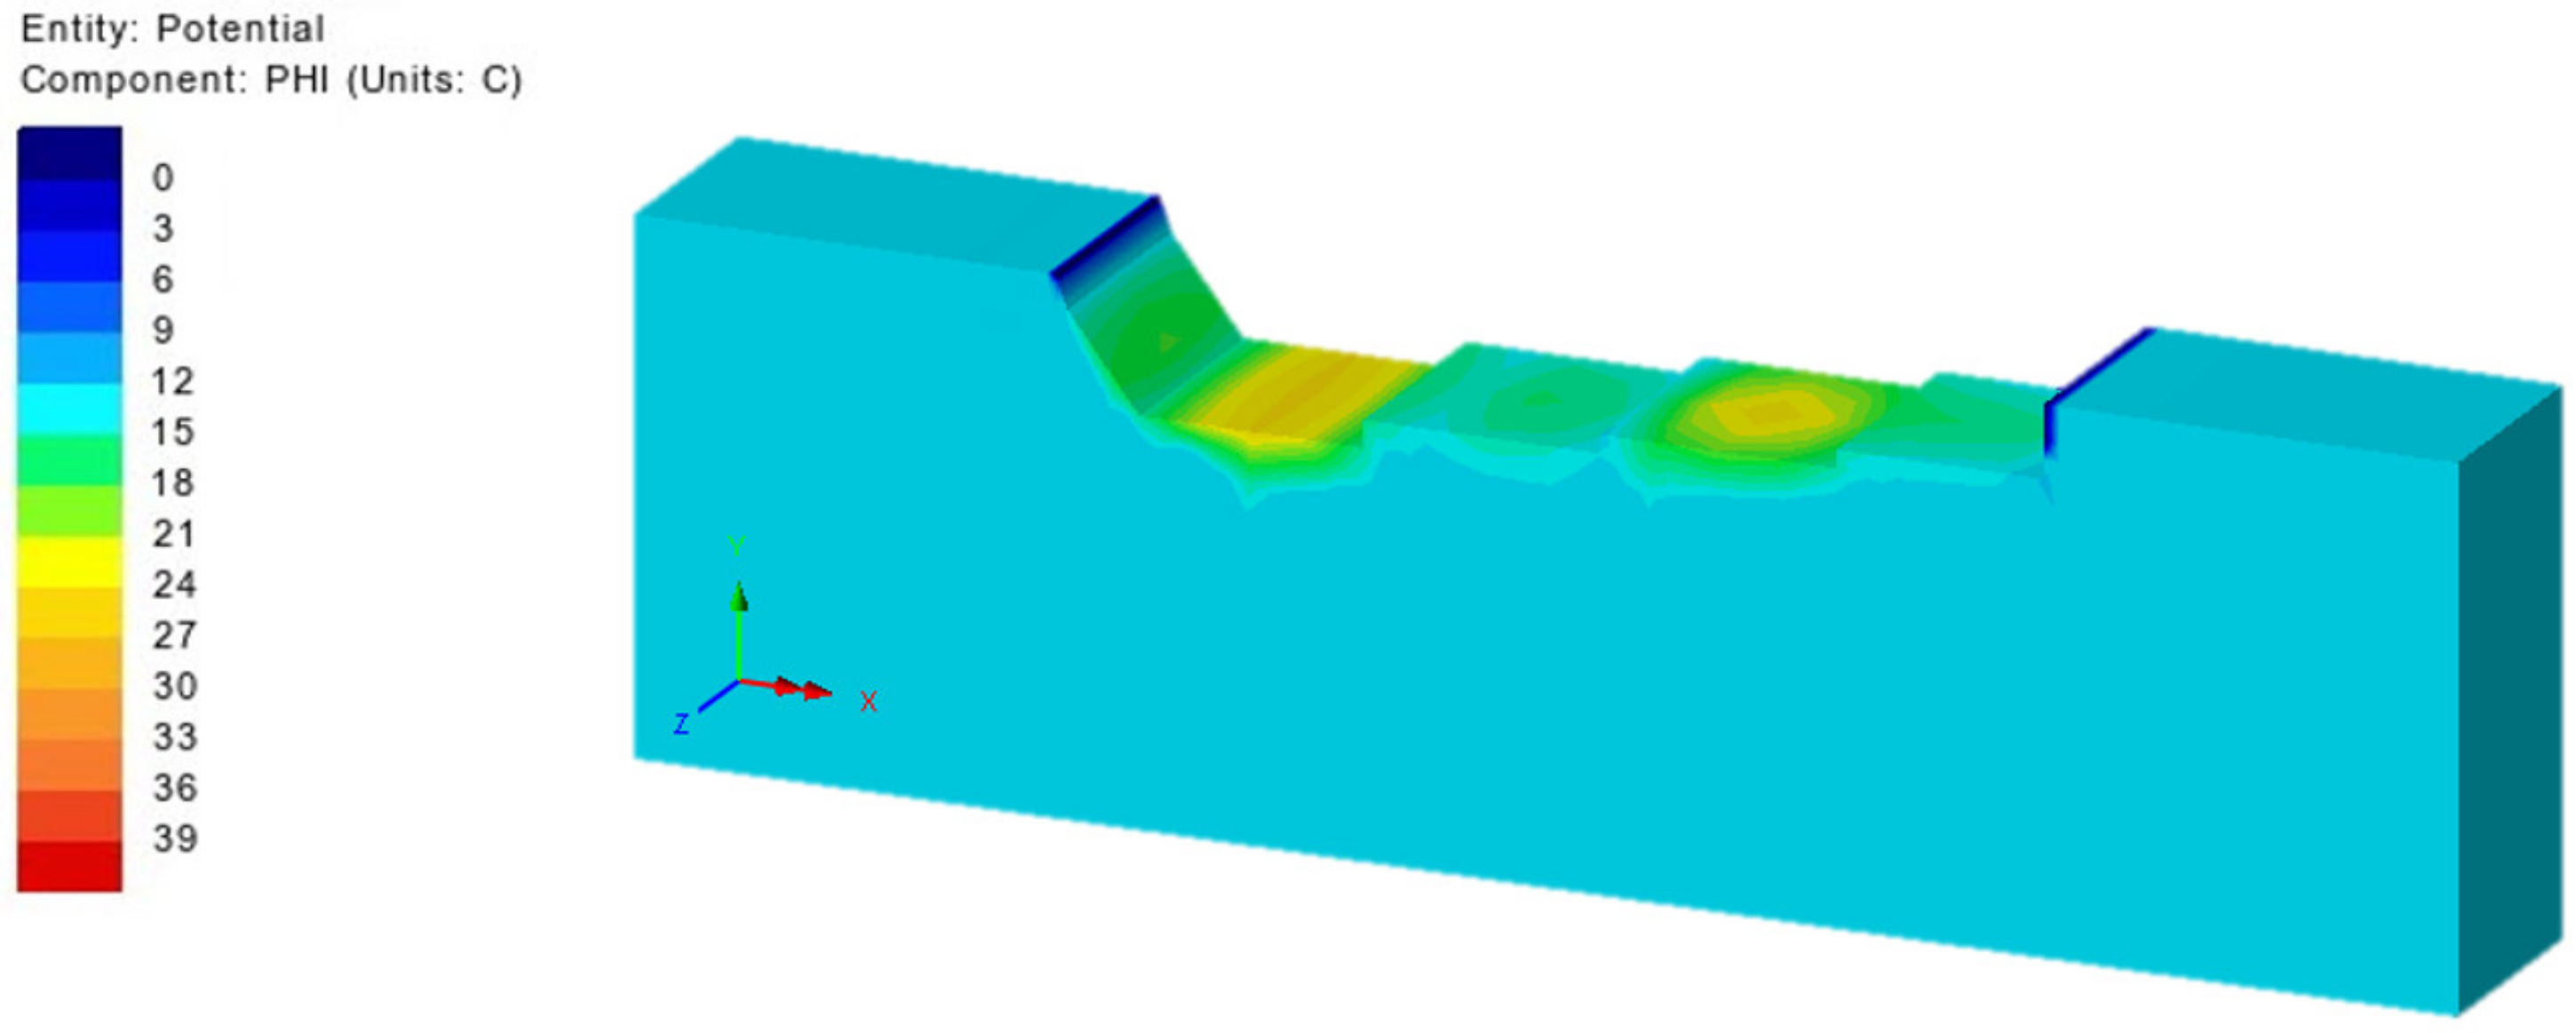
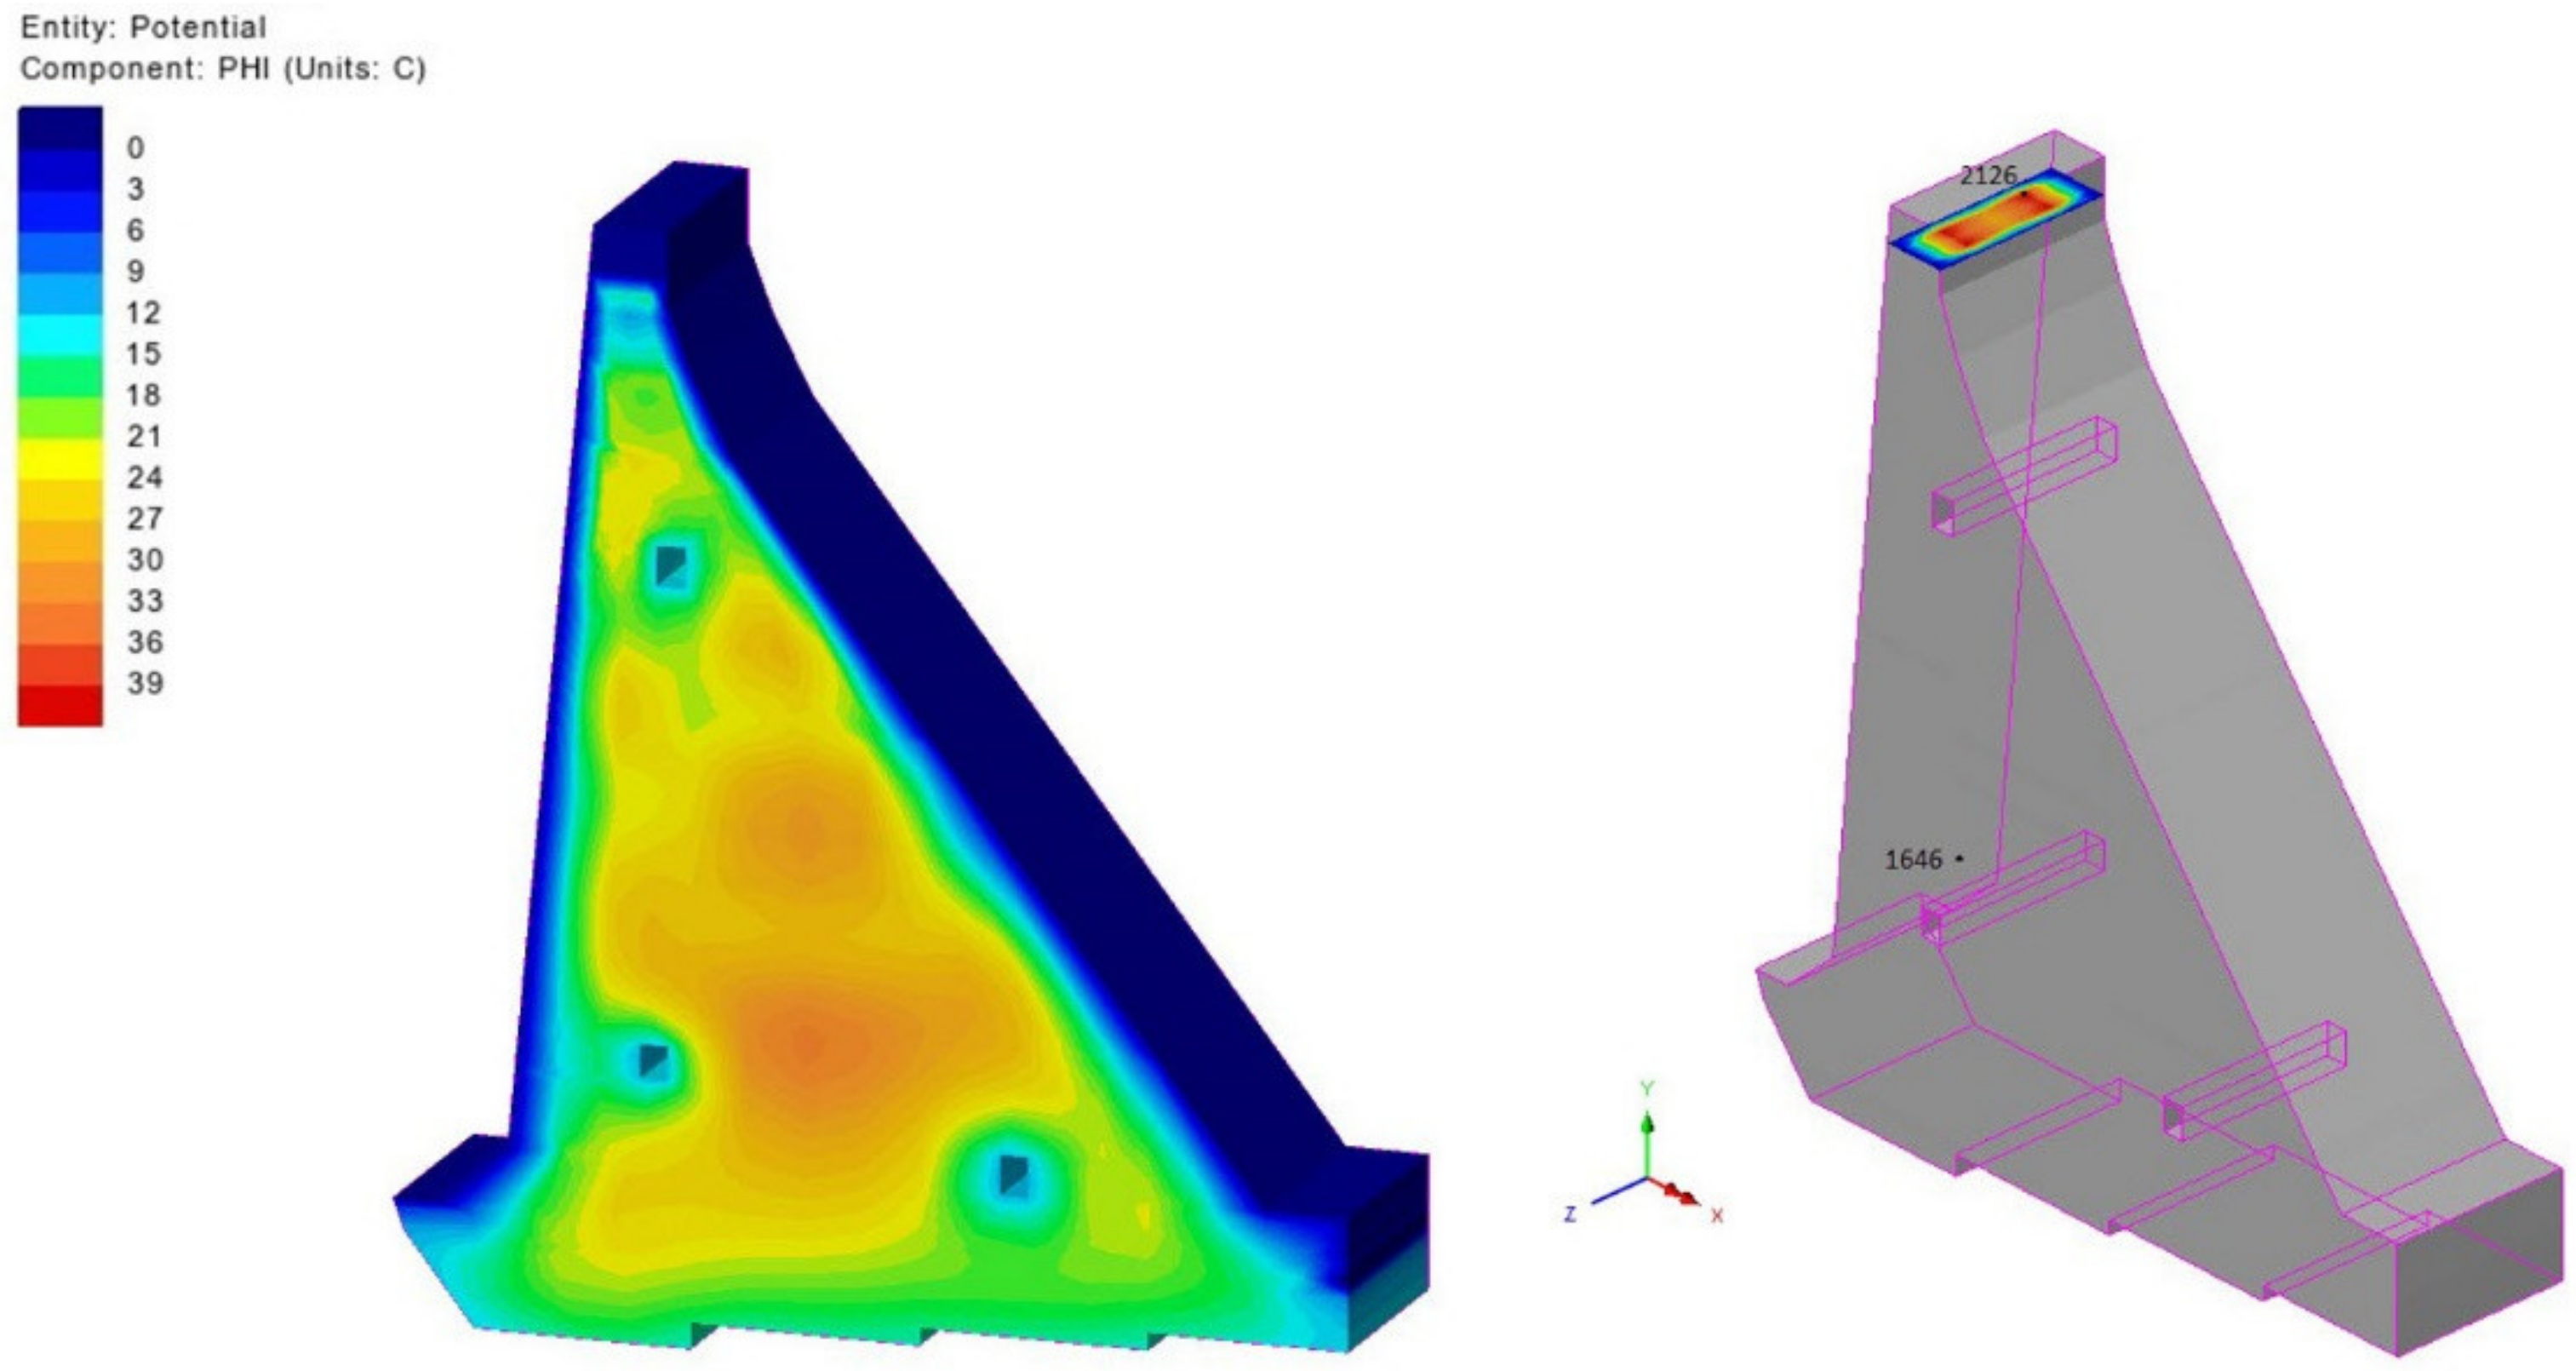
Figure 16.
Temperature field for day 512 (13th of March of the third year) with horizontal cross-section at 227.0 masl; maximum: node 2126, minimum: node 1646.
Figure 16.
Temperature field for day 512 (13th of March of the third year) with horizontal cross-section at 227.0 masl; maximum: node 2126, minimum: node 1646.
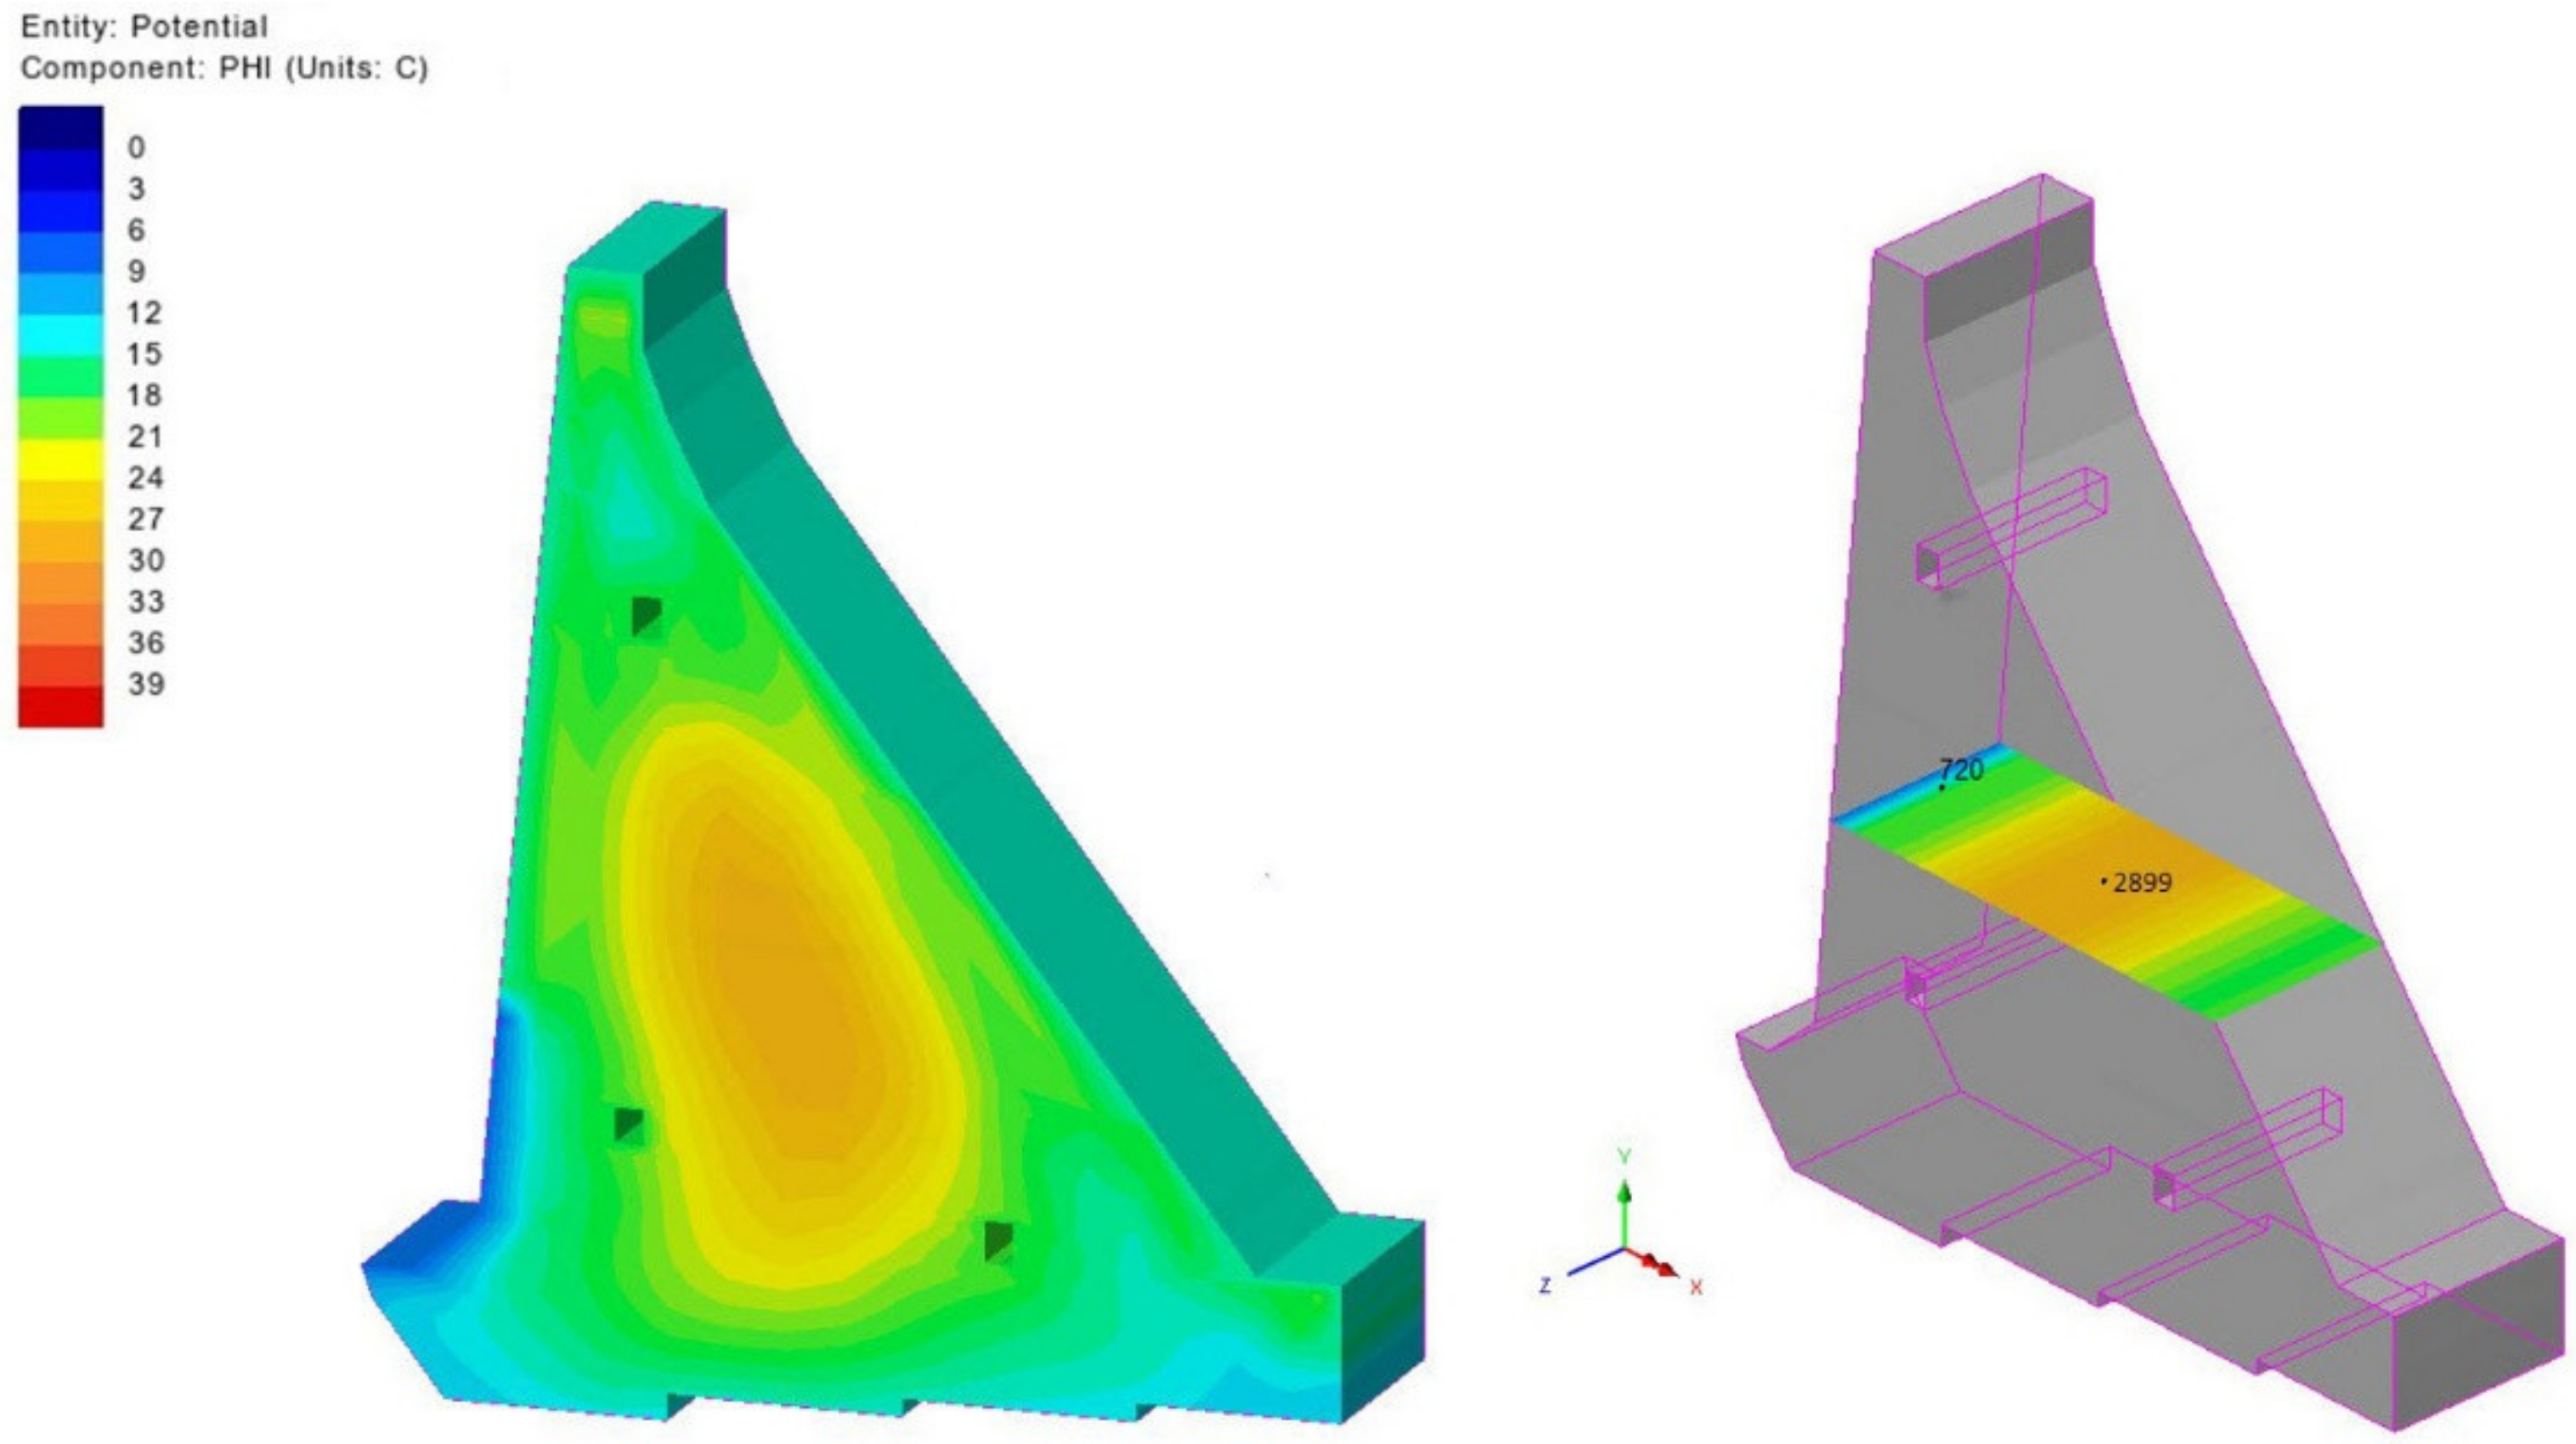
Figure 17.
Temperature field for day 1080 (2nd of October of the fourth year) with horizontal cross-section at 172.0 masl; maximum: node 2899, minimum: node 720.
Figure 17.
Temperature field for day 1080 (2nd of October of the fourth year) with horizontal cross-section at 172.0 masl; maximum: node 2899, minimum: node 720.
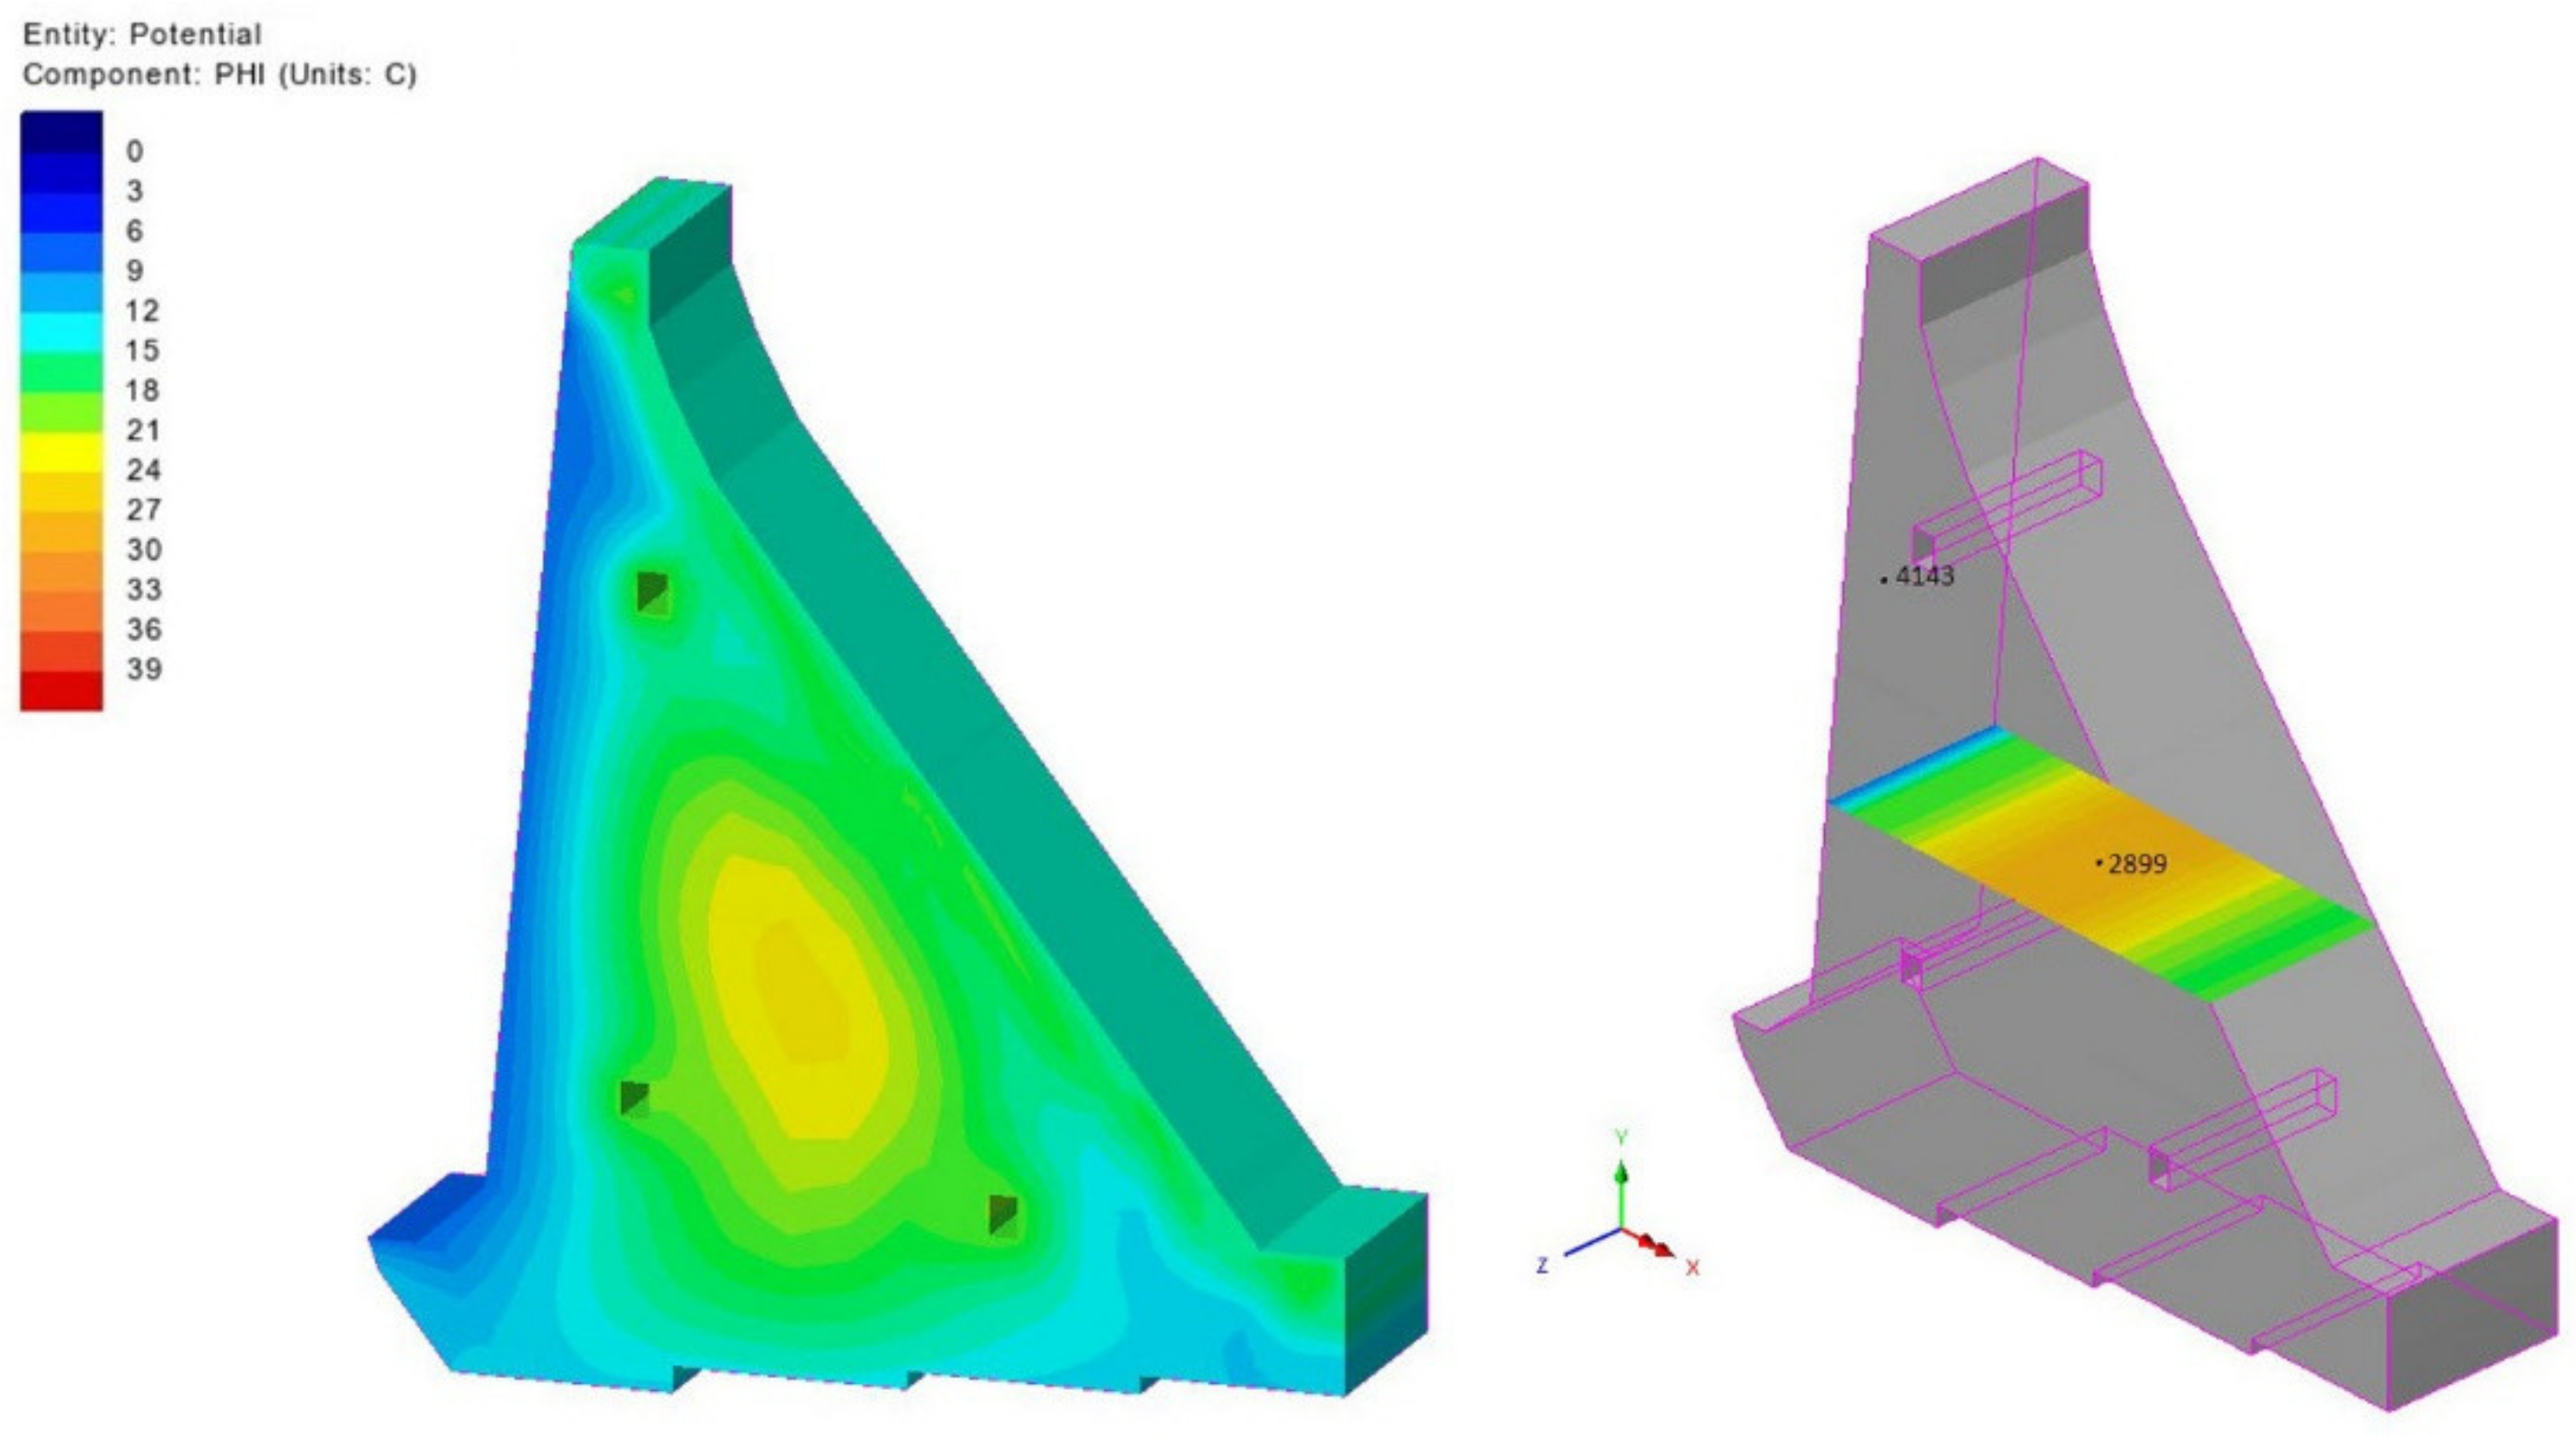
Figure 18.
Temperature field for day 1804 (25th of September of the sixth year) with horizontal cross-section at 170.50 masl; maximum: node 2899, minimum: node 4143.
Figure 18.
Temperature field for day 1804 (25th of September of the sixth year) with horizontal cross-section at 170.50 masl; maximum: node 2899, minimum: node 4143.
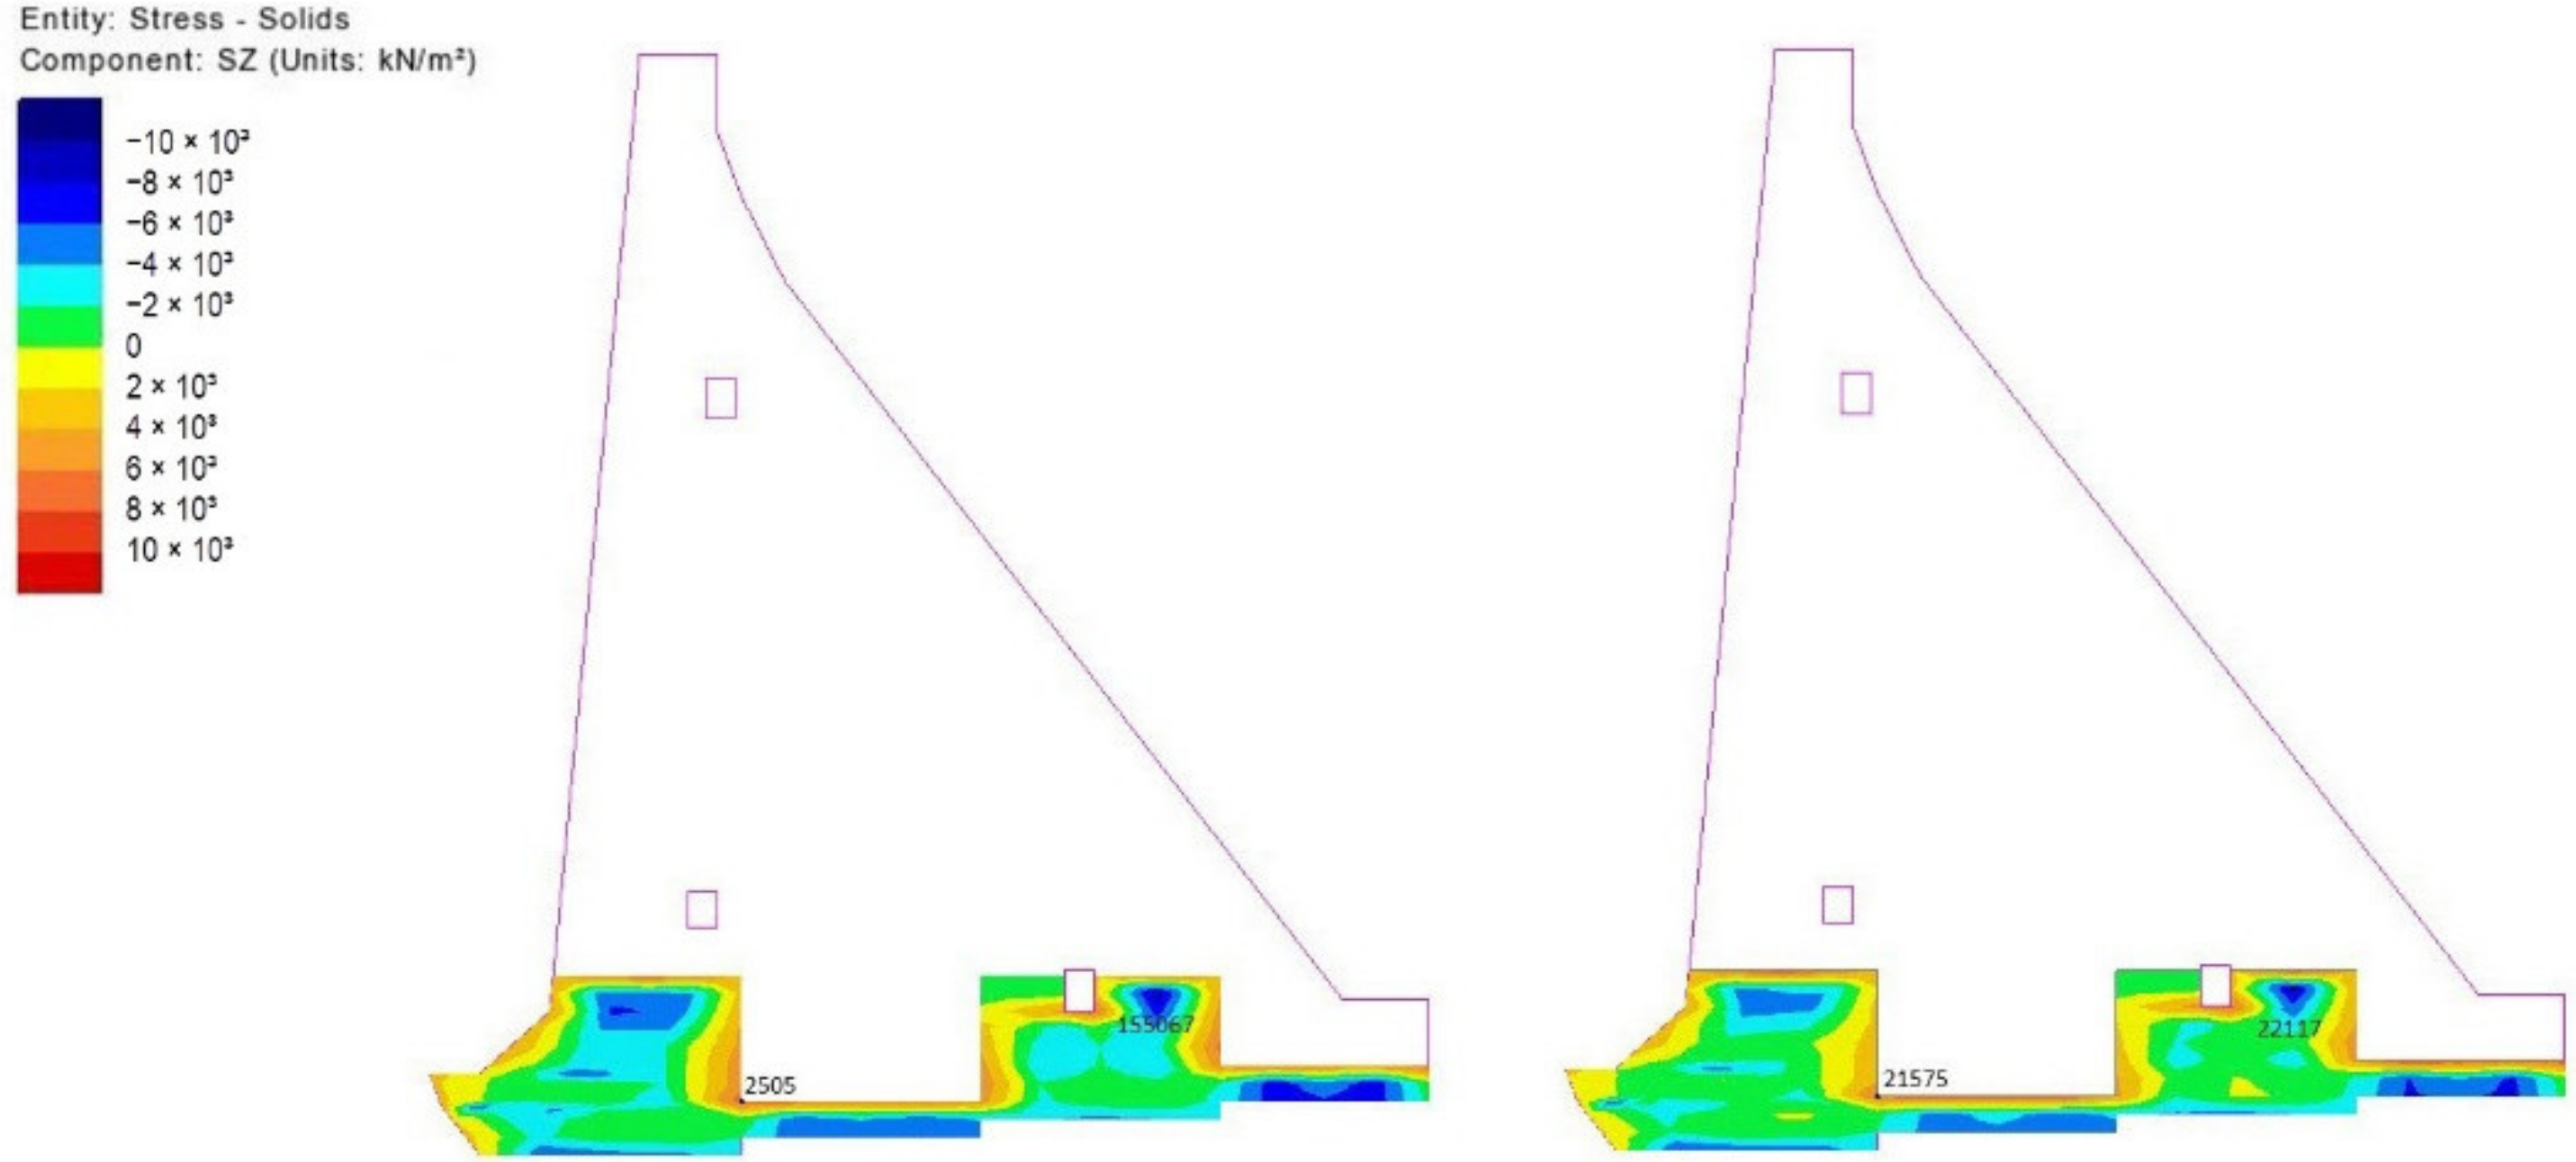
Figure 19.
Stresses in the mid-plane of the monolith 20 m long (left) and 15 m long (right) for the 84th day (10th of January of the second year); extremums: nodes 2505 and 21,575.
Figure 19.
Stresses in the mid-plane of the monolith 20 m long (left) and 15 m long (right) for the 84th day (10th of January of the second year); extremums: nodes 2505 and 21,575.
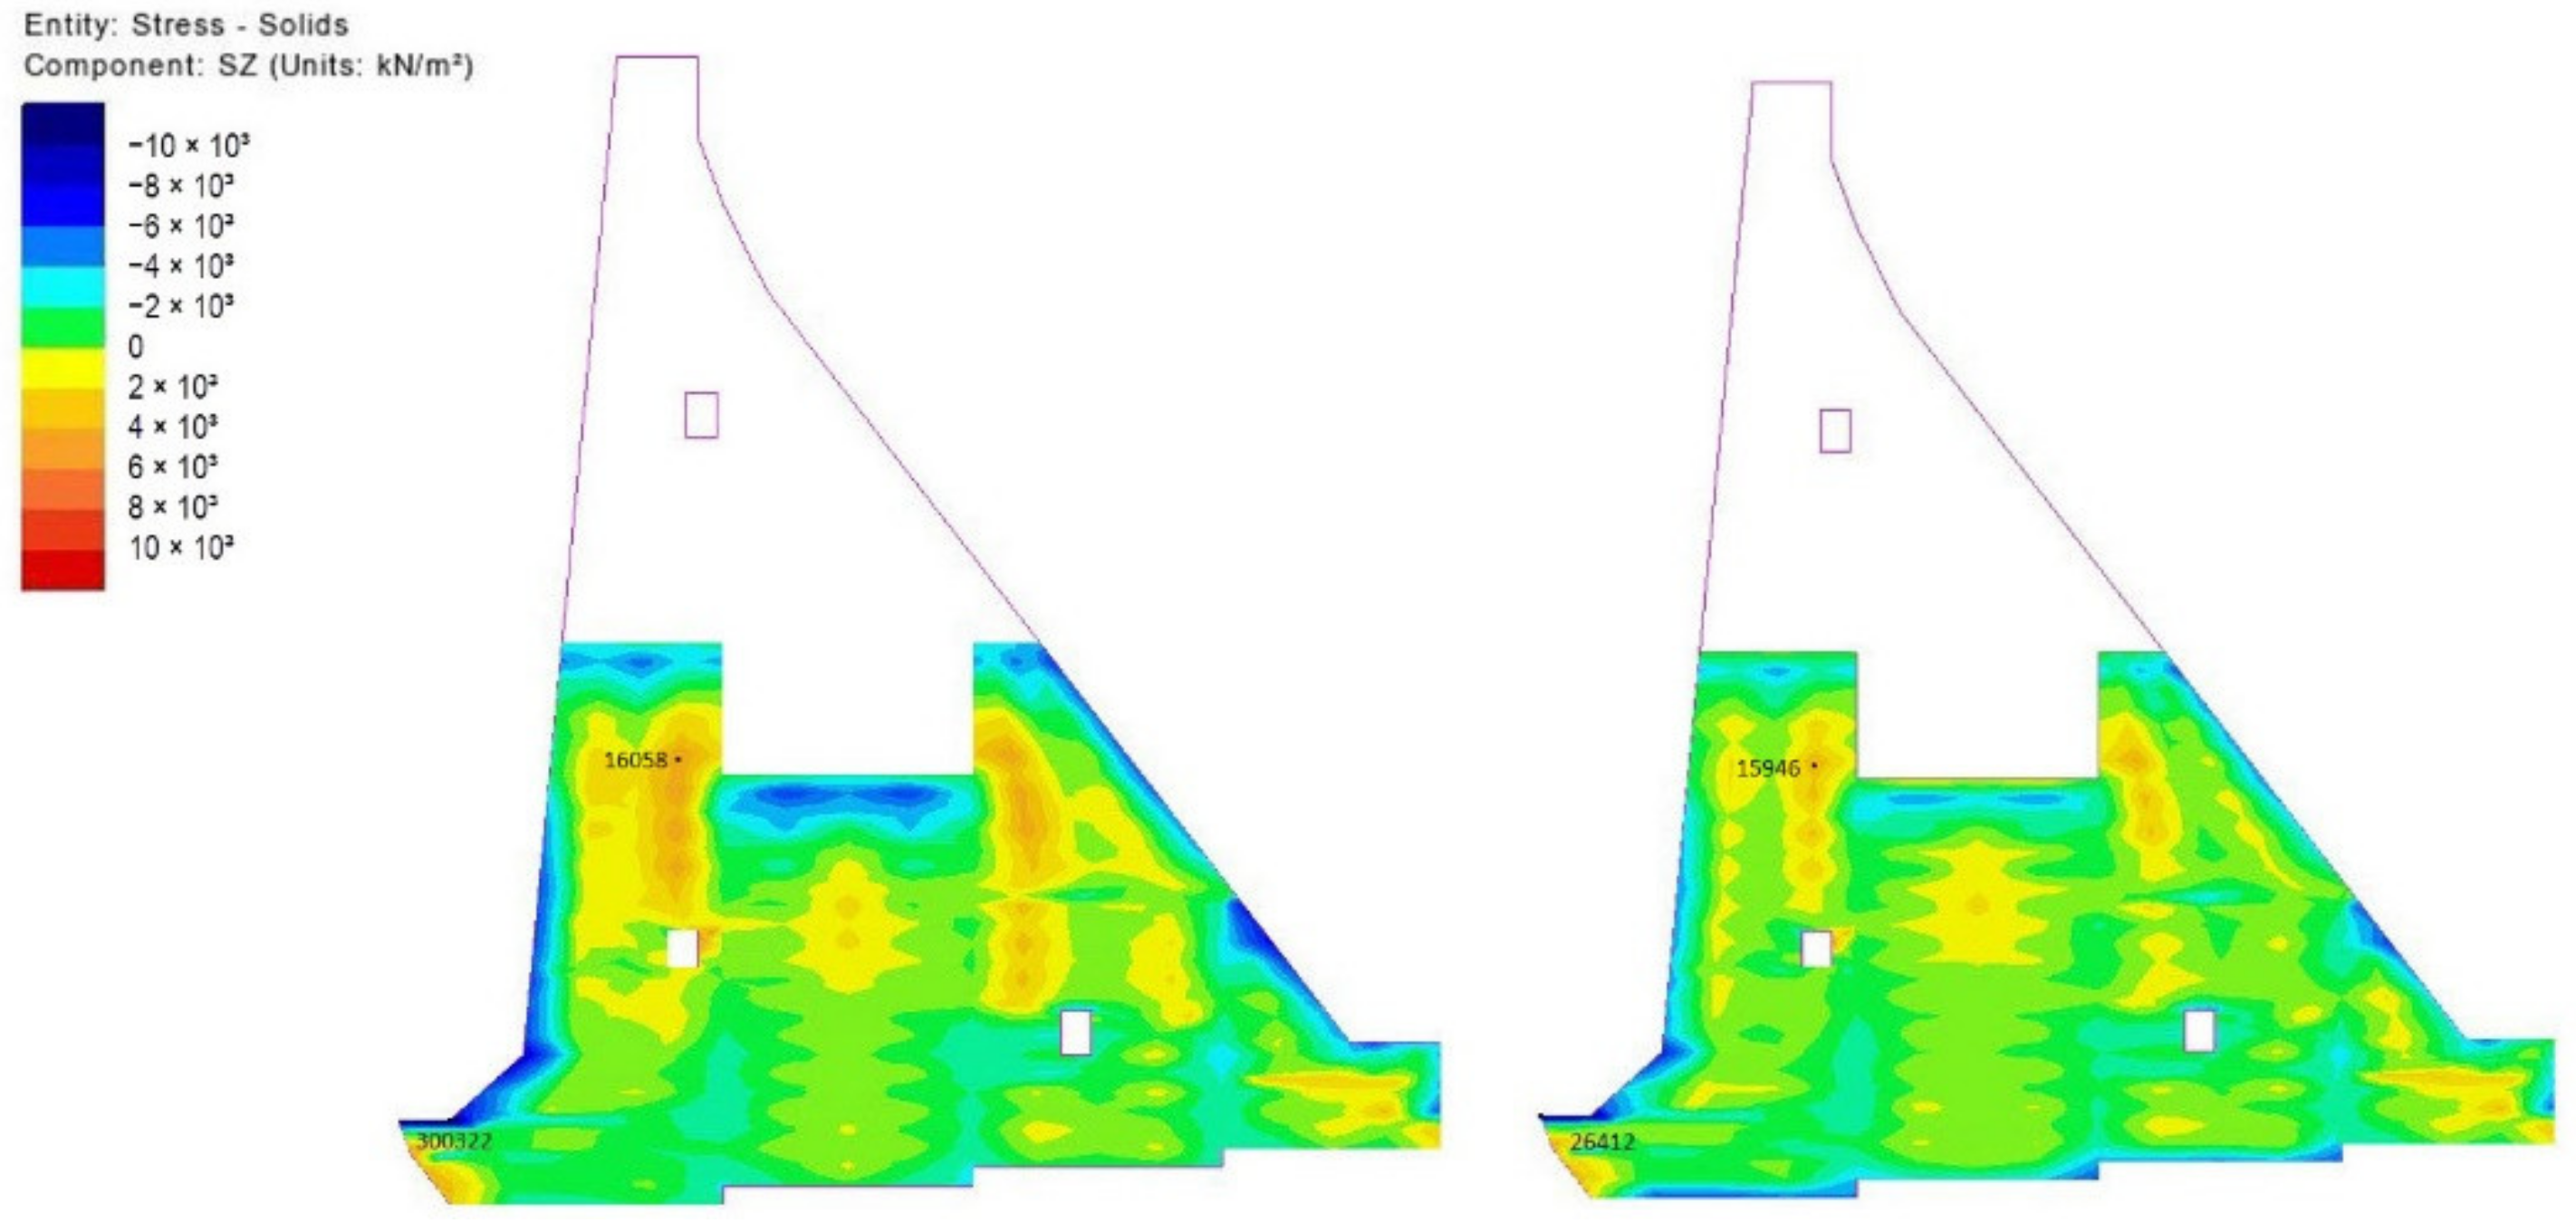
Figure 20.
Stresses in the mid-plane of the monolith 20 m long (left) and 15 m long (right) for the 283rd day (27th of July of the second year); extremums: nodes 16,058 and 15,946.
Figure 20.
Stresses in the mid-plane of the monolith 20 m long (left) and 15 m long (right) for the 283rd day (27th of July of the second year); extremums: nodes 16,058 and 15,946.
Figure 21.
Stresses in the mid-plane of the monolith 20 m long (left) and 15 m long (right) for the 512th day (13th of March of the third year); extremums: nodes 302,084 and 28,182.
Figure 21.
Stresses in the mid-plane of the monolith 20 m long (left) and 15 m long (right) for the 512th day (13th of March of the third year); extremums: nodes 302,084 and 28,182.
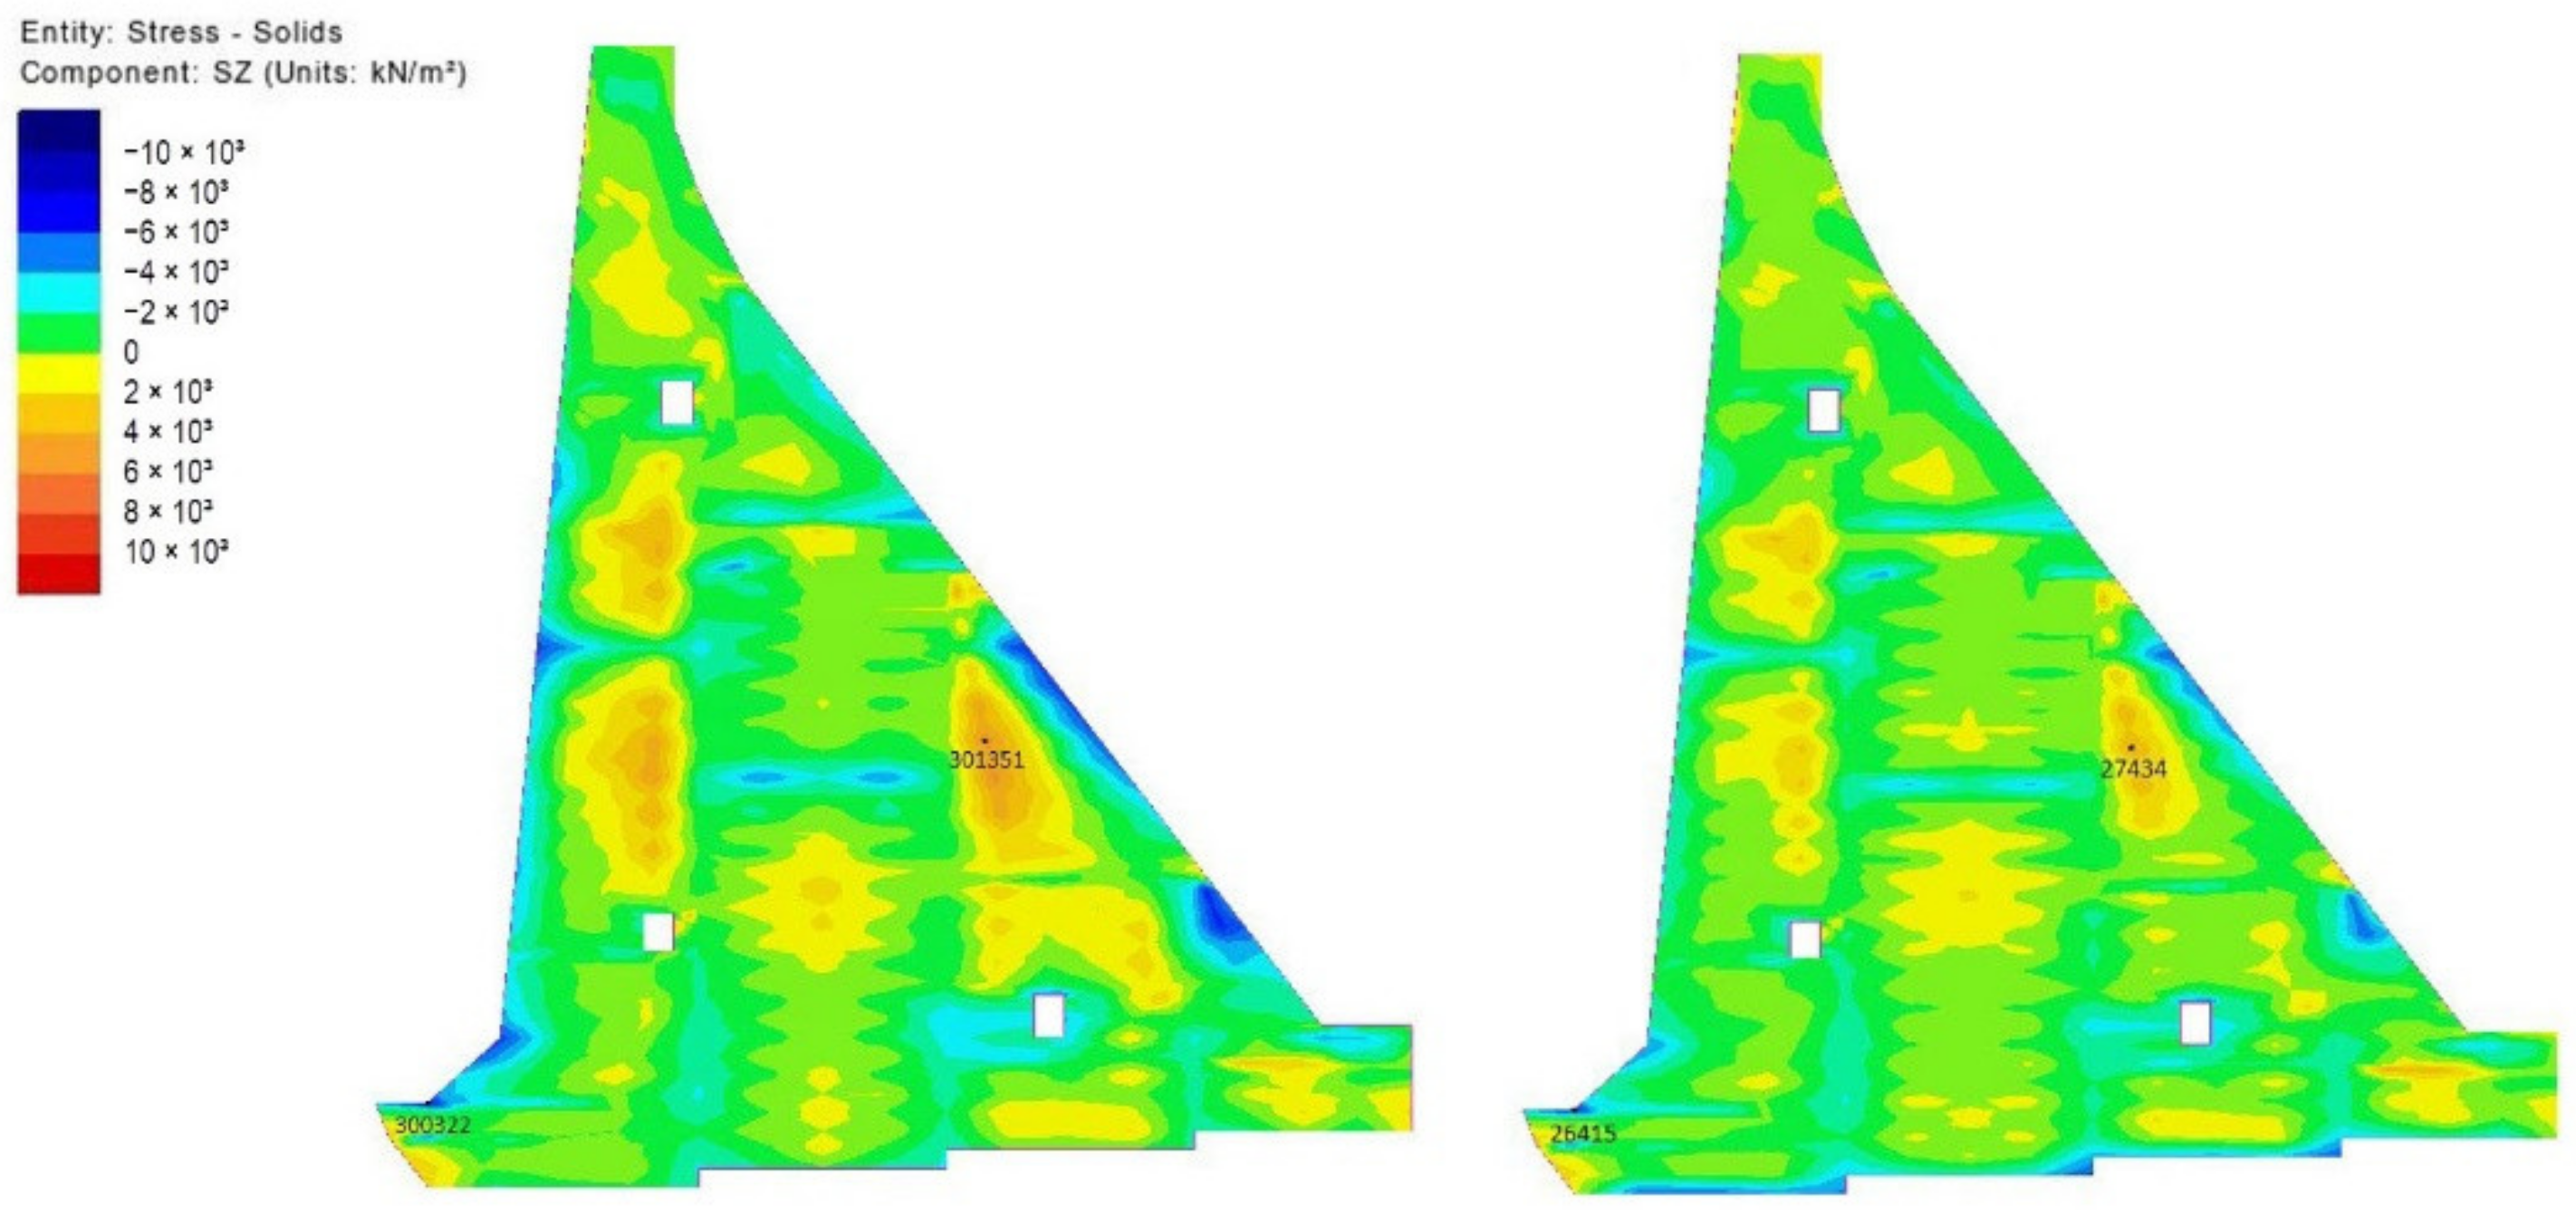
Figure 22.
Stresses in the mid-plane of the monolith 20 m long (left) and 15 m long (right) for the 1080th day (2nd of October of the fourth year); extremums: nodes 301,351 and 27,434.
Figure 22.
Stresses in the mid-plane of the monolith 20 m long (left) and 15 m long (right) for the 1080th day (2nd of October of the fourth year); extremums: nodes 301,351 and 27,434.
Figure 23.
Stresses in the mid-plane of the monolith 20 m long (left) and 15 m long (right) for the 1804th day (25th of September of the sixth year); extremums: nodes 301,351 and 27,434.
Figure 23.
Stresses in the mid-plane of the monolith 20 m long (left) and 15 m long (right) for the 1804th day (25th of September of the sixth year); extremums: nodes 301,351 and 27,434.
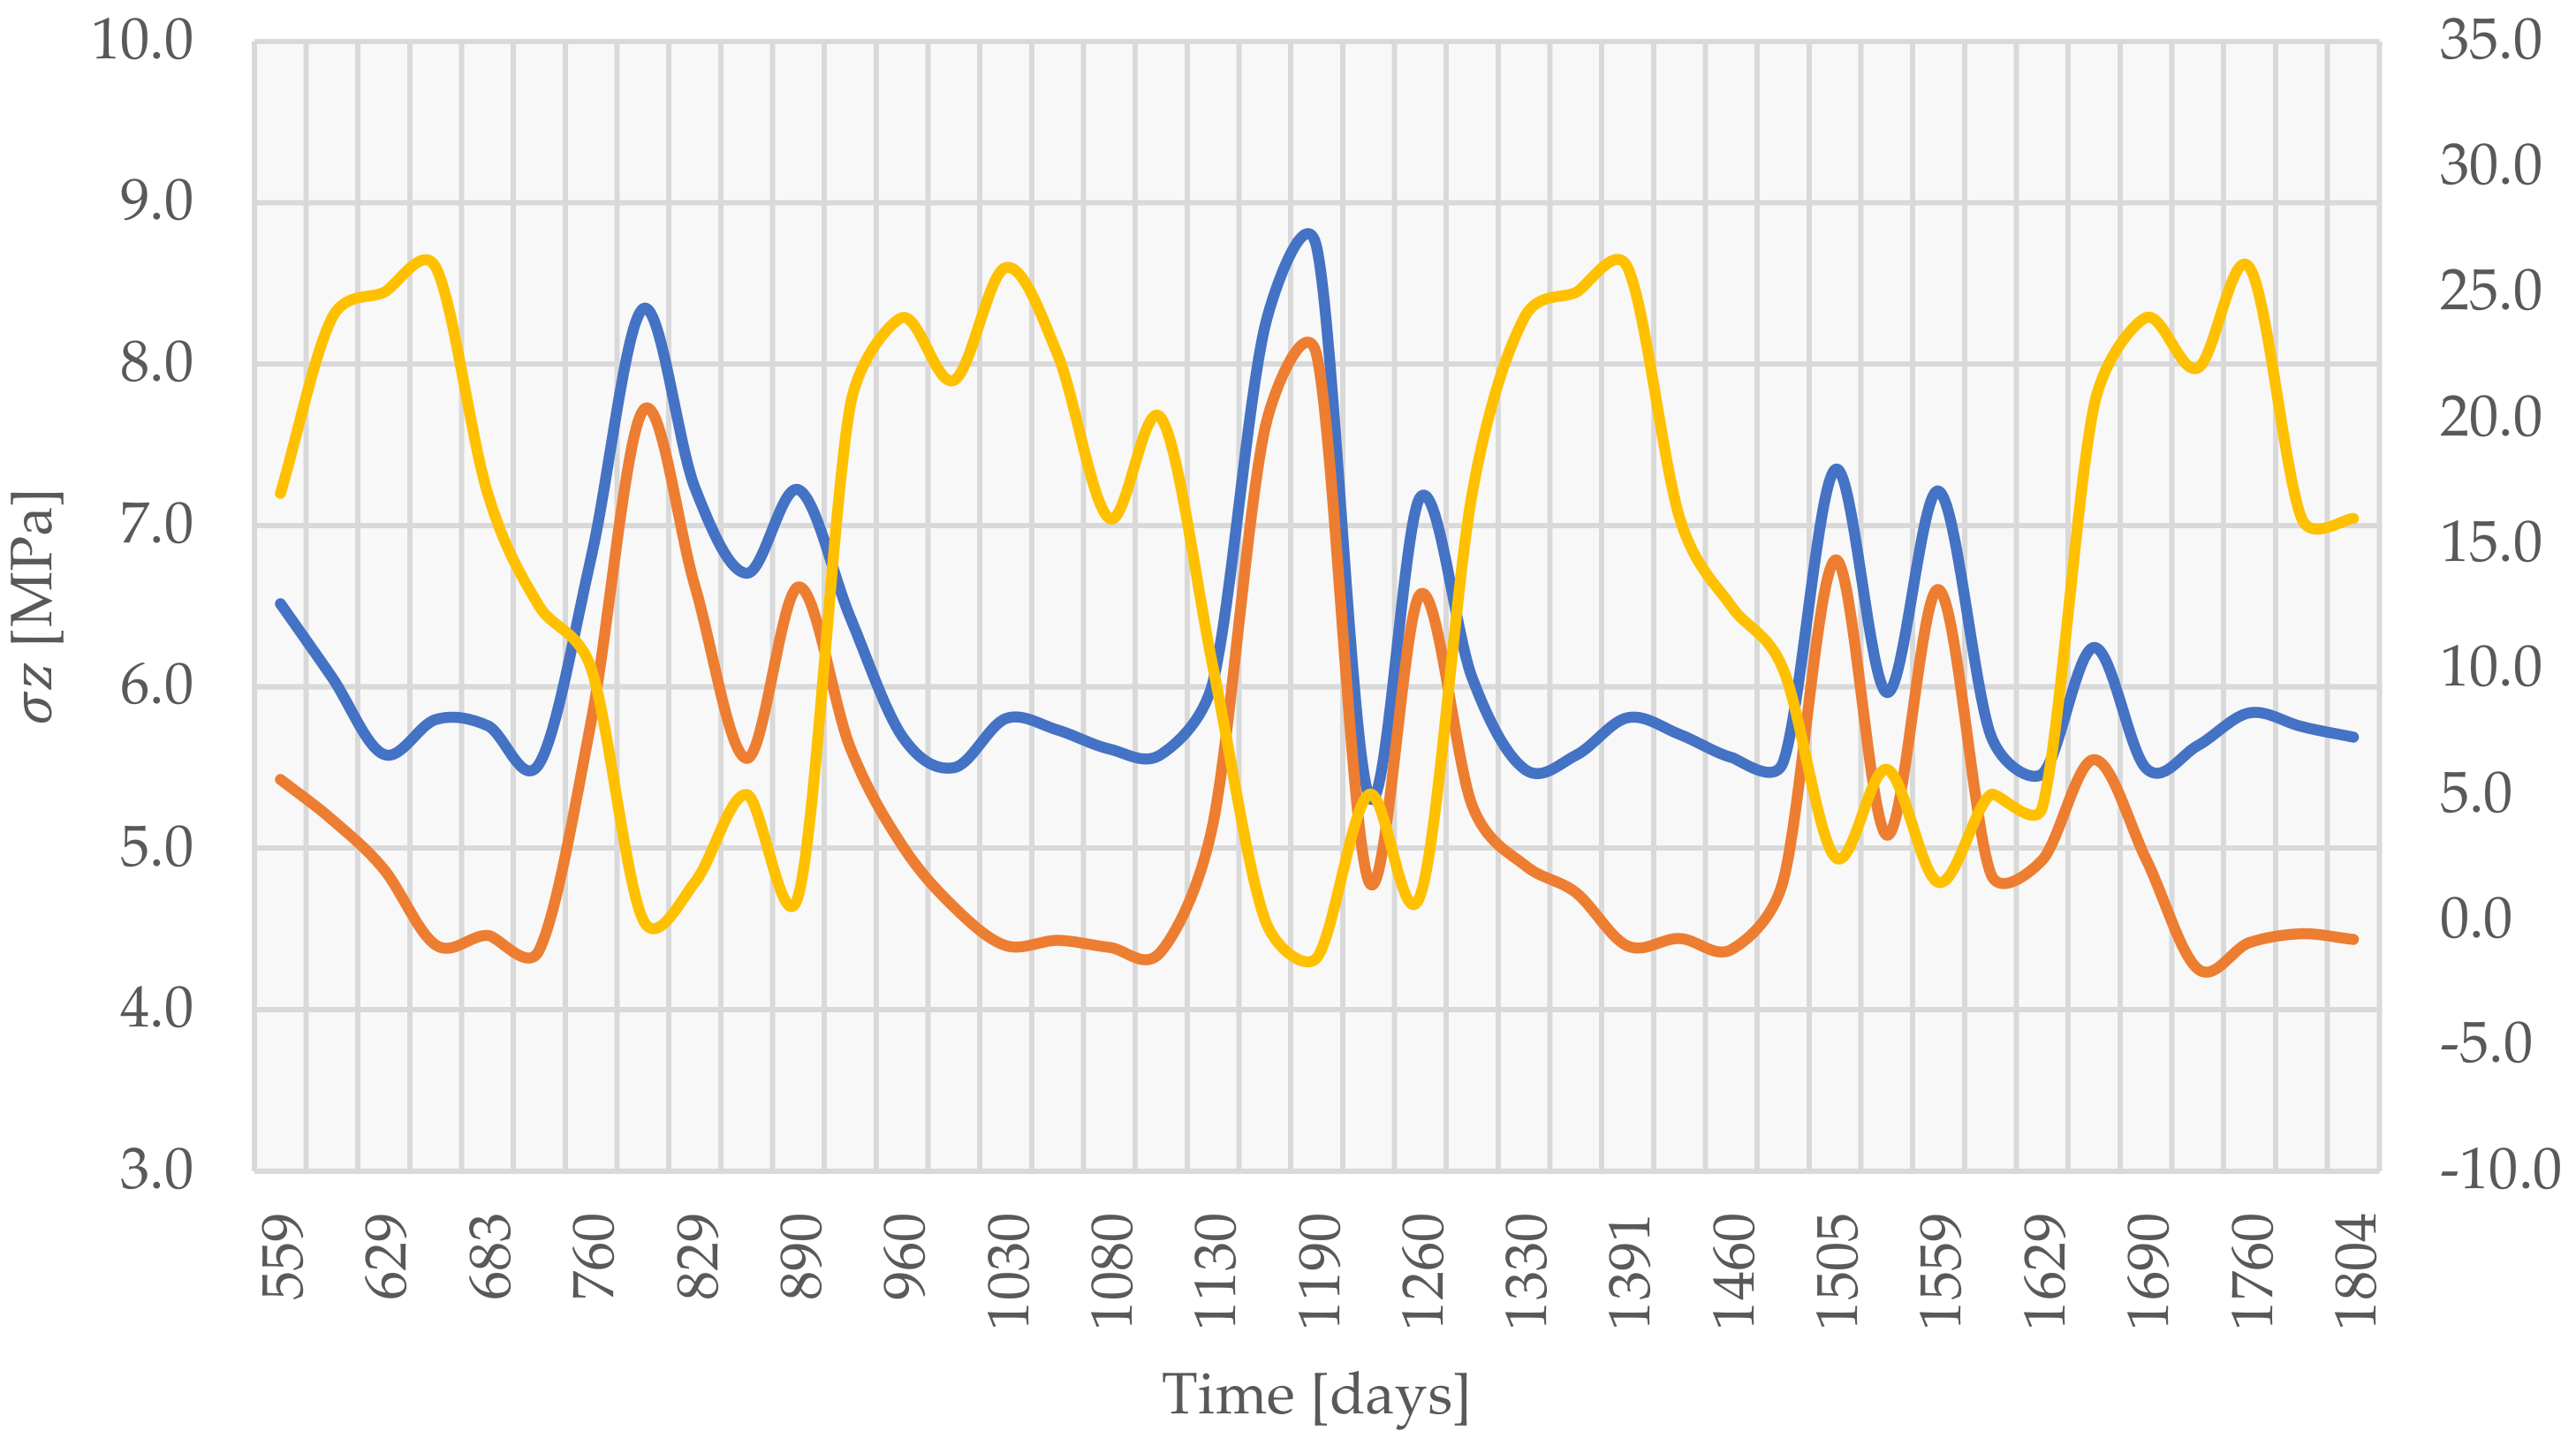
Figure 24.
Extreme values of [MPa] as a function of the time period after the completion of construction (blue—monolith length 20.0 m; orange—monolith length 15.0 m; yellow—ambient temperature ).
Figure 24.
Extreme values of [MPa] as a function of the time period after the completion of construction (blue—monolith length 20.0 m; orange—monolith length 15.0 m; yellow—ambient temperature ).
Figure 25.
The difference between extreme values of [MPa] between two monolith lengths as a function of the time period after the completion of construction (grey) and ambient temperature (yellow).
Figure 25.
The difference between extreme values of [MPa] between two monolith lengths as a function of the time period after the completion of construction (grey) and ambient temperature (yellow).
Figure 26.
Extreme values of [MPa] as a function of ambient temperatures [°C] (blue—monolith length 20.0 m; orange—monolith length 15.0 m).
Figure 26.
Extreme values of [MPa] as a function of ambient temperatures [°C] (blue—monolith length 20.0 m; orange—monolith length 15.0 m).
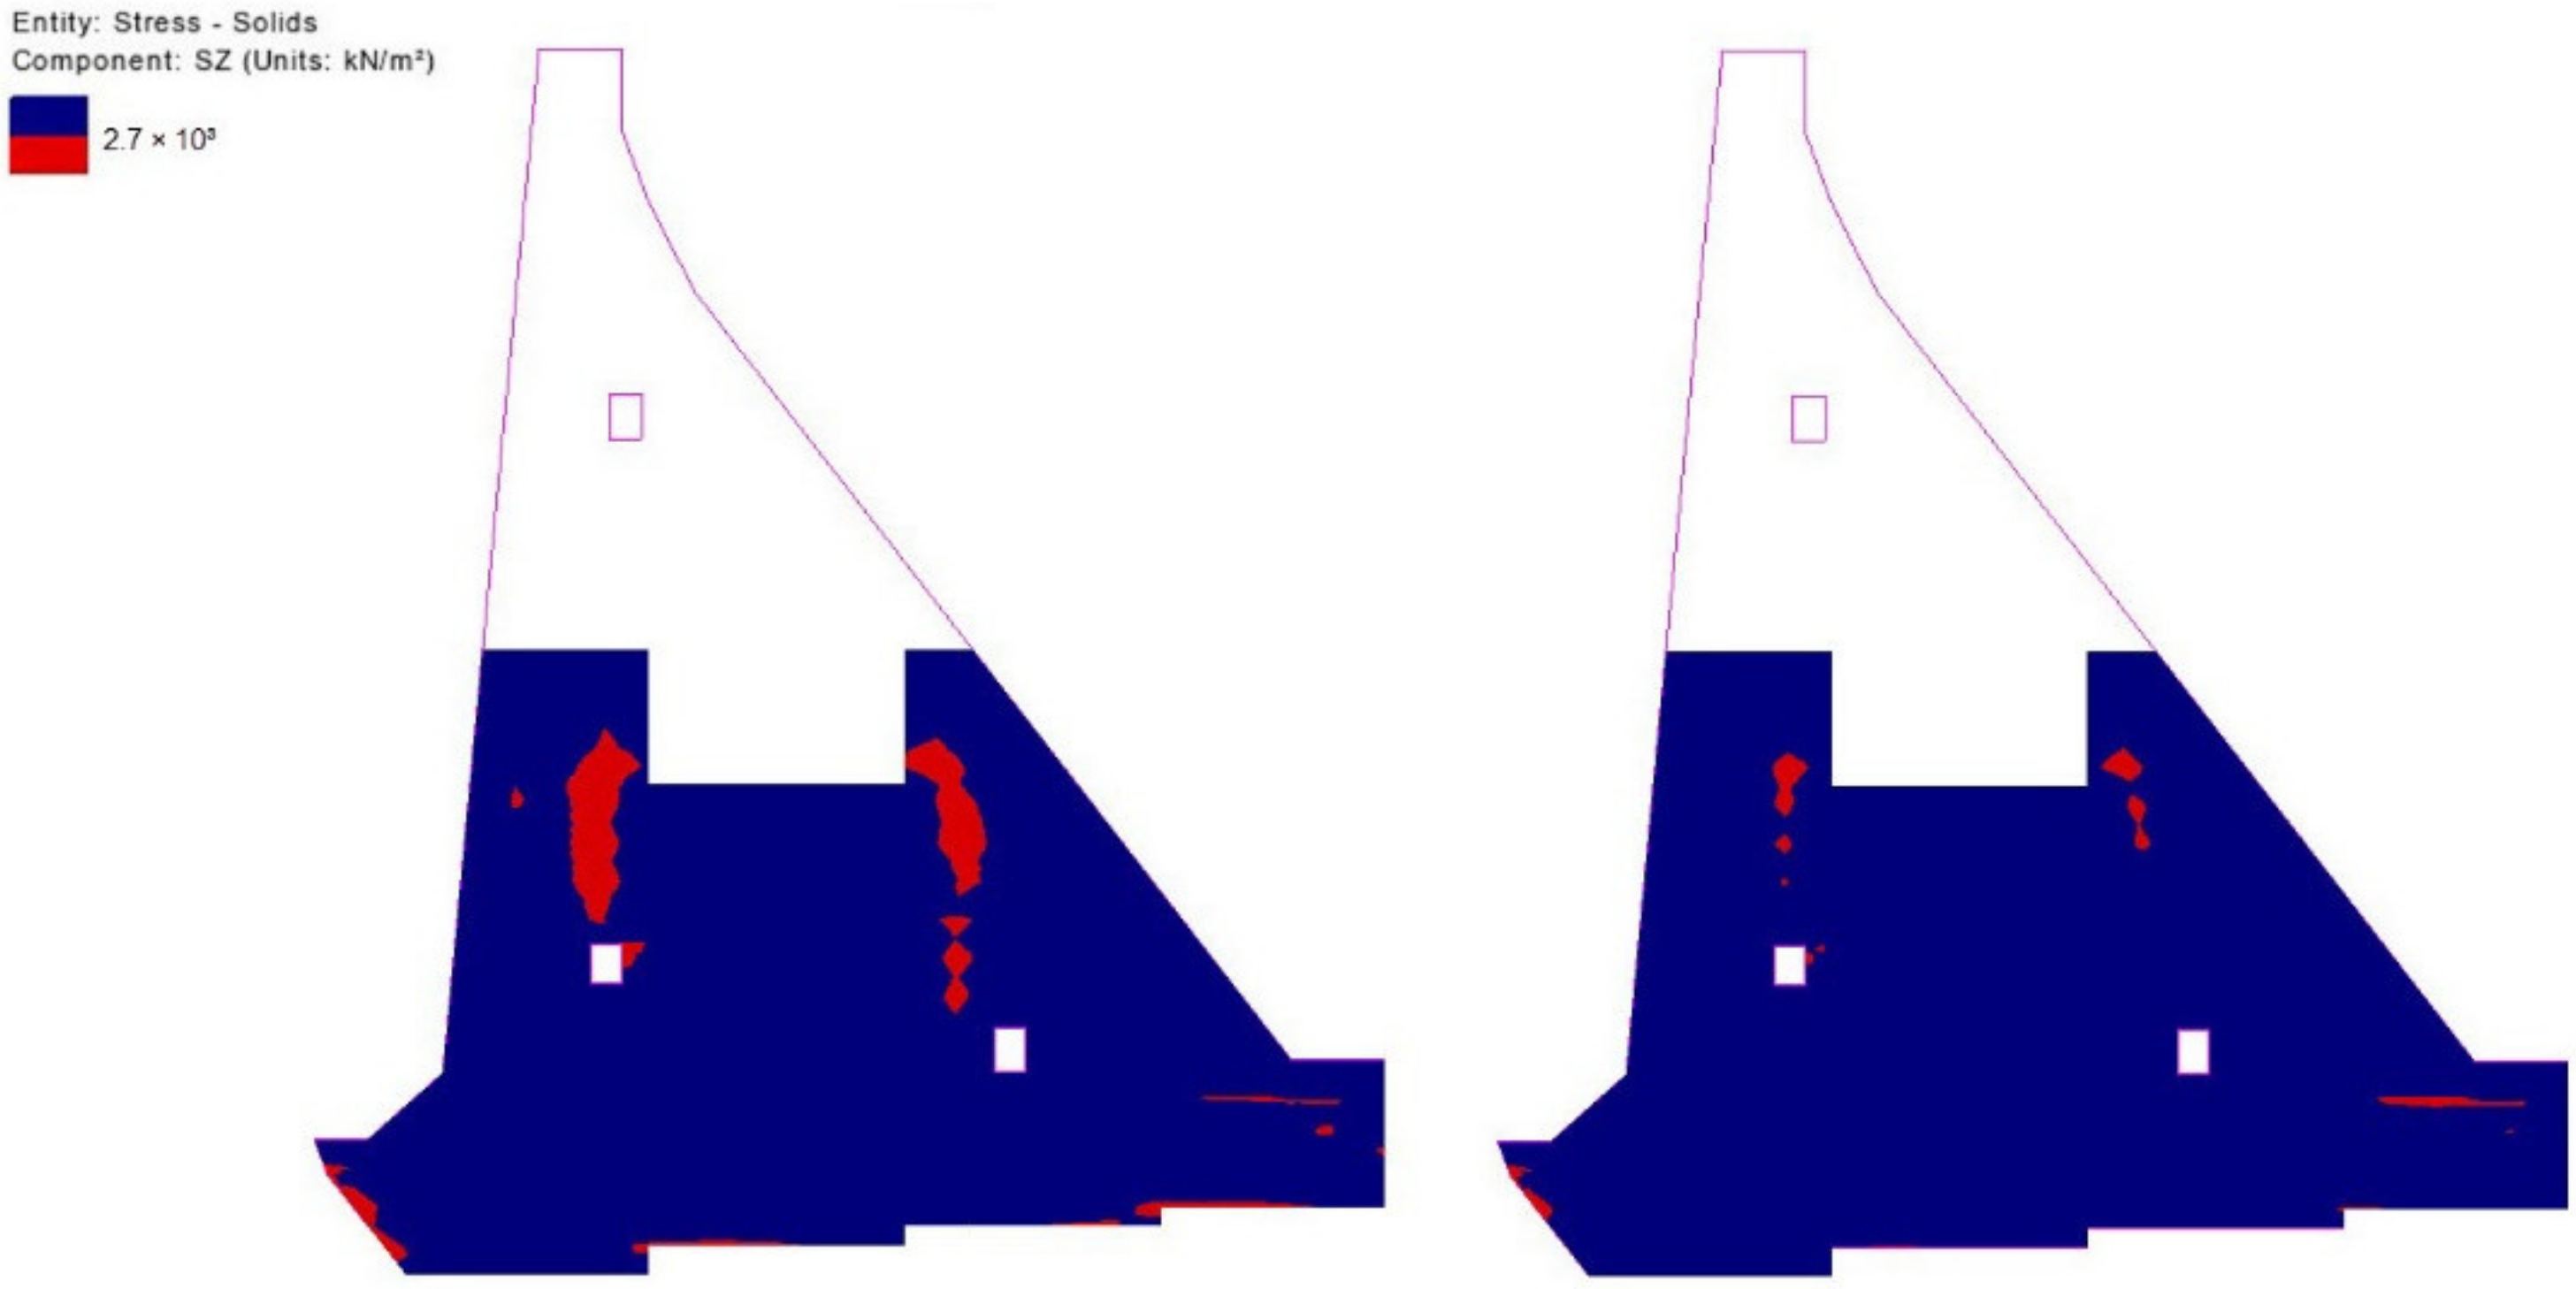
Figure 27.
Zones in which the concrete tensile resistance is exceeded (red) in the mid-plane of the monolith 20 m long (left) and 15 m (right) for the 84th day from the beginning of construction (10th of January of the second year).
Figure 27.
Zones in which the concrete tensile resistance is exceeded (red) in the mid-plane of the monolith 20 m long (left) and 15 m (right) for the 84th day from the beginning of construction (10th of January of the second year).
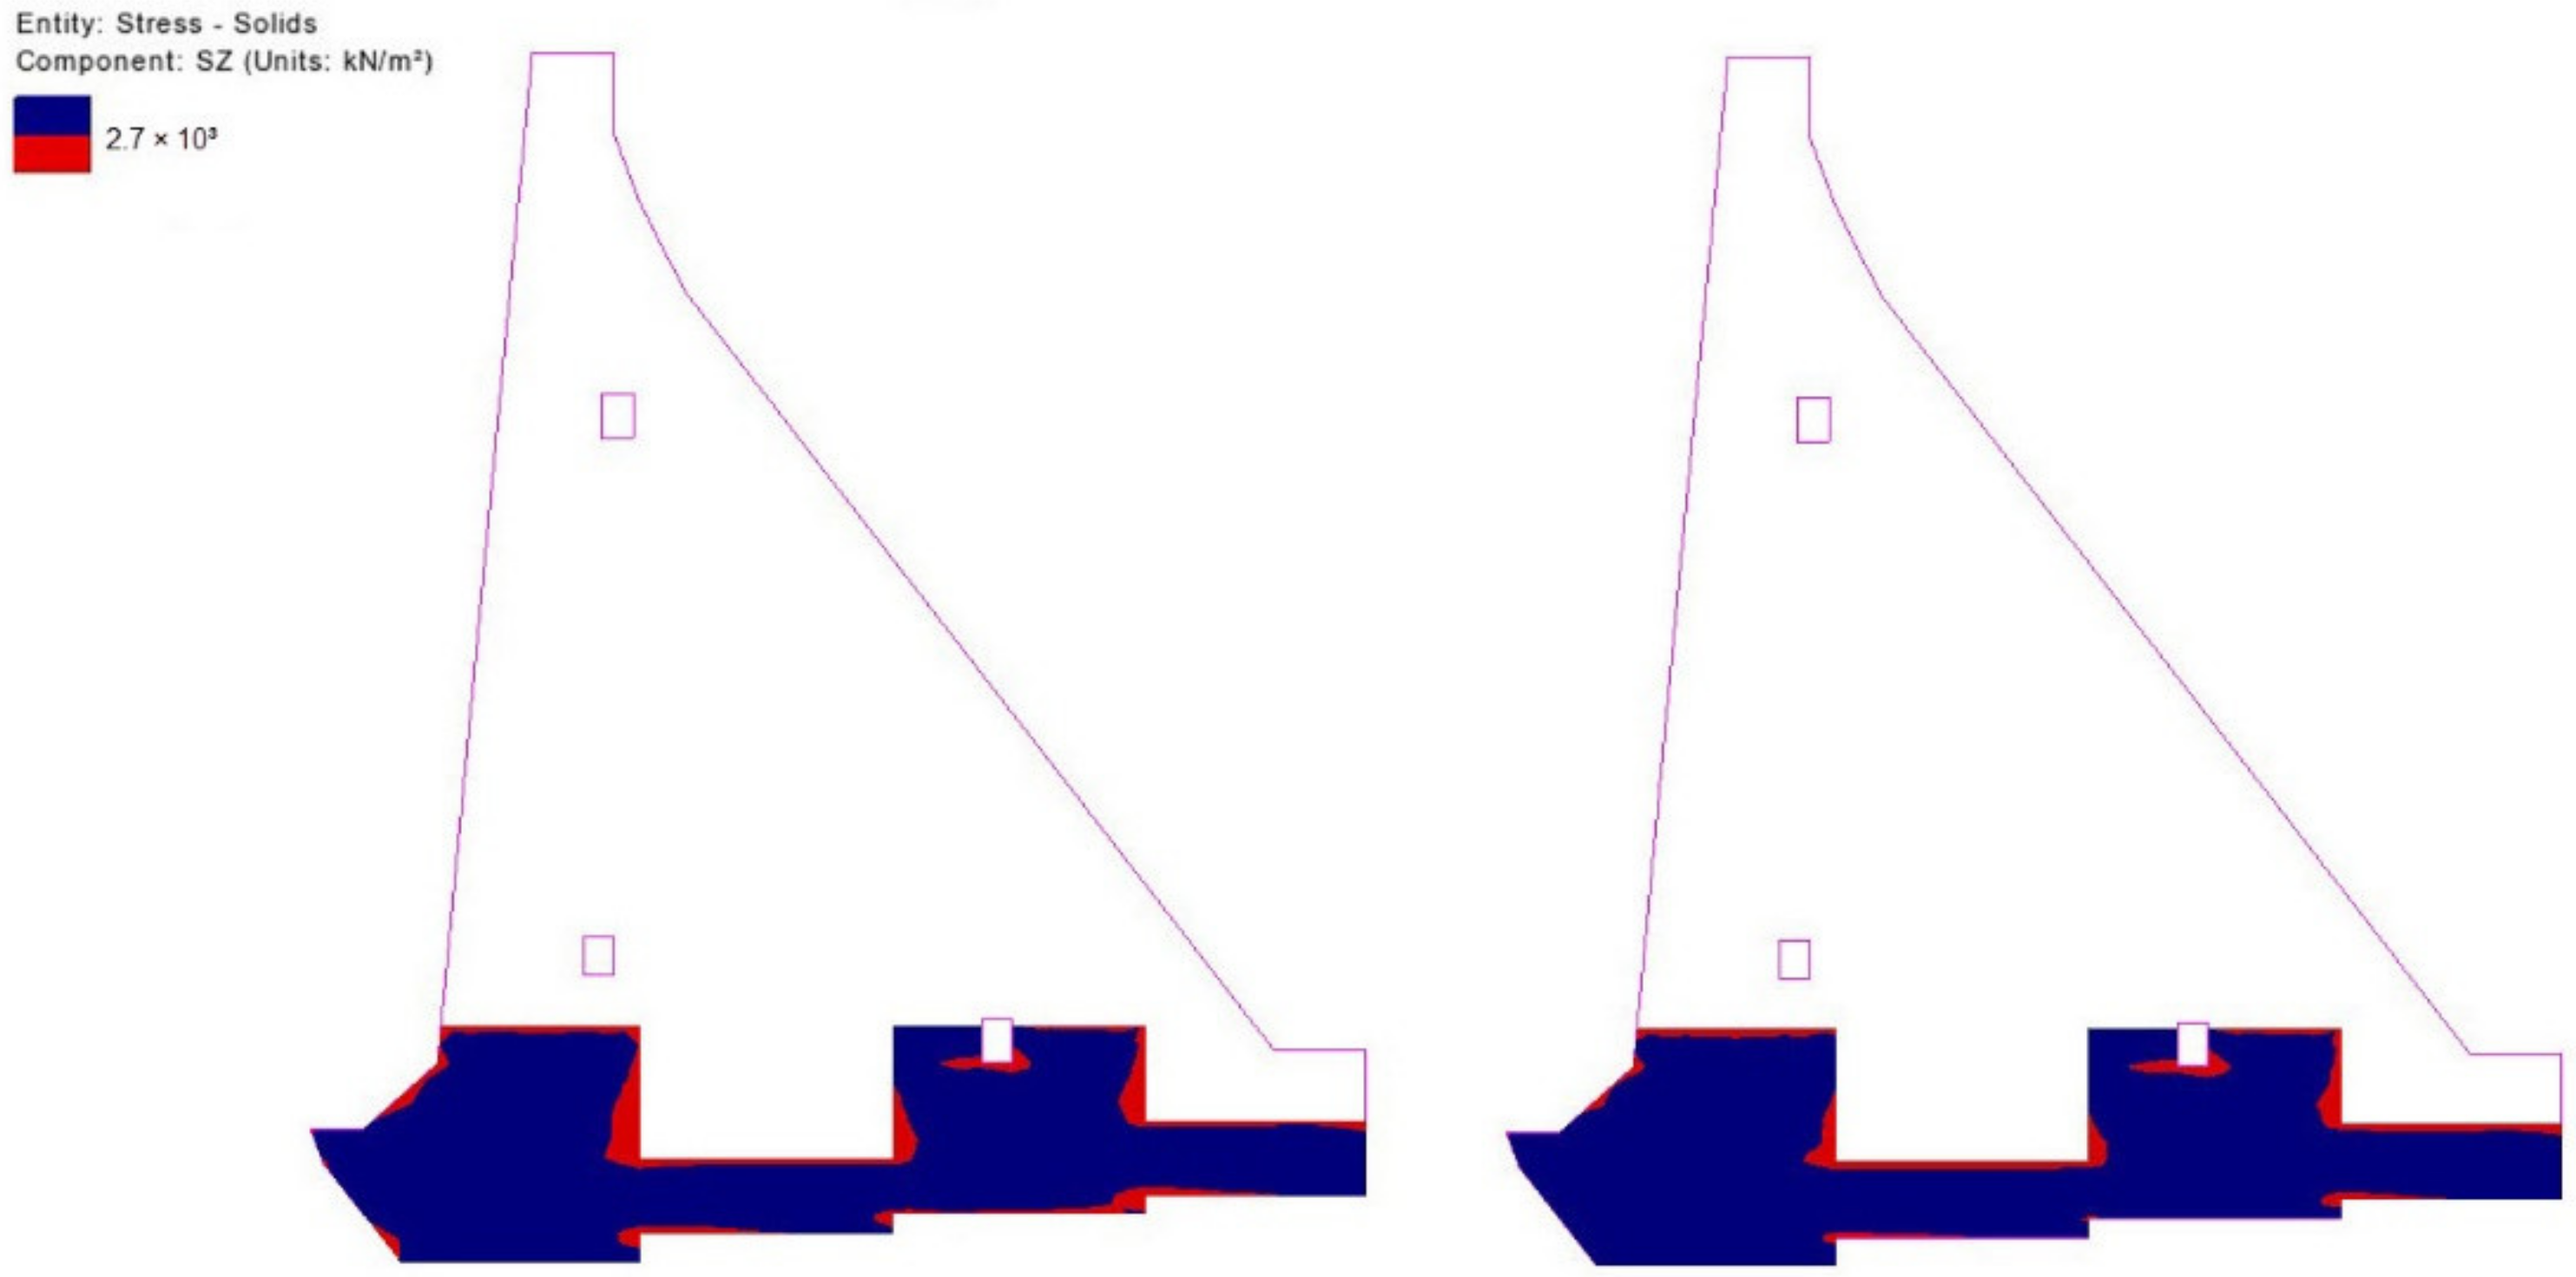
Figure 28.
Zones in which the concrete tensile resistance is exceeded (red) in the mid-plane of the monolith 20 m long (left) and 15 m long (right) for the 283rd day from the beginning of construction (27th of July of the second year).
Figure 28.
Zones in which the concrete tensile resistance is exceeded (red) in the mid-plane of the monolith 20 m long (left) and 15 m long (right) for the 283rd day from the beginning of construction (27th of July of the second year).
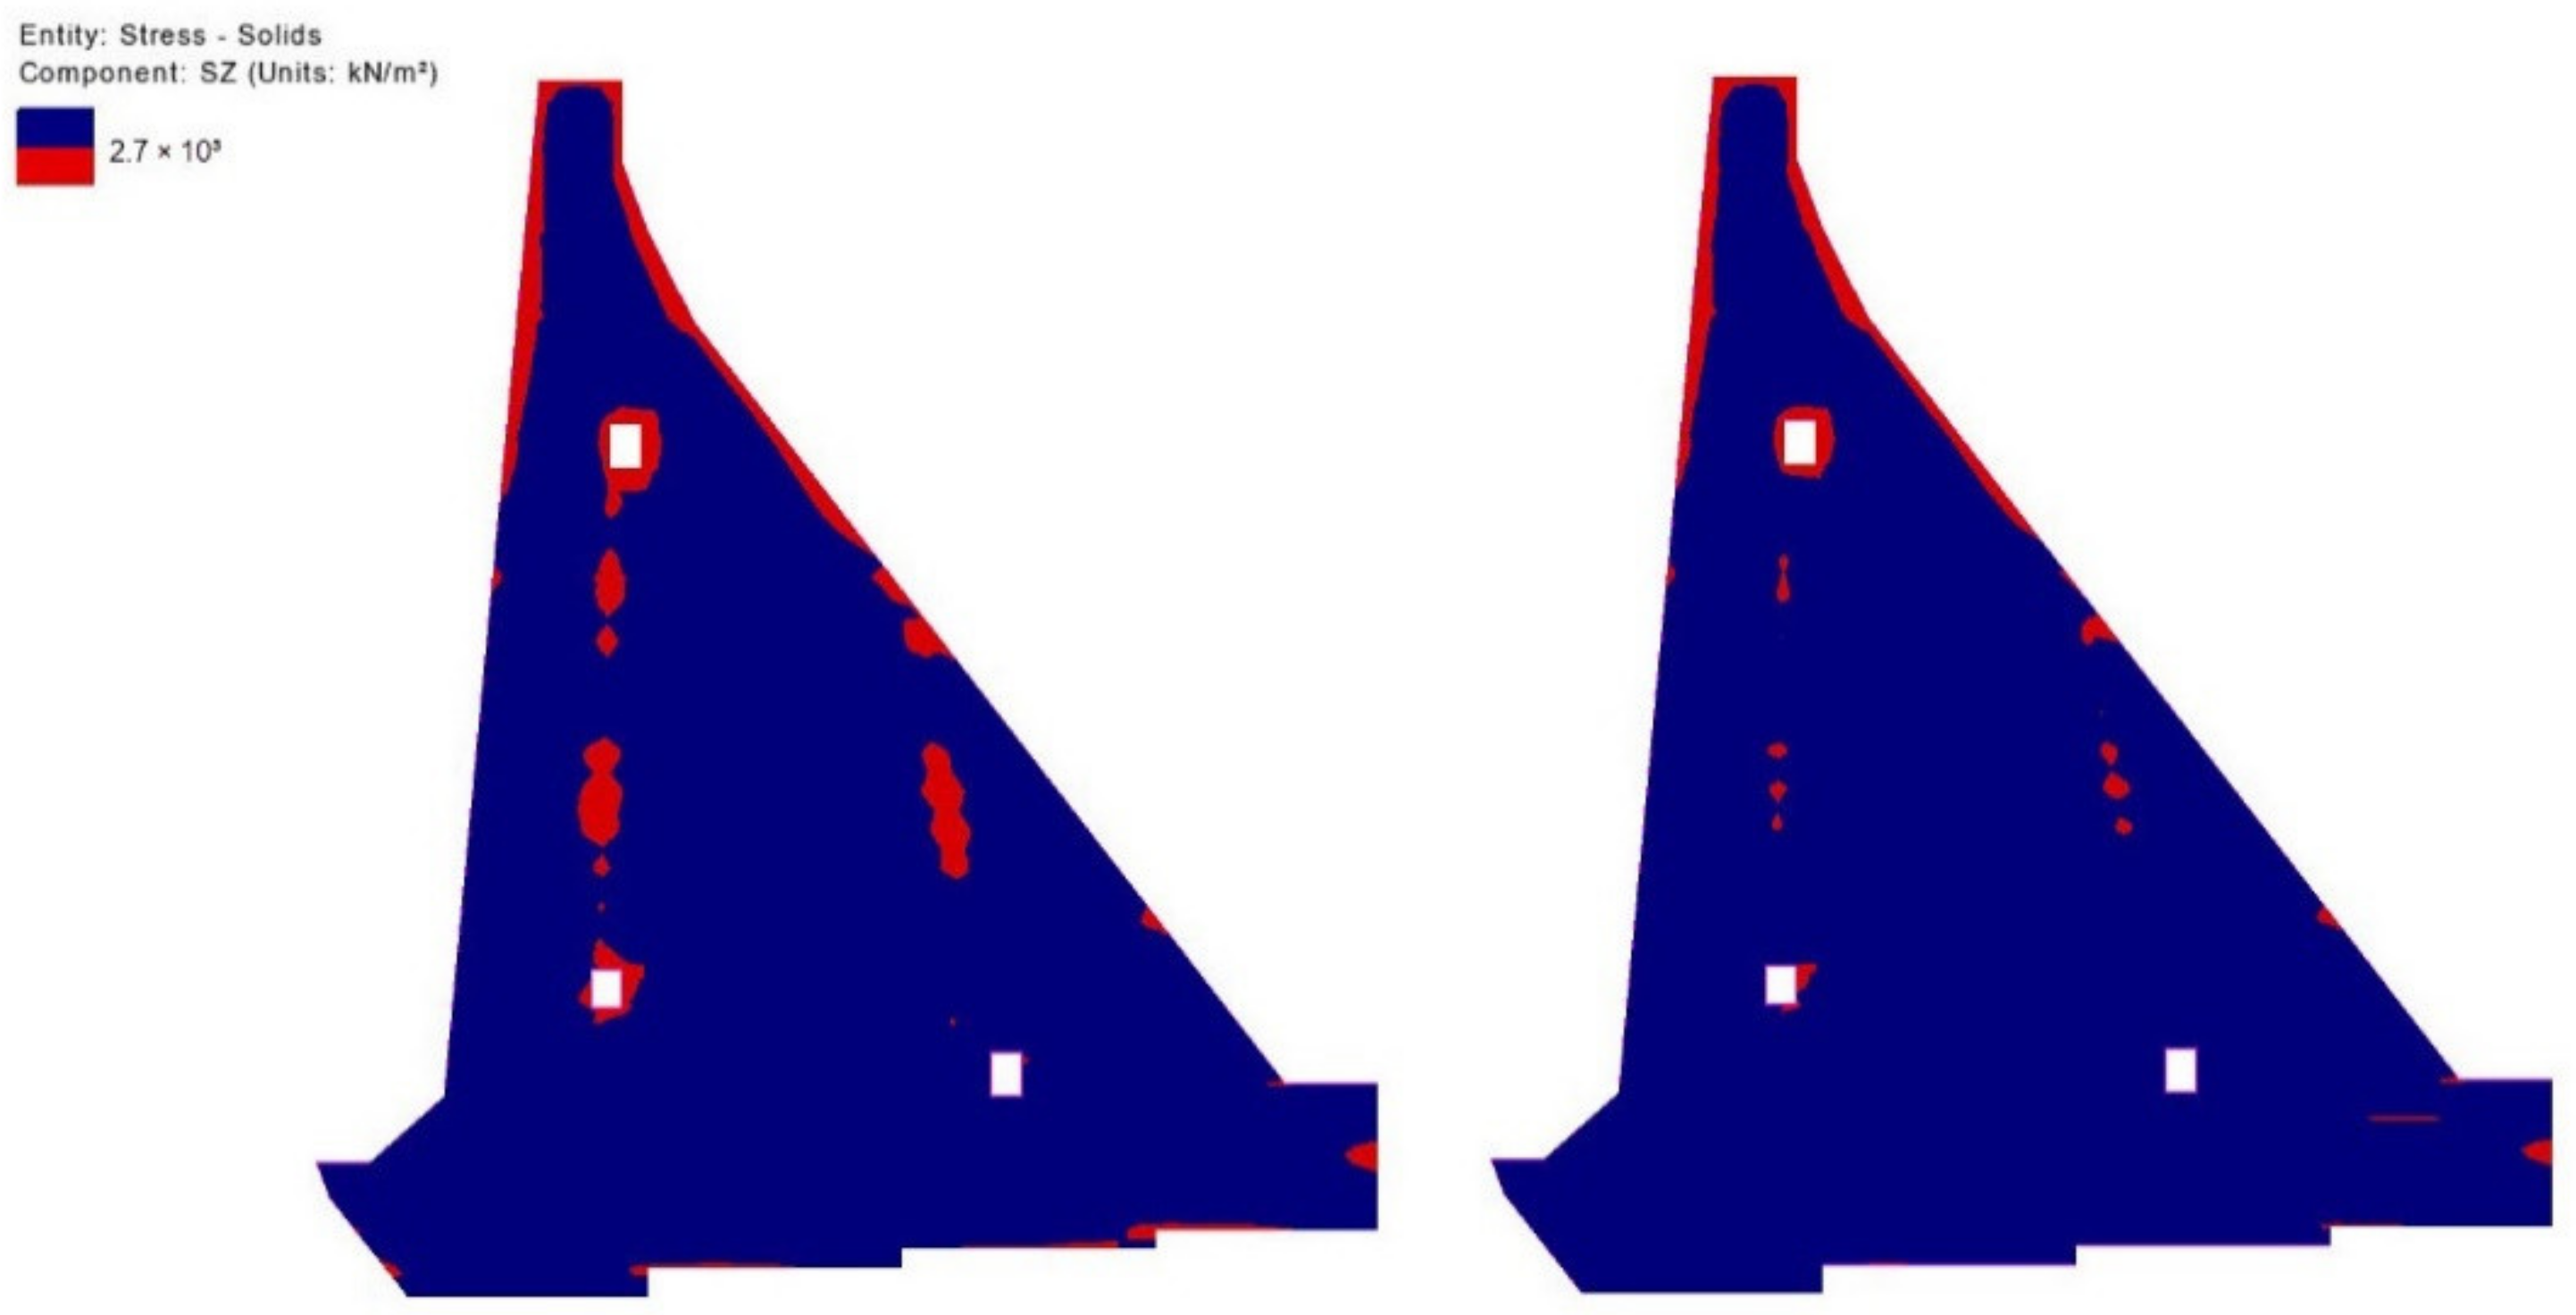
Figure 29.
Zones in which the concrete tensile resistance is exceeded (red) in the mid-plane of the monolith 20 m long (left) and 15 m long (right) for the 512th day from the beginning of construction (13th of March of the third year).
Figure 29.
Zones in which the concrete tensile resistance is exceeded (red) in the mid-plane of the monolith 20 m long (left) and 15 m long (right) for the 512th day from the beginning of construction (13th of March of the third year).
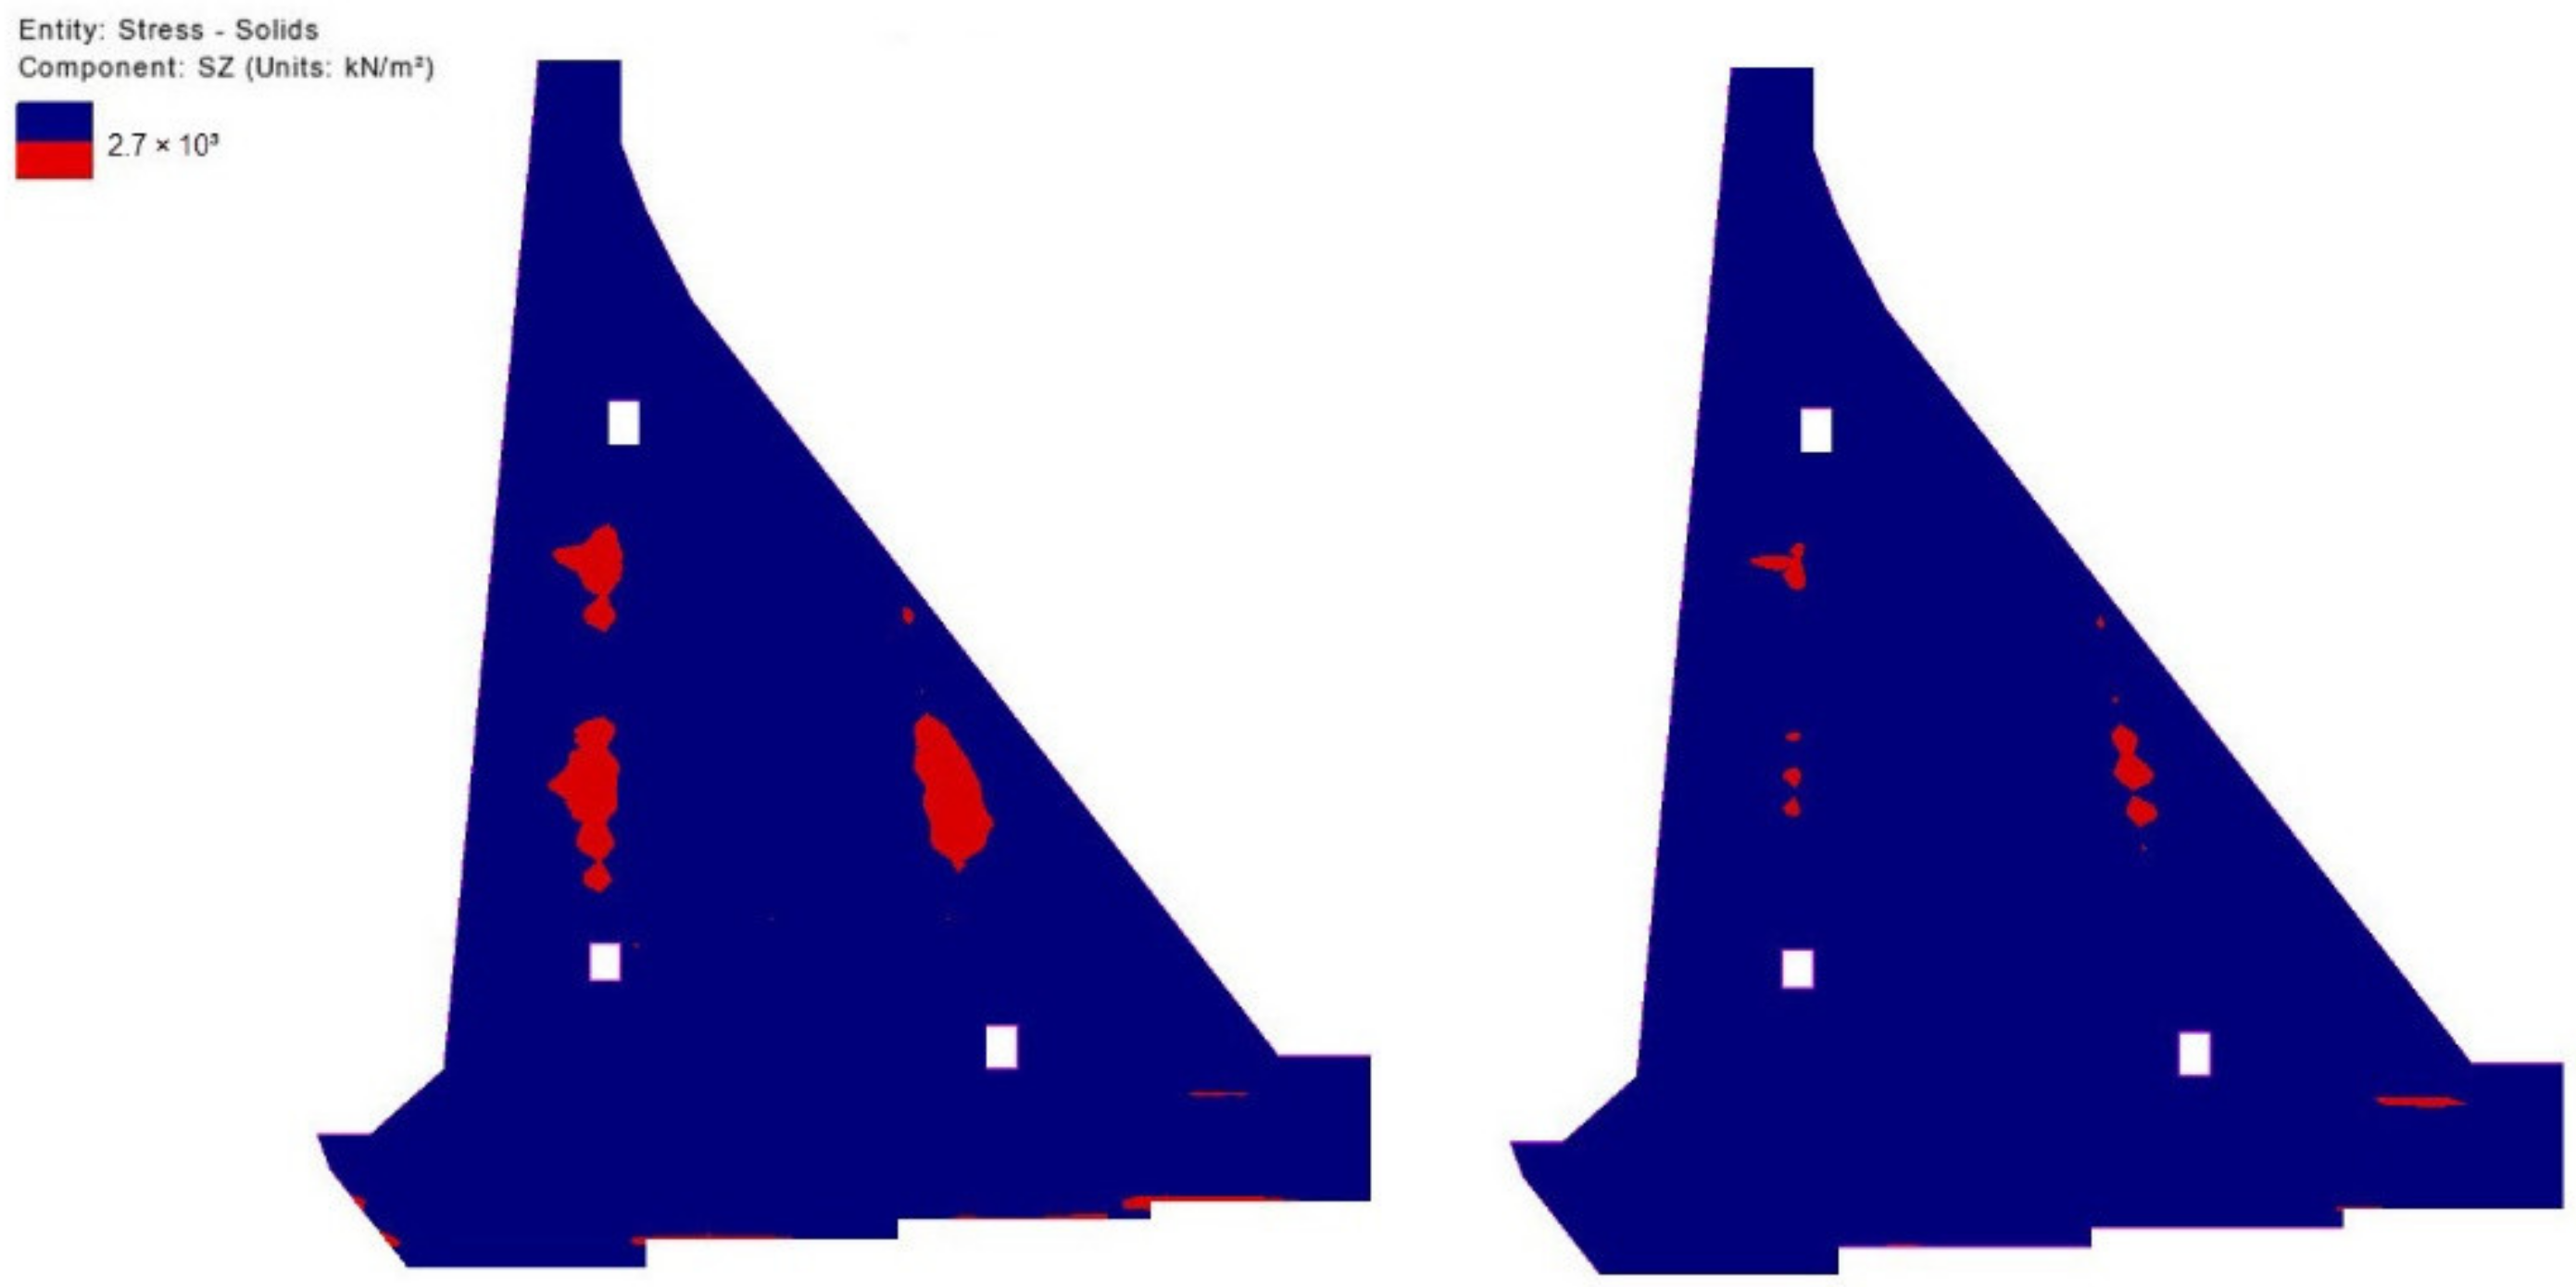
Figure 30.
Zones in which the concrete tensile resistance is exceeded (red) in the mid-plane of the monolith 20 m long (left) and 15 m long (right) for the 1080th day from the beginning of construction (2nd of October of the fourth year).
Figure 30.
Zones in which the concrete tensile resistance is exceeded (red) in the mid-plane of the monolith 20 m long (left) and 15 m long (right) for the 1080th day from the beginning of construction (2nd of October of the fourth year).
Figure 31.
Zones in which the concrete tensile resistance is exceeded (red) in the mid-plane of the monolith 20 m long (left) and 15 m long (right) for the 1804th day from the beginning of construction (25th of September of the sixth year).
Figure 31.
Zones in which the concrete tensile resistance is exceeded (red) in the mid-plane of the monolith 20 m long (left) and 15 m long (right) for the 1804th day from the beginning of construction (25th of September of the sixth year).
Table 1.
Measured ambient temperatures [°C].
Table 1.
Measured ambient temperatures [°C].
| Date/Time | 2 | 4 | 6 | 8 | 10 | 12 | 14 | 16 | 18 | 20 | 22 | 24 |
|---|
| X 8-23 | 10.2 | 11.5 | 12.7 | 13.9 | 15.5 | 18.0 | 20.5 | 19.0 | 15.4 | 12.4 | 10.7 | 9.0 |
| X-XI 23-8 | 4.2 | 5.4 | 6.7 | 7.9 | 9.1 | 9.5 | 10.0 | 9.4 | 7.5 | 5.4 | 4.2 | 3.0 |
| XI 8-23 | 4.6 | 5.2 | 5.8 | 6.5 | 7.4 | 9.0 | 10.6 | 9.6 | 7.9 | 6.4 | 5.2 | 4.0 |
| XI-XII 23-8 | 2.2 | 2.4 | 2.6 | 2.8 | 3.3 | 4.5 | 5.8 | 5.4 | 4.5 | 3.7 | 2.8 | 2.0 |
| XII 8-23 | 0.0 | 0.0 | 0.0 | 0.0 | 0.4 | 2.5 | 4.5 | 3.6 | 2.5 | 1.8 | 1.0 | 0.0 |
| XII-I 23-8 | 6.2 | 6.4 | 6.6 | 6.8 | 7.1 | 7.5 | 7.9 | 7.3 | 7.0 | 6.8 | 6.4 | 6.0 |
| I 8-23 | −1.8 | −1.6 | −1.4 | −1.2 | −0.5 | 1.5 | 3.6 | 3.3 | 2.7 | −0.4 | −1.2 | −2.0 |
| I-II 23-8 | 1.2 | 1.4 | 1.6 | 1.8 | 2.2 | 3.0 | 3.8 | 3.3 | 2.5 | 1.8 | 1.5 | 1.0 |
| II 8-23 | 2.0 | 2.0 | 2.0 | 2.0 | 2.4 | 4.0 | 5.6 | 5.4 | 4.5 | 3.6 | 2.9 | 2.0 |
| II-III 23-8 | 0.2 | 0.4 | 0.6 | 0.8 | 1.4 | 3.4 | 5.6 | 5.4 | 4.5 | 3.3 | 1.6 | 0.0 |
| III 8-18 | 1.2 | 1.4 | 1.6 | 1.8 | 2.3 | 3.5 | 4.8 | 3.7 | 2.5 | 2.0 | 1.6 | 1.0 |
| III 18-31 | 1.0 | 1.0 | 1.0 | 1.0 | 1.2 | 2.5 | 3.7 | 4.0 | 4.0 | 3.5 | 2.2 | 1.0 |
| IV 1-14 | 4.6 | 4.7 | 4.8 | 4.9 | 5.4 | 7.5 | 9.6 | 10.0 | 9.0 | 7.4 | 6.0 | 4.5 |
| IV 15-28 | 4.6 | 4.2 | 3.7 | 3.3 | 3.9 | 8.5 | 13.1 | 14.0 | 13.5 | 11.7 | 8.3 | 5.0 |
| IV-V 29-11 | 15.2 | 16.0 | 16.7 | 17.4 | 18.4 | 20.5 | 22.6 | 23.0 | 21.5 | 19.1 | 16.8 | 14.5 |
| V 12-26 | 13.0 | 14.1 | 15.1 | 16.2 | 17.7 | 21.0 | 24.3 | 24.3 | 23.0 | 20.3 | 16.2 | 12.0 |
| V-VI 27-9 | 15.2 | 14.9 | 14.6 | 14.2 | 14.9 | 19.5 | 24.1 | 25.0 | 24.0 | 21.7 | 18.6 | 15.5 |
| VI 10-24 | 17.0 | 17.0 | 17.0 | 17.0 | 17.9 | 22.5 | 27.1 | 28.0 | 26.5 | 23.7 | 20.3 | 17.0 |
| VI-VII 25-7 | 21.2 | 20.9 | 20.6 | 20.2 | 21.0 | 26.0 | 31.0 | 31.3 | 29.5 | 26.9 | 24.2 | 21.5 |
| VII 8-22 | 24.0 | 22.9 | 21.9 | 20.8 | 20.9 | 25.5 | 30.1 | 30.1 | 28.5 | 26.7 | 25.8 | 25.0 |
| VII-VIII 23-5 | 20.7 | 19.5 | 20.0 | 21.7 | 23.8 | 28.0 | 32.2 | 33.0 | 32.0 | 29.5 | 25.7 | 22.0 |
| VIII 6-19 | 20.3 | 18.7 | 19.0 | 20.7 | 22.7 | 26.0 | 29.3 | 30.7 | 29.5 | 27.0 | 24.5 | 22.0 |
| VIII-IX 20-2 | 16.2 | 15.3 | 16.0 | 17.7 | 19.6 | 22.5 | 25.4 | 24.7 | 23.5 | 22.0 | 19.5 | 17.0 |
| IX 3-9 | 15.2 | 14.3 | 14.7 | 16.0 | 17.5 | 20.0 | 22.5 | 23.0 | 22.0 | 20.2 | 18.1 | 16.0 |
Table 2.
Measured mean monthly temperatures of air inside the galleries [°C].
Table 2.
Measured mean monthly temperatures of air inside the galleries [°C].
| Month | I | II | III | IV | V | VI | VII | VIII | IX | X | XI | XII |
|---|
| T (°C) | 10 | 10 | 12 | 14 | 16 | 20 | 22 | 22 | 20 | 16 | 12 | 10 |
Table 3.
Measured mean monthly fresh concrete mix temperatures T(x,y,z,τ = 0) [°C].
Table 3.
Measured mean monthly fresh concrete mix temperatures T(x,y,z,τ = 0) [°C].
| Month | X | XI | XII | I | II | III | IV | V | VI |
|---|
| T (°C) | 10.0 | 9.7 | 9.5 | 9.5 | 9.7 | 9.7 | 12.3 | 13.1 | 12.9 |
Table 4.
Concrete thermal parameters.
Table 4.
Concrete thermal parameters.
| Parameter | Meaning | Value | Unit |
|---|
| k | Thermal conductivity coefficient | 1.80 | W/(m K) |
| c | Specific heat capacity | 950.0 | J/(kg K) |
| α | Coefficient of thermal expansion | 11.5·10−6 | 1/°C |
| h | Combined convective heat transfer coefficient | 20.10 | W/(m2 K) |
| Tref | Reference temperature | 13.0 | °C |
Table 5.
Concrete hydration analysis parameters.
Table 5.
Concrete hydration analysis parameters.
| Meaning | Value | Unit |
|---|
Cement ratio (type I) in the concrete mass
M (for Portland cement) | 50 | kg/m3 |
| 12.5·10−3 | 1/h |
Water-cement ratio
Fly ash ratio in the concrete mass | 0.47 | - |
| 225.0 | kg/m3 |
| CaO ratio in the fly ash | 17.0 | % |
Table 6.
Rock mass thermal parameters.
Table 6.
Rock mass thermal parameters.
| Parameter | Meaning | Value | Unit |
|---|
| k | Thermal conductivity coefficient | 2.40 | W/(m K) |
| c | Specific heat capacity | 880.0 | J/(kg K) |
| α | Coefficient of thermal expansion | 9.0·10−6 | 1/°C |
Table 7.
Concrete parameters used in SF analysis.
Table 7.
Concrete parameters used in SF analysis.
| Parameter | Meaning | Value | Unit |
|---|
| Volume density | 2360.0 | kg/m3 |
| E | Elastic modulus | 30.0 | GPa |
| ν | Poisson’s ratio | 0.20 | - |
Table 8.
Rock mass parameters used in SF analysis.
Table 8.
Rock mass parameters used in SF analysis.
| Parameter | Meaning | Value | Unit |
|---|
| Volume density | 2430.0 | kg/m3 |
| E | Elastic modulus | 20.0 | GPa |
| ν | Poisson’s ratio | 0.20 | - |


