Article

Biocompatibility and Antioxidant Capabilities of Carbon Dots Obtained from Tomato (Solanum lycopersicum)

by
Sandra Rodríguez-Varillas
1,
Tania Fontanil
2,3,
Álvaro J. Obaya
4,
Alfonso Fernández-González
1,
Clarissa Murru
1 and
Rosana Badía-Laíño
1,*
1
Departamento de Química Física y Analítica, Universidad de Oviedo, 33006 Oviedo, Spain
2
Departamento de Investigación, Instituto Ordóñez (ASTRACIME S.L), 33006 Oviedo, Spain
3
Departamento de Bioquímica y Biología Molecular, Universidad de Oviedo, 33006 Oviedo, Spain
4
Departamento de Biología Funcional, Universidad de Oviedo, 33006 Oviedo, Spain
*
Author to whom correspondence should be addressed.
Appl. Sci. 2022, 12(2), 773; https://doi.org/10.3390/app12020773
Submission received: 17 December 2021 / Revised: 5 January 2022 / Accepted: 10 January 2022 / Published: 13 January 2022
(This article belongs to the Special Issue Nanochemistry: A Chemical Approach to Nanomaterials)

Abstract

:
Since their discovery in 2004, carbon dots have attracted strong interest in the scientific community due to their characteristic properties, particularly their luminescence and their ease of synthesis and derivatization. Carbon dots can be obtained from different carbon sources, including natural products, resulting in a so-called ’green synthesis’. In this work, we obtain carbon dots from tomato juice in order to obtain nanoparticles with the antioxidant capabilities of the natural antioxidants present in that fruit. The obtained material is characterized regarding nanoparticle size distribution, morphology, surface functional groups and optic properties. Antioxidant properties are also evaluated through the DPPH method and their cytotoxicity is checked against human dermal fibroblast and A549 cell-lines. The results indicate that carbon dots obtained from tomato have a higher antioxidant power than other already-published antioxidant carbon dots. The bandgap of the synthesized materials was also estimated and coherent with the literature values. Moreover, carbon dots obtained from tomato juice are barely toxic for healthy cells up to 72 h, while they induce a certain cytotoxicity in A549 lung carcinoma cells.

1. Introduction

Carbon dots (CDs) were serendipitously discovered in 2004 by professor Scrievens during the purification by electrophoresis of single wall carbon nanotubes [1]. CDs are nanospheres with a diameter usually below 10 nm. They are made of carbon, with small amounts of other heteroatoms such as H, N and O appearing on the surface. Structurally, they have a graphitic core with sp2 hybridization coating and a crust of amorphous carbon [2]. This nanomaterial presents very interesting properties such as high water solubility, low toxicity, characteristic luminescent properties, high biocompatibility, high chemical stability and easy functionalization. Those properties also arise from the nano-size and surface functional groups, and can therefore be modified or even ‘tuned’ according to the synthesis pathway, reaction condition (temperature, time) or the reagents used, which is mainly the carbon source. Thus, CDs constitute a powerful tool in many scientific fields such as controlled drug delivery [3], clinic diagnose [4,5], catalysis [6], bioimaging [7] and energy conversion [8], among others. Moreover, CDs can be easily synthesized following the 12 principles of ‘green chemistry’, as proposed by Anastas and Warner in 1998 [9], which seek the reduction in use and generation of dangerous substances.
The concept of ‘green-chemistry’ evolved and originated from the term ‘sustainable chemistry’, which was defined by the Organization for Economic Co-operation and Development, OECD, as “a scientific concept that seeks to improve the efficiency with which natural resources are used to meet human needs for chemical products and services. Sustainable chemistry encompasses the design, manufacture and use of efficient, effective, safe, and more environmentally benign chemical products and processes” [10]. The synthesis of sustainable carbon dots usually follows a bottom-up approach, with methods such as microwave-assisted pyrolysis, ultrasonication or hydrothermal/solvothermal decomposition. Hydrothermal decomposition is one of the most used and studied methodologies. Carbon dots obtained by this pathway form through a four-stage process: dehydration, polymerization, carbonization and passivation [11]. In the first stage, heating breaks the hydrogen bonds between the molecules, which convert into graphitic core during polymerization and carbonization. These cores grow by diffusion of other molecules to the surface. Furthermore, the cores passivate themselves and, therefore, no strong acids or passivation processes are required afterwards [12].
On the other hand, biocompatible antioxidant materials that could have pharmacologic applications are of paramount importance, as oxidative stress and reactive species of oxygen (ROS) are known agents of pathologies such as inflammatory processes, cancer or even aging [13,14].
The use of natural products such as tomato juice in order to obtain water-soluble biocompatible anti-oxidant nanomaterials is, therefore, consistent with the sustainable chemistry philosophy. Tomato is the second most raised vegetable in the world, just after potato. It is an extraordinary source of antioxidants, including carotenoids (α-carotene, β-carotene, lycopene and lutein) and phenolic compounds (phenolic acids, flavonoids and tannins), although the most important one is lycopene, since it presents the most antioxidant power, a higher ability to quench atomic oxygen and constitutes between 80% and 90% of total carotenoids in ripe tomatoes [15]. Thus, the synthesis of CDs from tomato (TCDs) juice is expected to show a high antioxidant capability. Likewise, taking into account the biocompatible origin of the carbon source, TCDs are expected to maintain their high biocompatibility. Tomato has already been successfully used to produce luminescent and crystalline carbon dots using the whole fruit [16,17]; however, in this article, we propose the synthesis of antioxidant, biocompatible, sustainable carbon dots obtained from tomato juice as a carbon source and evaluate these characteristics as well as their morphology and spectroscopic features.

2. Materials and Methods

2.1. Instruments and Solutions

2,2-Diphenyl-1-picrylhydrazyl (DPPH) and the dialysis tubes Pur-A-Lyzer (1 kDa MWCO) were purchased from Sigma-Aldrich. Sodium hydroxide and absolute ethanol were from VWR, potassium dihydrogen phosphate was from Merck, boric acid was from Probus and 10× Dulbeco’s Phosphate Buffered Saline (10× DPBS) was from Thermo Fisher Scientific. Cell proliferation was evaluated with a Kit Cell Titer 96 Non-Radioactive Cell Proliferation Assay from Promega. Glutathione (GSH) and citric acid (CA) were obtained from Sigma-Aldrich and Acros Organics, respectively.
Absorption measurements of the aqueous suspensions of carbon dots were taken in a Cary 60 UV-Vis spectrophotometer from Agilent Technologies (Palo Alto, CA, USA). Excitation and emission luminescence spectra were obtained with a Varian Cary Eclipse (Agilent Technologies), whereas the quantum yields were determined using an FS5 spectrofluorimeter from Edinburgh Instruments.
FTIR spectra were taken in a Varian 670-IR (Agilent Technologies) and the size distribution histogram was established through high-resolution transmission electron microscope (HRTEM) images taken with a MET JEOL-JEM 2100 F and ImageJ free software, analyzing 100 nanoparticles per image.

2.2. Carbon Dot Synthesis

Tomato-based carbon dots (TCDs) were synthesized according to the following protocol: 20 mL of freshly obtained tomato juice was put into a 100 mL Teflon-lined stainless-steel autoclave, and then left in an oven at 160 °C for 3 h. Then, it was left to cool down overnight, and the tube contents was centrifuged at 4500 rpm for 30 min, discarding the solids. The supernatant was neutralized with 1 M NaOH and then gravity-filtrated through a 2 µm pore. Afterwards, the solution was filtrated once more with a 0.22 µm pore cellulose acetate syringe filter. This final solution was purified by dialysis against 400 mL milli-Q water using an MWCO: 1 kDa dialysis membrane for 20 h. Water was kept under stirring at 200 rpm during the dialysis. The purified solution was lyophilized and the final yellow solid containing the carbon dots was kept in the fridge at 4 °C until further use.
As a reference for antioxidant nanoparticles, we selected glutathione-based CDs (GCD) synthesized accordingly to the protocol already described by C. Murru et al. [18]. Briefly, a mixture of 1 g GSH and 1 g CA was dissolved into 10 mL milliQ water and poured into a crucible. The solution was then kept at 180 °C for 5 h, adding 1 mL milliQ water every hour in order to avoid the solid scorching. The final material was dialyzed and freeze dried.

2.3. Luminescence Experiments

Luminescence experiments were carried out in a pH range from 3 to 11. In order to use the same medium at a different pH, a mixture of citric acid, potassium dihydrogen phosphate and boric acid (0.5M each) was prepared, and the pH was adjusted to the desired value using 1 M NaOH. Then, the proper amount of buffer was mixed with the carbon dots so as to have a nanoparticle suspension in a 0.17 M buffer solution.

2.4. Evaluation of the Antioxidant Capacity

The antioxidant capacities of the TCDs were evaluated by a colorimetric assay based on the discoloration of the oxidized form of DPPH (violet) to its reduced form (yellow form). The higher the number of antioxidants, the yellower the color of the final solution. Then, 250 μL of a 10−4 M DPPH solution was mixed with growing concentrations of the tested material (TCDs), and the absorbance at 517 nm was measured after a 30 min reaction. The DPPH inhibition percentage was calculated with the formula
Inhibition% = (Ab − Am)·100/Ab
where Ab is the absorbance of the blank and Am is the absorbance of the corresponding solution at the indicated wavelength [19].

2.5. In Vitro Studies

Human dermal fibroblasts (healthy cells) were purchased from Innoprot and A549 cells (lung cancer cells) were kindly provided by Dr Carlos López-Otín (Universidad de Oviedo). All cells were routinely cultured in an incubator at 37 °C, in a 5% CO2 atmosphere and in DMEM medium containing 10% heat-inactivated fetal bovine serum, supplemented with 100 U/mL penicillin and 50 μg/mL streptomycin from Gibco Life Technologies (Complete Cell Medium). These incubation conditions and cell medium composition are described as standard conditions throughout the paper.

2.6. Cytotoxicity Assay

Cytotoxicity was evaluated through an MTT assay. In this assay, different concentrations of the material to be tested are brought into contact with cell lines, which must be kept in the controlled conditions described in 2.5. Likewise, cells were in incubated in complete cell medium to allow for normal cell growth. Then, the yellow salt MTT was added to cells and converted into insoluble blue formazan crystals ((E,Z)-5-(4.5-dimethylthiazol-2-yl)-1,3-difenilformazan) if the mitochondrial succinic dehydrogenase enzyme was active. The absorbance at 570 nm was measured to calculate the percentage of surviving cells according to the formula:
Surviving cells% = Cell viability% = ASample·100/AControl
where ASample is the average absorption of the sample at 570 nm and AControl is the average absorption at the same wavelength of the control cells.
Toxicity% = 100 − surviving cells%

3. Results and Discussion

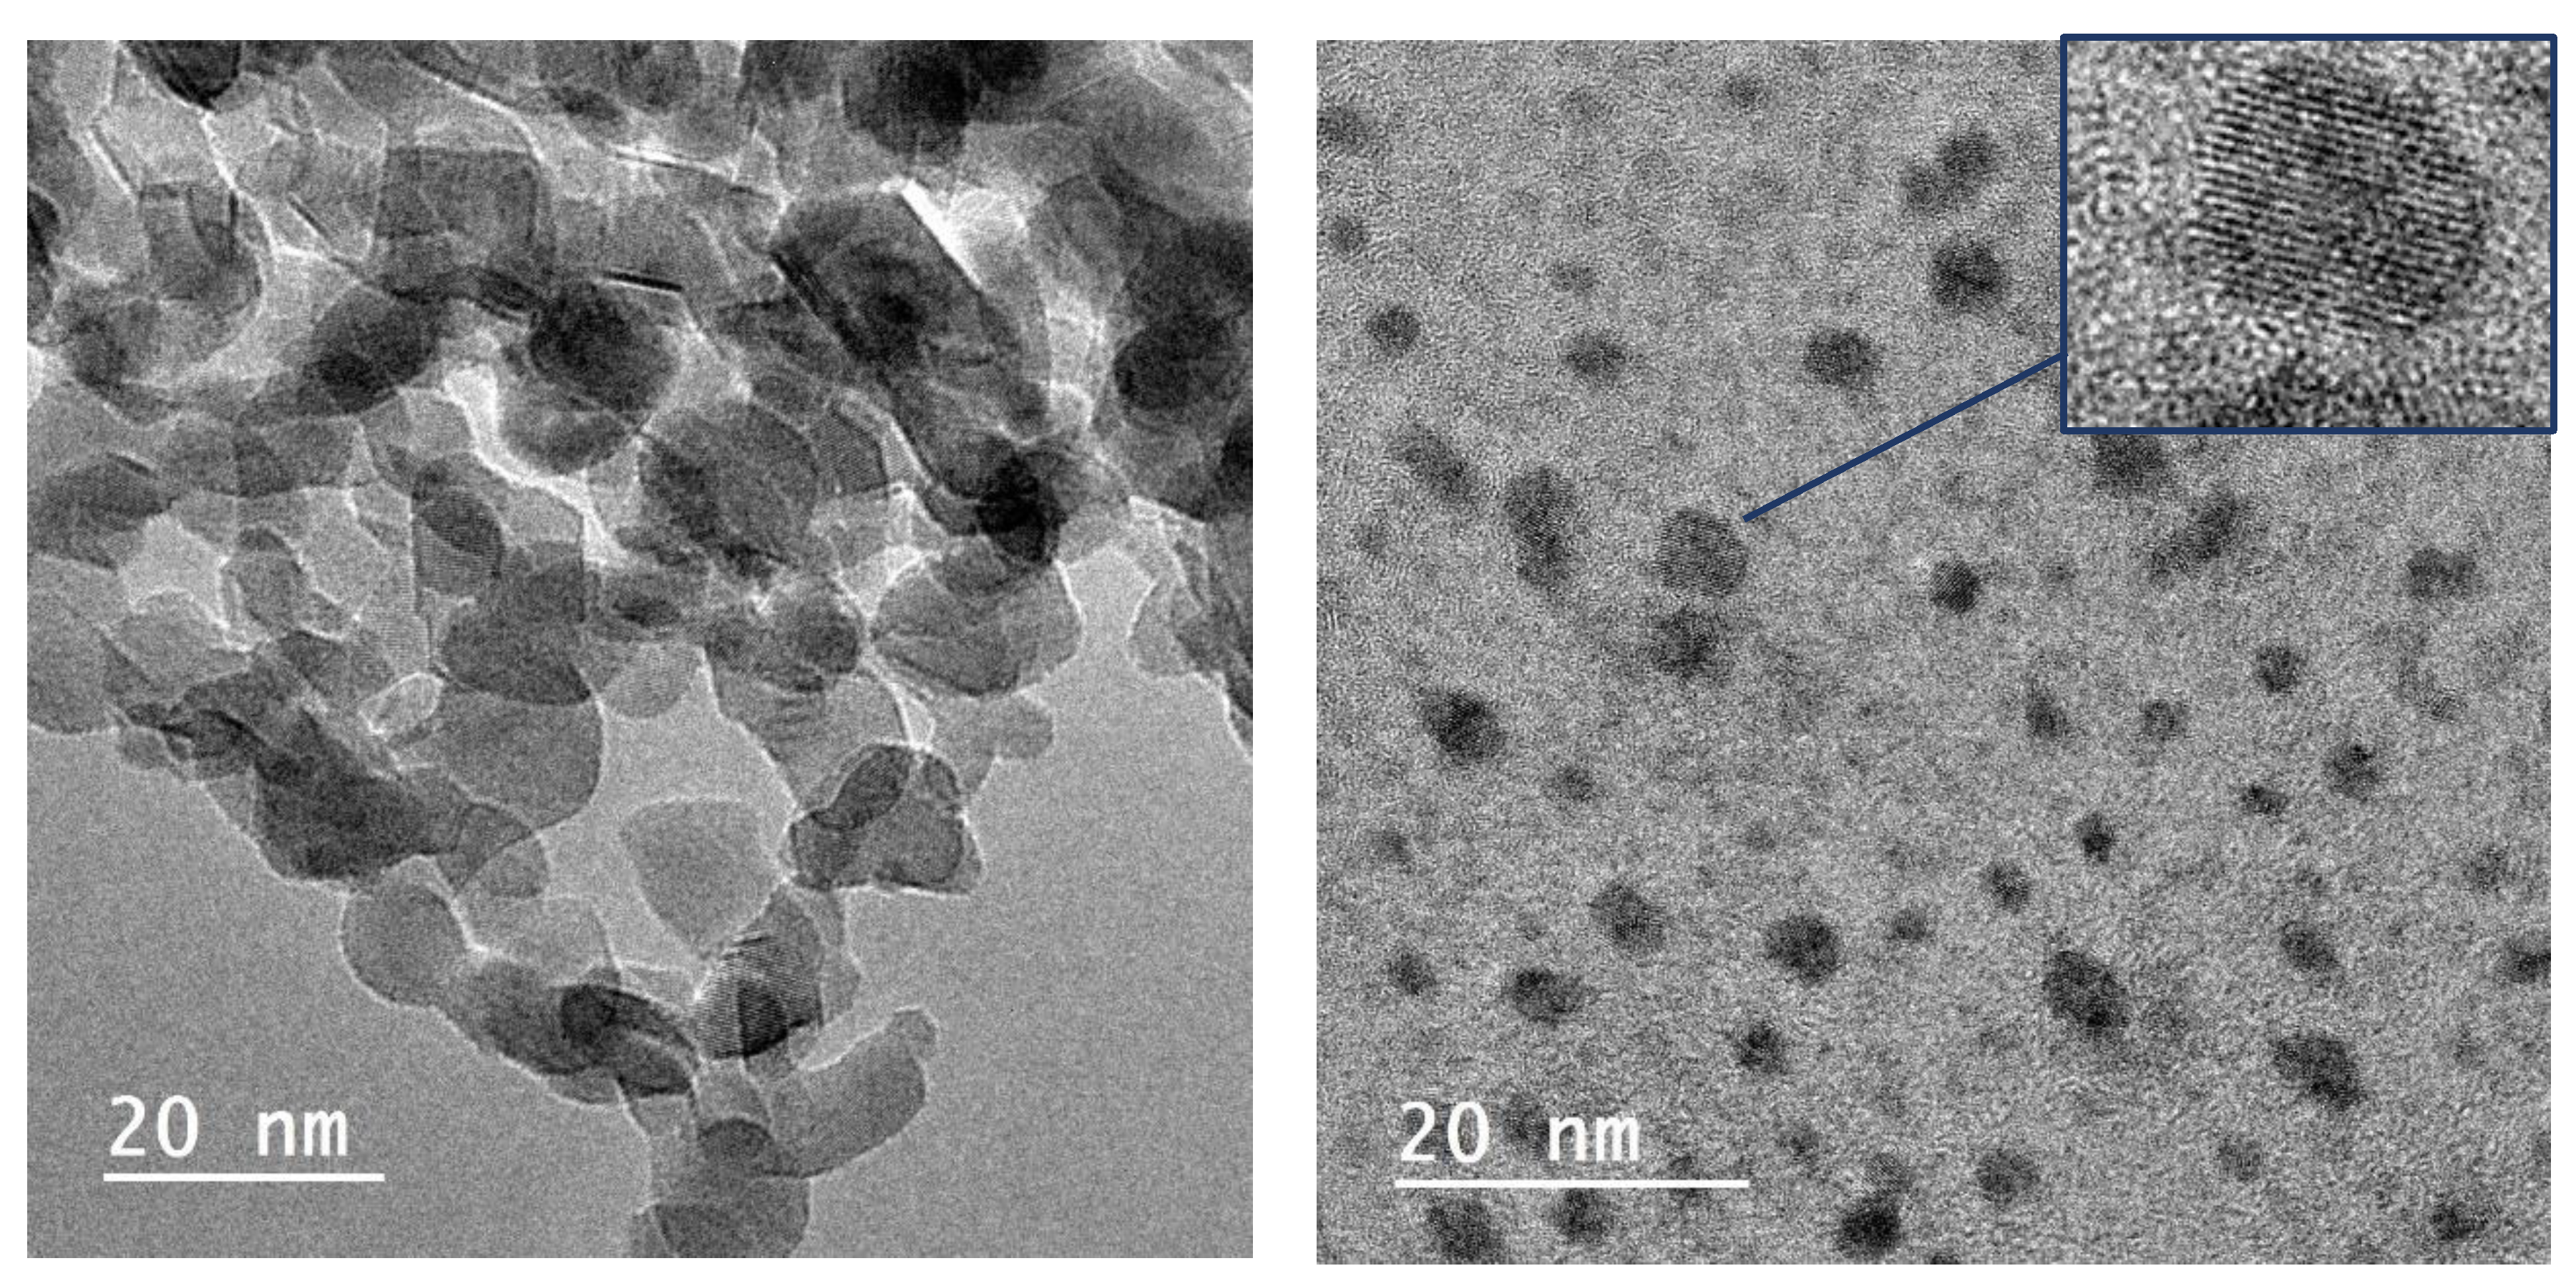
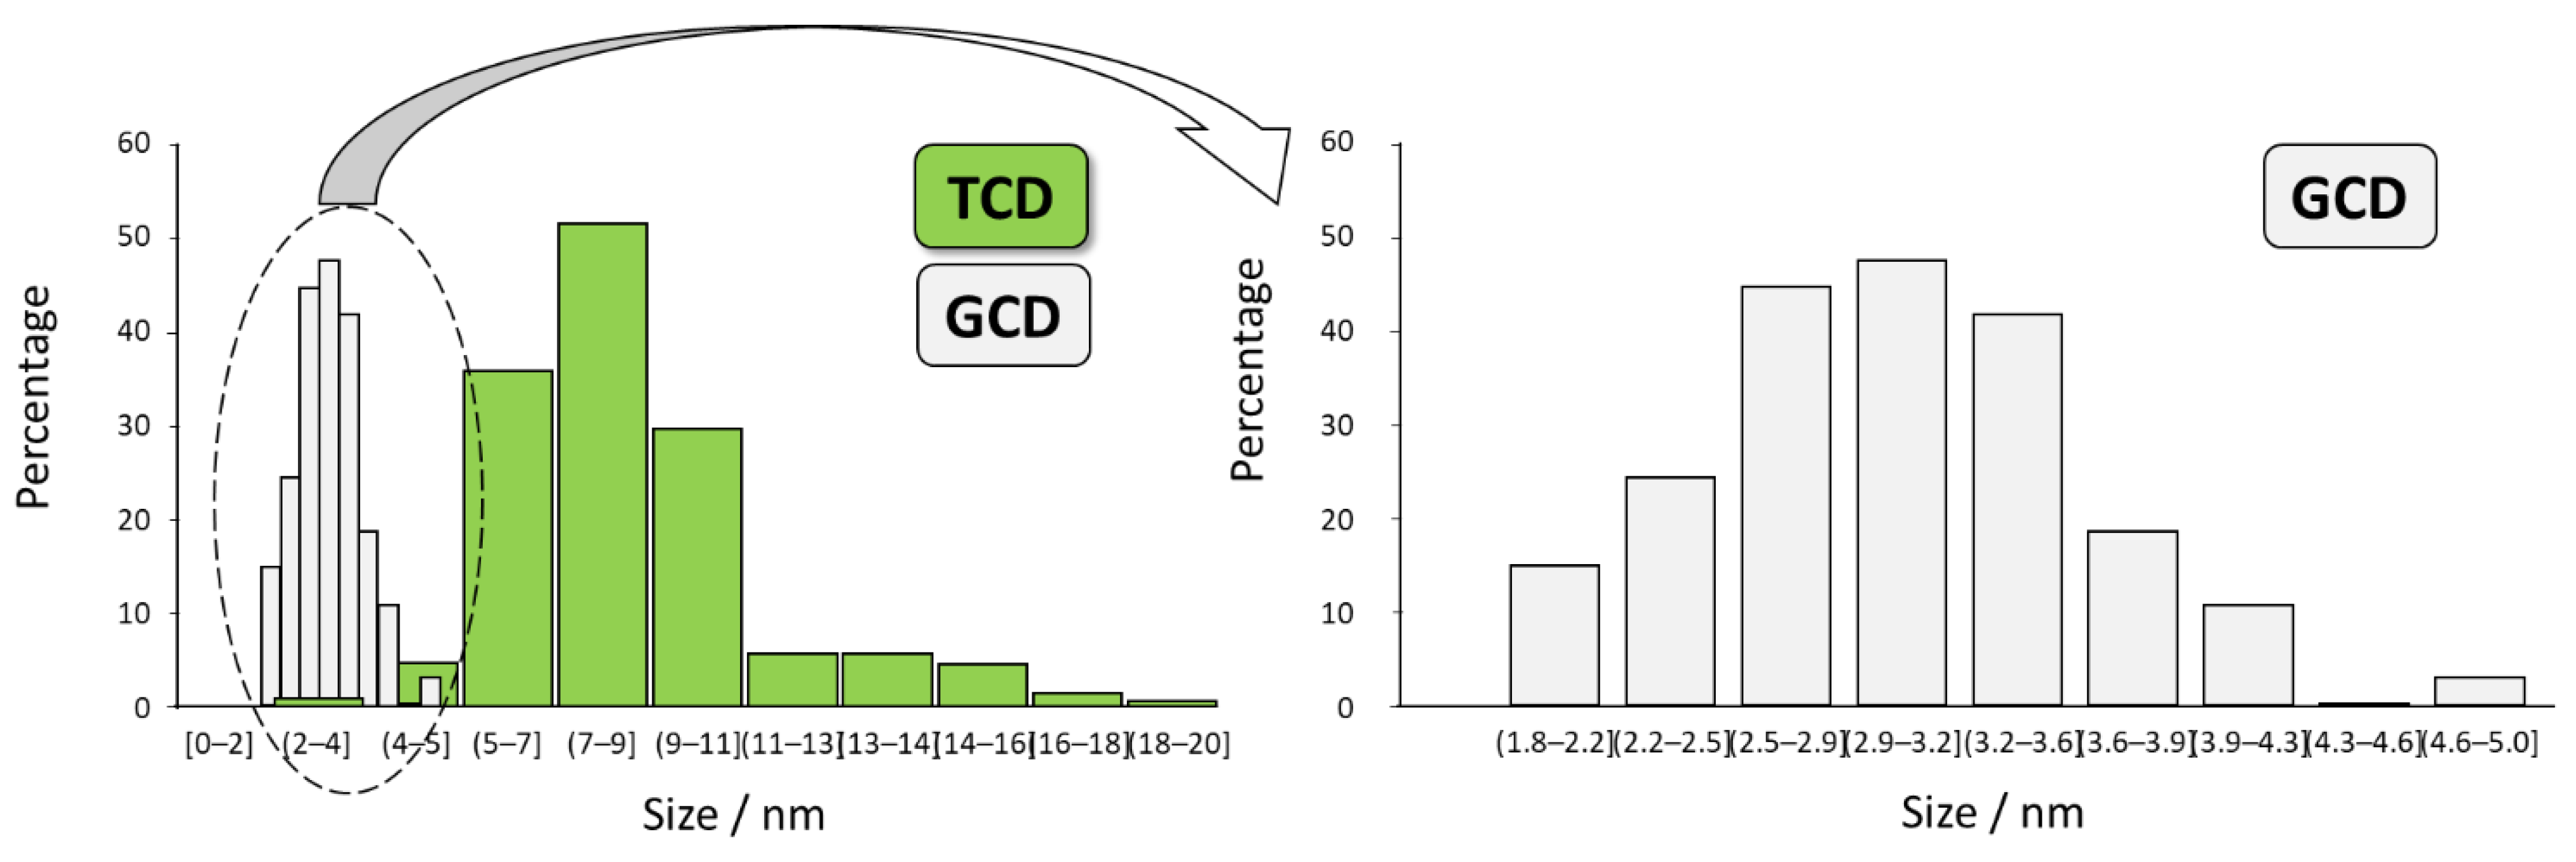
3.1. Structural and Morphological Characterization

HR-TEM images of TCDs (Figure 1) reveal a graphitic-based material with a lattice spacing of 0.24 ± 0.03 nm, which fits with the expected value for graphite (0.21 nm) [20]. The size distribution is inhomogeneous, with a mean value of 9 ± 3 nm.
On the other hand, GCD are much smaller, 3.0 ± 0.6 nm diameter, and with a much more homogeneous size distribution, as can be seen in Figure 2. The graphitic structure of the GCDs is also confirmed by the lattice spacing, 0.22 ± 0.03 nm (Figure 2).

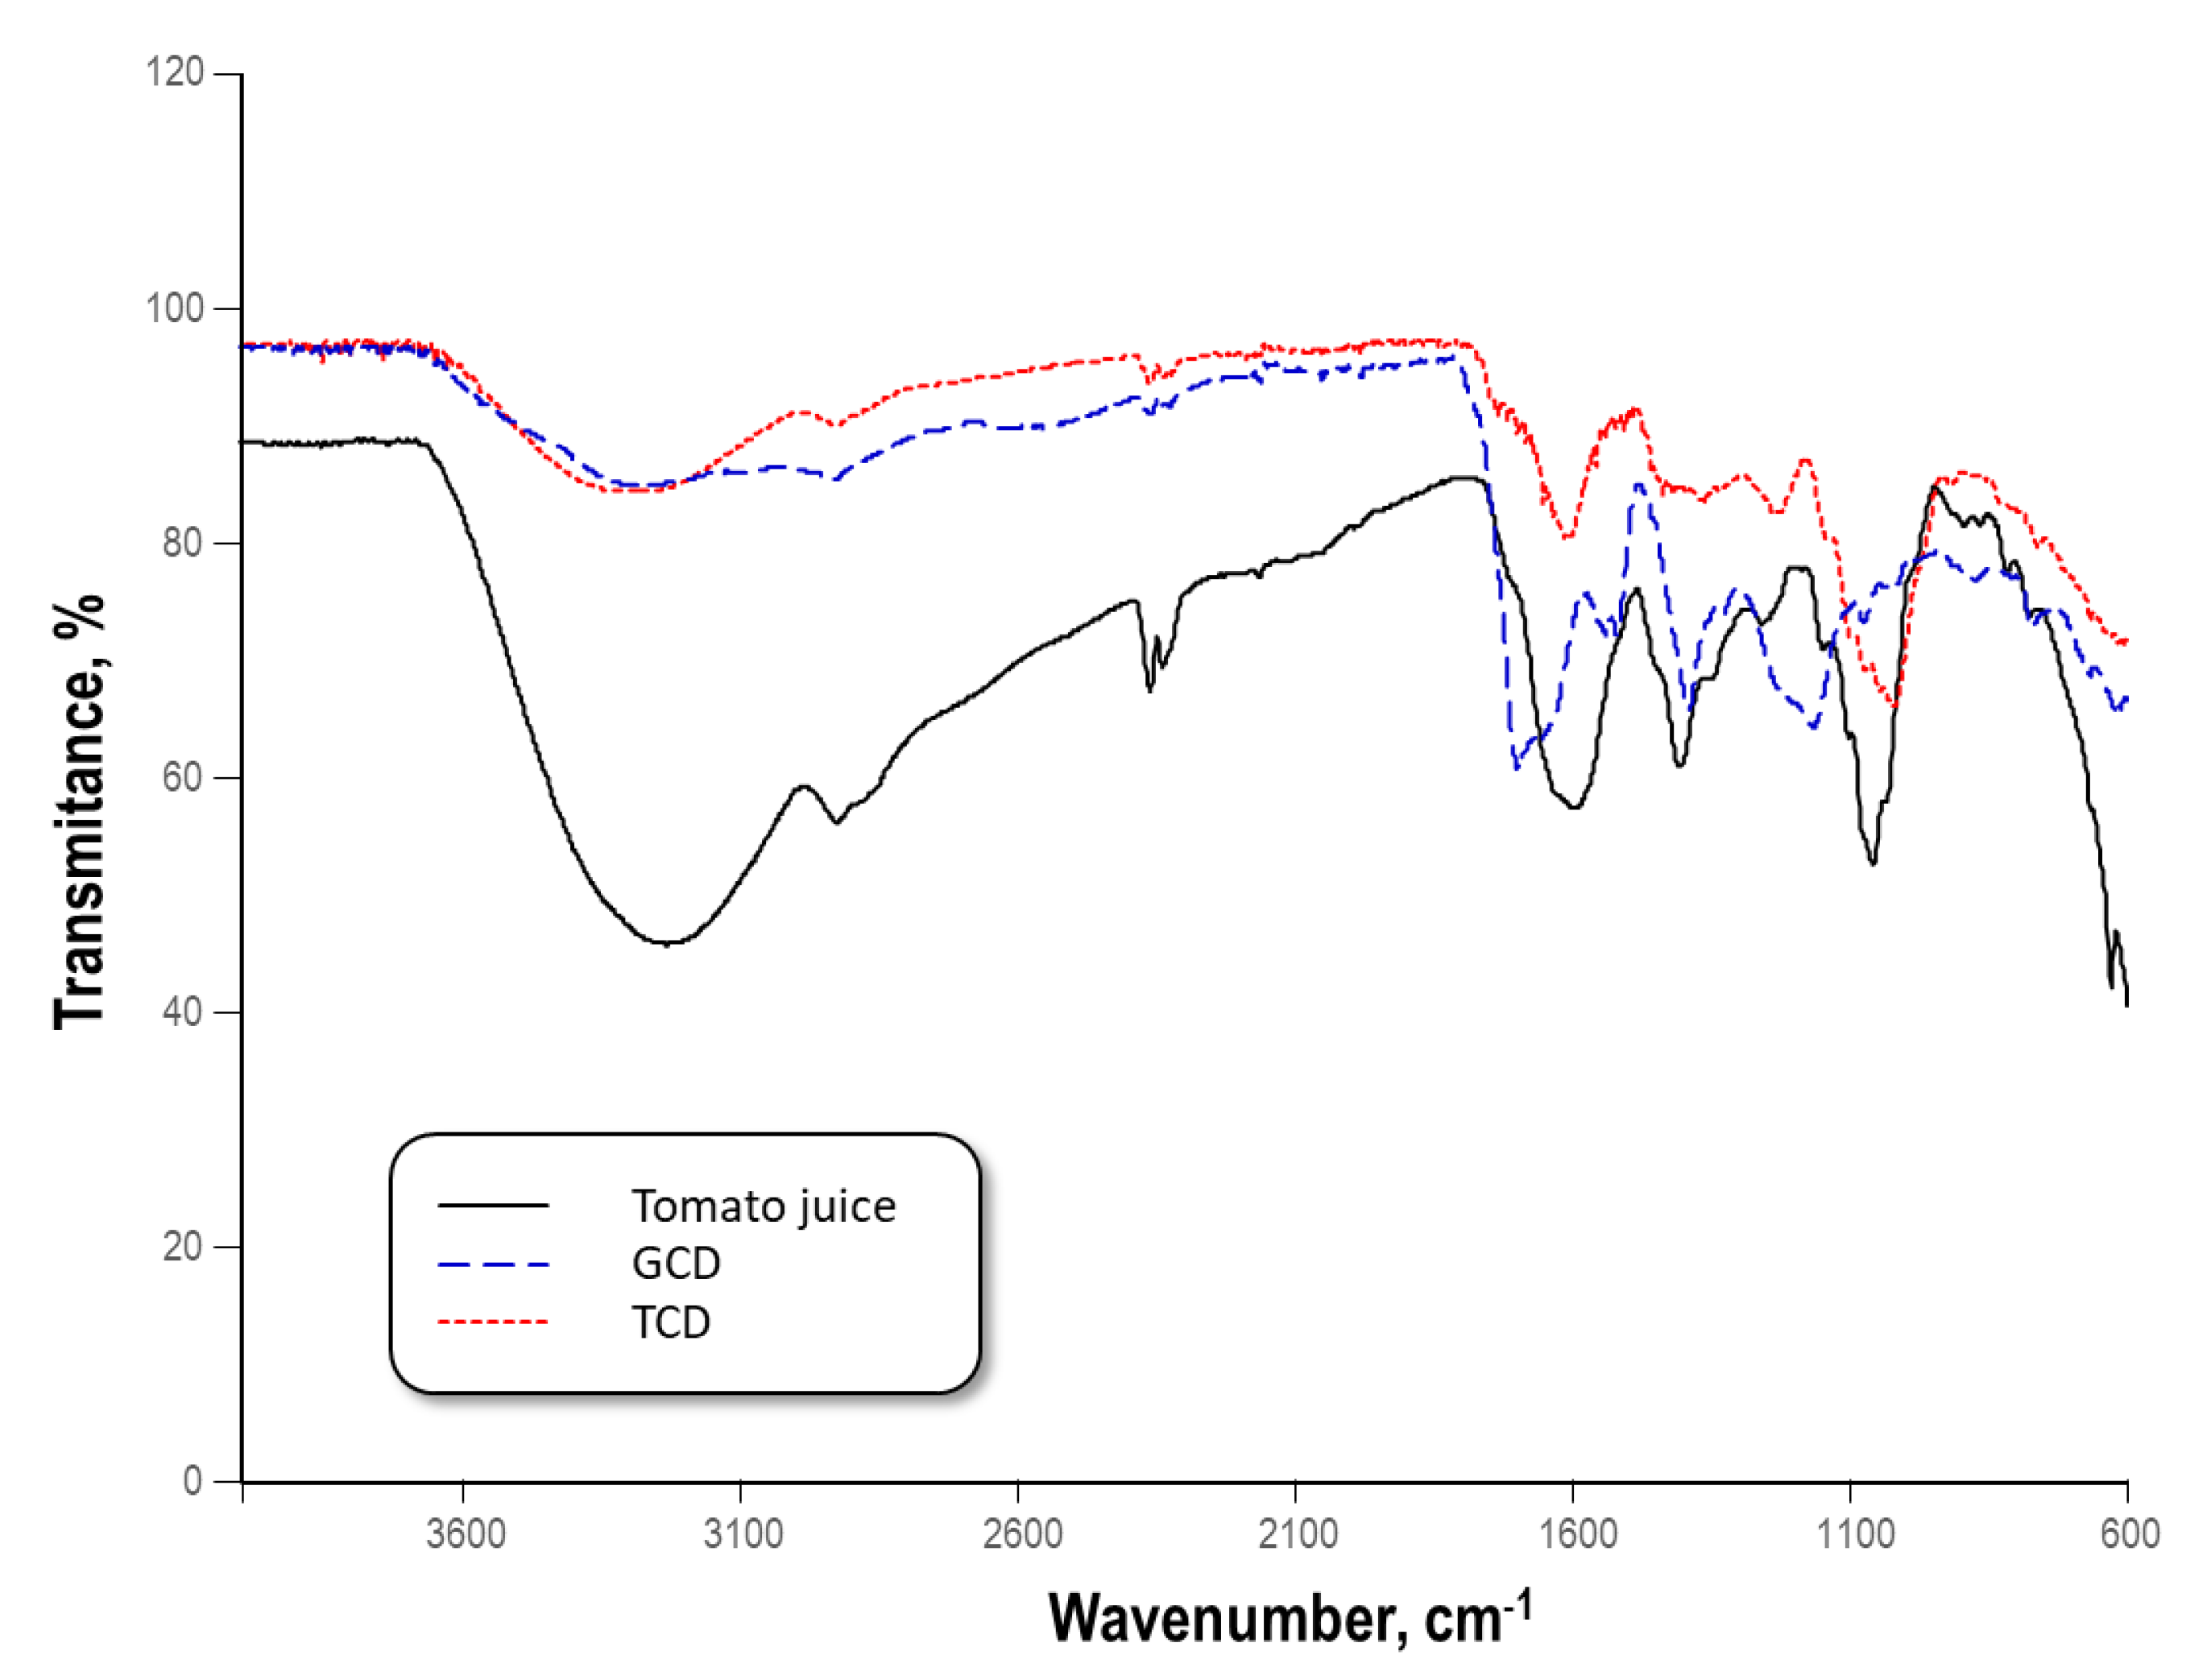
3.2. Surface Characterization

TCDs show an intense broad band between 3020 and 3600 cm−1 coming from the O–H and N–H bands (Figure 3). This band also appears in evaporated tomato juice and in the GCDs. Both TCDs and GCDs also show an intense band at 2925 cm−1, which is attributable to C-H bonds in aromatic rings. The presence of a broad band at 1604 cm−1 corresponds to C=O stretching, but also to stretching vibrations of C=C and C=N, which may be associated with the aromatic bonding of CD [21,22].
The C=O group shows an intense absorbance in TCDs at 1604 cm−1, although the most interesting feature of the FTIR spectra of TCDs is the intense band appearing at 1030 cm−1, which is assignable to the stretching of C–O–C bonds [21]. The C–O bond is also confirmed by the presence of bands at 1229 cm−1 and 1360 cm−1 belonging to the flexion vibration of C–O bond. The small spikes at 1750 cm−1, 1150 cm−1 and 1100 cm−1 suggest the presence of ester groups –COO too [23].

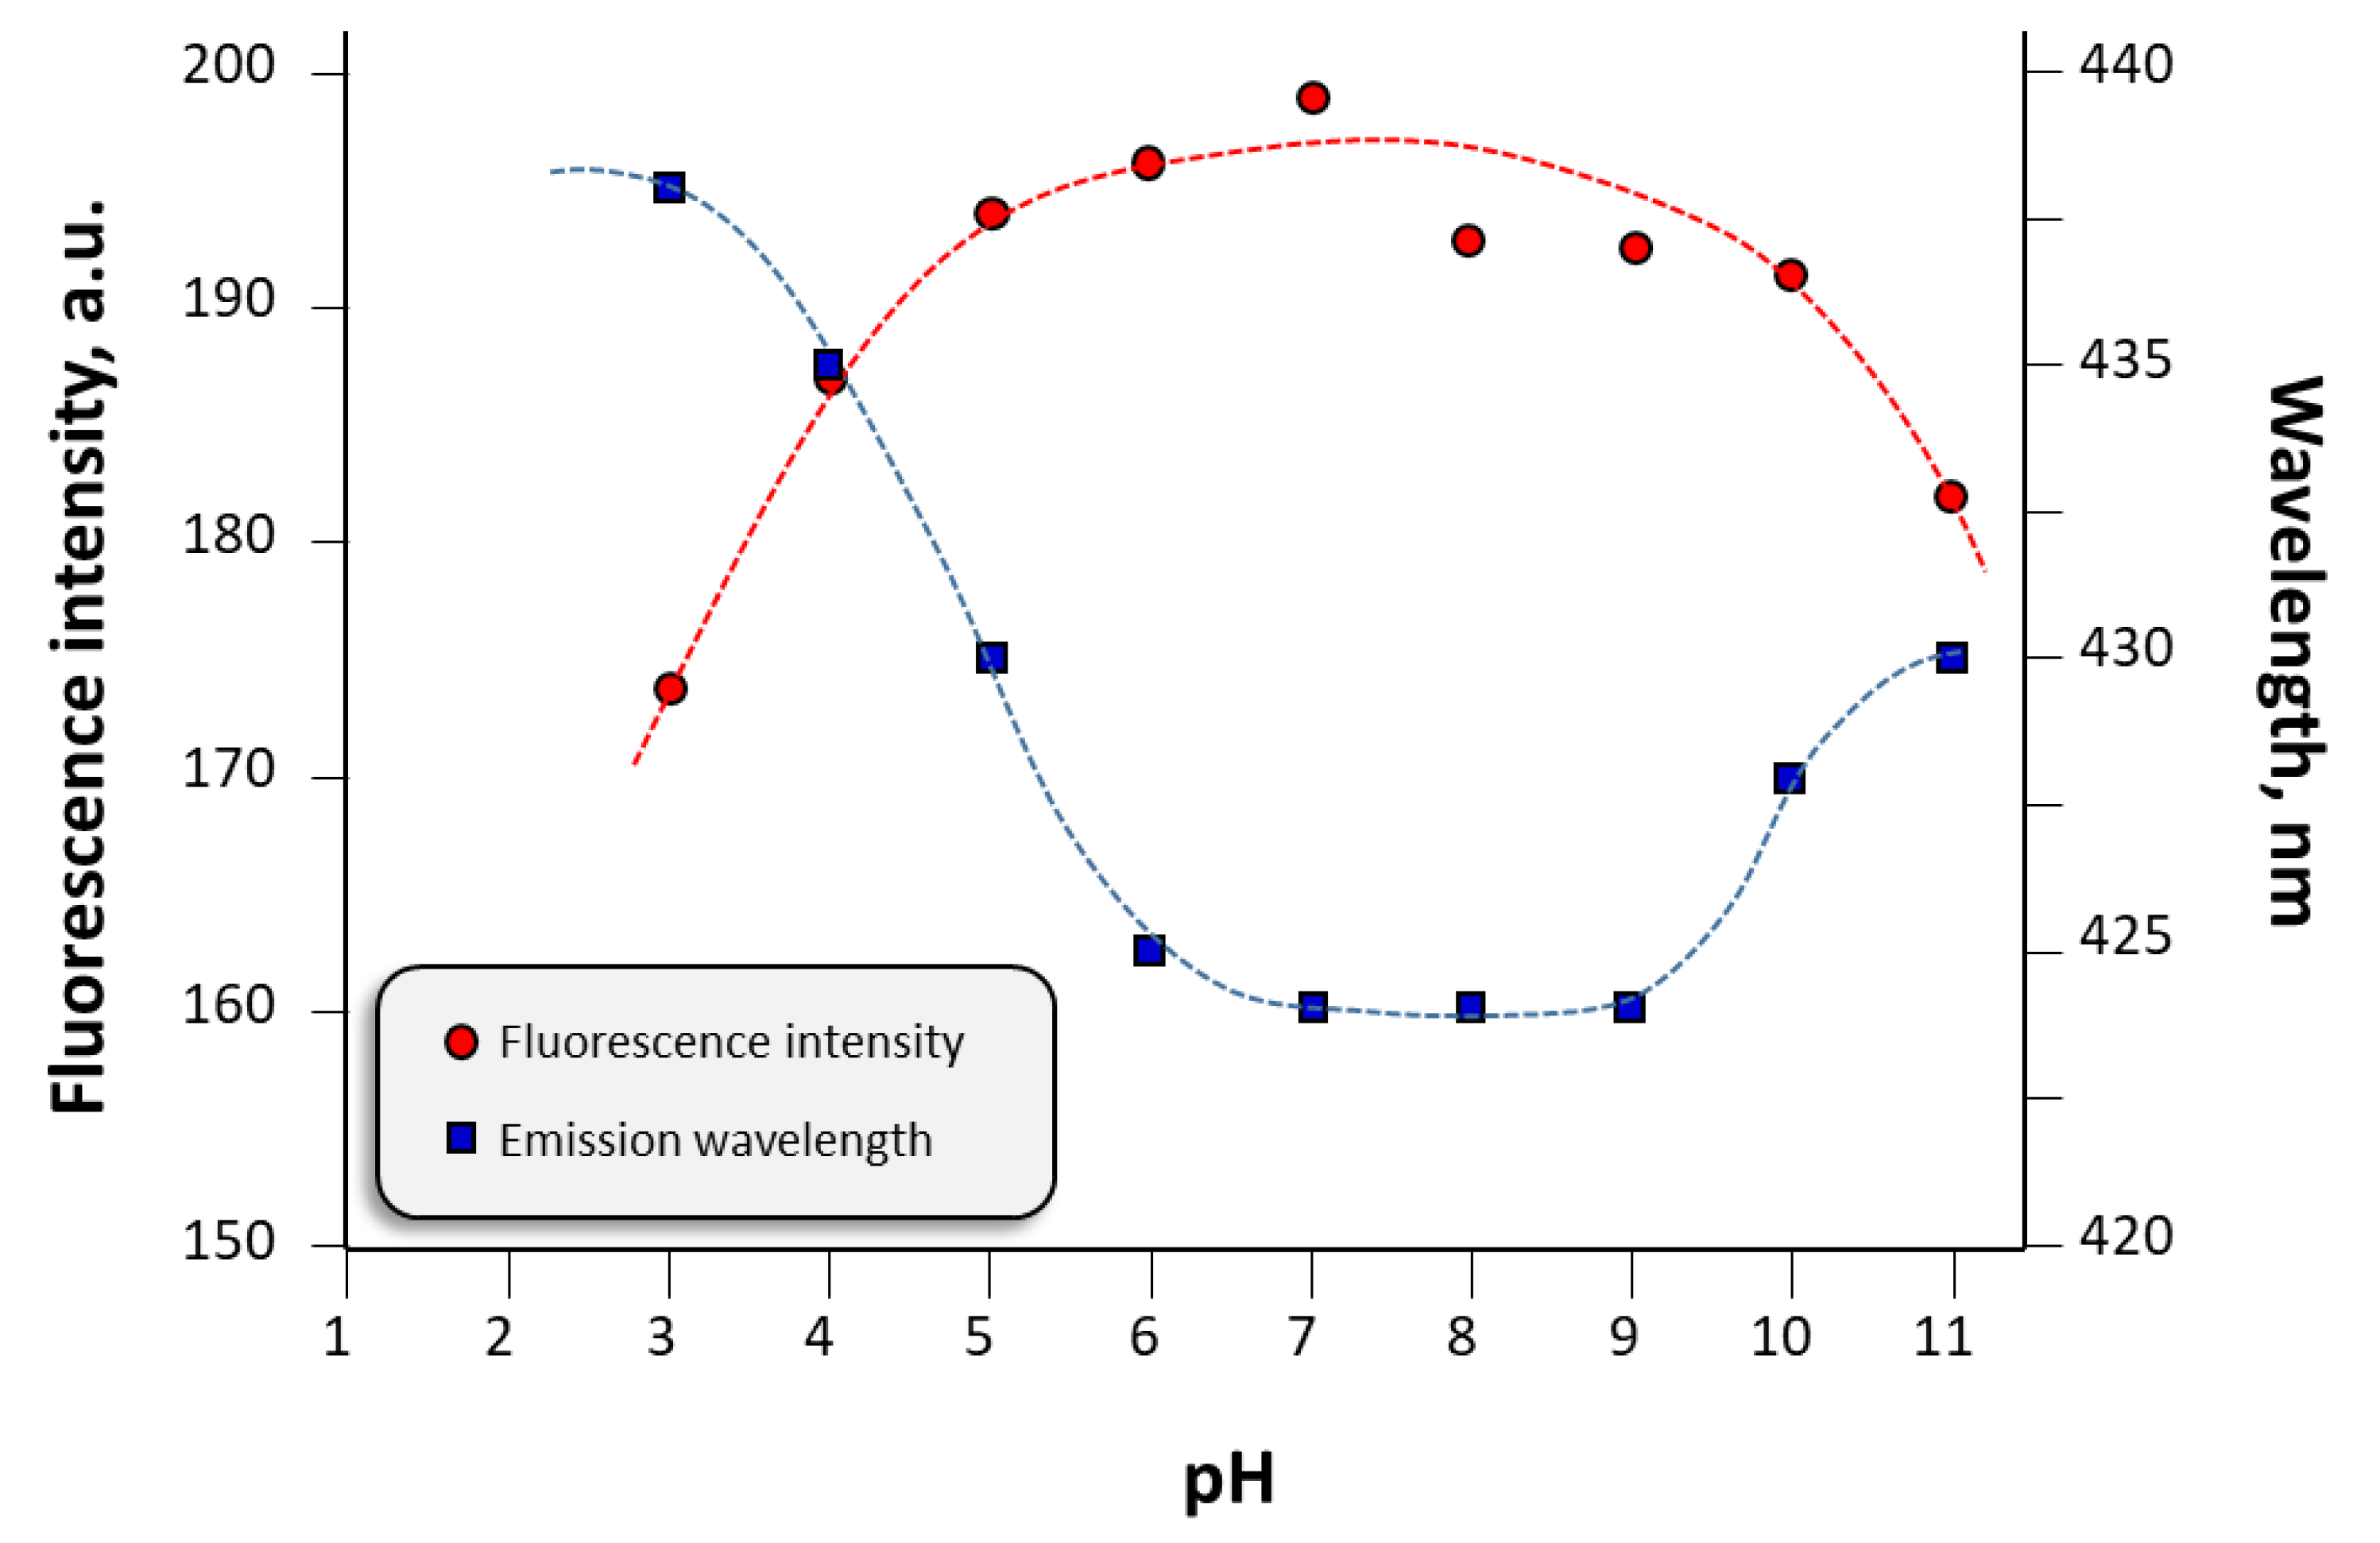
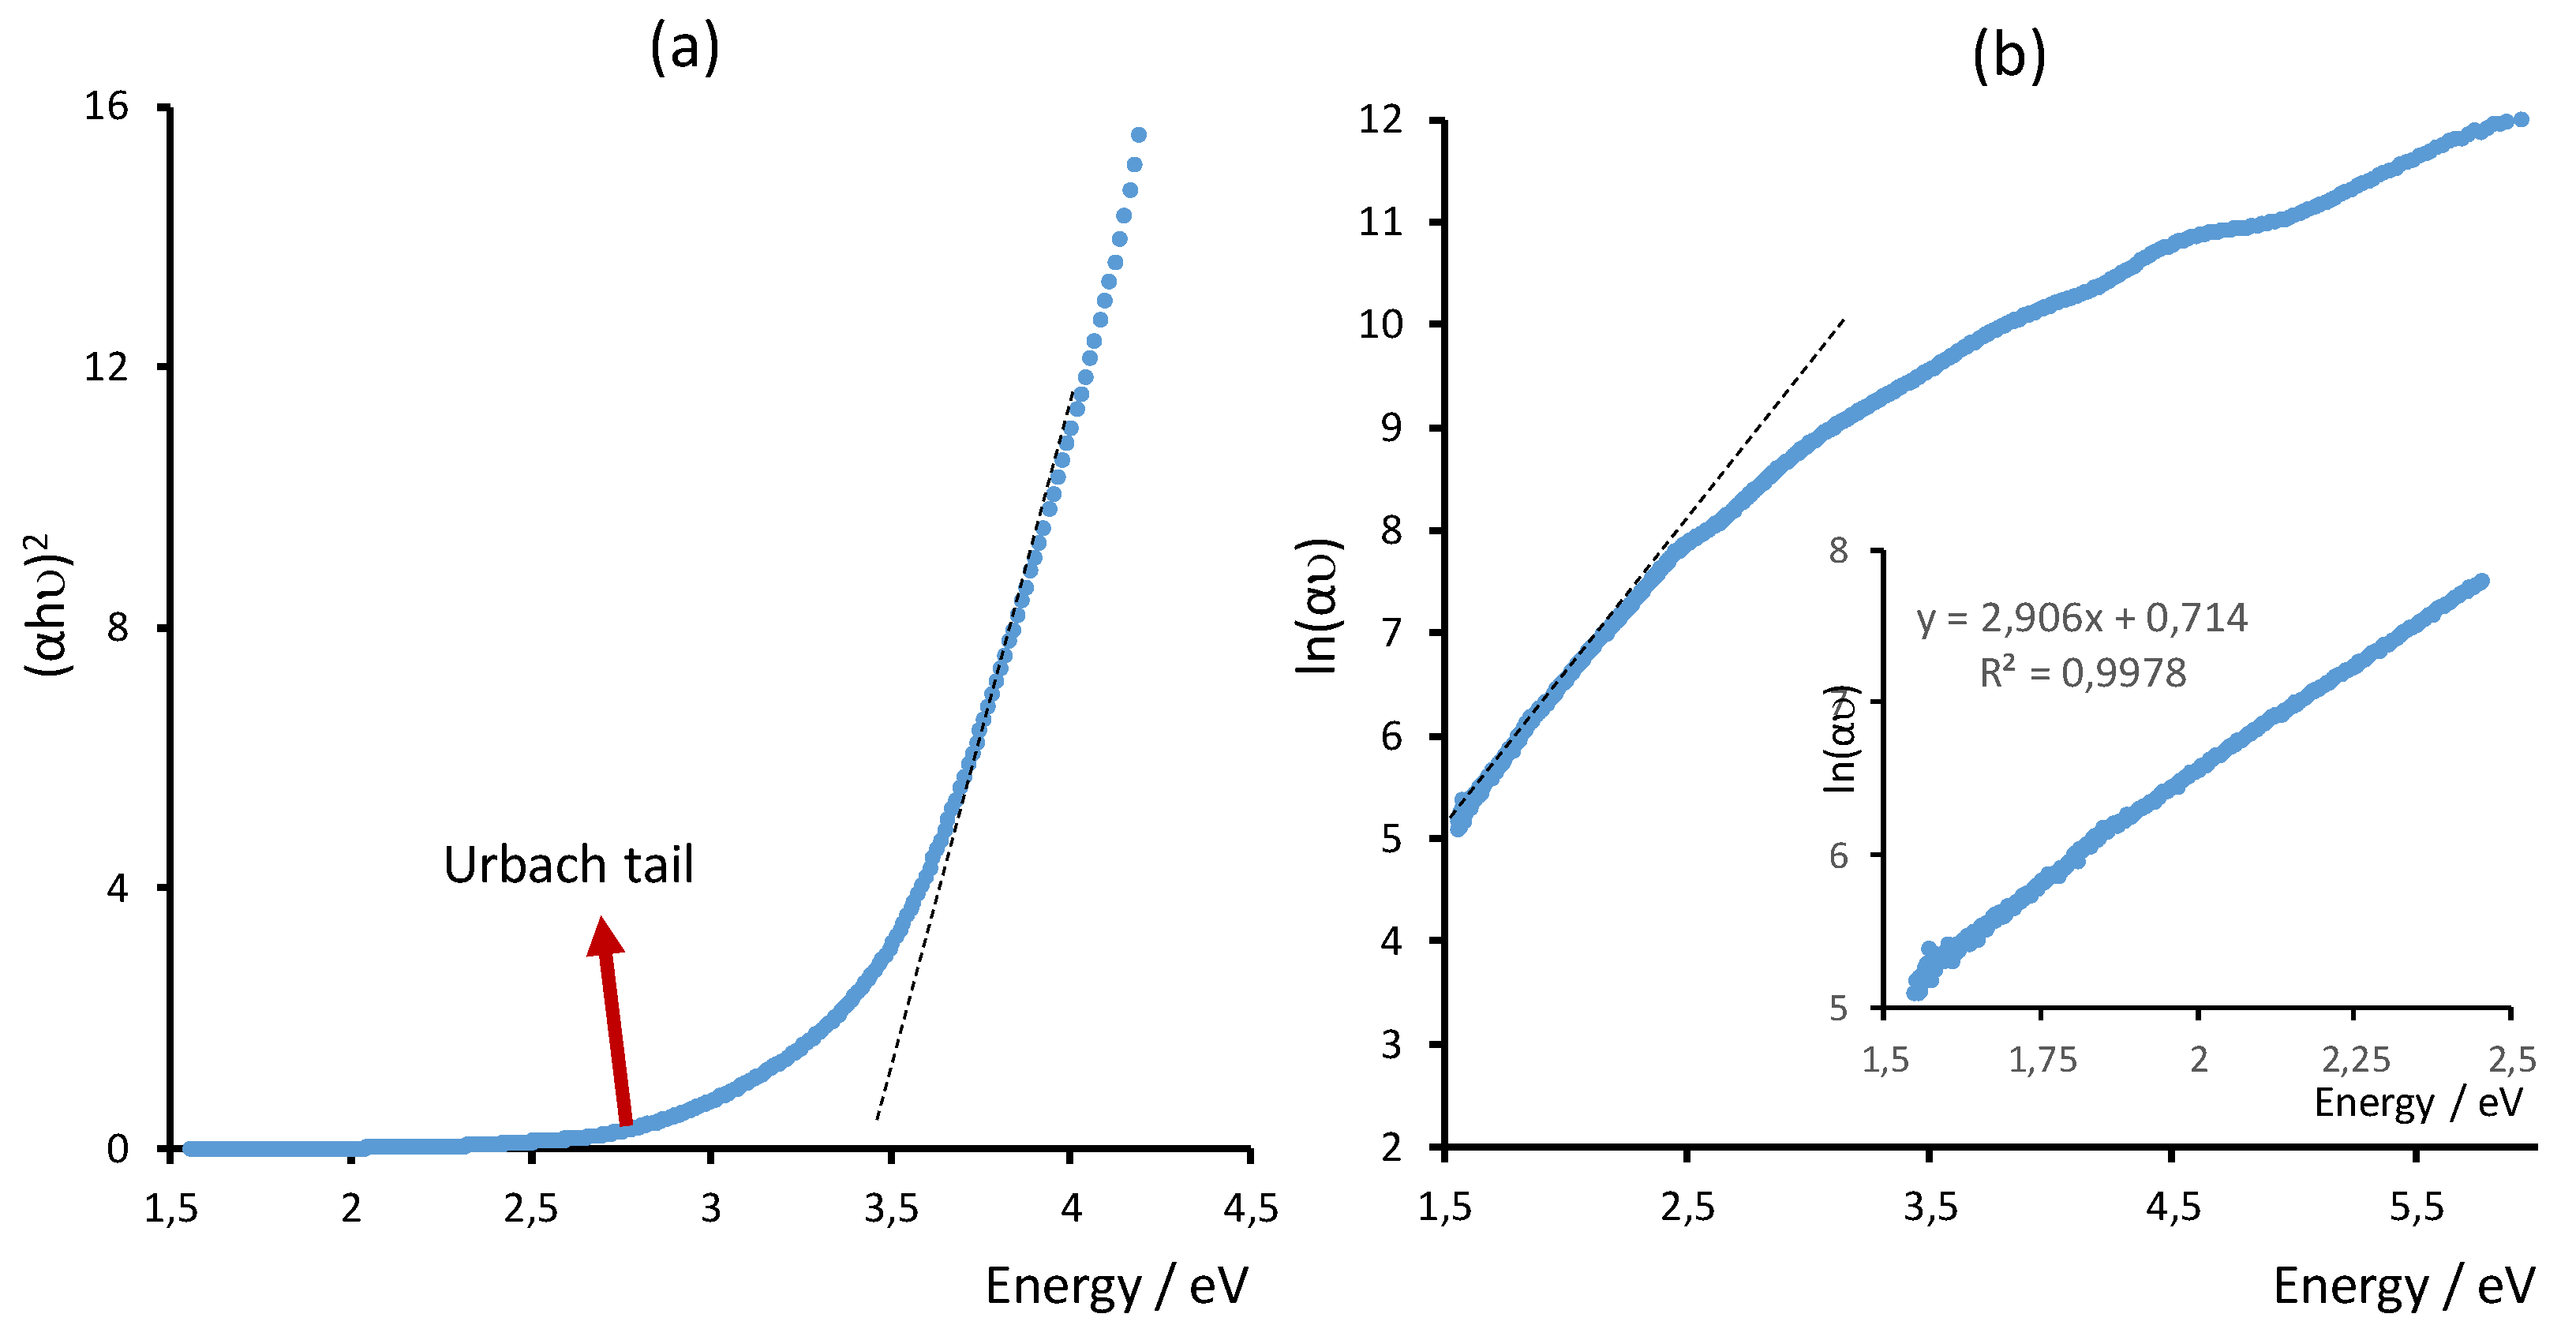
3.3. Spectroscopic Characterization

The UV-Vis absorption profile of TCDs is consistent with that expected for graphene-based carbon dots, with a shoulder at 265 nm that arises from π-π* transitions derived from the aromatic sp2 domain [24] and/or of C=C and C=N bonds.
The TCDs resulted in having excitation-independent emissions, with the maximum emission at 426 nm and the maximum excitation at 343 nm in aqueous media and 430 nm and 344 nm, respectively, in PBS, suggesting a slight stabilization of the surface-excited states due to the presence of the buffer. This absorption wavelength is attributable to n-π* transitions from C=O bonds [23]. This excitation independency has already been described in carbon dots and is explained by the conjugated π-system acting as a center for quantum confinement and the absorption of photons, whereas N-containing and O-containing surface groups provide different vibration relaxations [25]. The large Stokes shifts obtained are also a consequence of surface self-trapping for vibration relaxation.
The influence on the luminescence of these N-containing or O-containing groups traps was evaluated by studying the luminescence with a different degree of surface protonation. Then, photoluminescence was measured at different pH values. Both emission intensity and emission wavelength suffer alterations at pH 4 and pH 10, being more or less constant at intermediate values (Figure 4).
This behavior suggests the presence of two different surface functionalities, an acidic one with pK around 4 and an alkaline one with pK near 10. These values agree with the typical pK for carboxylic acid and amine moieties, whose presence is also supported by FTIR data. In fact, the lower pH is close to one of the pK values of ascorbic acid (4.2), one of the most important nutrients in tomato [26].
Quantum yields were measured with an absolute methodology, finding values of 1.03% (in water) or 1.24% (in PBS). These poor quantum yields are common in carbon dots obtained from natural carbon sources, which are usually lower than 13% [27], probably because of the inherent complexity of a natural source.
Absorption data were also analyzed using Tauc’s law for direct transitions [28]:
(αhν)2 = k (hν + Eg)
where α is the absorption coefficient, hν is the energy of the incident light and k is a constant. According to this, estimated, bandgap values (Eg) were 3.43 eV for TCD and 3.25 eV for GCD (Figure 5a); these are consistent with other already-published values of Eg for carbon dots [18].
Structural disorders and/or defects drive poorly defined limits in the valence and conduction bands, which causes a tail for values below Eg known as ‘Urbach’s tail’ (Figure 5b). The energy associated with this zone can be evaluated by linearizing Equation (2):
α hv   =   α 0   e ( hv / E u )
where α0 is a constant and Eu is the Urban’s energy whose values are calculated from the linearization, being 344 meV for TCD and 329 meV for GCD, respectively. This is an indication that GCD shows a structure with fewer defects than TCD, which is understandable according to the complex matrix of tomato juice. Nevertheless, despite this fact, Eu values of TCDs are lower than those reported for other carbon dots synthesized from vegetable wastes such as grape pomace and tea residues [Error!Bookmarknotdefined.], indicating a more ordered structure.

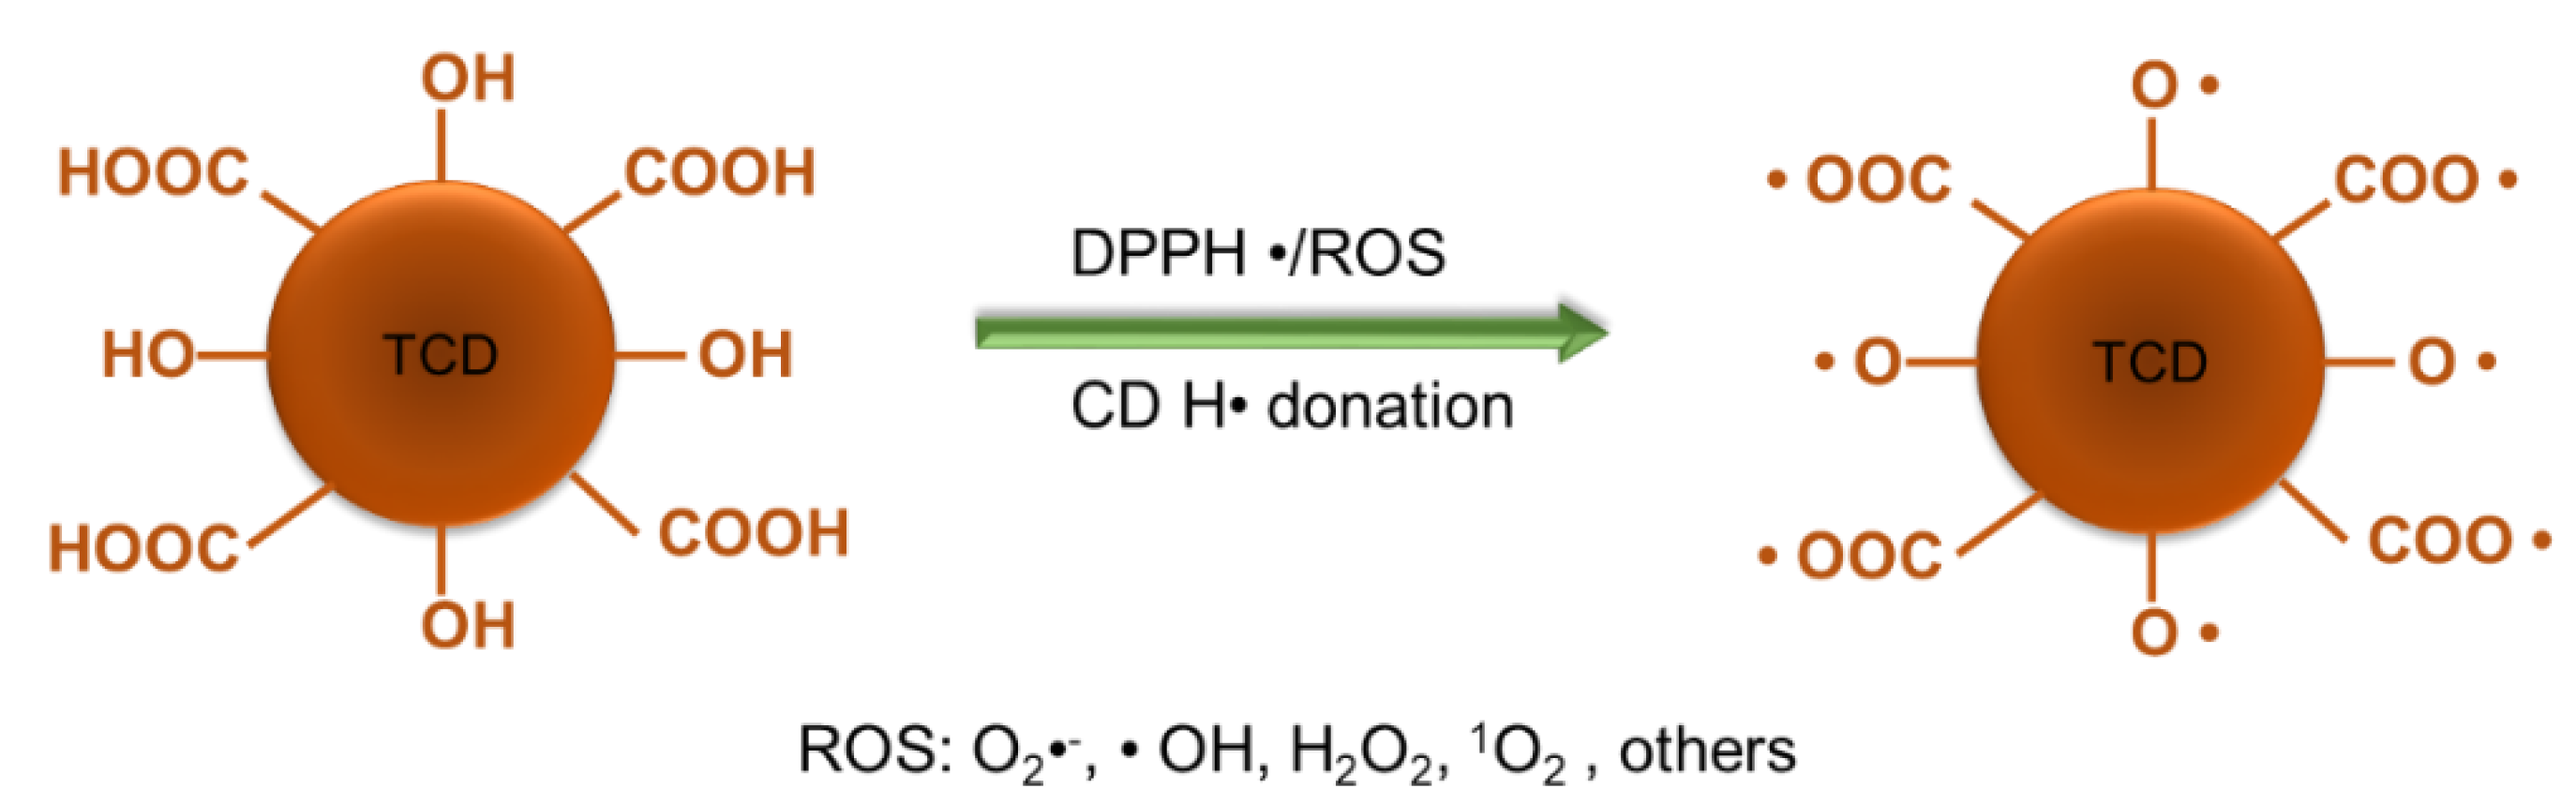
3.4. Antioxidant Capabilities of TCDs

The antioxidant power of TCDs was evaluated with the DPPH inhibition assay (Table 1) and compared to that of carbon dots with well-established antioxidant activity, as was that obtained hydrothermally from glutathione (GCD) [18]. The determination is based on the action of the free radical DPPH• on the antioxidant, which hands a hydrogen atom to it over, shown in the case of CDs from the surface functional groups –OH and –COOH (Figure 6). This causes a respective radical on the nanoparticle, which has two possible pathways of stabilization: delocalization of the unpaired electron by resonance in the aromatic environment of the CD core or the rearrangement of the chemical bonds of the surface functional groups themselves.
Five different concentrations of CDs were tested, ranging from 4 to 20 ppm. TCDs show a strong inhibition even at the lowest concentration, whereas GCD needs at least four-times more concentration to achieve the same antioxidant power. In terms of EC50 (needed concentration to obtain 50% of DPPH inhibition), EC50 estimation for TCD is below 4 ppm (0.16 ppm·nmol DPPH−1), whereas it is around 14 ppm for GCD (0.56 ppm·nmol DPPH−1). It is known that the co-existence of several antioxidants in a sample may show synergism, exhibiting stronger antioxidant activity as a mixture than when acting separately [29]; taking into account the presence of a wide variety of antioxidants in tomato juice, this synergism may explain the stronger antioxidant activity compared to GCD.
The stronger antioxidant activity of TCDs is related to their higher size, as bigger particles potentially have a higher number of surface antioxidant functionalities, which can interact with the environment to a greater extent.
Since TCD and GCD are of a different size, the same mass of both materials has a different number of particles and, therefore, the total surface is not comparable. In order to check whether the total available surface of TCD is bigger than GCD, we have to compare the total surface ratio nT·AT/(nG·AG), where nT and nG are the number of TCD and GCD nanoparticles, respectively, and AT and AG are the surface of a single TCD or GCD, respectively. The number of nanoparticles can be estimated from the mass of material used and the material’s density. For a fixed mass of TCD, mT, the number of TCD nanoparticles, nT, will be represented by:
n T = m T 4 3 π r T 3 ρ T
where rT is the TCD radius and ρT is the TCD density. Here, we suppose an identical density for TCD and GCD and use the same mass of both materials (mT = mG), meaning the ratio of nanoparticles is nT/nG = (rG/rT)3. Similarly, we take into account the equation for the surface of a sphere, AT/AG = (rT/rG)2. Thus, the total surface ratio becomes
n T · A T n G · A G = ( r G r T ) 3 ( r T r G ) 2 = r G r T
Taking into account the mean value of the radii as obtained by TEM, the total surface ratio TCD/GCD is approximately 1/3, meaning that TCDs have three-times more available surface than GCDs, supporting our supposition.

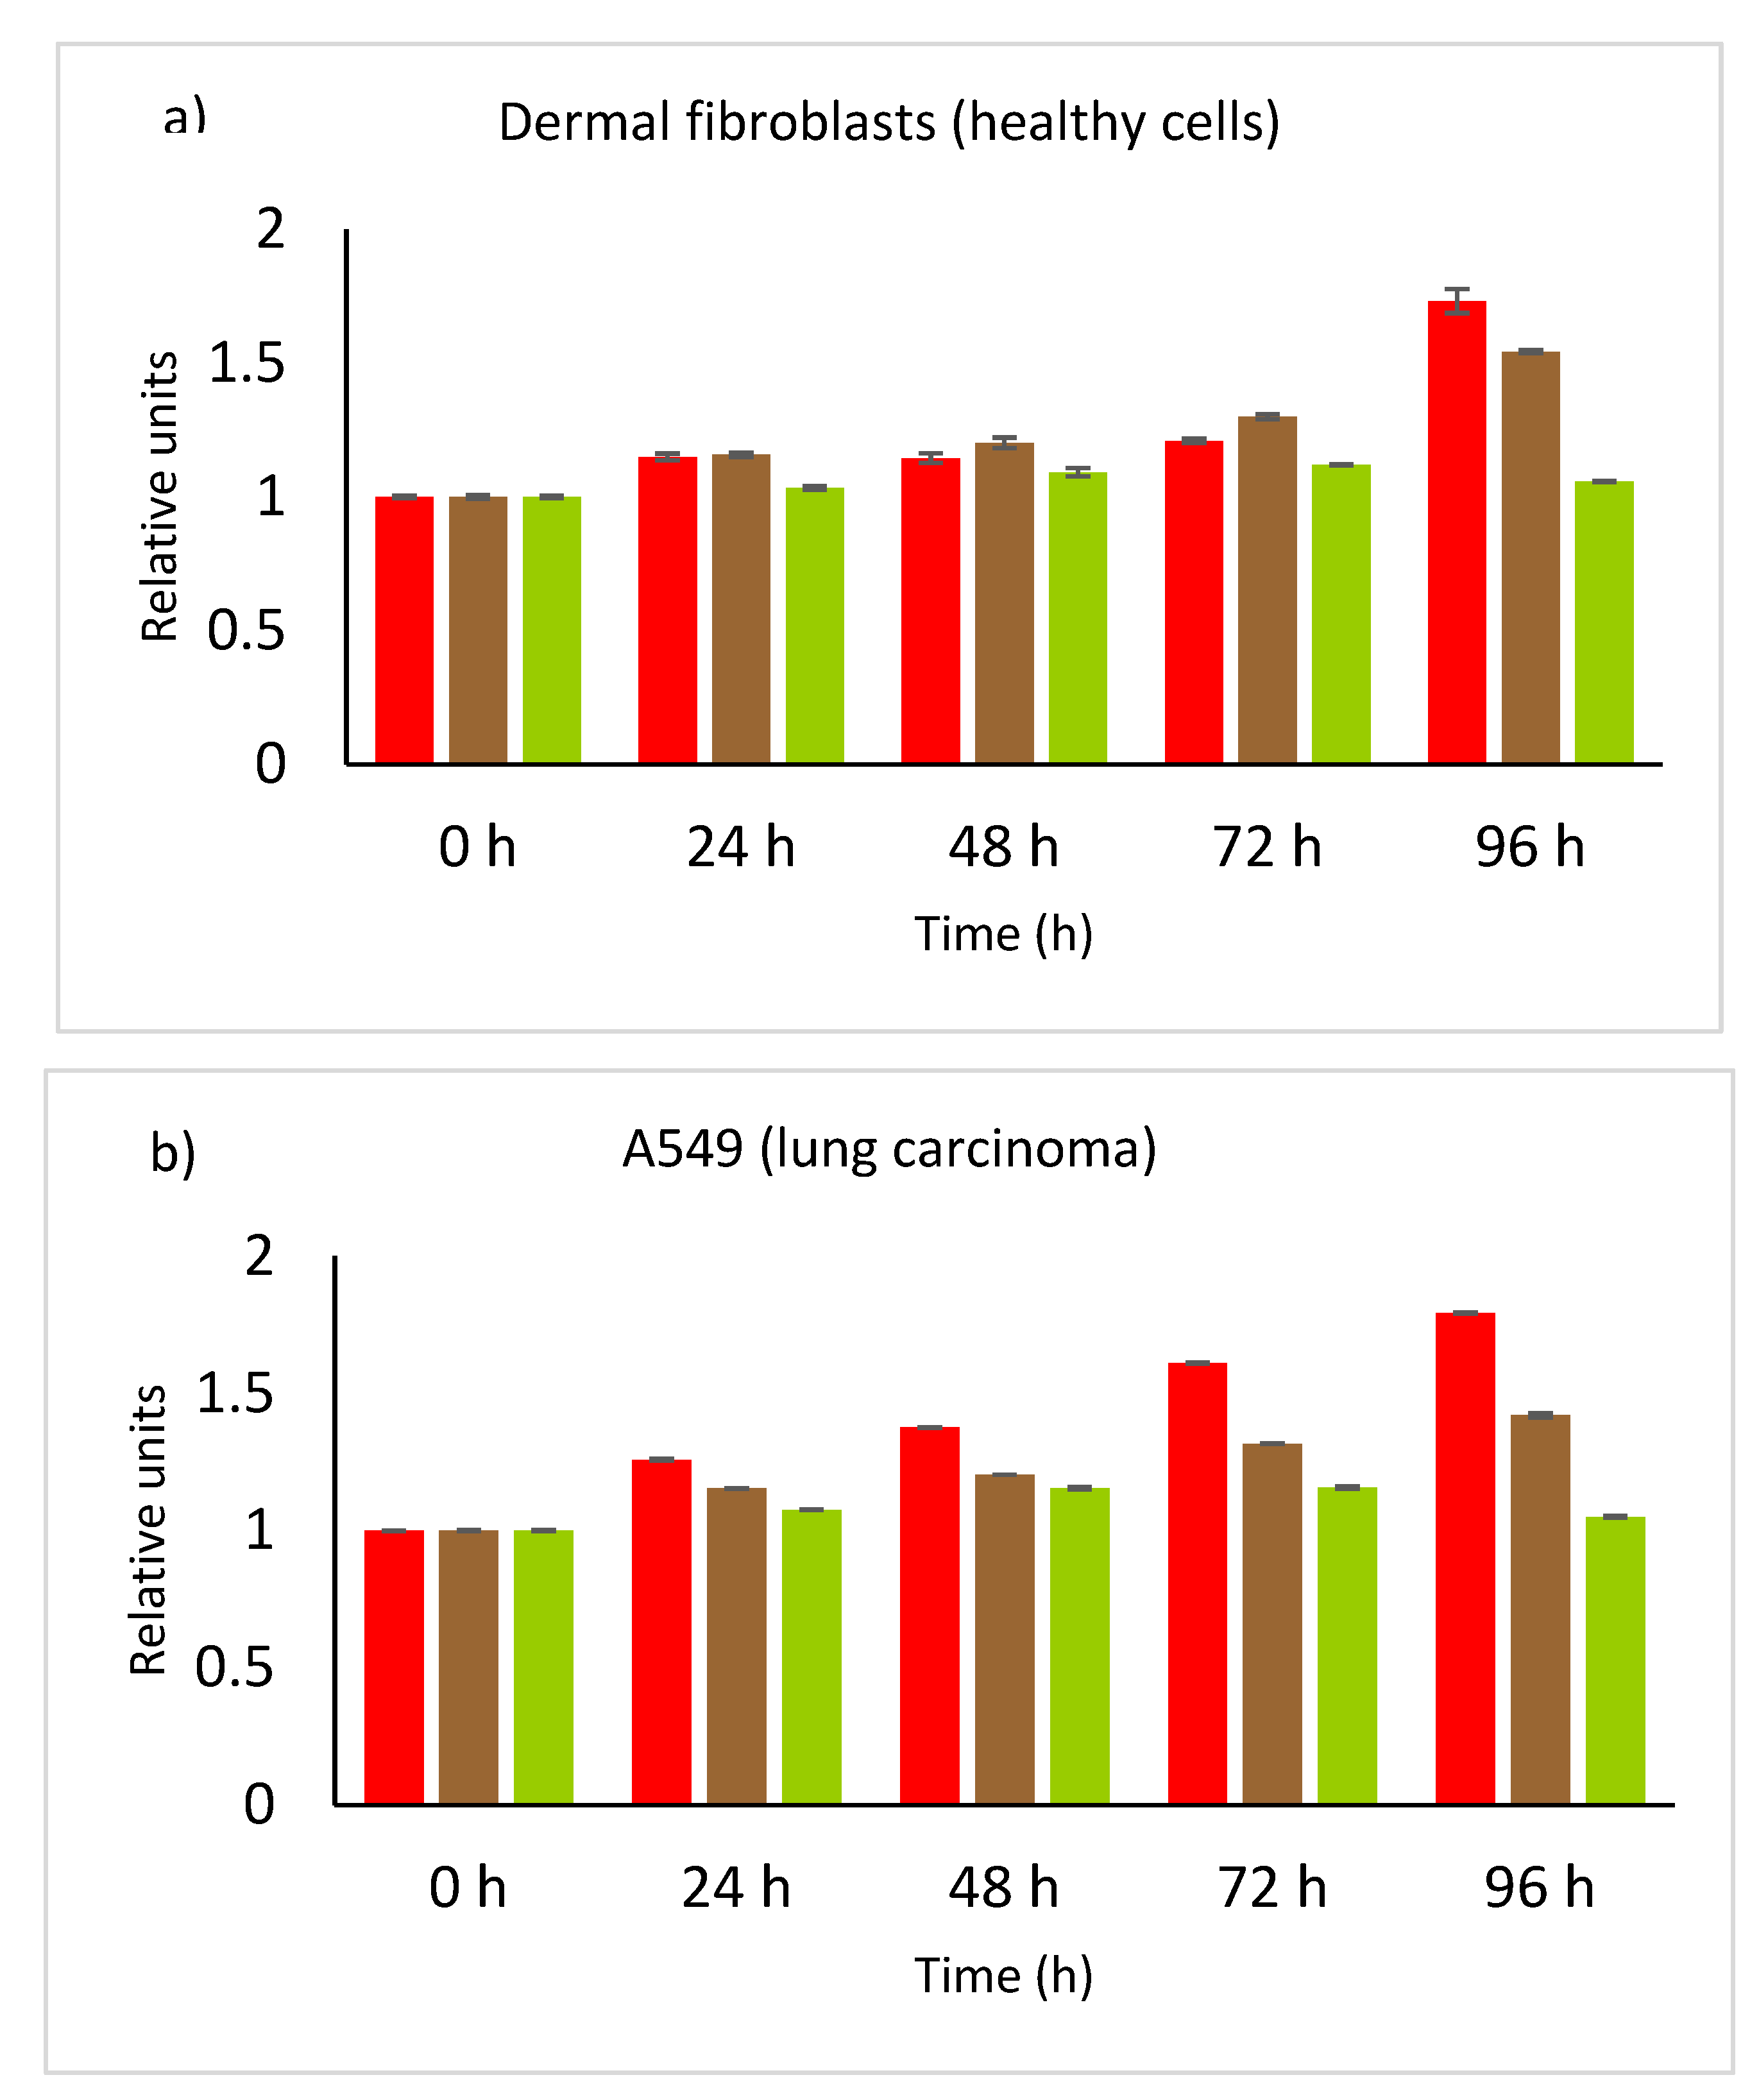
3.5. Cell Viability—Toxicity Evaluation

Cell viability was evaluated at two different concentrations: 100 ppm and 1000 ppm. For this purpose, previous solutions of TCD were made in PBS (1×) at 200 ppm and 2000 ppm. Control solution was made out of PBS (1×). Then, 50 µL of these solutions was added to the wells containing growing cells with 50 µL of complete cell medium. Cell viability and cytotoxicity were evaluated using the cell proliferation kit and according to the manufacturer’s instructions. As shown in Figure 7, neither concentration of TCDs evaluated affected healthy dermal fibroblasts growth up to 72 h, showing a similar response to control cells. At longer times (96 h), a certain toxicity can be observed, especially using the highest concentration. However, TCDs have toxic activity against A549 lung carcinoma cells, even at times as short as 24 h at either of the tested concentrations; the growth inhibition effect becomes stronger as the contact time becomes higher. This different behavior is likely due to the faster metabolism of cancer cells, which can incorporate TCDs at a higher rate than healthy cells. On the other hand, the high content in ROS produced by tumor cells compared to those present in the healthy ones [14] may cause a longer prevalence of the free radical form of TCD (Figure 6), producing a synergic effect and thus inducing higher toxicity.

4. Conclusions

Tomato juice is an adequate carbon source for preparing graphene-based carbon dots hydrothermally. The material obtained shows both acidic and basic surface moieties arising from the natural components present in tomato. Luminescence experiments demonstrate that TCDs have a conjugated π-system acting as a center for quantum confinement and two different surface “patches” affecting luminescence emissions; they have a higher bandgap and Urban’s energy than GCDs. Antioxidant capacity is also stronger than in GCDs, which have already been reported as antioxidant materials. Regarding cytotoxicity properties, TCDs are barely toxic for healthy cells; however, this cytotoxicity increased when using cells with a tumoral origin (in our case, lung cancer), which might indicate potential antitumor capacity for this type of carbon dot. Further research is needed to prove their selectivity to tumoral cells, with the aim of finding new agents that avoid the current toxicity of chemotherapy in healthy cells.
Future research lines include the incorporation of antioxidant TCDs in thin polymeric films to prepare novel materials for foodstuff packing. Furthermore, and taking into ac-count the cytotoxicity data, these TCDs may also be tested for the vehiculization of known antitumoral chemicals on specific cancer cells.

Author Contributions

Conceptualization, R.B.-L. and A.F.-G.; methodology, S.R.-V., T.F. and C.M.; formal analysis, T.F., R.B.-L., S.R.-V., C.M., Á.J.O. and A.F.-G.; investigation, T.F., R.B.-L., S.R.-V., C.M., Á.J.O. and A.F.-G.; writing—original draft preparation, A.F.-G.; writing—review and editing, A.F.-G. and R.B.-L.; project administration and funding acquisition, R.B.-L. All authors have read and agreed to the published version of the manuscript.

Funding

This research was funded by the Ministerio de Ciencia, Innovación y Universidades (MCIU), Agencia Estatal de Investigación (AEI) and European Regional Development Fund (FEDER), Project # RTI2018-099756-B-I00 (MCIU/AEI/FEDER, UE). Sandra Rodríguez Varillas was finantially supported by The Principality of Asturias Administration under the Program Severo Ochoa for the research and education formation in the Principality of Asturias.

Institutional Review Board Statement

Not applicable.

Informed Consent Statement

Not applicable.

Data Availability Statement

The data presented in this study are available on request from the corresponding author.

Acknowledgments

Sandra Rodríguez Varillas wants to acknowledge the Administration of the Principality of Asturias for the grant of a Severo Ochoa fellowship. Authors acknowledge Scientific-technical services of the University of Oviedo for the measurements.

Conflicts of Interest

The authors declare no conflict of interest. The funders had no role in the design of the study; in the collection, analyses, or interpretation of data; in the writing of the manuscript, or in the decision to publish the results.

References

  1. Xu, X.; Ray, R.; Gu, Y.; Ploehn, H.J.; Gearheart, L.; Raker, K.; Scrivens, W.A. Electrophoretic Analysis and Purification of Fluorescent Single-Walled Carbon Nanotube Fragments. J. Am. Chem. Soc. 2004, 126, 12736–12737. [Google Scholar] [CrossRef]
  2. Kurian, M.; Paul, A. Recent trends in the use of green sources for carbon dot synthesis—A short review. Carbon Trends 2021, 3, 100032. [Google Scholar] [CrossRef]
  3. Ridha, A.A.; Pakravan, P.; Azandaryani, A.H.; Zhaleh, H. Carbon dots; the smallest photoresponsive structure of carbon in advanced drug targeting. J. Drug Deliv. Sci. Technol. 2020, 55, 101408. [Google Scholar] [CrossRef]
  4. Ma, Y.S.; Xu, G.H.; Wei, F.D.; Cen, Y.; Song, Y.Y.; Ma, Y.J.; Xu, X.M.; Shi, M.L.; Sohail, M.; Hu, Q. Carbon dots based immunosorbent assay for the determination of GFAP in human serum. Nanotechnology 2018, 29, 145501. [Google Scholar] [CrossRef] [PubMed]
  5. Lu, S.M.; Li, G.L.; Lv, Z.X.; Qiu, N.N.; Kong, W.H.; Gong, P.W.; Chen, G.; Xia, L.; Guo, X.X.; You, J.M.; et al. Facile and ultrasensitive fluorescence sensor platform for tumor invasive biomaker beta-glucuronidase detection and inhibitor evaluation with carbon quantum dots based on inner-filter effect. Biosens. Bioelectron. 2016, 85, 358–362. [Google Scholar] [CrossRef] [PubMed]
  6. Dhenadhayalan, N.; Lin, K.C.; Saleh, T.A. Recent Advances in Functionalized Carbon Dots toward the Design of Efficient Materials for Sensing and Catalysis Applications. Small 2020, 16, 1905767. [Google Scholar] [CrossRef] [PubMed]
  7. Atabaev, T.S. Doped Carbon Dots for Sensing and Bioimaging Applications: A Minireview. Nanomaterials 2018, 8, 342. [Google Scholar] [CrossRef] [Green Version]
  8. Fernando, K.A.S.; Sahu, S.; Liu, Y.M.; Leiws, W.K.; Guliants, E.A.; Jafariyan, A.; Wang, P.; Bunker, C.E.; Sun, Y.P. Carbon Quantum Dots and Applications in Photocatalytic Energy Conversion. ACS App. Mat. Inter. 2015, 7, 8363–8376. [Google Scholar] [CrossRef] [PubMed]
  9. Anastas, P.T.; Warner, J.C. Green Chemistry: Theory and Practice; Oxford University Press: New York, NY, USA, 1998; Volume 30. [Google Scholar]
  10. OECD, Sustainable chemistry, Retrieved 14 December 2021. Available online: http://www.oecd.org/env/ehs/risk-management/sustainablechemistry.htm (accessed on 11 December 2021).
  11. Hsu, P.-C.; Chang, H.-T. Synthesis of high-quality carbon nanodots from hydrophilic compounds: Role of functional groups. Chem. Comm. 2012, 48, 3984–3986. [Google Scholar] [CrossRef]
  12. Sahu, S.; Behera, B.; Maiti, T.K.; Mohapatra, S. Simple one-step synthesis of highly luminescent carbon dots from orange juice: Application as excellent bio-imaging agents. Chem. Comm. 2012, 48, 8835–8837. [Google Scholar] [CrossRef]
  13. Scherlinger, M.; Tsokos, G.C. Reactive oxygen species: The Yin and Yang in (auto-)immunity. Autoimmun. Rev. 2021, 20, 102869. [Google Scholar] [CrossRef] [PubMed]
  14. Galadari, S.; Rahman, A.; Pallichankandy, S.; Thayyullathil, F. Reactive oxygen species and cancer paradox: To promote or to suppress? Free Radic. Biol. Med. 2017, 104, 144–164. [Google Scholar] [CrossRef]
  15. Erge, H.S.; Karadeniz, F. Bioactive compounds and antioxidant activity of tomato cultivars. Int. J. Food Prop. 2011, 14, 968–977. [Google Scholar] [CrossRef]
  16. Liu, W.; Li, C.; Sun, X.; Pan, W.; Yu, G.; Wang, J. Highly crystalline carbon dots from fresh tomato: UV emission and quantum confinement. Nanotechnology 2017, 28, 485705. [Google Scholar] [CrossRef]
  17. Lai, Z.; Guo, X.; Cheng, Z.; Ruan, G.; Du, F. Green Synthesis of Fluorescent Carbon Dots from Cherry Tomatoes for Highly Effective Detection of Trifluralin Herbicide in Soil Samples. Chem. Sel. 2020, 5, 1956–1960. [Google Scholar] [CrossRef]
  18. Murru, C.; Badía-Laíño, R.; Díaz-García, M.E. Synthesis and Characterization of Green Carbon Dots for Scavenging Radical Oxygen Species in Aqueous and Oil Samples. Antioxidants 2020, 9, 1147. [Google Scholar] [CrossRef]
  19. Chattopadhyay, S.; Mehrotra, N.; Jain, S.; Singh, H. Development of novel blue emissive carbon dots for sensitive detection of dual metal ions and their potential applications in bioimaging and chelation therapy. Microchem. J. 2021, 170, 106706. [Google Scholar] [CrossRef]
  20. Bayda, S.; Amadio, E.; Cailotto, S.; Frión-Herrera, Y.; Perosa, A.; Rizzolio, F. Carbon dots for cancer nanomedicine: A bright future. Nanoscale Adv. 2021, 3, 5183. [Google Scholar] [CrossRef]
  21. Hong, W.T.; Yang, H.K. Anti-counterfeiting application of fluorescent carbon dots derived from wasted coffee grounds. Optik 2021, 241, 166449. [Google Scholar] [CrossRef]
  22. Lu, Q.; Zhang, Y.; Liu, S. Graphene quantum dots enhanced photocatalytic activity of zinc porphyrin toward the degradation of methylene blue under visible-light irradiation. Nanoscale 2014, 6, 1890–1895. [Google Scholar] [CrossRef]
  23. Díaz-Faes López, T.; Fernández-González, A.; Díaz-García, M.E.; Badía-Laíño, R. Highly efficient Förster resonance energy transfer between carbon nanoparticles and europium–tetracycline complex. Carbon 2015, 94, 142–151. [Google Scholar] [CrossRef]
  24. Chhabra, V.A.; Kaur, R.; Kumar, N.; Deep, A.; Rajesh, C.; Kim, K.-H. Synthesis and spectroscopic studies of functionalized graphene quantum dots with diverse fluorescence characteristics. RSC Adv. 2018, 8, 11446. [Google Scholar] [CrossRef] [Green Version]
  25. Wen, Z.-H.; Yin, X.-B. Excitation-Independent Carbon Dots, from Photoluminescence Mechanism to Single-Color Application. RSC Adv. 2016, 6, 27829–27835. [Google Scholar] [CrossRef]
  26. Du, J.; Cullen, J.J.; Buettner, G.R. Ascorbic acid: Chemistry, biology and the treatment of cancer. Biochim. Biophys. Acta 2012, 1826, 443–457. [Google Scholar] [CrossRef] [Green Version]
  27. Shi, L.; Zhao, B.; Li, X.; Zhang, G.; Zhang, Y.; Dong, C.; Shuang, S. Eco-friendly synthesis of nitrogen-doped carbon nanodots from wool for multicolor cell imaging, patterning, and biosensing. Sens. Actuators B Chem. 2016, 235, 316–324. [Google Scholar] [CrossRef]
  28. Pan, Y.; Inam, F.; Zhang, M.; Drabold, D.A. Atomistic Origin of Urbach Tails in Amorphous Silicon. Phys. Rev. Lett. 2008, 100, 206403. [Google Scholar] [CrossRef] [Green Version]
  29. Sun, Y.; Yu, Y.Y.; Cao, S.W. Antioxidant Capacity of Caffeic Acid, Phloretin and Glutathione Mixtures and Formula Optimization. Asn. J. Chem. 2013, 25, 3971–3978. [Google Scholar] [CrossRef]
Figure 1. HR-TEM image of (left) TCDs and (right) GCDs.
Applsci 12 00773 g001
Figure 2. Size distribution histogram (left) TCD (right) GCD.
Applsci 12 00773 g002
Figure 3. FTIR spectra of (black solid line) tomato juice, (blue dashed line) GCD and (red dotted line) TCD.
Applsci 12 00773 g003
Figure 4. Emission wavelength and intensity of TCDs at different pH values.
Applsci 12 00773 g004
Figure 5. (a) Tauc plots for estimation of the TCDs bandgap and (b) Urbach energy estimation for GCDs.
Applsci 12 00773 g005
Figure 6. Mechanism of DPPH·/ROS reduction by antioxidant TCD in aqueous media.
Applsci 12 00773 g006
Figure 7. (a) Cell viability at different exposition times to TCDs for healthy dermal fibroblasts and (b) cell viability at different exposition times to TCDs for A549 lung carcinoma. Red color is control, brown is 100 ppm TCDs and green is 1000 ppm TCDs.
Applsci 12 00773 g007
Table 1. DPPH% inhibition at different concentrations of CDs.
[CDs]/ppm48121620
% inhibition TCDs54.7%59.6%61.0%63.1%63.8%
% inhibition GCDs21.0%39.0%46.0%53.0%60.0%
Publisher’s Note: MDPI stays neutral with regard to jurisdictional claims in published maps and institutional affiliations.

