Article

Numerical Study of Geotextile-Reinforced Flexible Pavement Overlying Low-Strength Subgrade

by
Zihong Yin
1,
Kevin Maraka Ndiema
1,2,*,
Raymond Leiren Lekalpure
1 and
Clement Kiprotich Kiptum
2
1
School of Civil Engineering, Southwest Jiaotong University, Chengdu 610031, China
2
Department of Civil and Structural Engineering, School of Engineering, University of Eldoret, Eldoret P.O. Box 1125-30100, Kenya
*
Author to whom correspondence should be addressed.
Appl. Sci. 2022, 12(20), 10325; https://doi.org/10.3390/app122010325
Submission received: 10 September 2022 / Revised: 7 October 2022 / Accepted: 8 October 2022 / Published: 13 October 2022
(This article belongs to the Section Civil Engineering)

Abstract

:
Construction of low-volume flexible pavements on low-strength subgrade poses design, construction, and maintenance challenges. While researchers have generally acknowledged the potential for geosynthetics as reinforcement material, they mainly focused on permanent deformation. Therefore, this paper presents a numerical study of low-volume flexible pavement reinforced with geotextile material under static loading to determine the improvement due to reinforcement based on three criteria: rutting performance, geosynthetic placement location, and base course thickness reduction. Based on the Finite Element Method (FEM), three-dimensional modeling using Abaqus/CAE software was performed. From the study, a significant decrease in rutting of up to 25.2% for the unreinforced pavement system was attained with geotextile reinforcement at base–subgrade and AC–base interfaces. The deflection response behavior of the pavement system is affected by the elastic modulus of the geosynthetic material, placement location, and the number of reinforcement layers. As a result of reinforcement, a base course thickness reduction of up to 30% was achieved without sacrificing the pavement’s structural integrity.

1. Introduction

A large percentage of global road network infrastructure comprises low-volume roads (LVRs), accounting for over 80% [1]. Most of the LVRs serve rural areas, such as farming areas, national forests, and remote mountainous areas, and, in some low-income countries, they serve part of the urban population [2]. They include both paved and unpaved roads. The paved roads are built as granular pavements with bituminous surfacing. Unpaved roads are usually composed of granular bases placed on the prepared subgrade.
Compared to higher volume roads, LVRs differ in design, road users, and the nature of the operation. The design may lack certain characteristics, such as super elevation in the case of curves, cross slopes meant for drainage, and adequate maintenance. Road users include heavy vehicles, pedestrians, passenger vehicles, cyclists, farm machinery, and more. In terms of operation, LVRs may lack posted speed limits and rely on the statutory limit. Most LVRs experience higher deterioration and, consequently, do not last for the entirety of their designed lifespan. According to Chandak et al. [3] and Otto et al. [4], the significant challenges facing LVRs include: increased traffic loads, variation in climatic conditions, and absence or untimely maintenance.
Geosynthetics have emerged among sustainable and cost-effective construction materials [5]. Some of the most widely used forms of geosynthetics in terms of flexible pavement are geotextiles, geogrids, geocomposites, geocells, geonets, geofoams, and geobags [6,7,8]. They perform one or more of the following functions: separation, sealing lateral drainage, filtration, and reinforcement [9,10]. Separation involves placing geosynthetic material between two pavement layers with different particle size distribution in order to prevent mixing and maintain their integrity. In pavement overlays, geosynthetics minimize crack propagation by sealing the asphalt layer [11,12]. The ability of geosynthetic material to allow liquid to flow across the plane while restricting the movement of fine particles enables it to perform a filtration function [13]. Reinforcement is aided by developing tensile forces in geosynthetic material, which helps improve the stability of the geosynthetic–soil composite system. The effectiveness of reinforcement by geosynthetic materials is influenced by factors such as the engineering and geometric properties of the geosynthetics and subgrade stiffness [14,15]. Reinforcement increases the area in which the wheel load is distributed, resulting in a decrease in vertical stress and subgrade deformation [16].
Geotextiles are polymeric textile materials that are permeable and exist as flexible sheets. Based on the manufacturing process, they are categorized as woven, non-woven, knitted, or stitch-bonded [17]. Many researchers have studied geosynthetics as reinforcement materials in pavement using three approaches: full-scale field studies, laboratory experiments, and numerical modeling.
The Finite Element Method is a reliable technique that can simulate tire–pavement interaction and predict pavement responses [18]. For instance, Siriwardane et al. [19] investigated the effectiveness of using glass fiber grids to reinforce the asphalt layer in the flexible pavement through experiments and the FEM. It was concluded that glass fiber grids improved pavement performance and provided resistance against crack propagation. In a parametric analysis based on 2-D Finite Element modeling by Neves et al. [20], which aimed to determine the impact of reinforcing the subgrade using a geogrid in pavement design, it was noted that the number of load cycles increased due to reinforcement, indicating increased pavement life. The application of geogrids in road pavements on karst geohazards zones was analyzed using numerical simulation by Conrado-Palafox et al. [21]. It was concluded that embedding the geogrid between the bedrock and the subgrade mitigated the failure effectively. A study conducted by Taherkhani et al. [22] focused on the impact of geosynthetic reinforcement in asphalt pavements on critical strains under different levels of axle loads. Three kinds of geogrid materials were used. It was noted that the placement of a geogrid beneath the asphalt layer reduced longitudinal tensile strain, which is in agreement with the findings from Ibrahim et al. [23]. Moreover, it was also observed that, with higher axle loads, a geogrid placed at the subgrade was more effective in minimizing compressive strain on the subgrade. The strength of the subgrade has an impact on the effectiveness of geosynthetic reinforcement. In the previous work of Kim and Lee [24], it was reported that geogrid placement on a weak subgrade was more effective than placing it on stronger subgrades. In the same study, a more significant reduction in surface deflection was achieved when a thinner asphalt layer was used.
Finite Element modeling of low-volume flexible pavement reinforced with a geogrid was conducted by Calvarano et al. [25] using a 2-D FE model. The geogrid was placed at the base–subgrade interface in their study, and the pavement model was exposed to a cyclic load. The study reported a significant decrease in vertical deformation for the reinforced section. Mousavi et al. [26] performed 3-D FEA and an experimental study of unpaved roads reinforced with a geogrid under cyclic loading. The study observed minimum surface deformation when the geogrid was embedded at a depth equivalent to half of the radius of the loaded area. Leonardi et al. [1] carried out 3-D FEA of unpaved pavement reinforced with a geogrid under cyclic loading and concluded that placing a glass fiber grid at the base–subgrade interface was more effective.
While past studies have generally acknowledged the potential for geosynthetics as reinforcement material, they mainly focused on a single criterion. Therefore, this paper presents a numerical analysis of low-volume flexible pavement reinforced with geotextile material under static loading to determine the improvement due to reinforcement based on three criteria: rutting performance, geosynthetic placement location, and base course thickness reduction. Various pavement material characteristics were used to define material properties and behavior. The study is based on 3-D Finite Element Analysis using ABAQUS software.

2. Materials and Methods

2.1. Pavement Materials

Mechanical properties of surfacing, the granular base, and subgrade materials are shown in Table 1. The main engineering properties considered are the elastic modulus, Poisson ratio, density, and the Mohr–Coulomb plasticity model parameters as shown in Table 2. To get as realistic parameters as possible for Finite Element Analysis, previous studies [27,28] and codes of practice for low-volume seal roads [28] were considered.
Three types of woven geotextiles were selected in terms of strength and elastic modulus. They have been classified as soft, medium, and stiff. Each geotextile’s elastic moduli were sourced from published material [29], as determined based on wide-width tensile properties in line with American Society for Testing and Materials (ASTM) guidelines D4595 [30].

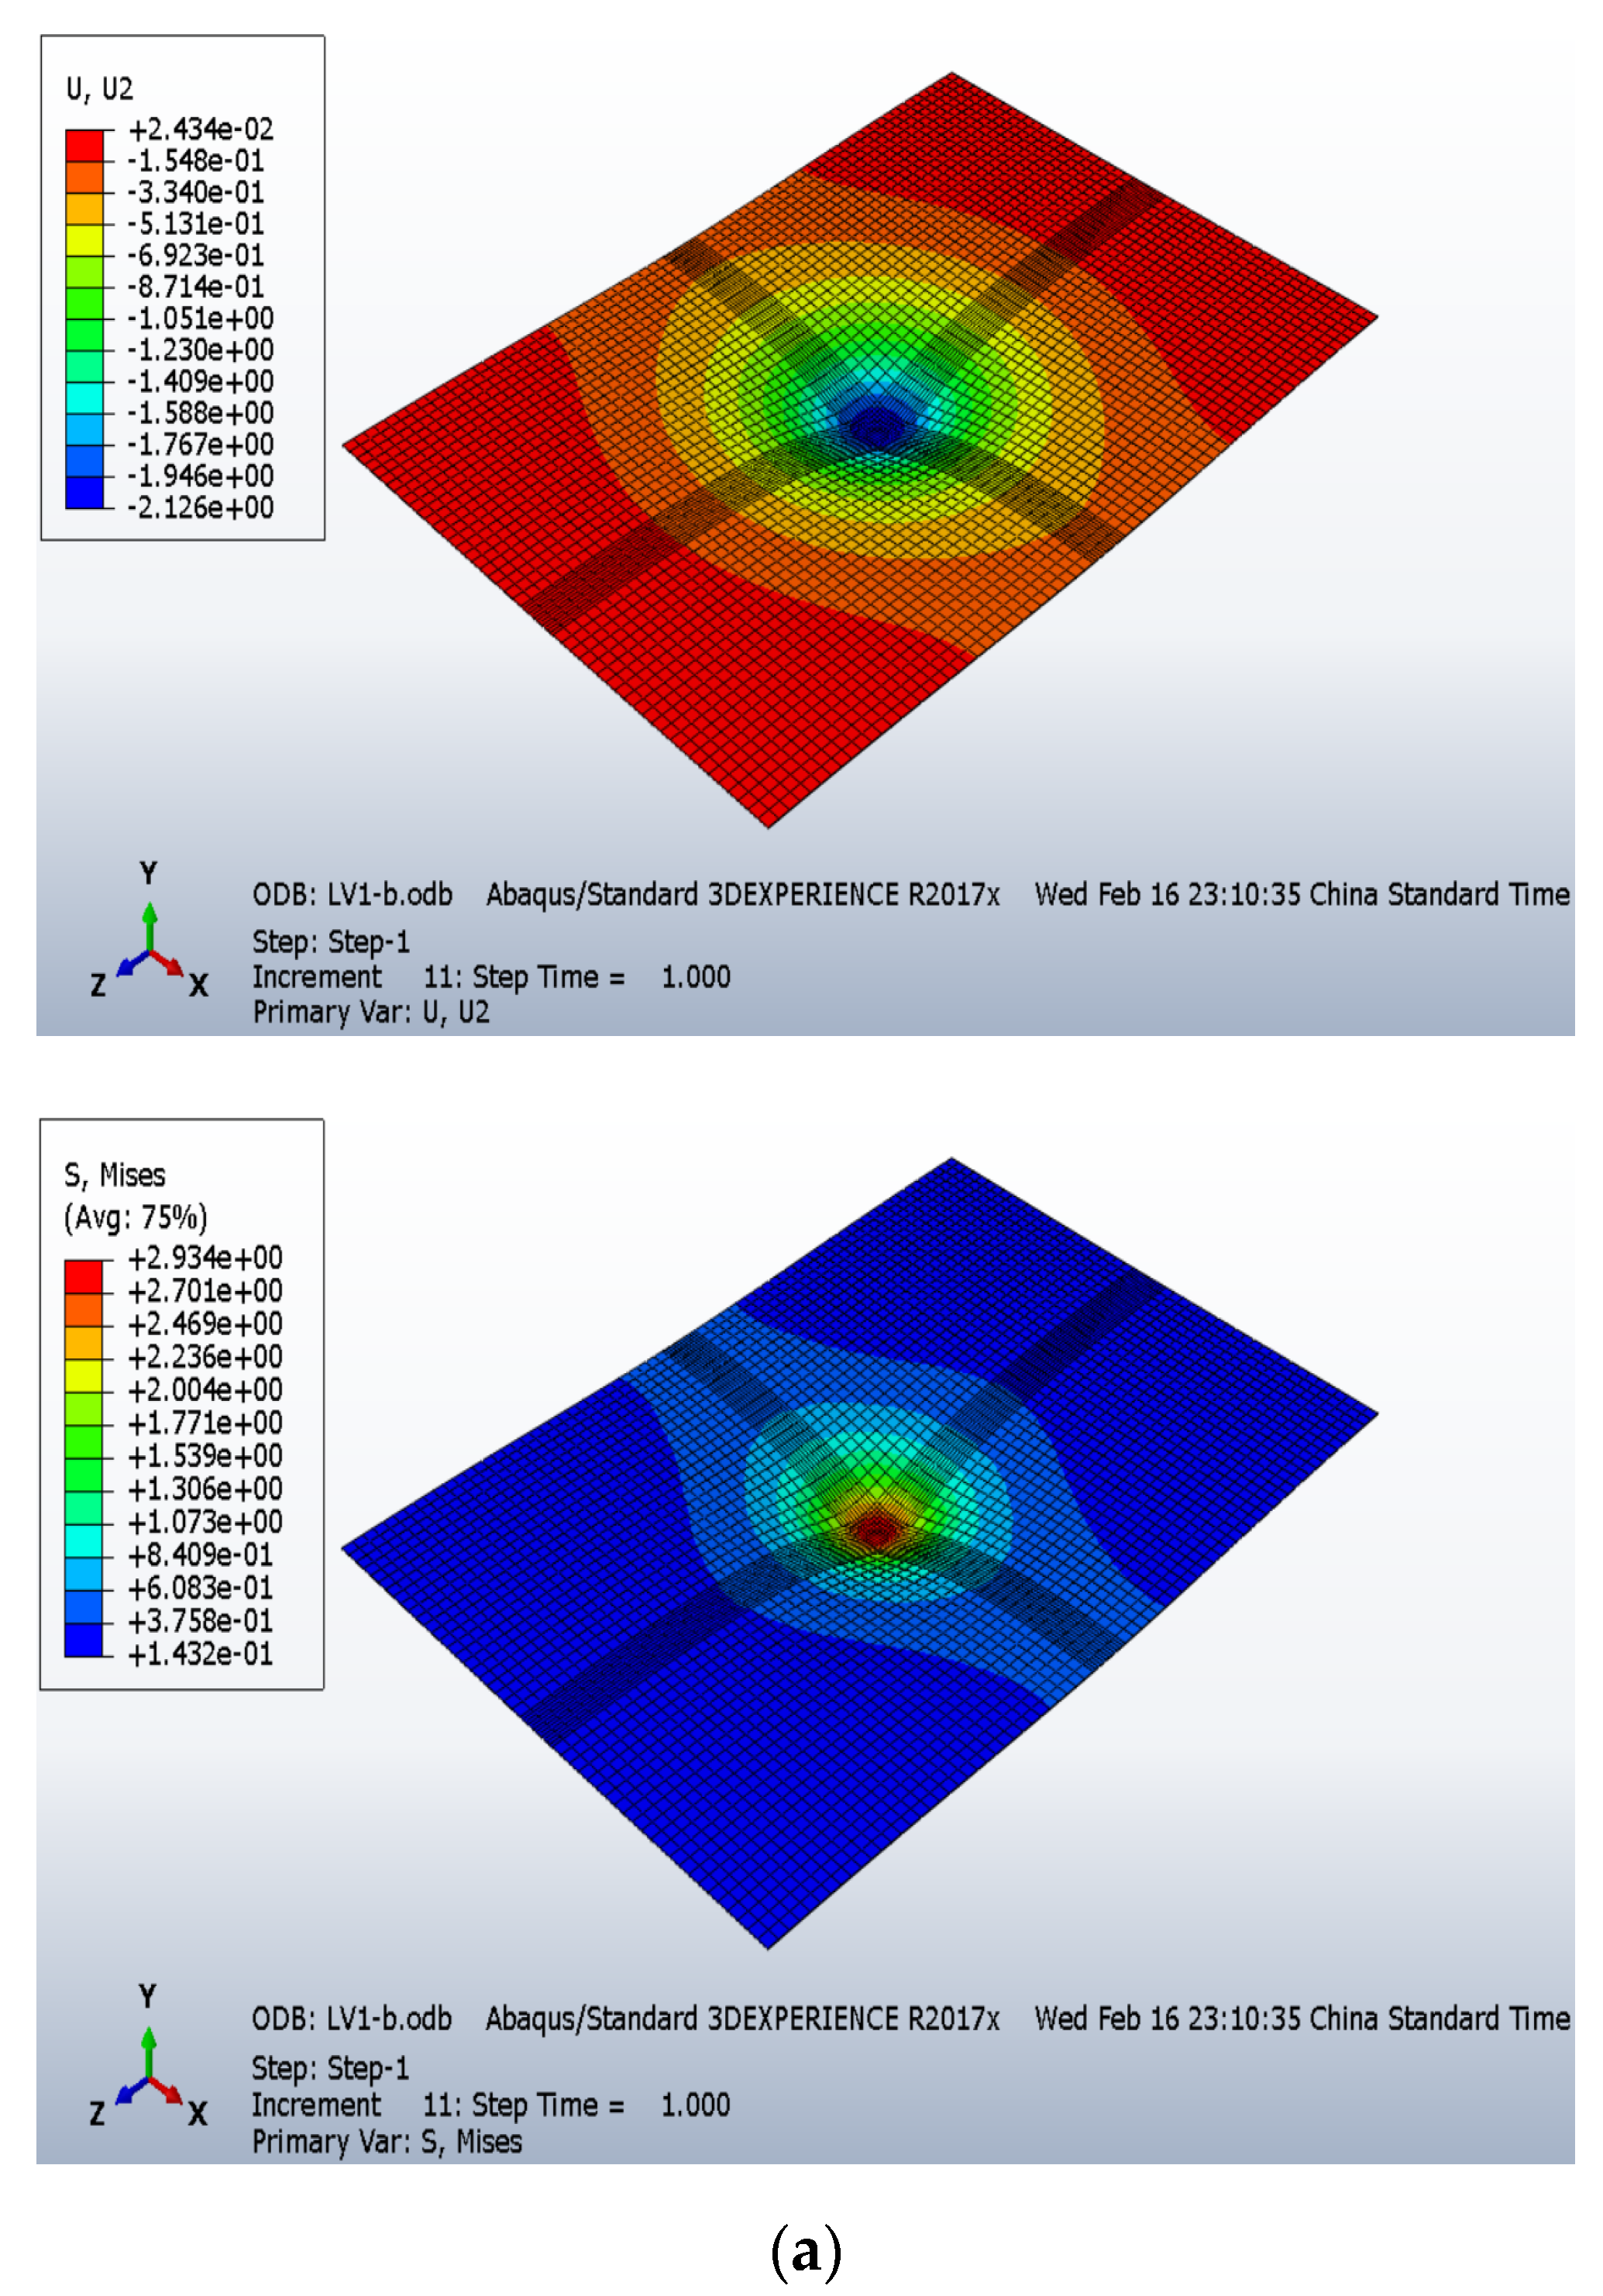
2.2. Finite Element Modeling

Abaqus/CAE software was used to conduct three-dimensional modeling based on the Finite Element Method as shown in. The Abaqus environment is made up of modules which define logical aspects in the modeling process, such as model geometry, material properties, and the mesh.
The dimensions of the pavement model section considered in the study were 3500 mm in the x-direction and 5000 mm in the z-direction. In contrast, the y-direction dimension varied based on the reinforcement schemes. The expression for the global governing equation is as follows [31]:
[K]{t} = {T}
where:
[K] = global stiffness matrix.
{t} = global displacement vector.
{T} = global load vector.
A linear elastic constitutive model described the material behavior of the asphalt concrete. The Mohr–Coulomb model described the characteristics of base and subgrade materials. An Equivalent Single Axle Load (ESAL) of 80 kN was considered. A static loading with an amplitude of 40 kN was applied over a square area with a side length of 2.64 mm [32] at the center of the pavement model to simulate heavy vehicular traffic. This represented half of the ESAL considered.
In defining model boundary conditions, all nodes parallel to the y-axis were free to move vertically but were constrained against horizontal movement. Encastre boundary conditions were applied at the bottom of the model, and this ensured that all degrees of freedom were constrained in the specified area (U1 = U2 = U3 = UR1 = UR2 = UR3 = 0). The boundary conditions are shown in Figure 1a.
A fine mesh was used at the loading area to capture the strain and stress gradients well as shown in Figure 1b. A general-purpose linear hexahedron type C3D8R was used for the elements. This type of element is advantageous because of its reduced integration. A membrane element was used to characterize the behavior of the geotextile, a three-dimensional deformable shell planar.
The interaction feature utilized in this study is based on ‘master’ and ‘slave’ surfaces. The master surface defines the rigid surface, while the slave represents a deformable surface. Interaction properties included normal and tangential interactions. A tie condition was introduced to simplify the model. This ensures that every node on the slave surface is tied to the nearest node on the master surface in order to achieve perfect bonding between the pavement layers. In this case, the nodes of pavement layers at the interface experience the same magnitude of displacement in all directions, thus avoiding slippage.

2.3. Validation

The FEA output was first compared with small-scale laboratory model tests for geosynthetic-reinforced sand under a square footing by Latha et al. [33]. A steel tank measuring 900 mm × 900 mm × 600 mm was used to perform the model tests, and a square steel plate of with sides of 150 mm and thickness of 25 mm was used as a footing. The geosynthetic material used had an elastic modulus of 1100 MPa and a Poisson ratio of 0.3. Figure 2 shows the comparison of load–displacement for the experimental work and the numerical simulation results for the unreinforced and reinforced sections. There is a general agreement between FEA and the laboratory model tests. However, there are a few discrepancies that are less pronounced regarding the bearing capacity of the soil. Therefore, the developed FEA model can be used confidently to conduct geosynthetically reinforced pavement analysis.

3. Results and Discussion

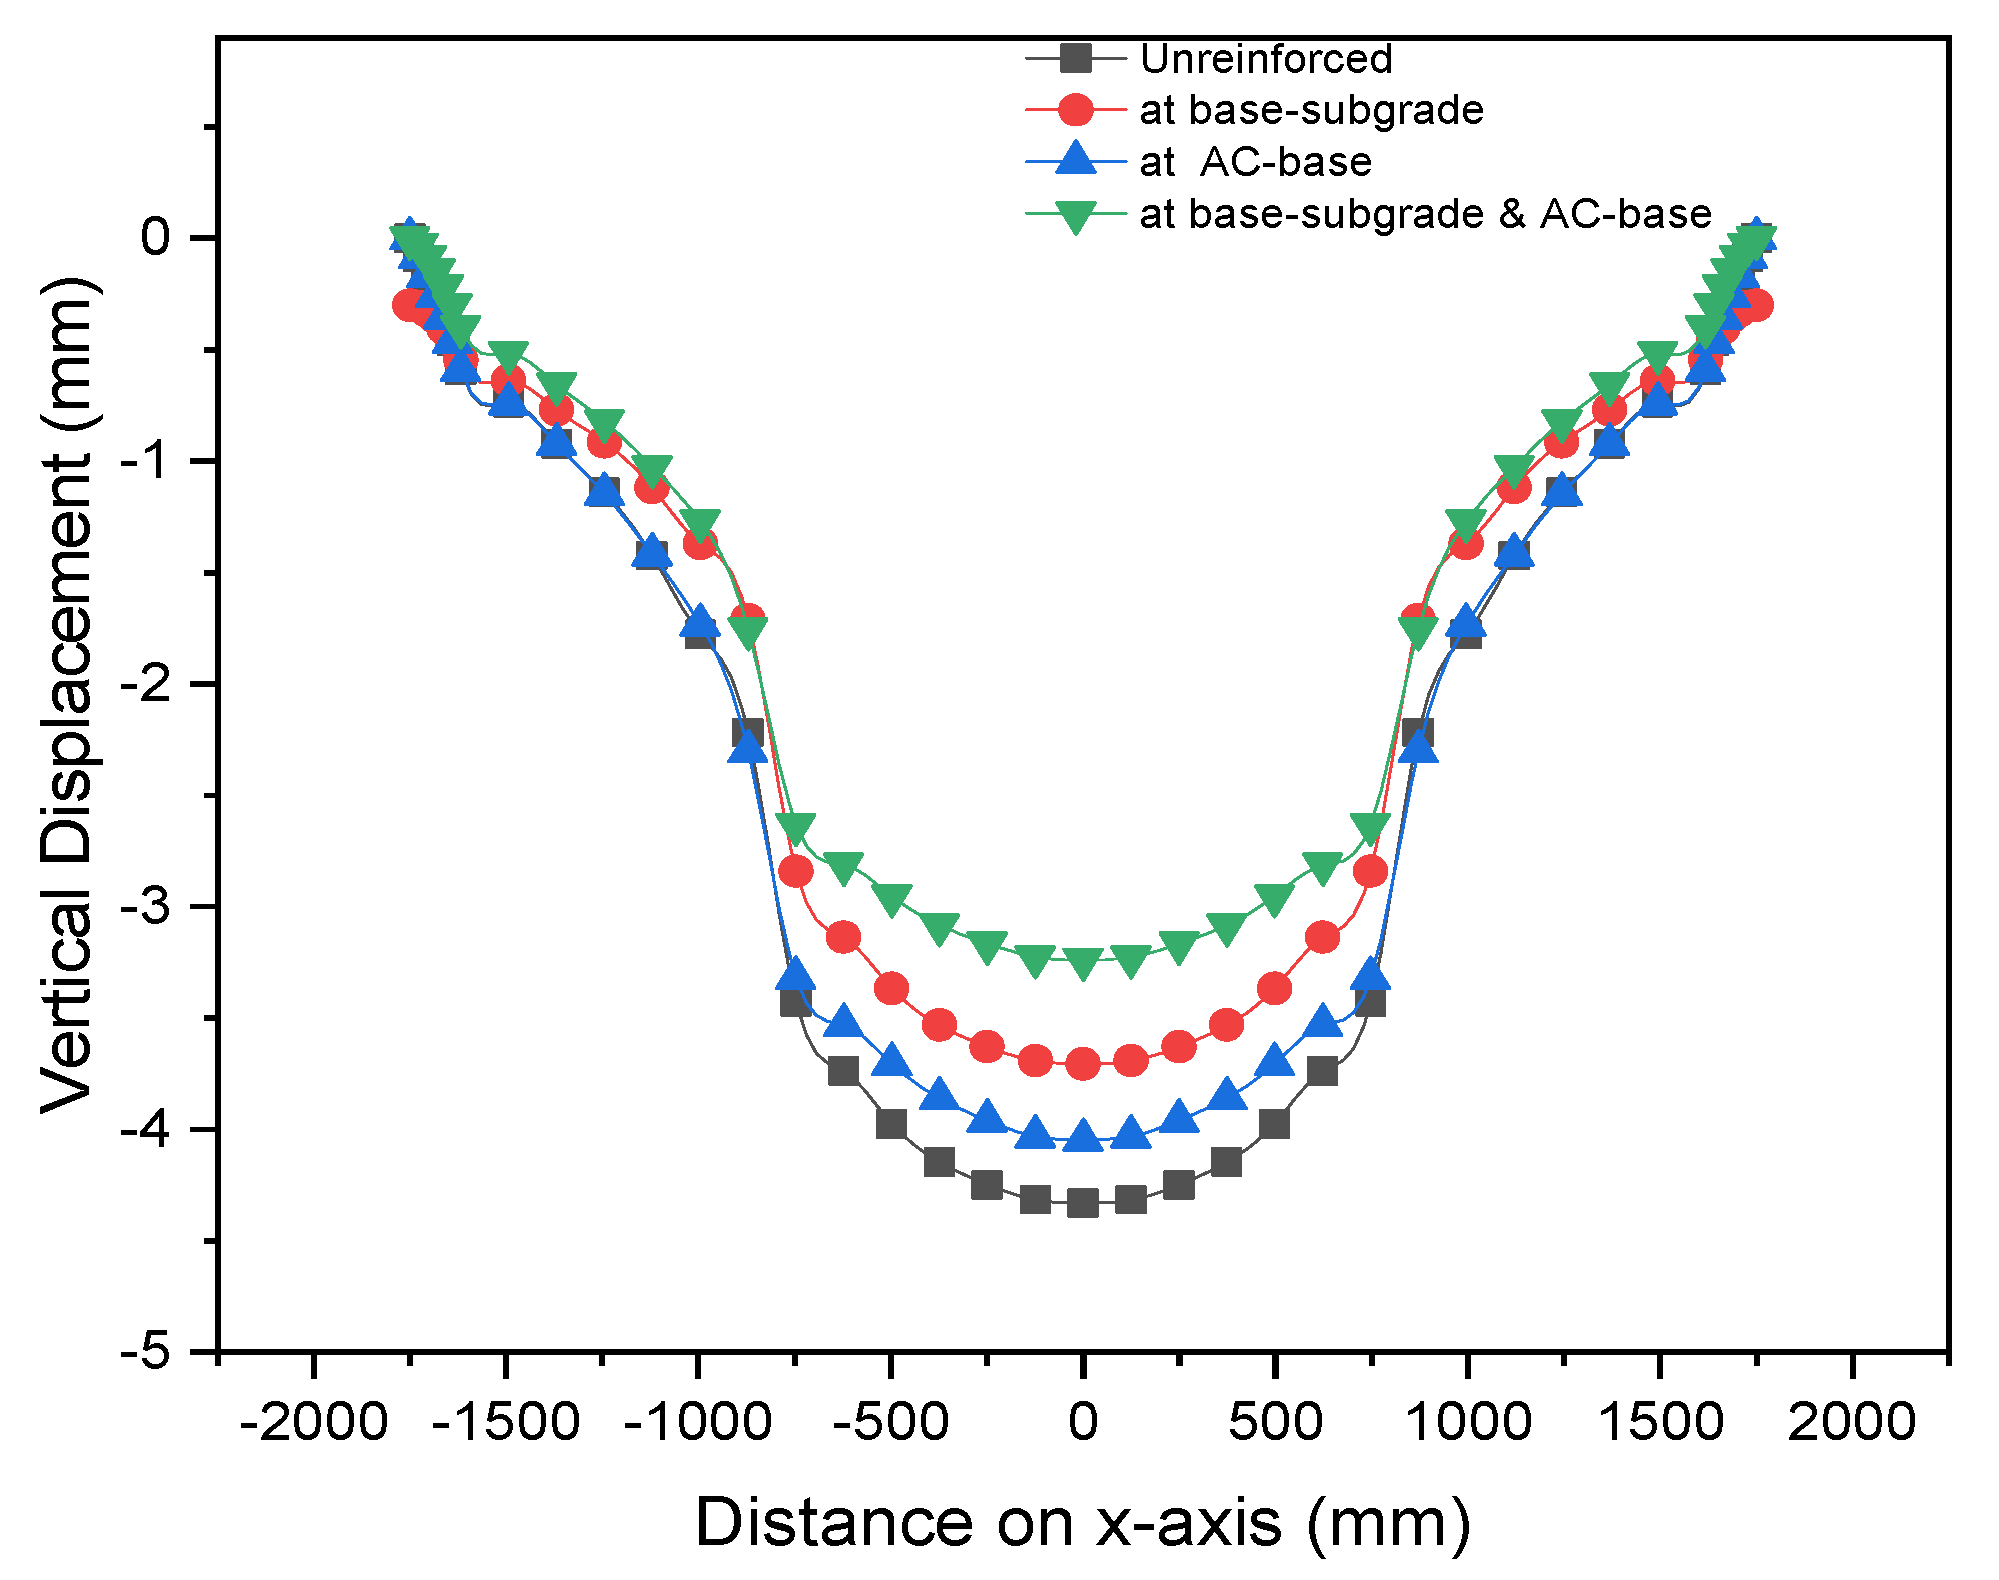
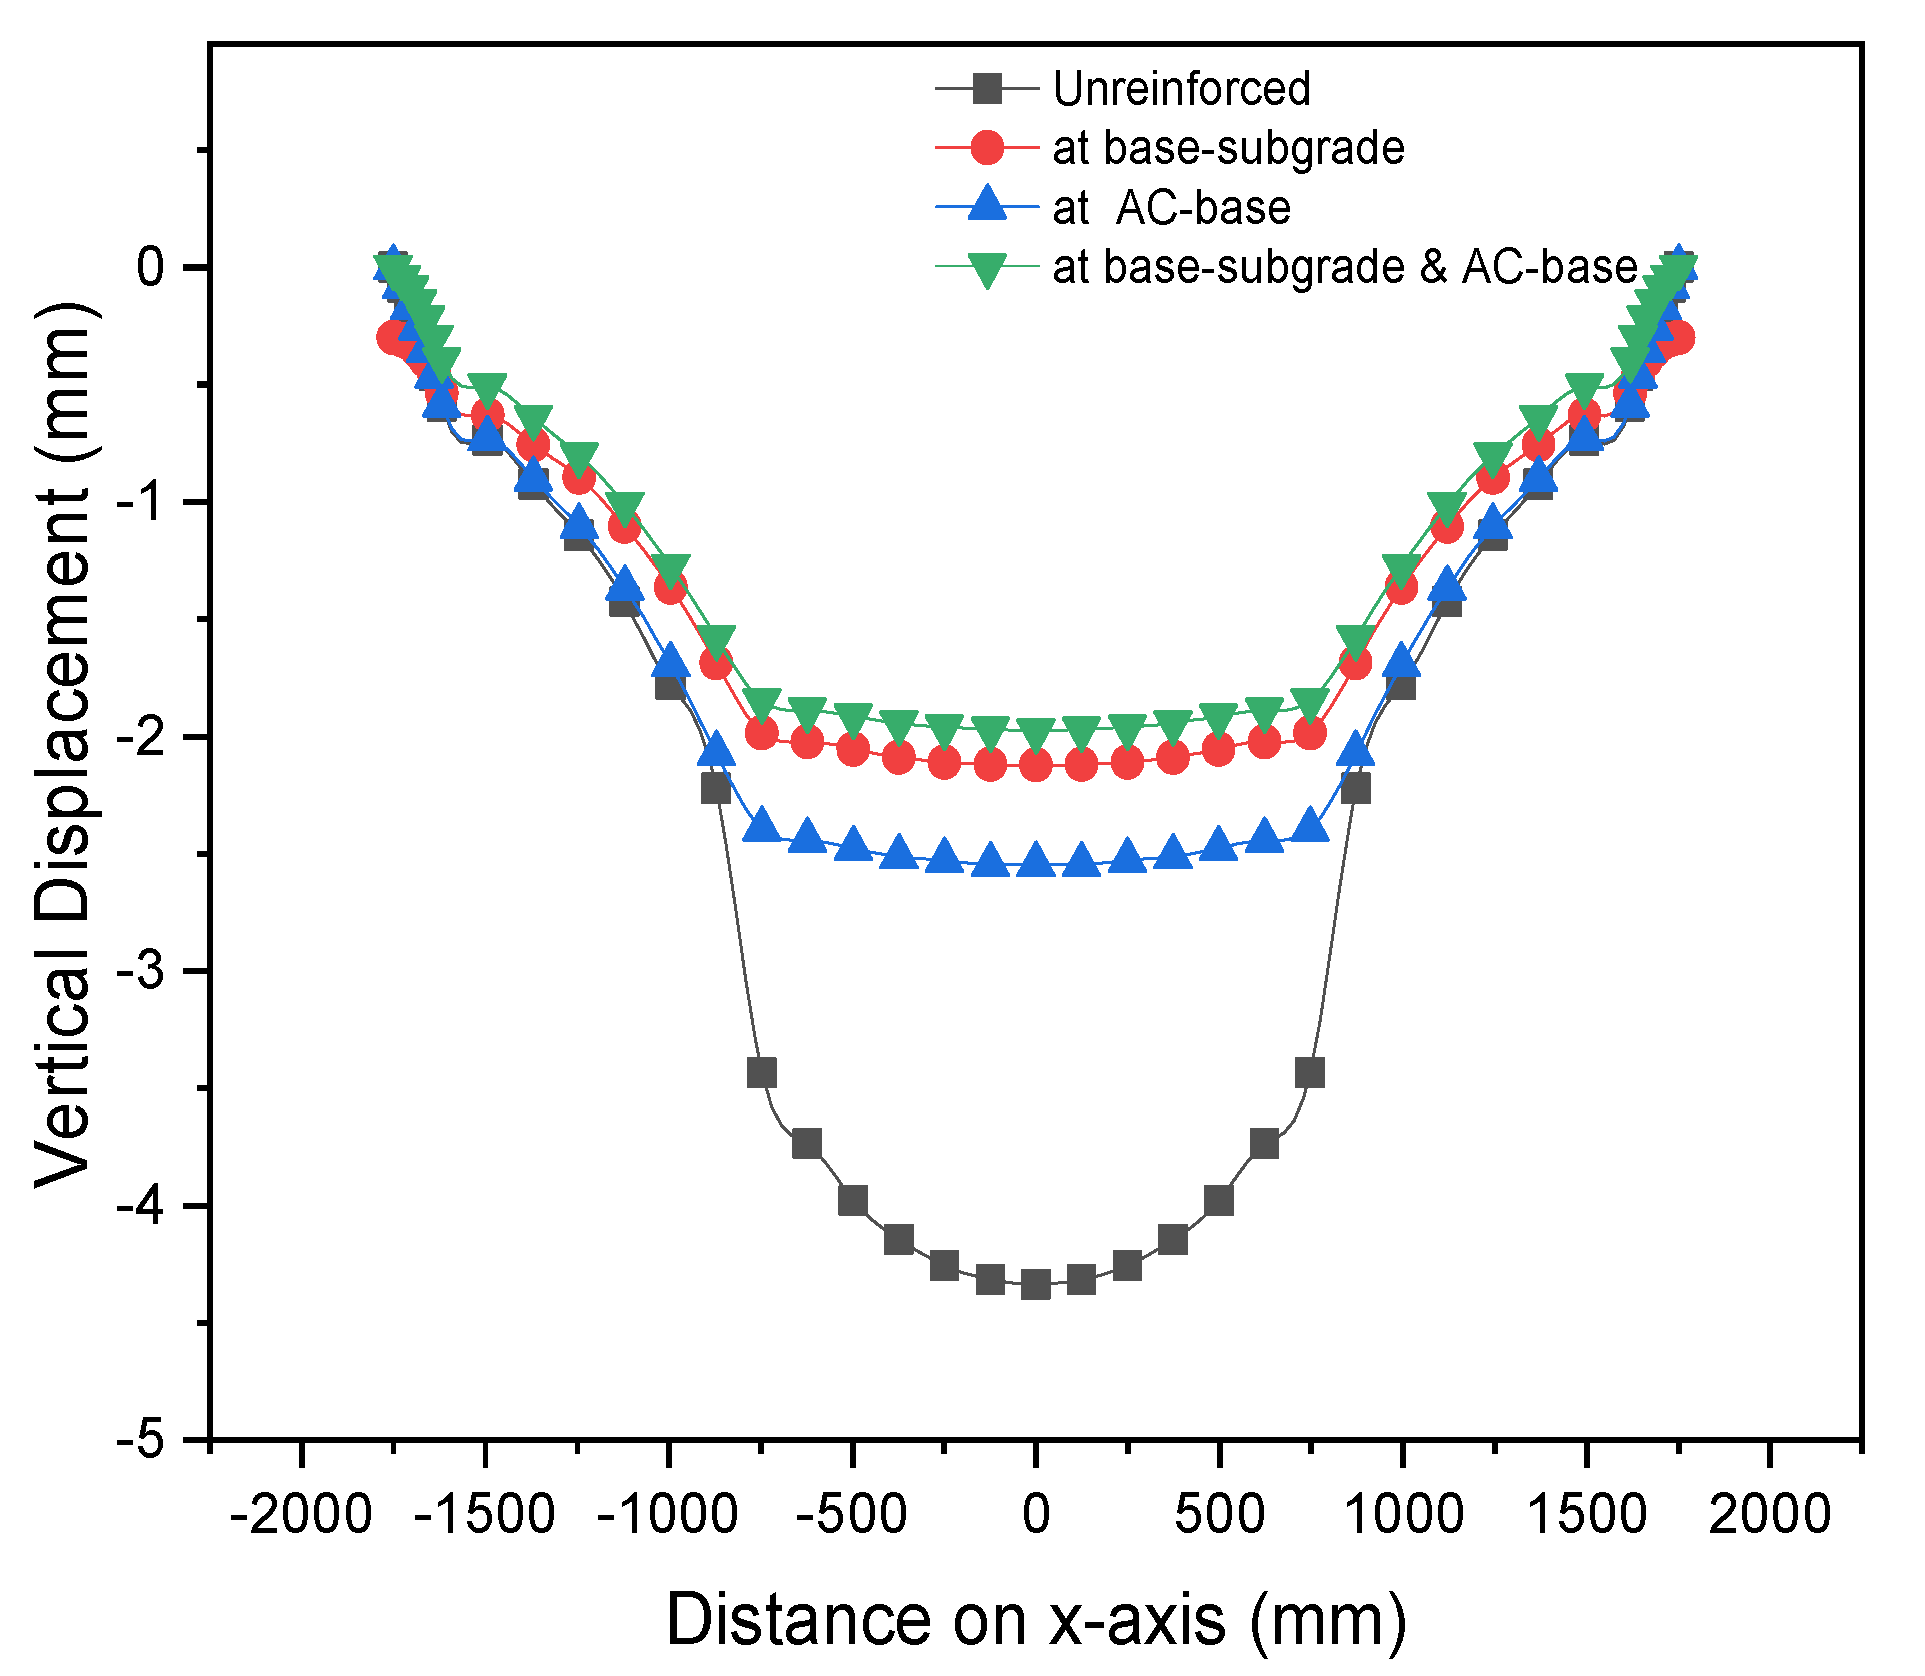
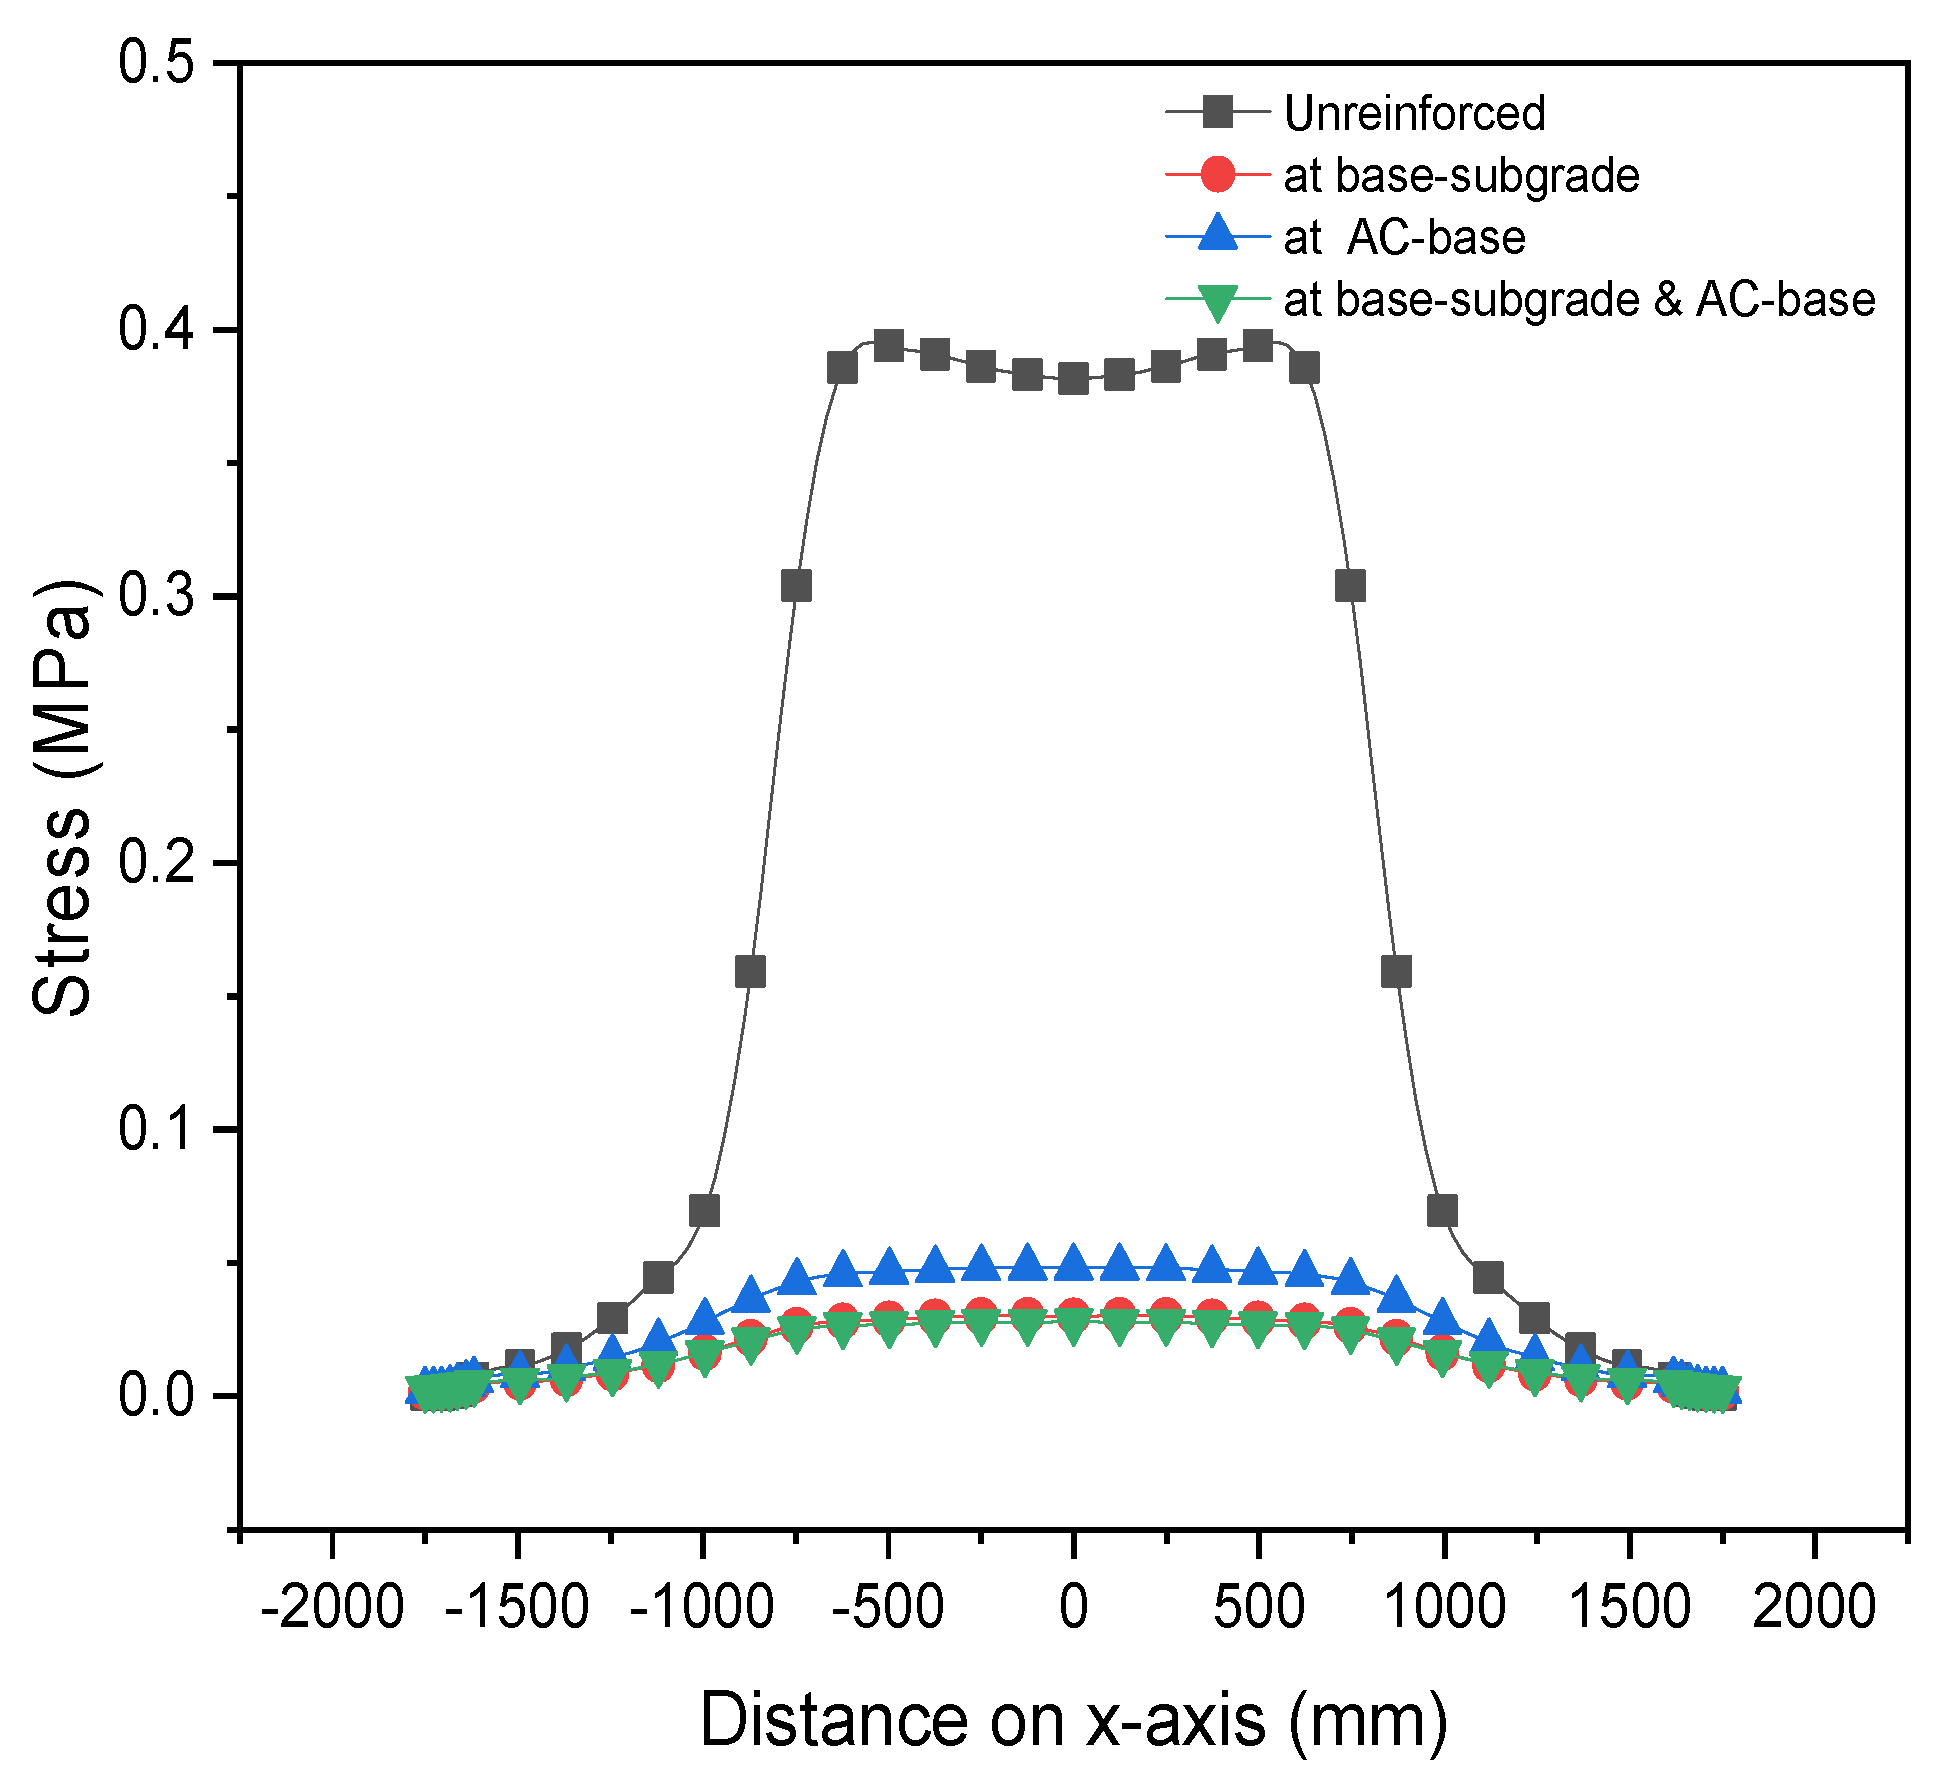
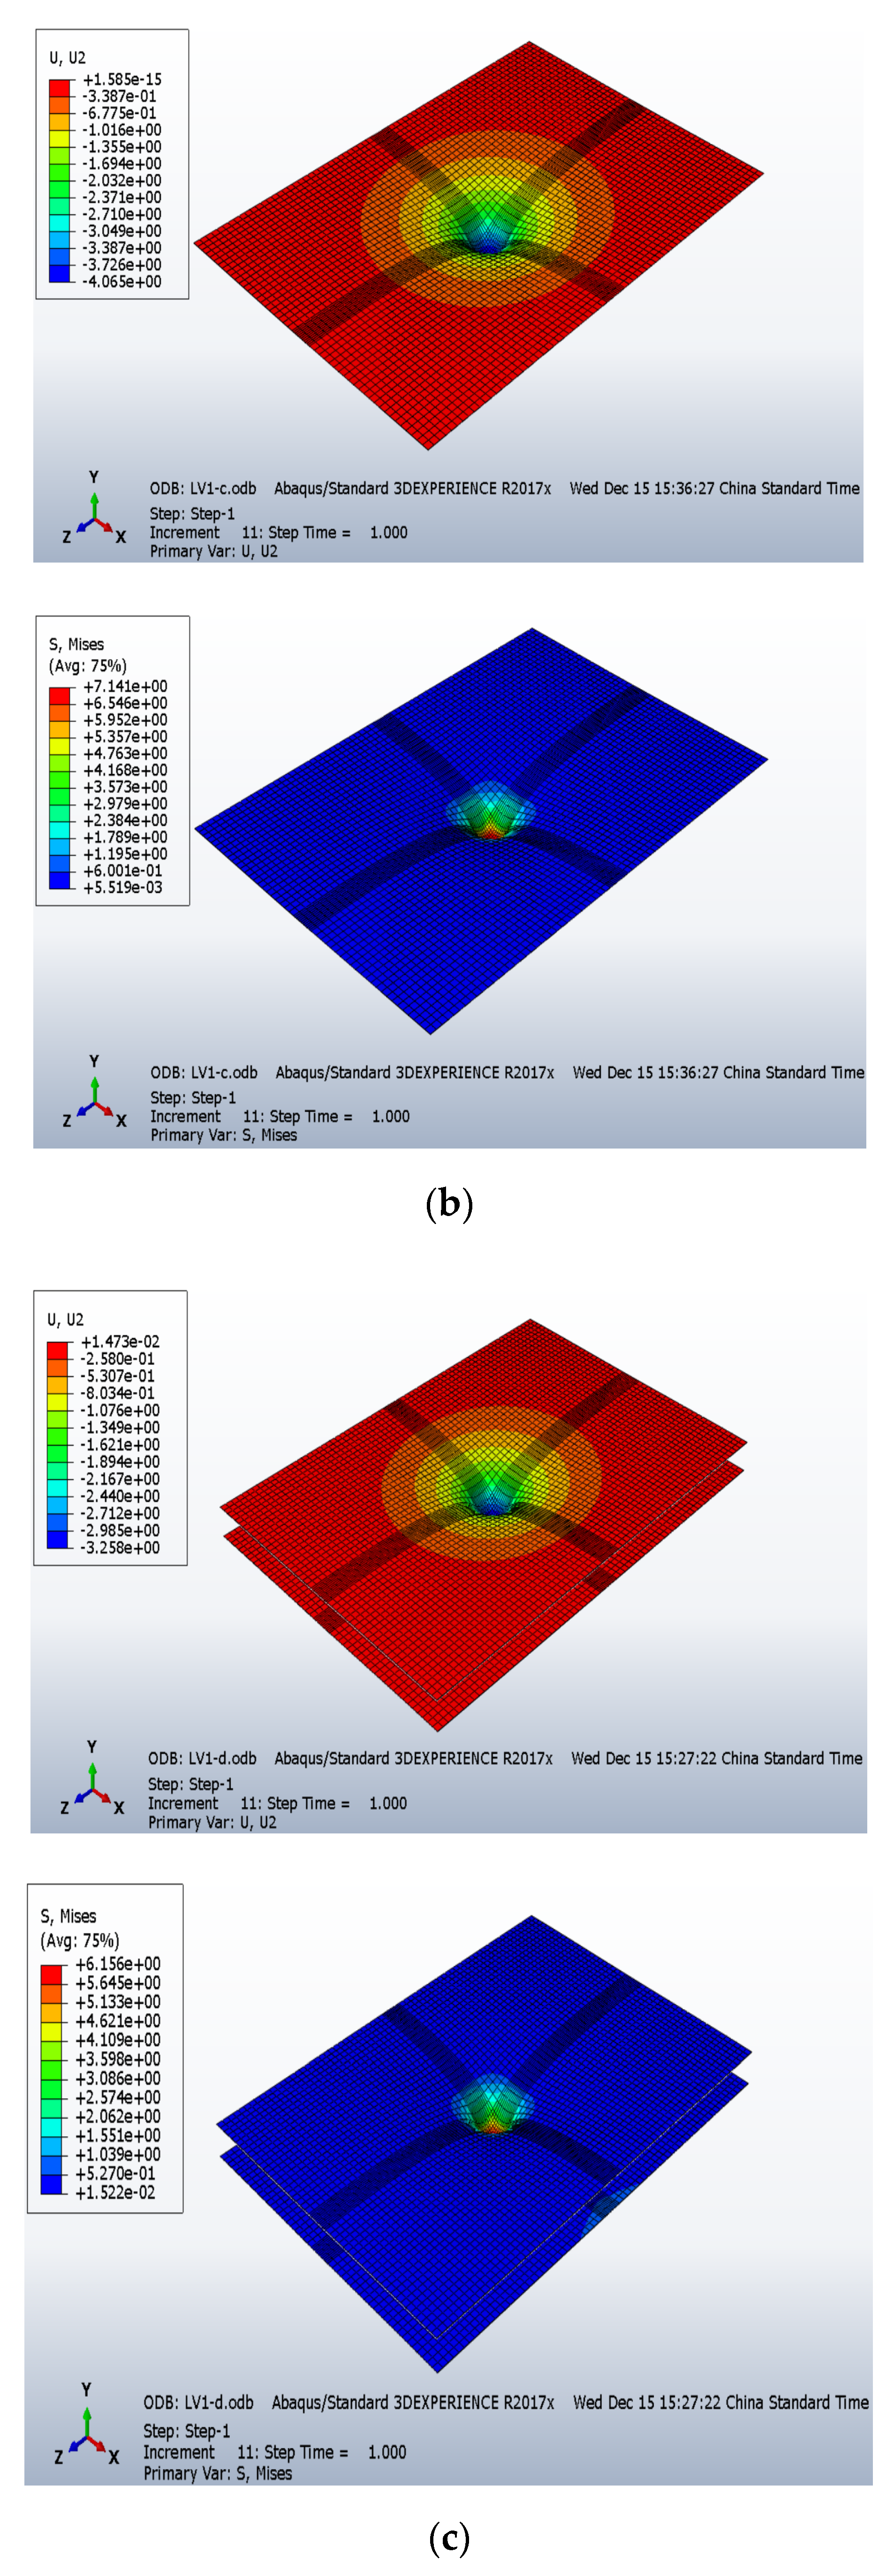
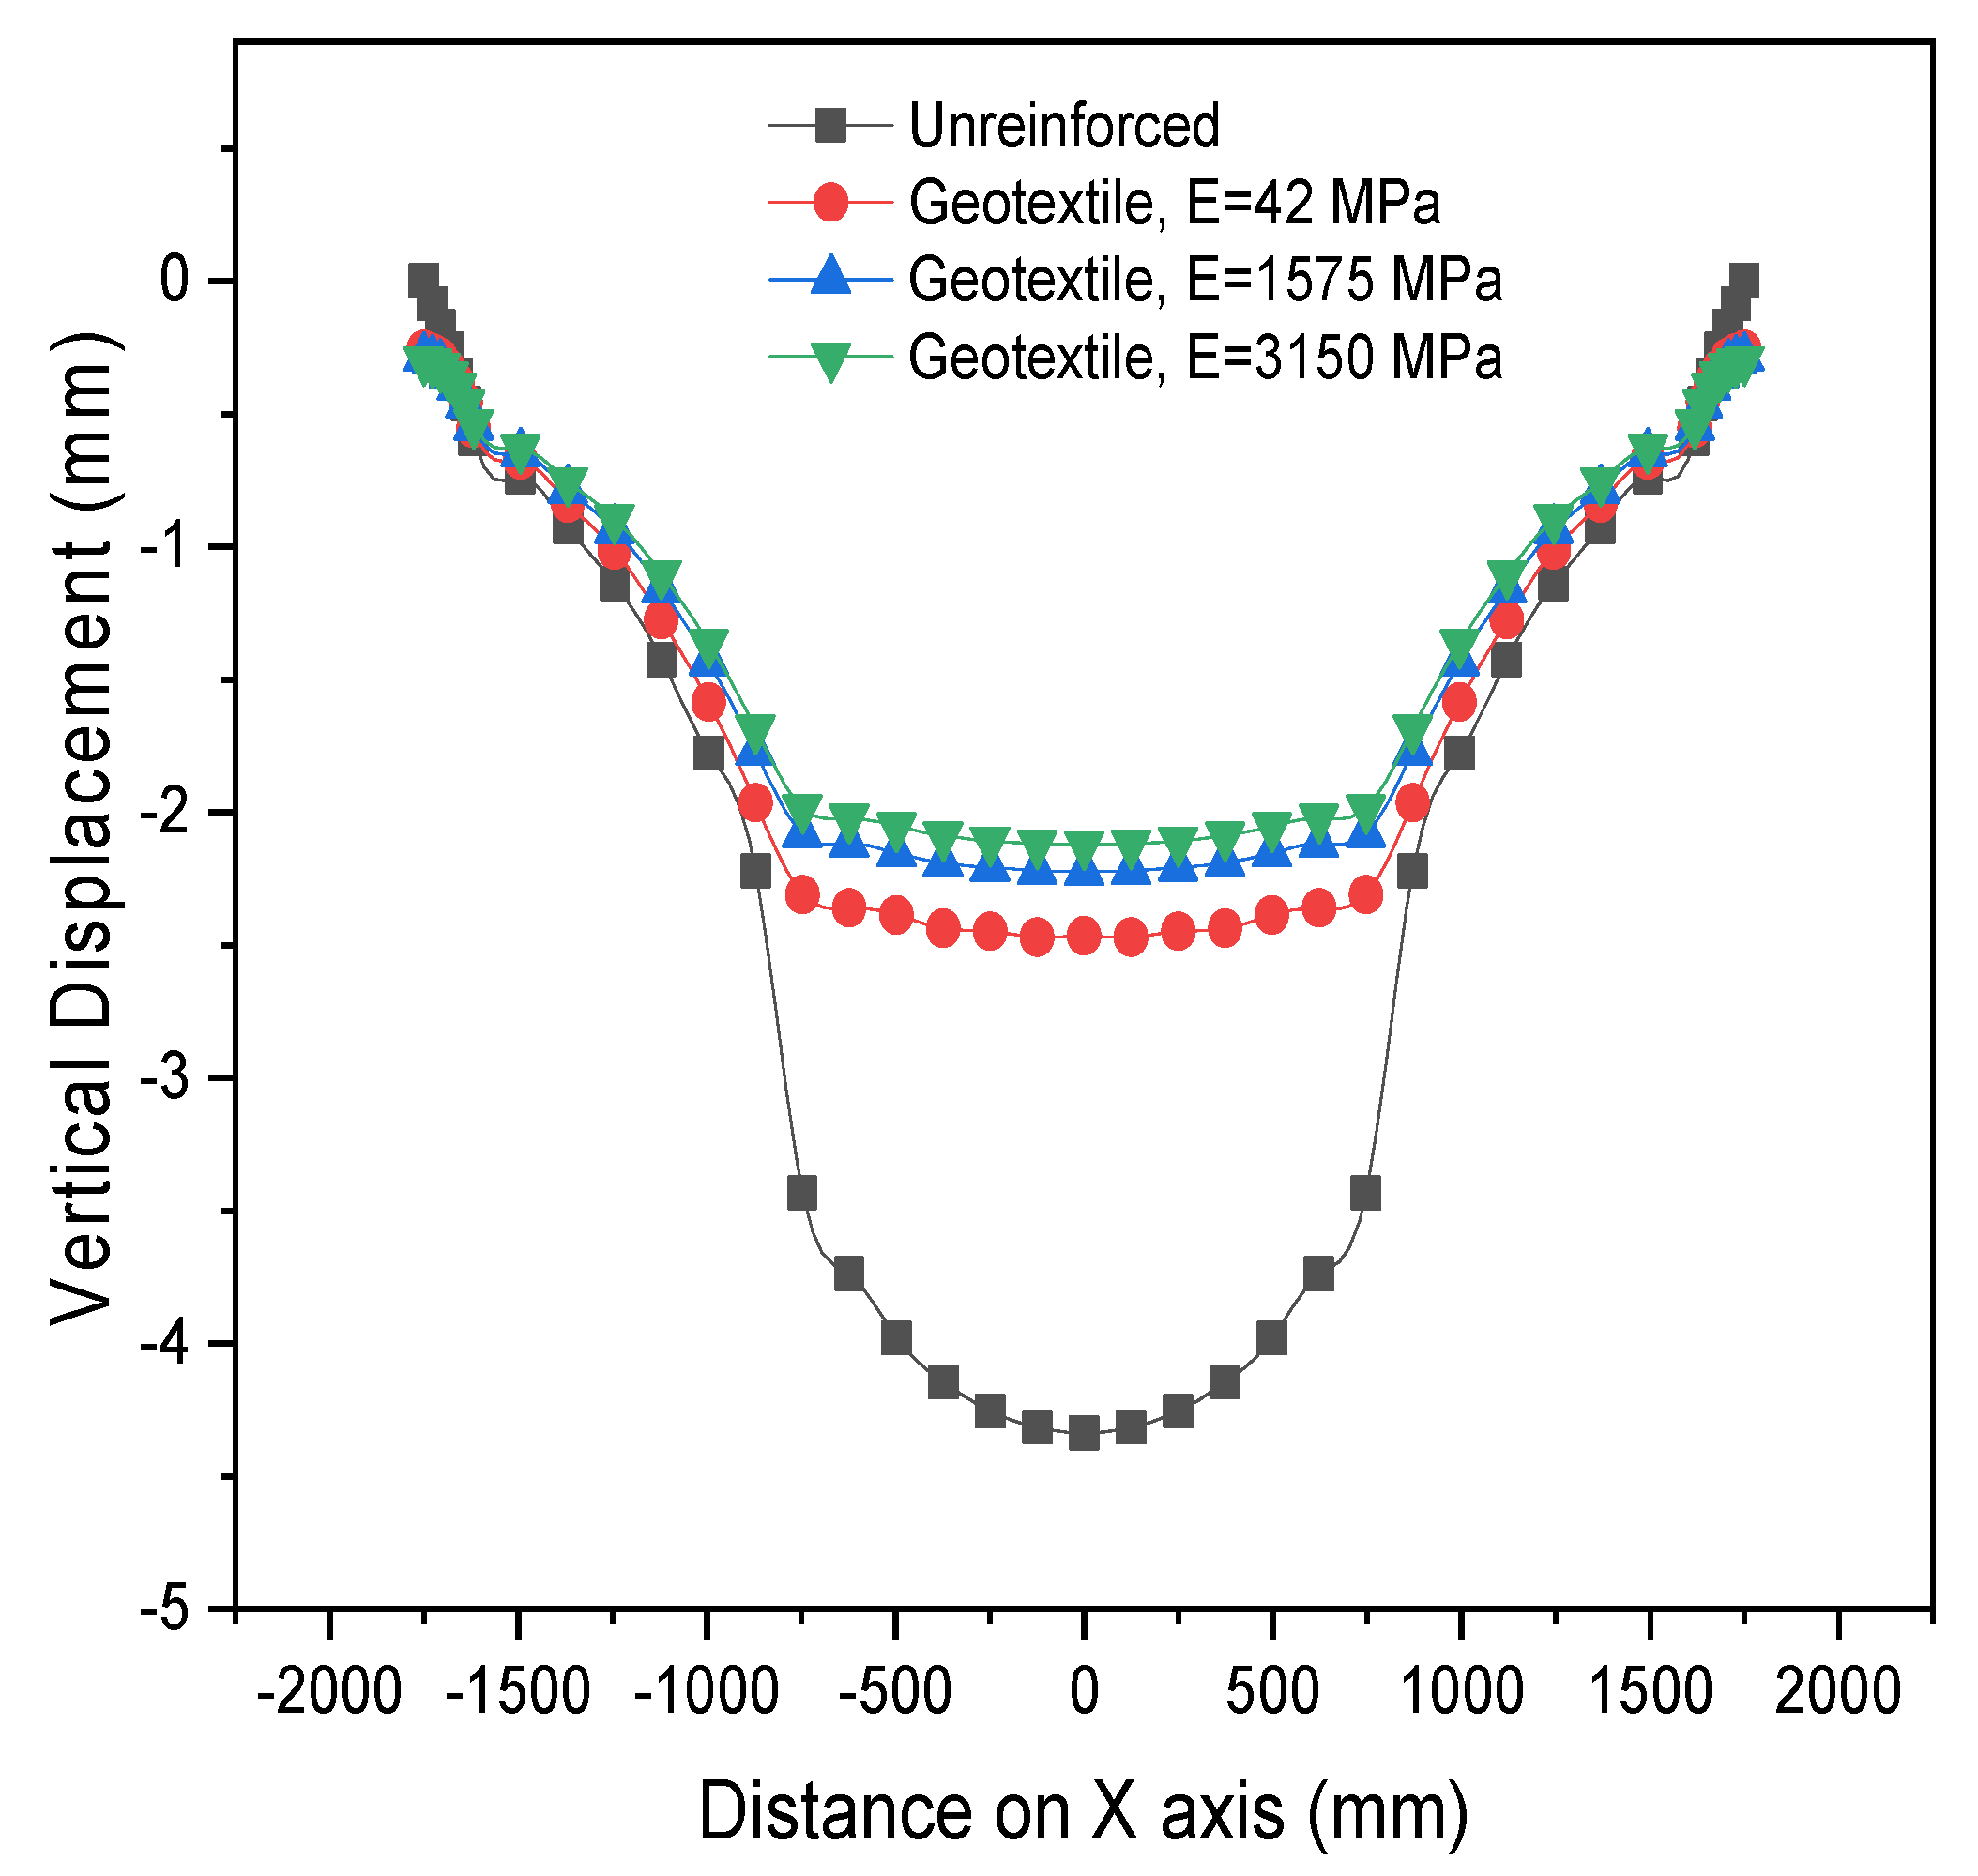
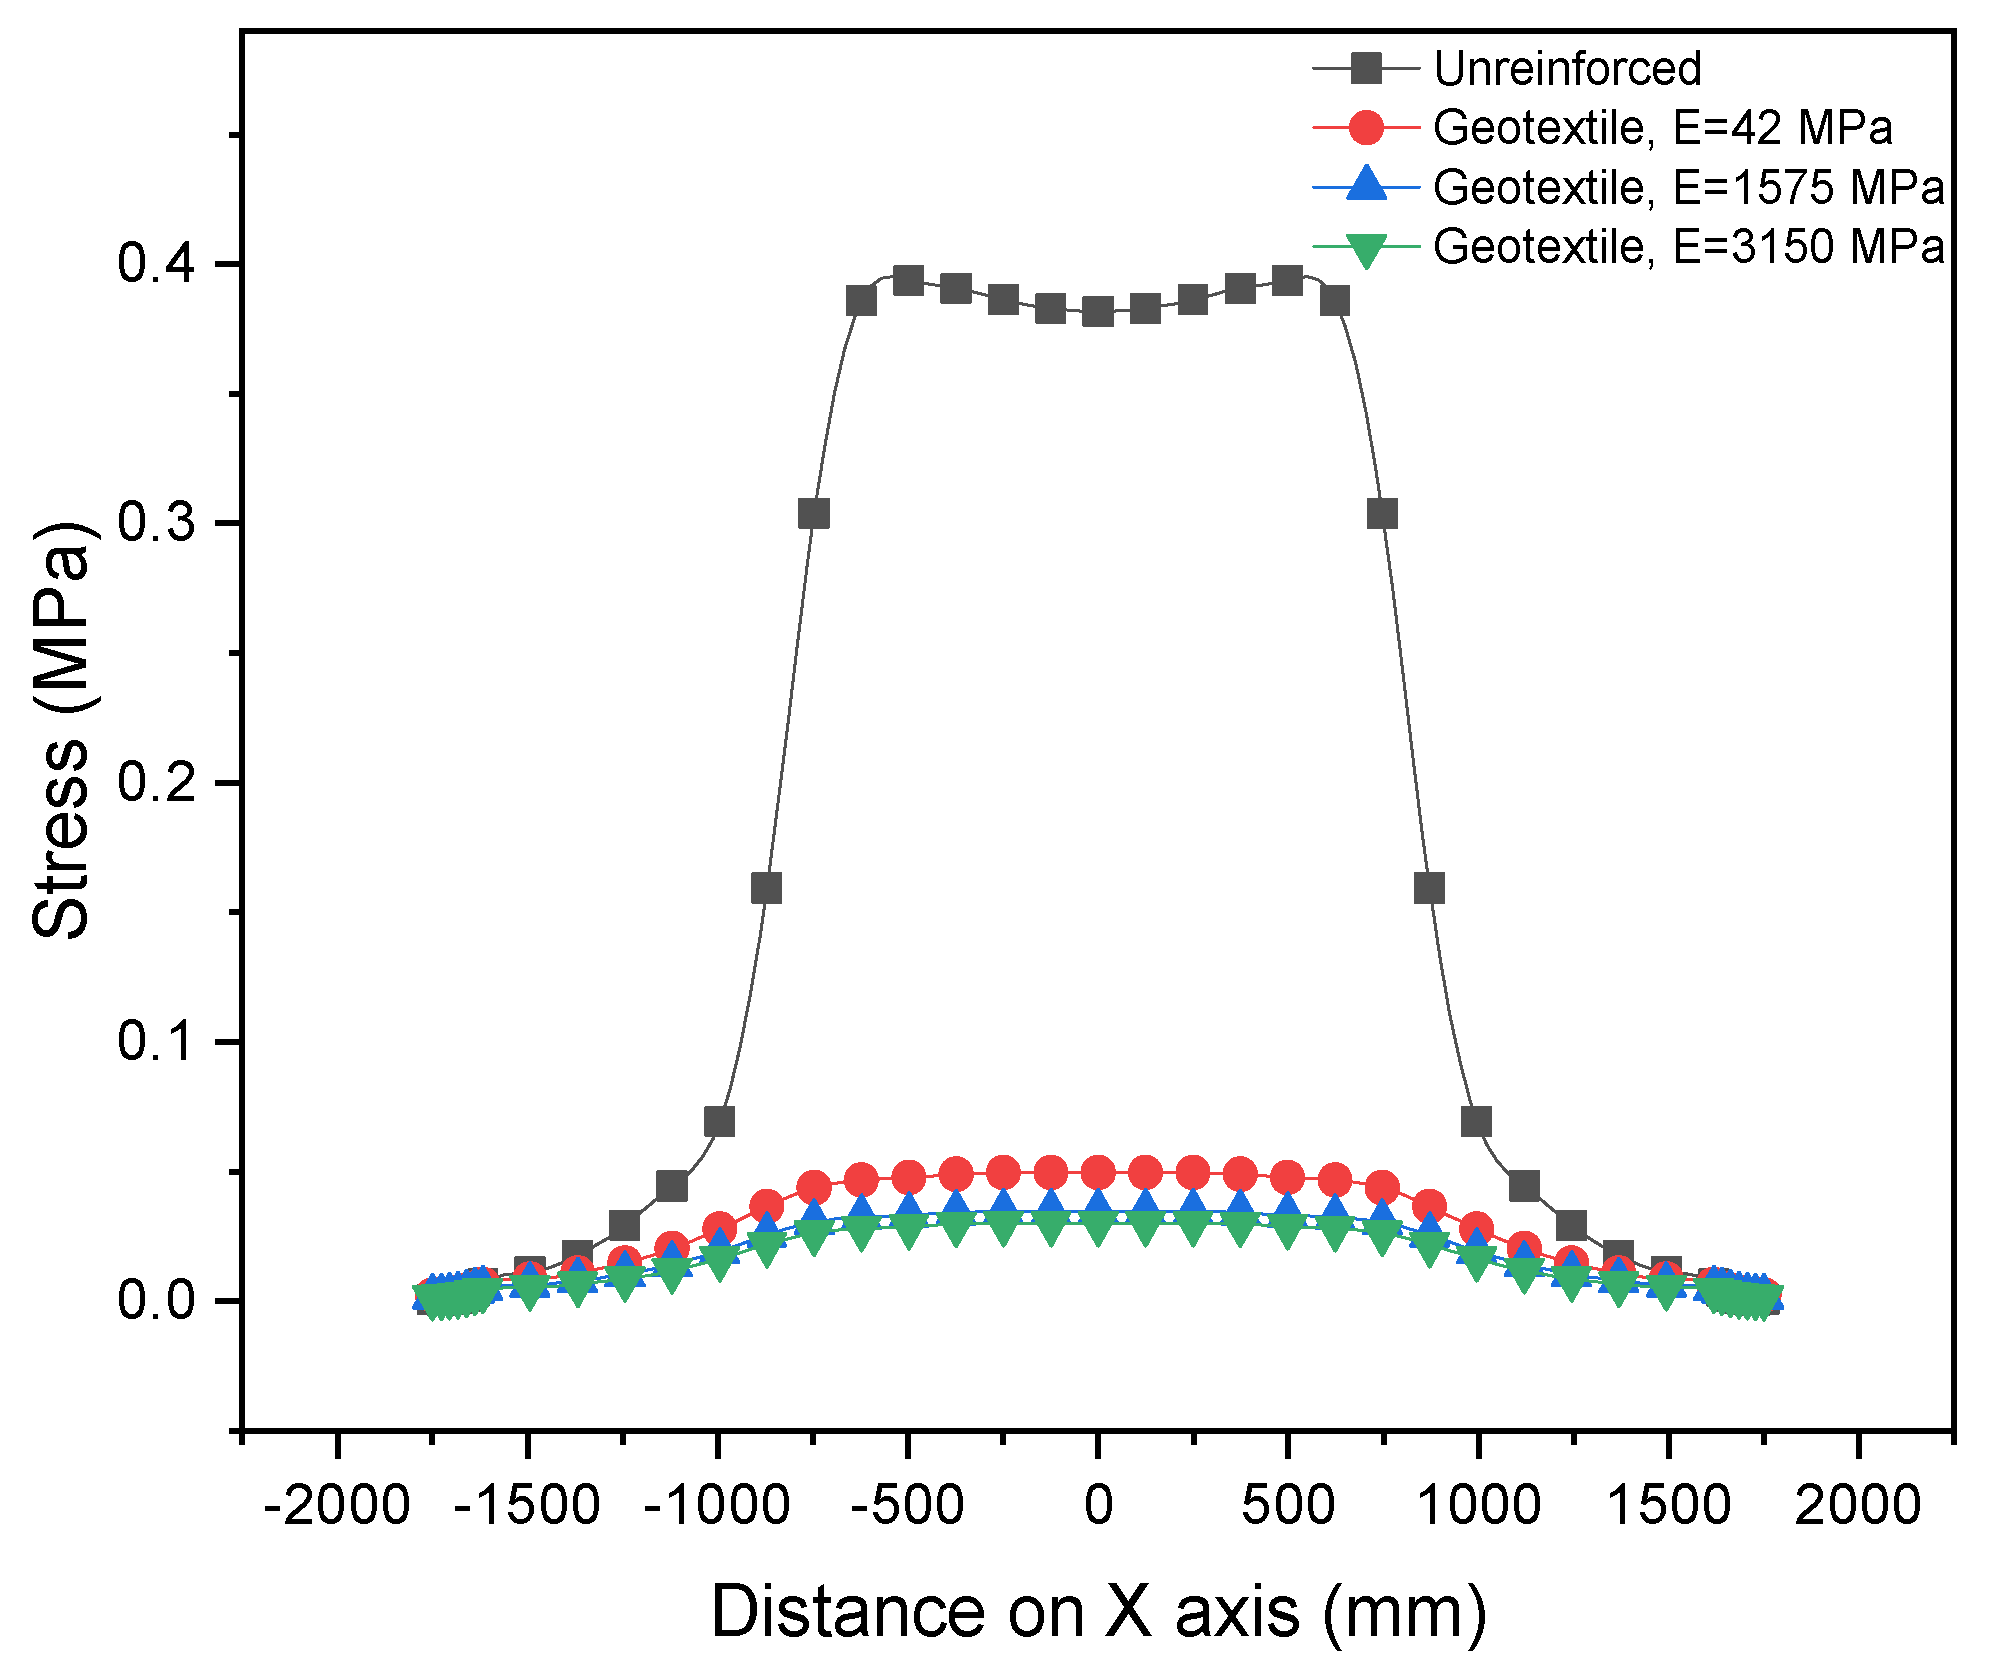
3.1. Pavement Response

The following cases were considered for the paved road: (1) unreinforced section, (2) reinforced at the base–subgrade interface, (3) reinforced at AC–base interface, and (4) reinforced at base–subgrade and AC–base interfaces. The results are presented in terms of permanent deformation and stress distribution in the pavement due to loading.
Figure 3 shows the permanent deformation on top of the AC for the different cases considered for the paved section. Overall, the reinforced sections experienced lower rut depths than the unreinforced section; this is more pronounced on top of the subgrade, as observed in Figure 4. It is also notable that placement location and the number of geosynthetic reinforcement layers significantly influence the effectiveness of geotextiles in the pavement. Considering a single reinforcement layer, the section reinforced at the base–subgrade interface had lower permanent deformation than the pavement section reinforced at the AC–base interface, which achieved a percentage decrease of 6.5% compared to the unreinforced section. Increasing the reinforcement layers to two, as with the pavement section reinforced at the base–subgrade and AC–base interfaces, resulted in lower vertical displacement than all the trial sections, with a reduction of 25.2% compared to the unreinforced section. In summary, the reduction in rutting depth on top of the AC was 14.41%, 6.57%, and 25.2% for pavement sections reinforced at the base–subgrade interface, AC–base interface, and the double-layer reinforcement, respectively.
Figure 4 presents vertical displacement curves from on top of the subgrade. It is observed that the benefits of geosynthetic inclusion in the flexible pavement system are more noticeable in the subgrade. The section reinforced at the base–subgrade interface achieved a decrease in vertical deformation of 51%, while that reinforced at the AC–base interface had a reduction of 41.2% compared to the unreinforced section. The double-layer reinforcement contributed to a 54.4% reduction in vertical deflection compared to the unreinforced section. The margin in reduction of permanent deformation on top of the subgrade, for the double-layer reinforcement and that of reinforcement at the base–subgrade interface, is relatively small.
Figure 5 shows stress distribution on the subgrade layer for the different cases of the paved section. Notably, stresses developed on the subgrade of the unreinforced section are higher than those in the reinforced sections. The placement of a single reinforcement layer at the base–subgrade interface resulted in a 92.1% reduction in stresses transferred down to the subgrade. The section with a geotextile placed between the asphalt concrete and the base decreased by 87.3% in terms of the amount of stresses transmitted to the subgrade compared to the unreinforced section. Double-layer reinforcement, i.e., at the base–subgrade and AC–base interfaces, had the lowest stresses induced on the subgrade, with a reduction of 92.7%. However, the margin was relatively small compared to single-layer reinforcement at the base–subgrade interface. A resulting implication is that increasing reinforcement layers in paved sections overlying soft subgrade may not necessarily increase its effectiveness by a higher margin in terms of absorbing stresses from traffic loading. The vertical displacement and stress distribution in the geotextile’s plane are shown in Figure 6.

3.2. Effect of the Geotextile’s Elastic Modulus on Pavement Response

In this parametric study, three types of geosynthetics with variable elastic modulus values (as outlined in Table 3, i.e., soft, medium, and stiff) are evaluated, and their effect on pavement behavior is discussed. This parametric analysis was conducted on a paved section with geotextile reinforcement maintained at the same position, i.e., the base–subgrade interface. Figure 7 shows the effect of elastic modulus on vertical displacement on the subgrade. The reduction in vertical deformation was 43.1%, 48.7%, and 51.1% for geotextiles with an elastic modulus of 42 MPa, 1575 MPa, and 3150 MPa, respectively. Figure 8 presents the impact of the geotextile’s elastic modulus on stresses transferred to the subgrade. A reduction in stresses of 86.9%, 90.9%, and 92.1% was observed for the elastic modulus values of 42 MPa, 1575 MPa, and 3150 MPa, respectively.
All the reinforced sections with varying elastic modulus values experienced less stress transferred to the subgrade and, consequently, less deformation than the unreinforced section. Notably, stiff geotextiles yield more reinforcement benefits. This observation agrees with that of Baadiga et al. [34], although the reinforcement material was a geogrid.

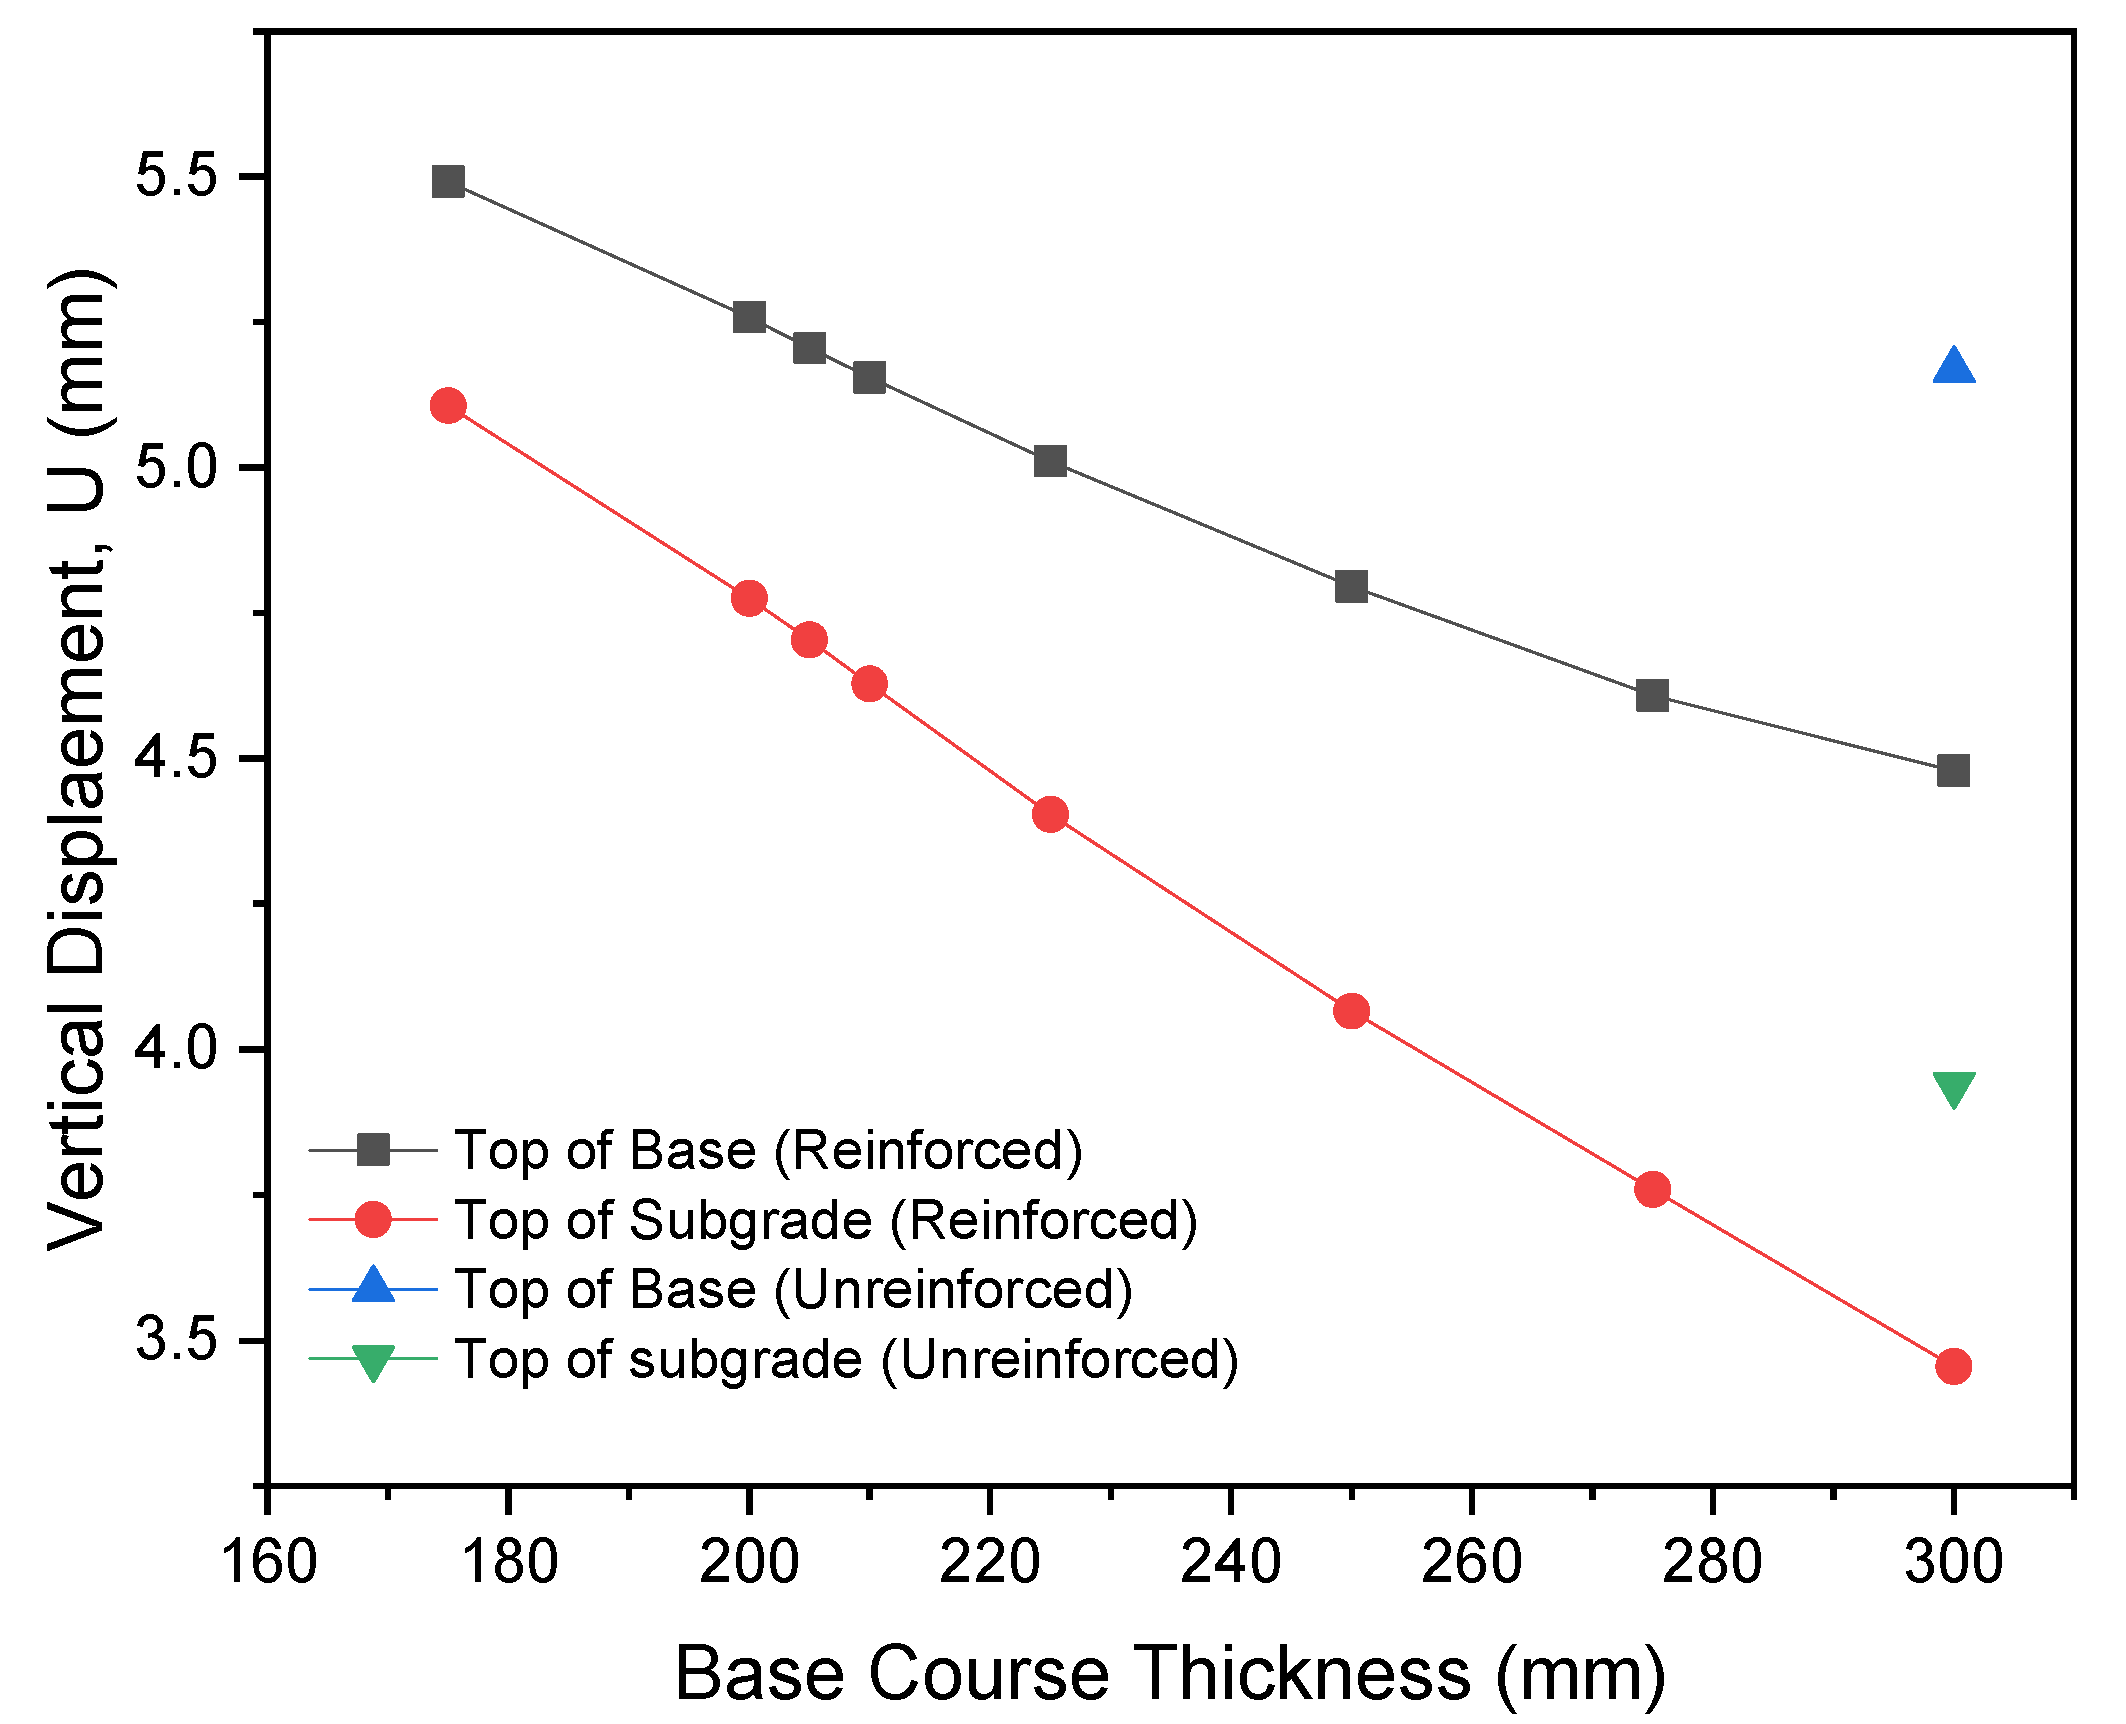
3.3. Effect of Reinforcement on Base Course Thickness

Trials were conducted using the unpaved model reinforced at the base–subgrade interface to determine the potential and extent of base course thickness reduction due to geotextile reinforcement. The magnitude of vertical deformation at the top of the subgrade and base was analyzed. Similarly, stress distribution on the subgrade was analyzed.
Base Course Reduction factor (BCR) was used to quantify the reduction in base layer thickness resulting from reinforcement. It describes the extent of reductions in aggregate base thickness allowed for equivalent service life. BCR is defined as the percentage decrease in base layer thickness due to the inclusion of geosynthetic reinforcement material in the unreinforced section under the same material composition and loading conditions. It is expressed as shown in Equation (2).
B C R = B u B r B u × 100
where:
Bu is the thickness of the base layer of unreinforced pavement.
Br is the thickness of the base layer of reinforced pavement.
Figure 9 presents the variation in the magnitude of vertical displacement in relation to base course thickness for the unpaved section. The unreinforced section with a base thickness of 300 mm was taken as the control section. Six numerical simulations were performed, with the base thickness of the reinforced section being varied. The overall vertical displacements for the base and subgrade and the stresses on the subgrade were analyzed.
As observed in Figure 9, the vertical displacements of the reinforced sections at the top of the base with thicknesses of 300 mm, 275 mm, 250 mm, 125 mm, and 210 mm were lower than the control section. However, the reinforced sections with 205 mm, 200 mm, and 175 mm base thickness had higher vertical displacement than the control section. Based on rut depth, this observation implies that it is possible to reduce base course thickness via geotextile reinforcement. From the study, the reduction in base thickness represents a BCR of 30%. The significant decrease in base thickness while maintaining the sound structural integrity of the pavement points out the potential saving of base course material. This is important since the quality material for pavement construction is limited and has posed challenges in road construction.
The study findings on the reduction in permanent deformation are generally in agreement with the previous numerical evaluation conducted by [35]. It is worth noting that there are variations which can be attributed to the difference in reinforcement configuration and the type of loading applied. In the numerical study carried out by [1], the findings suggest that placement of reinforcement at the base–subgrade interface yields more reinforcement benefits, which is in line with our current study in terms of single-layer reinforcement. However, in this current study, a section with double-layer reinforcement was also simulated and placement of reinforcement at the base–subgrade and AC–base interfaces was more effective in reducing permanent deformation and stress absorbed by the subgrade.

4. Conclusions

A numerical study of geotextile reinforcement in unpaved low-volume flexible pavements under static loading was presented in this paper. Considering rutting as a major criterion, the study aimed to investigate improvement in the pavement due to geotextile reinforcement. The pavement sections were modeled and analyzed using Finite Element Analysis with the aid of ABAQUS software. The main conclusions drawn from the study are:
Reinforcement location has significant influence on the effectiveness of geotextile inclusion in pavement. For single-layer reinforcement, placement of geotextiles at the base–subgrade interface was more effective in reducing permanent deformation and stress distribution. When the number of reinforcement layers is increased to two, i.e., at both the base–subgrade interface and AC–base interface, stress induced on the subgrade reduces further.
There was a significant reduction in rutting of up to 25.2% for the unreinforced pavement system, which was attained with geotextile reinforcement at the base–subgrade and AC–base interfaces.
The deflection response behavior of the pavement system is affected by the elastic modulus of the geosynthetic material. Geotextiles with higher elastic modulus values yield better reinforcement benefits.
As a result of reinforcement, a base course thickness reduction of up to 30% was achieved without sacrificing the pavement’s structural integrity.
As an extension of FEA, more than two reinforcement layers and reassessed placement location for flexible pavements overlying low-strength subgrade can be considered. Additionally, the cost implication in the entire project cycle can be investigated. Finally, it is recommended that further investigation through use of pilot road sections and periodical performance assessment be carried out before the results become directly applicable to practitioners.

Author Contributions

Conceptualization, K.M.N.; Supervision, Z.Y.; Writing original draft, K.M.N., R.L.L. and C.K.K.; Writing review & editing, Z.Y. and C.K.K. All authors have read and agreed to the published version of the manuscript.

Funding

This study was supported by The National Key Research and Development of China (Grant No. 2016YFC0802203).

Institutional Review Board Statement

Not applicable.

Informed Consent Statement

Not applicable.

Data Availability Statement

The authors confirm that the data supporting the finding of this study are available within the article.

Conflicts of Interest

The authors declare that there is no conflict of interest regarding this submission.

References

  1. Leonardi, G.; Bosco, D.L.; Palamara, R.; Suraci, F. Finite element analysis of geogrid-stabilized unpaved roads. Sustainability 2020, 12, 1929. [Google Scholar] [CrossRef] [Green Version]
  2. Castella, J.C.; Phaipasith, S. Rural roads are paving the way for land-use intensification in the uplands of Laos. Land 2021, 10, 330. [Google Scholar] [CrossRef]
  3. Chandak, P.G.; Patil, R.P.; Tapase, A.; Attar, A.C.; Sayyed, S.S. Performance Evaluation of Low Volume Rural Roads-A State-of-the-Art Review; Springer International Publishing: Berlin/Heidelberg, Germany, 2018. [Google Scholar]
  4. Otto, A.; Rolt, J.; Mukura, K. The impact of drainage on the performance of low volume sealed roads. Sustainability 2020, 12, 6101. [Google Scholar] [CrossRef]
  5. Al-Qadi, I.L.; Dessouky, S.H.; Kwon, J.; Tutumluer, E. Geogrid-reinforced low-volume flexible pavements: Pavement response and geogrid optimal location. J. Transp. Eng. 2012, 138, 1083–1090. [Google Scholar] [CrossRef]
  6. Alimohammadi, H.; Schaefer, V.R.; Zheng, J.; Li, H. Performance evaluation of geosynthetic reinforced flexible pavement: A review of full-scale field studies. Int. J. Pavement Res. Technol. 2021, 14, 30–42. [Google Scholar] [CrossRef]
  7. Al-Barqawi, M.; Aqel, R.; Wayne, M.; Titi, H.; Elhajjar, R. Polymer geogrids: A review of material, design and structure relationships. Materials 2021, 14, 4745. [Google Scholar] [CrossRef]
  8. Rimoldi, P.; Shamrock, J.; Kawalec, J.; Touze, N. Sustainable use of geosynthetics in dykes. Sustainability 2021, 13, 4445. [Google Scholar] [CrossRef]
  9. Imjai, T.; Pilakoutas, K.; Guadagnini, M. Performance of geosynthetic-reinforced flexible pavements in full-scale field trials. Geotext. Geomembr. 2019, 47, 217–229. [Google Scholar] [CrossRef]
  10. Wu, H.; Yao, C.; Li, C.; Miao, M.; Zhong, Y.; Lu, Y.; Liu, T. Review of application and innovation of geotextiles in geotechnical engineering. Materials 2020, 13, 1774. [Google Scholar] [CrossRef] [Green Version]
  11. Zornberg, J.G. Advances in the Use of Geosynthetics in Pavement Projects. Geosintec Iber. 2011, 1, 13. [Google Scholar]
  12. Nejad, F.M.; Noory, A.; Toolabi, S.; Fallah, S. Effect of using geosynthetics on reflective crack prevention. Int. J. Pavement Eng. 2015, 16, 477–487. [Google Scholar] [CrossRef]
  13. Miszkowska, A.; Lenart, S.; Koda, E. Changes of permeability of nonwoven geotextiles due to clogging and cyclic water flow in laboratory conditions. Water 2017, 9, 660. [Google Scholar] [CrossRef]
  14. Suraci, F.; Buonsanti, M.; Leonardi, G.; Palamara, R. A FEM simulation of the mechanical interaction between asphalt mixture and geogrid at micro-scale. Key Eng. Mater. 2018, 774, 595–600. [Google Scholar] [CrossRef]
  15. Mounes, S.M.; Karim, M.R.; Khodaii, A.; Almasi, M.H. Improving rutting resistance of pavement structures using geosynthetics: An overview. Sci. World J. 2014, 2014, 764218. [Google Scholar] [CrossRef] [Green Version]
  16. Ali, A.M. Evaluation of Flexible Pavement Reinforced with Geosynthetics using Static and Dynamic Loading Tests. Int. J. Eng. Res. 2018, 7, 222–226. [Google Scholar] [CrossRef]
  17. Shukla, S.K. Fundamentals of Geosynthetics; Institution of Civil Engineers Publishing: Perth, Australia, 2012. [Google Scholar]
  18. Aguiar-Moya, J.P.; Vargas-Nordcbeck, A.; Leiva-Villacorta, F.; Loría-Salazar, L.G. The Roles of Accelerated Pavement Testing in Pavement Sustainability: Engineering, Environment, and Economics; Springer: Berlin/Heidelberg, Germany, 2016; pp. 1–905. [Google Scholar] [CrossRef]
  19. Siriwardane, H.; Gondle, R.; Kutuk, B. Analysis of flexible pavements reinforced with geogrids. Geotech. Geol. Eng. 2010, 28, 287–297. [Google Scholar] [CrossRef]
  20. Neves, J.; Lima, H.; Gonçalves, M. A Numerical Study on the Implications of Subgrade Reinforcement with Geosynthetics in Pavement Design. Procedia Eng. 2016, 143, 888–895. [Google Scholar] [CrossRef] [Green Version]
  21. Conrado-Palafox, A.L.; Equihua-Anguiano, L.N.; Hernández-Hernández, V.A. Numerical evaluation for roads considering the addition of geogrids in karst geohazards zones. Infrastructures 2021, 6, 120. [Google Scholar] [CrossRef]
  22. Taherkhani, H.; Jalali, M. Investigating the performance of geosynthetic-reinforced asphaltic pavement under various axle loads using finite-element method. Road Mater. Pavement Des. 2017, 18, 1200–1217. [Google Scholar] [CrossRef]
  23. Ibrahim, E.M.; El-Badawy, S.M.; Ibrahim, M.H.; Gabr, A.; Azam, A. Effect of geogrid reinforcement on flexible pavements. Innov. Infrastruct. Solut. 2017, 2, 54. [Google Scholar] [CrossRef]
  24. Kim, M.; Lee, J.H. Effects of geogrid reinforcement in low volume flexible pavement. J. Civ. Eng. Manag. 2013, 19, S14–S22. [Google Scholar] [CrossRef] [Green Version]
  25. Calvarano, L.S.; Leonardi, G.; Palamara, R. Finite Element Modelling of Unpaved Road Reinforced with Geosynthetics. Procedia Eng. 2017, 189, 99–104. [Google Scholar] [CrossRef]
  26. Borden, R.H.; Mousavi, S.; Gabr, M. Optimum Location of the Geogrid Reinforcement in Unpaved Road. Can. Geotech. J. 2017, 54, 1047–1054. [Google Scholar]
  27. Leng, J.; Gabr, M.A. Numerical analysis of stress-deformation response in reinforced unpaved road sections. Geosynth. Int. 2005, 12, 111–119. [Google Scholar] [CrossRef]
  28. Pavement Design Guideline for Low Volume Sealed Roads; Republic of Kenya Ministry of Transport, Infrastructure, Housing and Urban Development: Nairobi, Kenya, 2017.
  29. Erickson, H.L.; Drescher, A. The Use of Geosynthetics to Reinforce Low Volume Roads; Final Report; Minnesota Department of Transportation: St. Paul, MN, USA, 2001; p. 125. [Google Scholar]
  30. ASTM D 4595-09; Standard Test Method for Tensile Properties of Geotextiles by the Wide-Width Strip Method. ASTM: West Conshohocken, PA, USA, 2009.
  31. Cook, R.D.; Malkus, D.S.; Plesha, M.E.; Witt, R. Concepts and Applications of Finite Element Analysis; John Wiley and Sons, Inc.: Indianapolis, IN, USA, 2003. [Google Scholar]
  32. Liu, P.; Xing, Q.; Dong, Y.; Wang, D.; Oeser, M.; Yuan, S. Application of Finite Layer Method in Pavement Structural Analysis. Appl. Sci. 2017, 7, 611. [Google Scholar] [CrossRef] [Green Version]
  33. Latha, G.M.; Somwanshi, A. Bearing capacity of square footings on geosynthetic reinforced sand. Geotext. Geomembr. 2009, 27, 281–294. [Google Scholar] [CrossRef]
  34. Baadiga, R.; Saride, S.; Balunaini, U.; Madhira, M.R. Influence of tensile strength of geogrid and subgrade modulus on layer coefficients of granular bases. Transp. Geotech. 2021, 29, 100557. [Google Scholar] [CrossRef]
  35. Leonardi, G.; Suraci, F. A 3D-FE model for the rutting prediction in geogrid reinforced flexible pavements. Sustainability 2022, 14, 3695. [Google Scholar] [CrossRef]
Figure 1. (a) Pavement model showing boundary conditions and loading area; (b) pavement model showing the mesh elements.
Applsci 12 10325 g001
Figure 2. Comparison of load–displacement for the experimental work and the numerical simulation results for (a) unreinforced sections and (b) reinforced sections.
Applsci 12 10325 g002
Figure 3. Comparison of vertical displacement on top of the AC.
Applsci 12 10325 g003
Figure 4. Comparison of vertical displacement on top of the subgrade.
Applsci 12 10325 g004
Figure 5. Comparison of stress distribution on top of the subgrade.
Applsci 12 10325 g005
Figure 6. Vertical displacement and stress distribution in the geotextile’s plane: (a) reinforced at the base–subgrade interface; (b) reinforced at the AC–base interface; and (c) reinforced at the base–subgrade and AC–base interfaces.
Applsci 12 10325 g006aApplsci 12 10325 g006b
Figure 7. Comparison of vertical displacement on top of the subgrade for geotextiles of varying elastic modulus.
Applsci 12 10325 g007
Figure 8. Comparison of stress distribution on top of the subgrade for geotextiles of varying elastic modulus.
Applsci 12 10325 g008
Figure 9. Magnitude of vertical displacement on top of the base and subgrade for different base course thicknesses.
Applsci 12 10325 g009
Table 1. Material properties for the base, subgrade [26,27], and AC [28].
Course/LayerModelPoisson Ratio, νElastic Modulus, E (MPa)Density, Υ (Kg/m3)Thickness (mm)
ACLinear Elastic Model0.352200224040
BaseMohr–Coulomb Model0.35501850300
SubgradeMohr–Coulomb Model0.351012822000
Table 2. Mohr–Coulomb Plasticity model parameters for the base and subgrade [27].
MaterialsMohr Coulomb Plasticity Model
PlasticityCohesion
Friction Angle (φ)Dilation Angle (ψ)Cohesion Yield Stress (MPa)
Base40100.15
Subgrade1000.0436
Table 3. Material properties for geotextiles.
Geotextile DescriptionStrength at 5% Strain (kN/m)E (MPa) Assuming t = 0.00254 mPoisson Ratio
Soft5.3420.3
Medium20015750.3
Stiff40031500.3
Publisher’s Note: MDPI stays neutral with regard to jurisdictional claims in published maps and institutional affiliations.

