Article

Influence of Construction of the following Tunnel on the Preceding Tunnel in the Reinforced Soil Layer

1
China Railway 15th Bureau Group Co., Ltd., Shanghai 200070, China
2
Zhuhai Da Heng Qin City New Center Development Co., Ltd., Zhuhai 519030, China
3
College of Civil and Transportation Engineering, Shenzhen University, Shenzhen 518060, China
4
Shenzhen Railway Investment and Construction Group Co., Ltd., Shenzhen 518000, China
5
Zhuhai Institute of Urban Planning & Design, Zhuhai 519000, China
6
Key Laboratory for Resilient Infrastructures of Coastal Cities (MOE), Shenzhen University, Shenzhen 518060, China
*
Author to whom correspondence should be addressed.
Appl. Sci. 2022, 12(20), 10335; https://doi.org/10.3390/app122010335
Submission received: 6 August 2022 / Revised: 30 September 2022 / Accepted: 9 October 2022 / Published: 13 October 2022
(This article belongs to the Section Civil Engineering)

Abstract

:
In coastal cities, some paralleled twin tunnels must be constructed in soft soil layers, and stratum reinforcement is necessary to enhance the stability of the tunnel. However, the influence of construction of the following tunnel on the preceding tunnel in reinforced strata is not clear. This study focuses on four kinds of reinforcement strategies: ring reinforcement of the right tunnel (RR), ring reinforcement of the left tunnel (LR), ring reinforcement of twin tunnels (TR), and cement wall reinforcement between left and right tunnels (CR). The interaction mechanism of the twin tunnels during construction, in terms of surface settlement, tunnel deformation, convergence deformation of the tunnel lining, and internal force of the tunnel lining, is revealed by a series of three-dimensional numerical analyses. It was found that the LR offers an appropriate strategy in terms of both engineering safety and cost savings, and it can significantly reduce the disturbance of the following tunnel excavation on the preceding tunnel.

1. Introduction

In recent years, there has been a significant increase in the demand for tunnels in urban areas, especially for public transport purposes. Paralleled twin tunnels that are closely spaced are often adopted to save underground resources [1]. Due to the restriction of construction conditions and the consideration of safety, the second tunnel is not built until the first tunnel is completed for a period of time [2,3]. Thus, predicting the influence of construction of the following tunnel on the preceding tunnel plays a key role in avoiding any damage to the preceding tunnel and excessive ground settlement during excavation of the following tunnel [4].
In the past, a variety of approaches have been used to study the interaction between paralleled twin tunnels, including physical model testing, field observations, analytical derivation, and finite element modeling. The physical model testing can reflect the spatial relationship of the adjacent tunnels realistically. There are mainly two types of model tests, i.e., 1-g model tests [5,6] and centrifugal tests [7,8,9]. Kim et al. [5] adopted 1-g scale-model experiments to analyze interaction between the following tunnel and the preceding tunnel, emphasizing the influence of the properties of soil and lining, the geometric dimensions of the tunnel, and the excavation method. The simulation of each excavation stage of the tunnel was adopted by Choi et al. [7] using centrifugal experiments. The influence of the size of the existing tunnel, the distance between tunnel centers, and the earth pressure coefficient, K, on the mechanical behavior of new tunnels were investigated and analyzed, and an appropriate distance between tunnel centers was obtained. Field observation is still the key approach to understand the interaction between adjacent tunneling, in which measurement data can be used to explore the influence of construction operation [10], inhomogeneous soil layer [7,11], and asymmetric parallel tunnels [12,13]. Unfortunately, however, monitoring points are only placed on specific sections, which often results in incomplete information. In addition, accuracy of the data is also affected by factors such as buried location of transducers and survival rate of transducers [14].
The analytical methods have definite practical significance for investigating the interaction mechanism of parallel tunnels, which are usually based on the theory of beam on elastic foundation. The approaches can be used to predict tunnel deformation from soil deformation [15,16] and predict tunnel deformation based on the additional load [17,18]. Finite element modeling seems to be a promising method for addressing this issue. It can simulate shield tunneling realistically, by considering the advancement of tunnel face, shield conicity, grout injection, concrete lining, and ground loss. Many in-depth studies have been carried out on the interaction of adjacent twin tunneling in unimproved soil by means of finite element modeling [19,20,21,22,23]. Chehade et al. [21] established a numerical model for twin tunnels and carried out the study on the influence of factors such as the relative position of tunnels and construction procedure on soil deformation and internal force. Do et al. [22] presented a refined three-dimensional numerical model, which took into consideration the effects of lining joint patterns, including segmental lining joints and their connections, to assess tunnel lining behavior and displacement fields around the tunnel. Zhao et al. [23] established a numerical model using COMSOL Multiphysics to study the influence of excavation of twin tunnels on ground settlement patterns in composite strata. The results indicate that the excavation face stability of parallel tunnels is inferior to that of a single tunnel and degrades as spacing between the two tunnels decreases [24].
In coastal cities, tunnels are often constructed in soft ground. Owing to the high compressibility, low shear strength, thixotropy, and other unfavorable properties of soft soil, it is a great challenge to excavate tunnels in soft ground without improvement. Collapse of the excavation face in the soft soil layer related to adjacent twin tunnels has been reported to occur during construction [24]. In such cases, cement treatment is often used to create stiffer zones and to enhance tunnel stability during construction [24,25,26]. However, the stability of the adjacent twin tunnels around improved soil has not been studied comprehensively, and the influence of the following tunnel on the preceding tunnel in the enhanced ground still remains unclear.
By virtue of the three-dimensional finite element analyses, this paper focuses on the effect of ground reinforcement strategies on the interaction between the paralleled twin tunnels. Firstly, based on the practical engineering, four reinforcement strategies, i.e., ring reinforcement of the right tunnel (RR), ring reinforcement of the left tunnel (LR), ring reinforcement of twin tunnels (TR), and cement wall reinforcement between left and right tunnels (CR), are put forward. Then, a three-dimensional model of paralleled twin tunnels is established by PLAXIS 3D, and the small strain-hardening (HSS) model is adopted as the constitutive model of the soil layer. After that, the interaction mechanism of the twin tunnels, in terms of ground surface settlement, tunnel deformation, convergence deformation of the tunnel lining, and internal force of the tunnel lining, is disclosed. Finally, the most appropriate reinforcement strategy is obtained based on the numerical results, which provides theoretical support for engineering design.

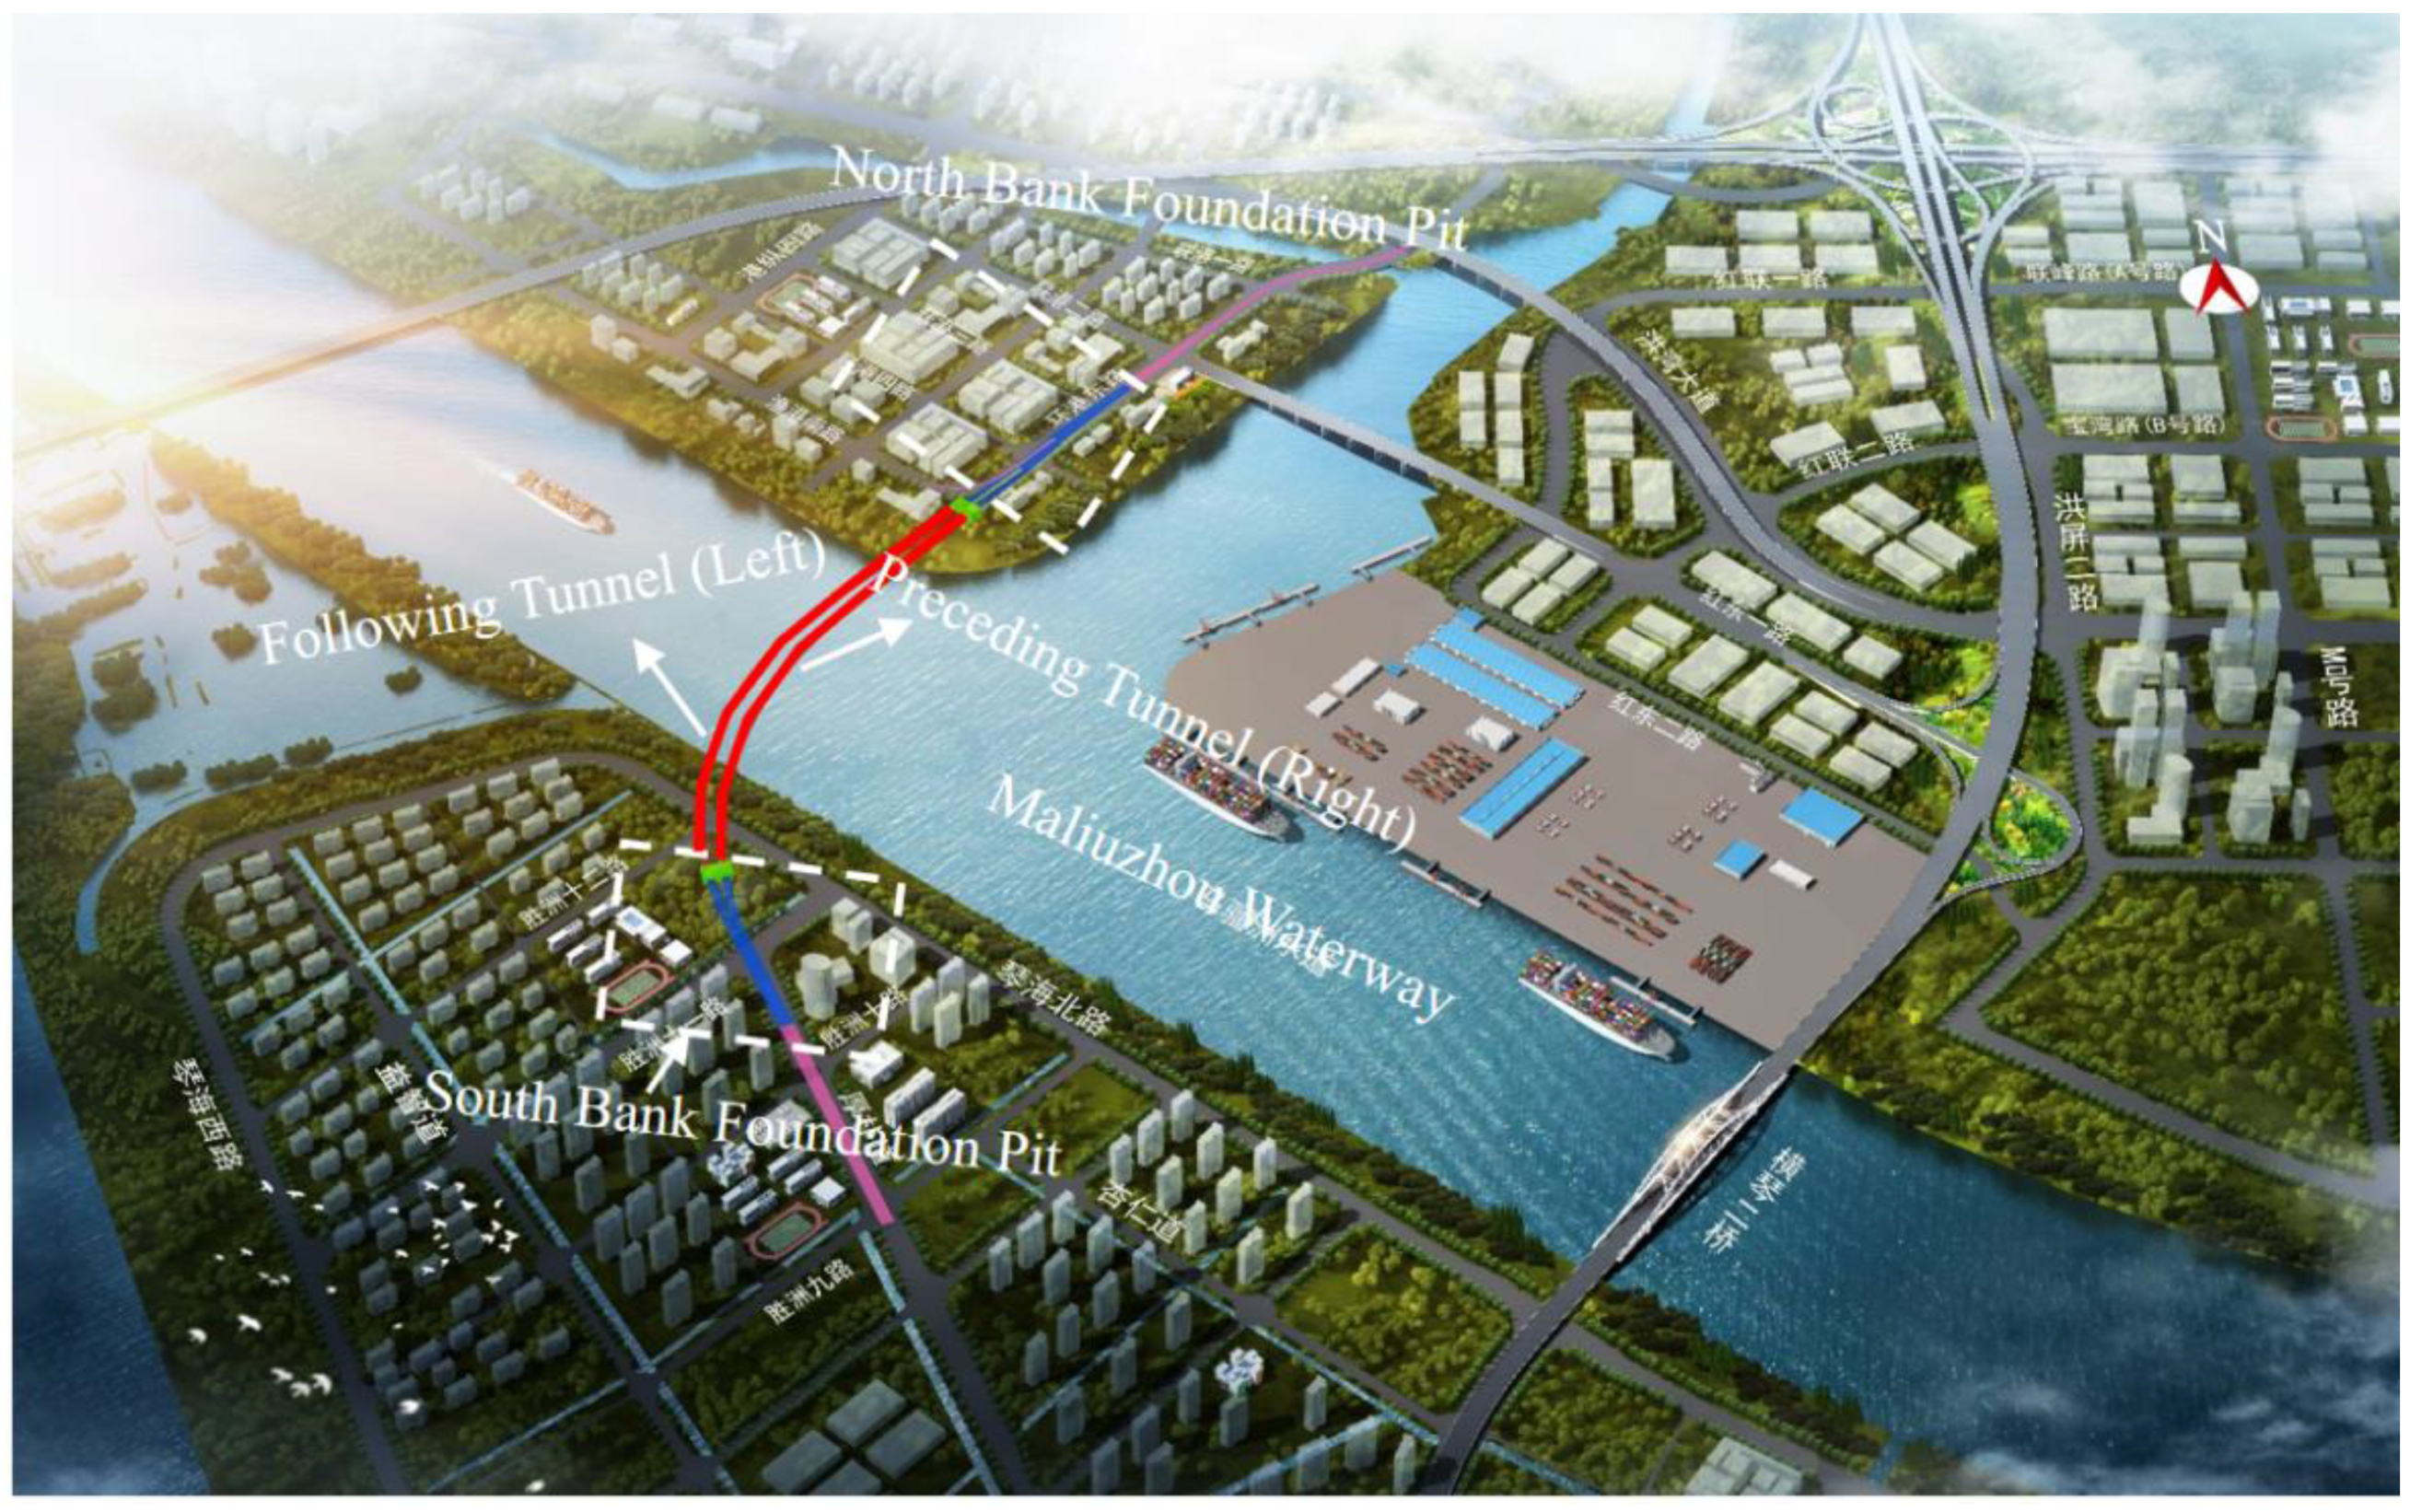
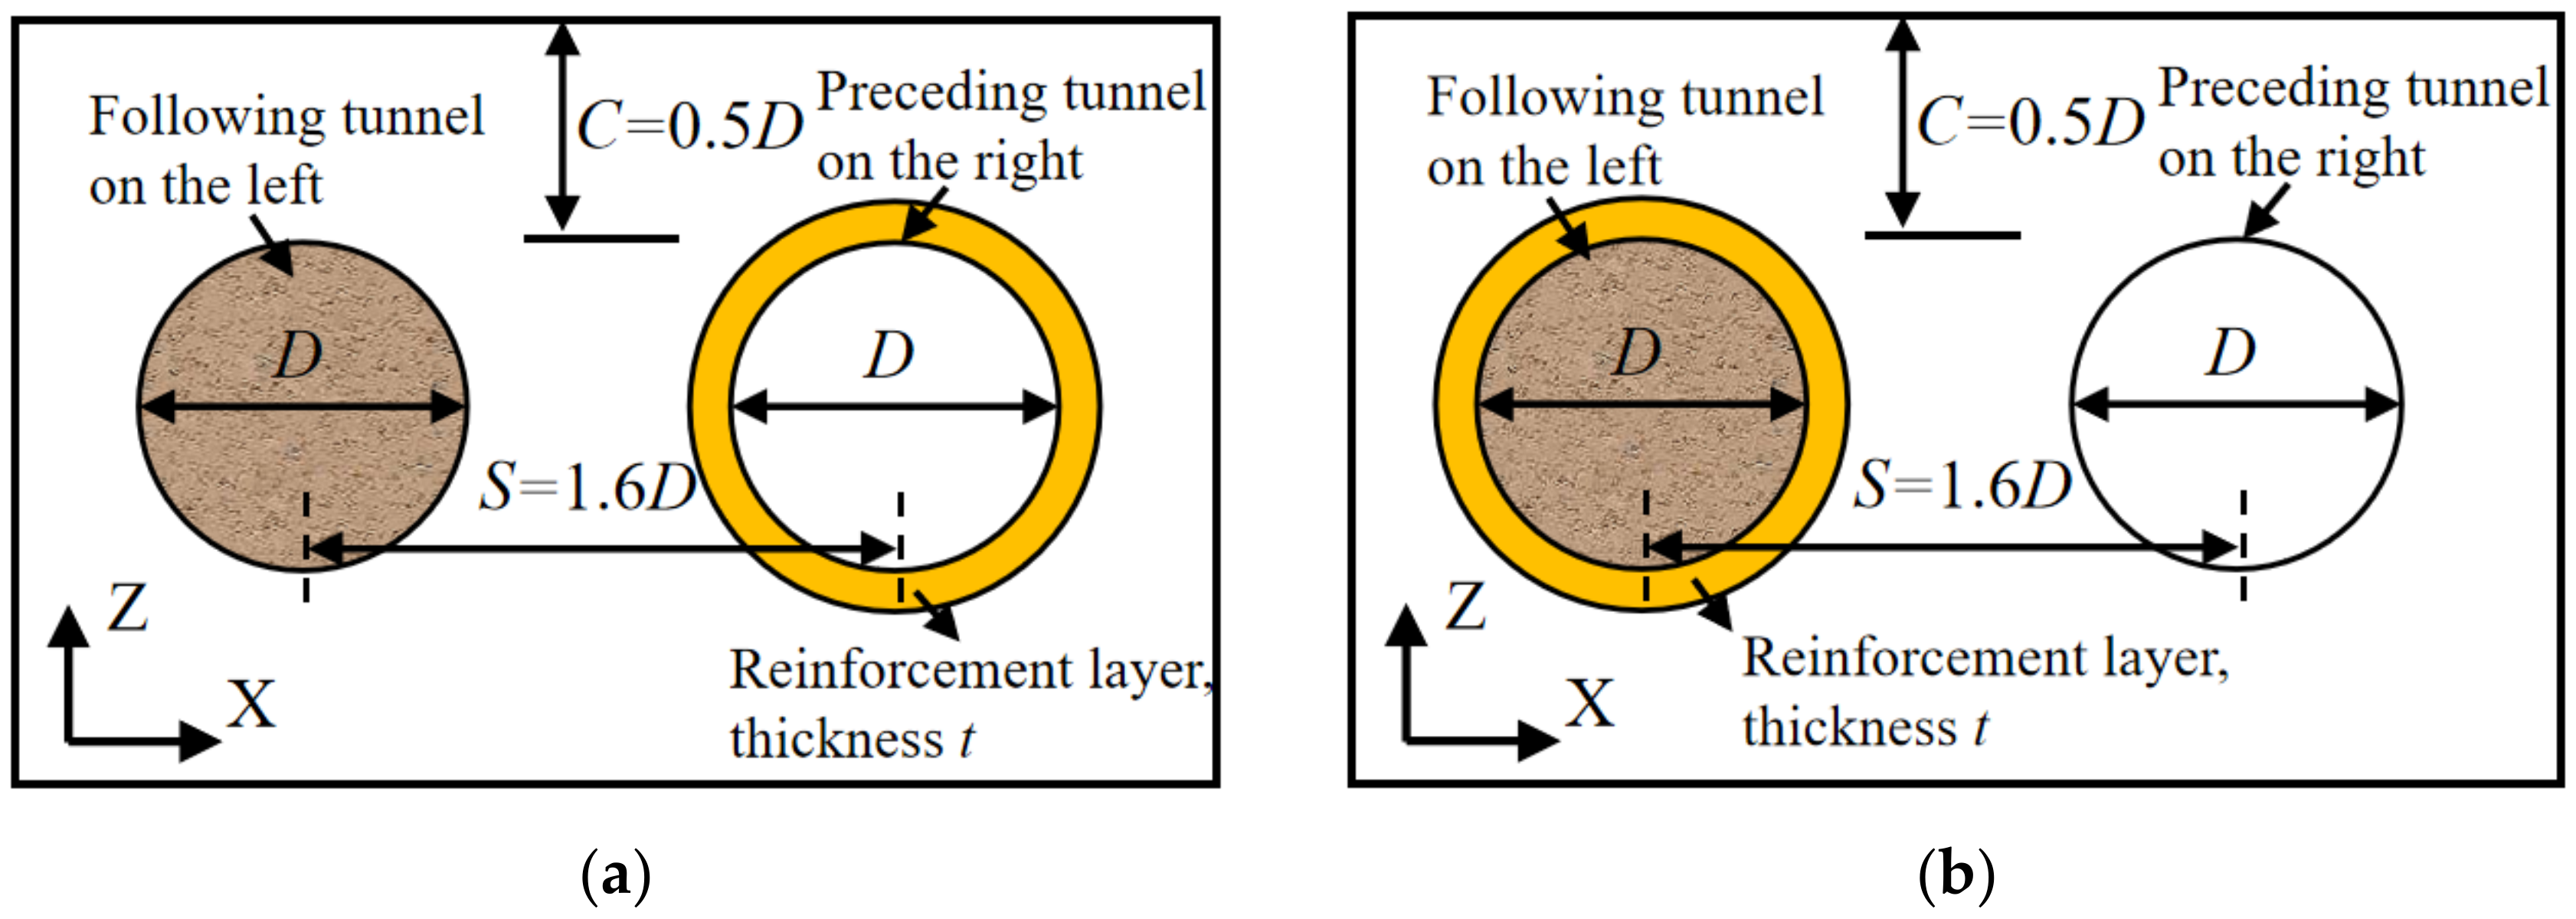
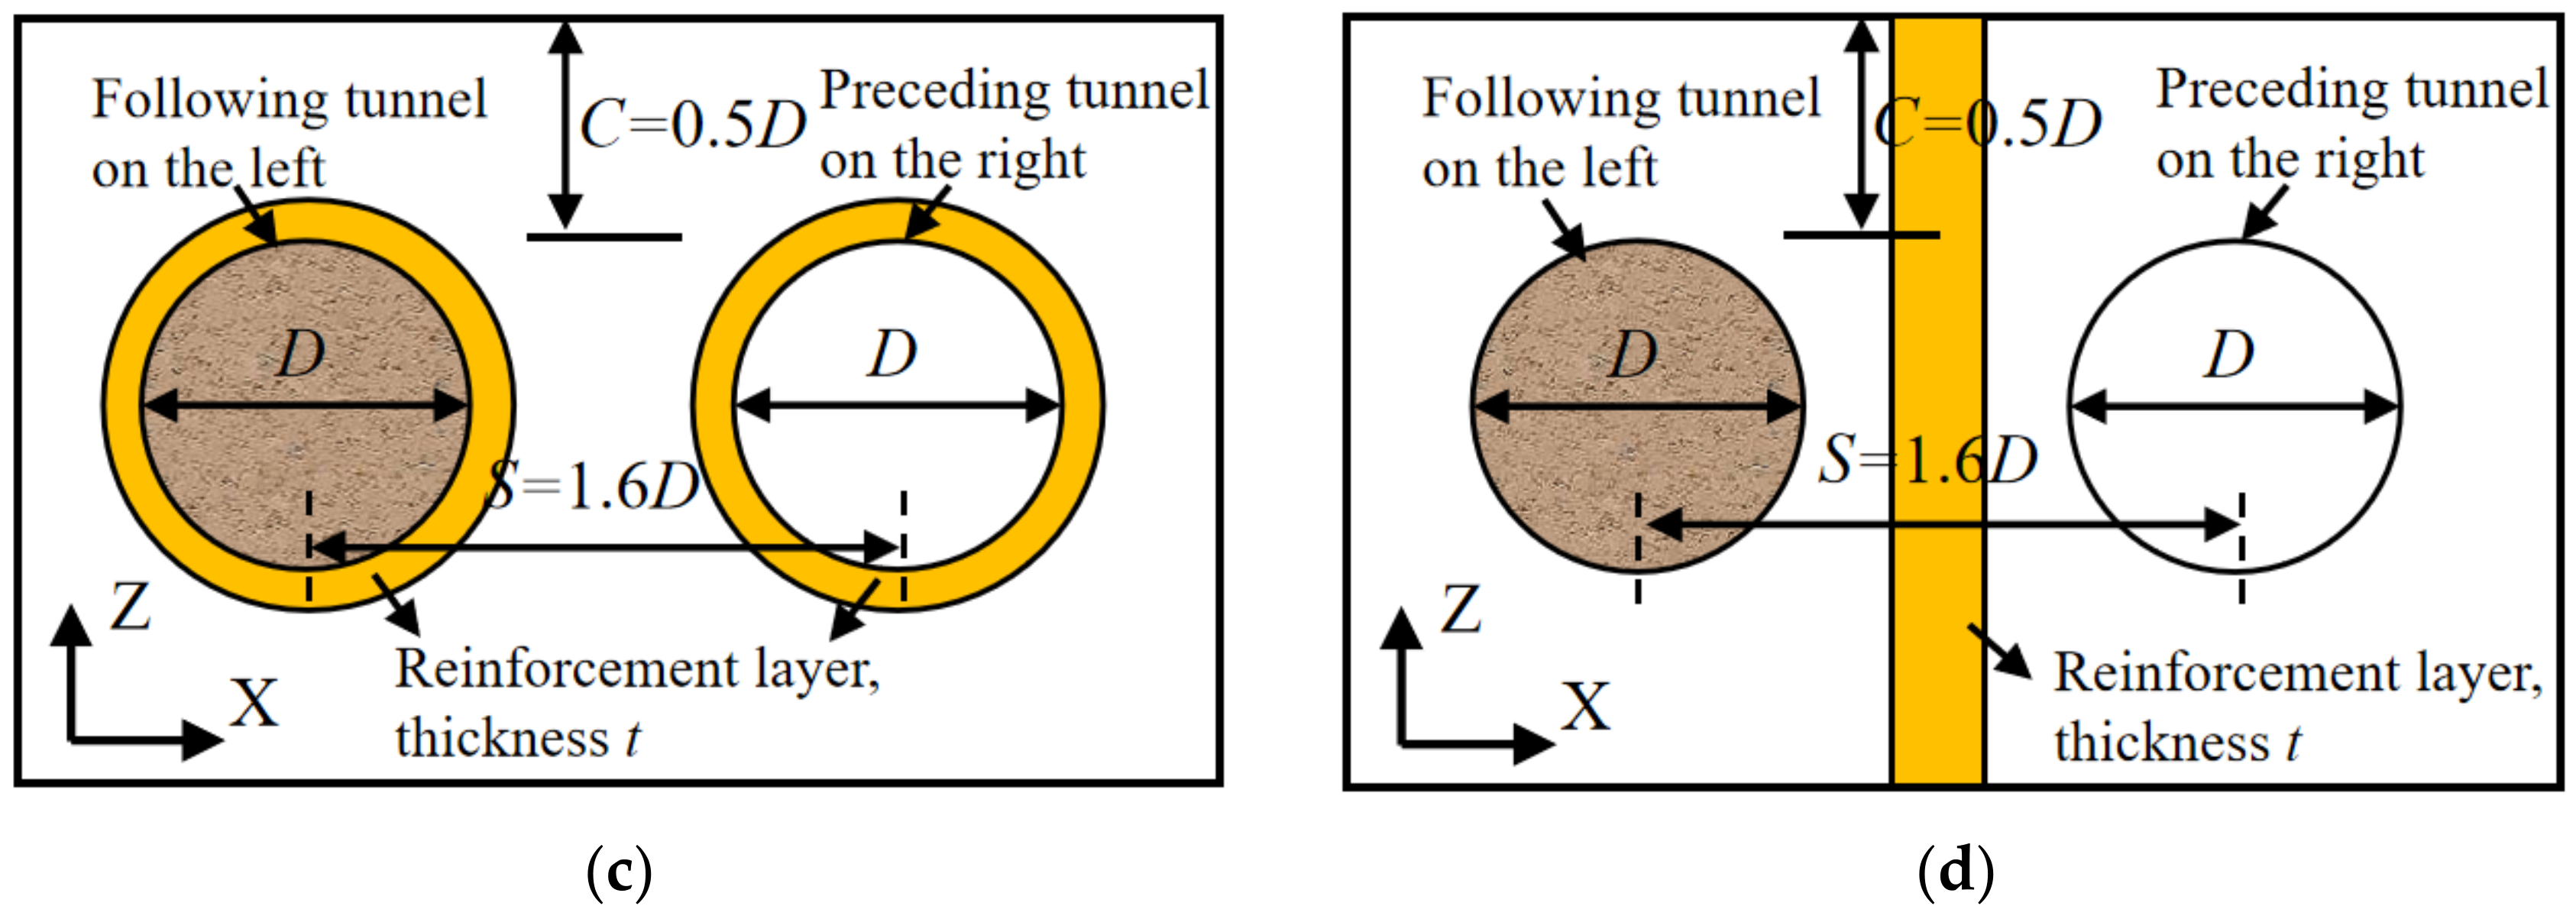
2. Engineering Background and Ground Reinforcement Strategies

In this investigation, the Mangzhou Tunnel Project in Zhuhai, Guangdong Province, China, was considered for the research background. As shown in Figure 1, the project consists of a pair of paralleled tunnels, with the preceding tunnel (on the right) of 1995 m and the following tunnel (on the left) of 2032 m. A slurry-balance shield with a diameter (D) of 15 m was used to excavate the twin tunnels. The minimum space between the centers of the twin tunnels is 1.6 D and the minimum burial depth is 0.5 D. The tunnels were located in the ground, which consisted mainly of soft clay, which has an effective friction angle of 13.3° and effective cohesion of 13.1 kPa.
Due to the disadvantages of the natural geological conditions, the reinforcement method was implemented in the actual construction process to ensure the stability of the excavation face for the twin tunnels. The influence mechanism of the left tunnel excavation (following excavation) on the right tunnel (preceding excavation) is taken as the main focus of this paper. In particular, the effect of reinforcement strategies will be emphasized and compared. As shown in Figure 2, four different reinforcement strategies were investigated: (a) ring reinforcement of right tunnel (denoted by RR) [26,27,28]; (b) ring reinforcement of left tunnel (denoted by LR); (c) ring reinforcement of twin tunnels (denoted by TR); (d) cement wall reinforcement between the left and the right tunnels (denoted by CR). The yellow zone in Figure 2 is the reinforcement layer and the symbol t represents the thickness of the reinforcement. Furthermore, to obtain the suitable thickness of reinforcement, six cases, i.e., t = 0 D, 0.05 D, 0.10 D, 0.15 D, 0.20 D, 0.30 D, were studied and compared for each reinforcement strategy.

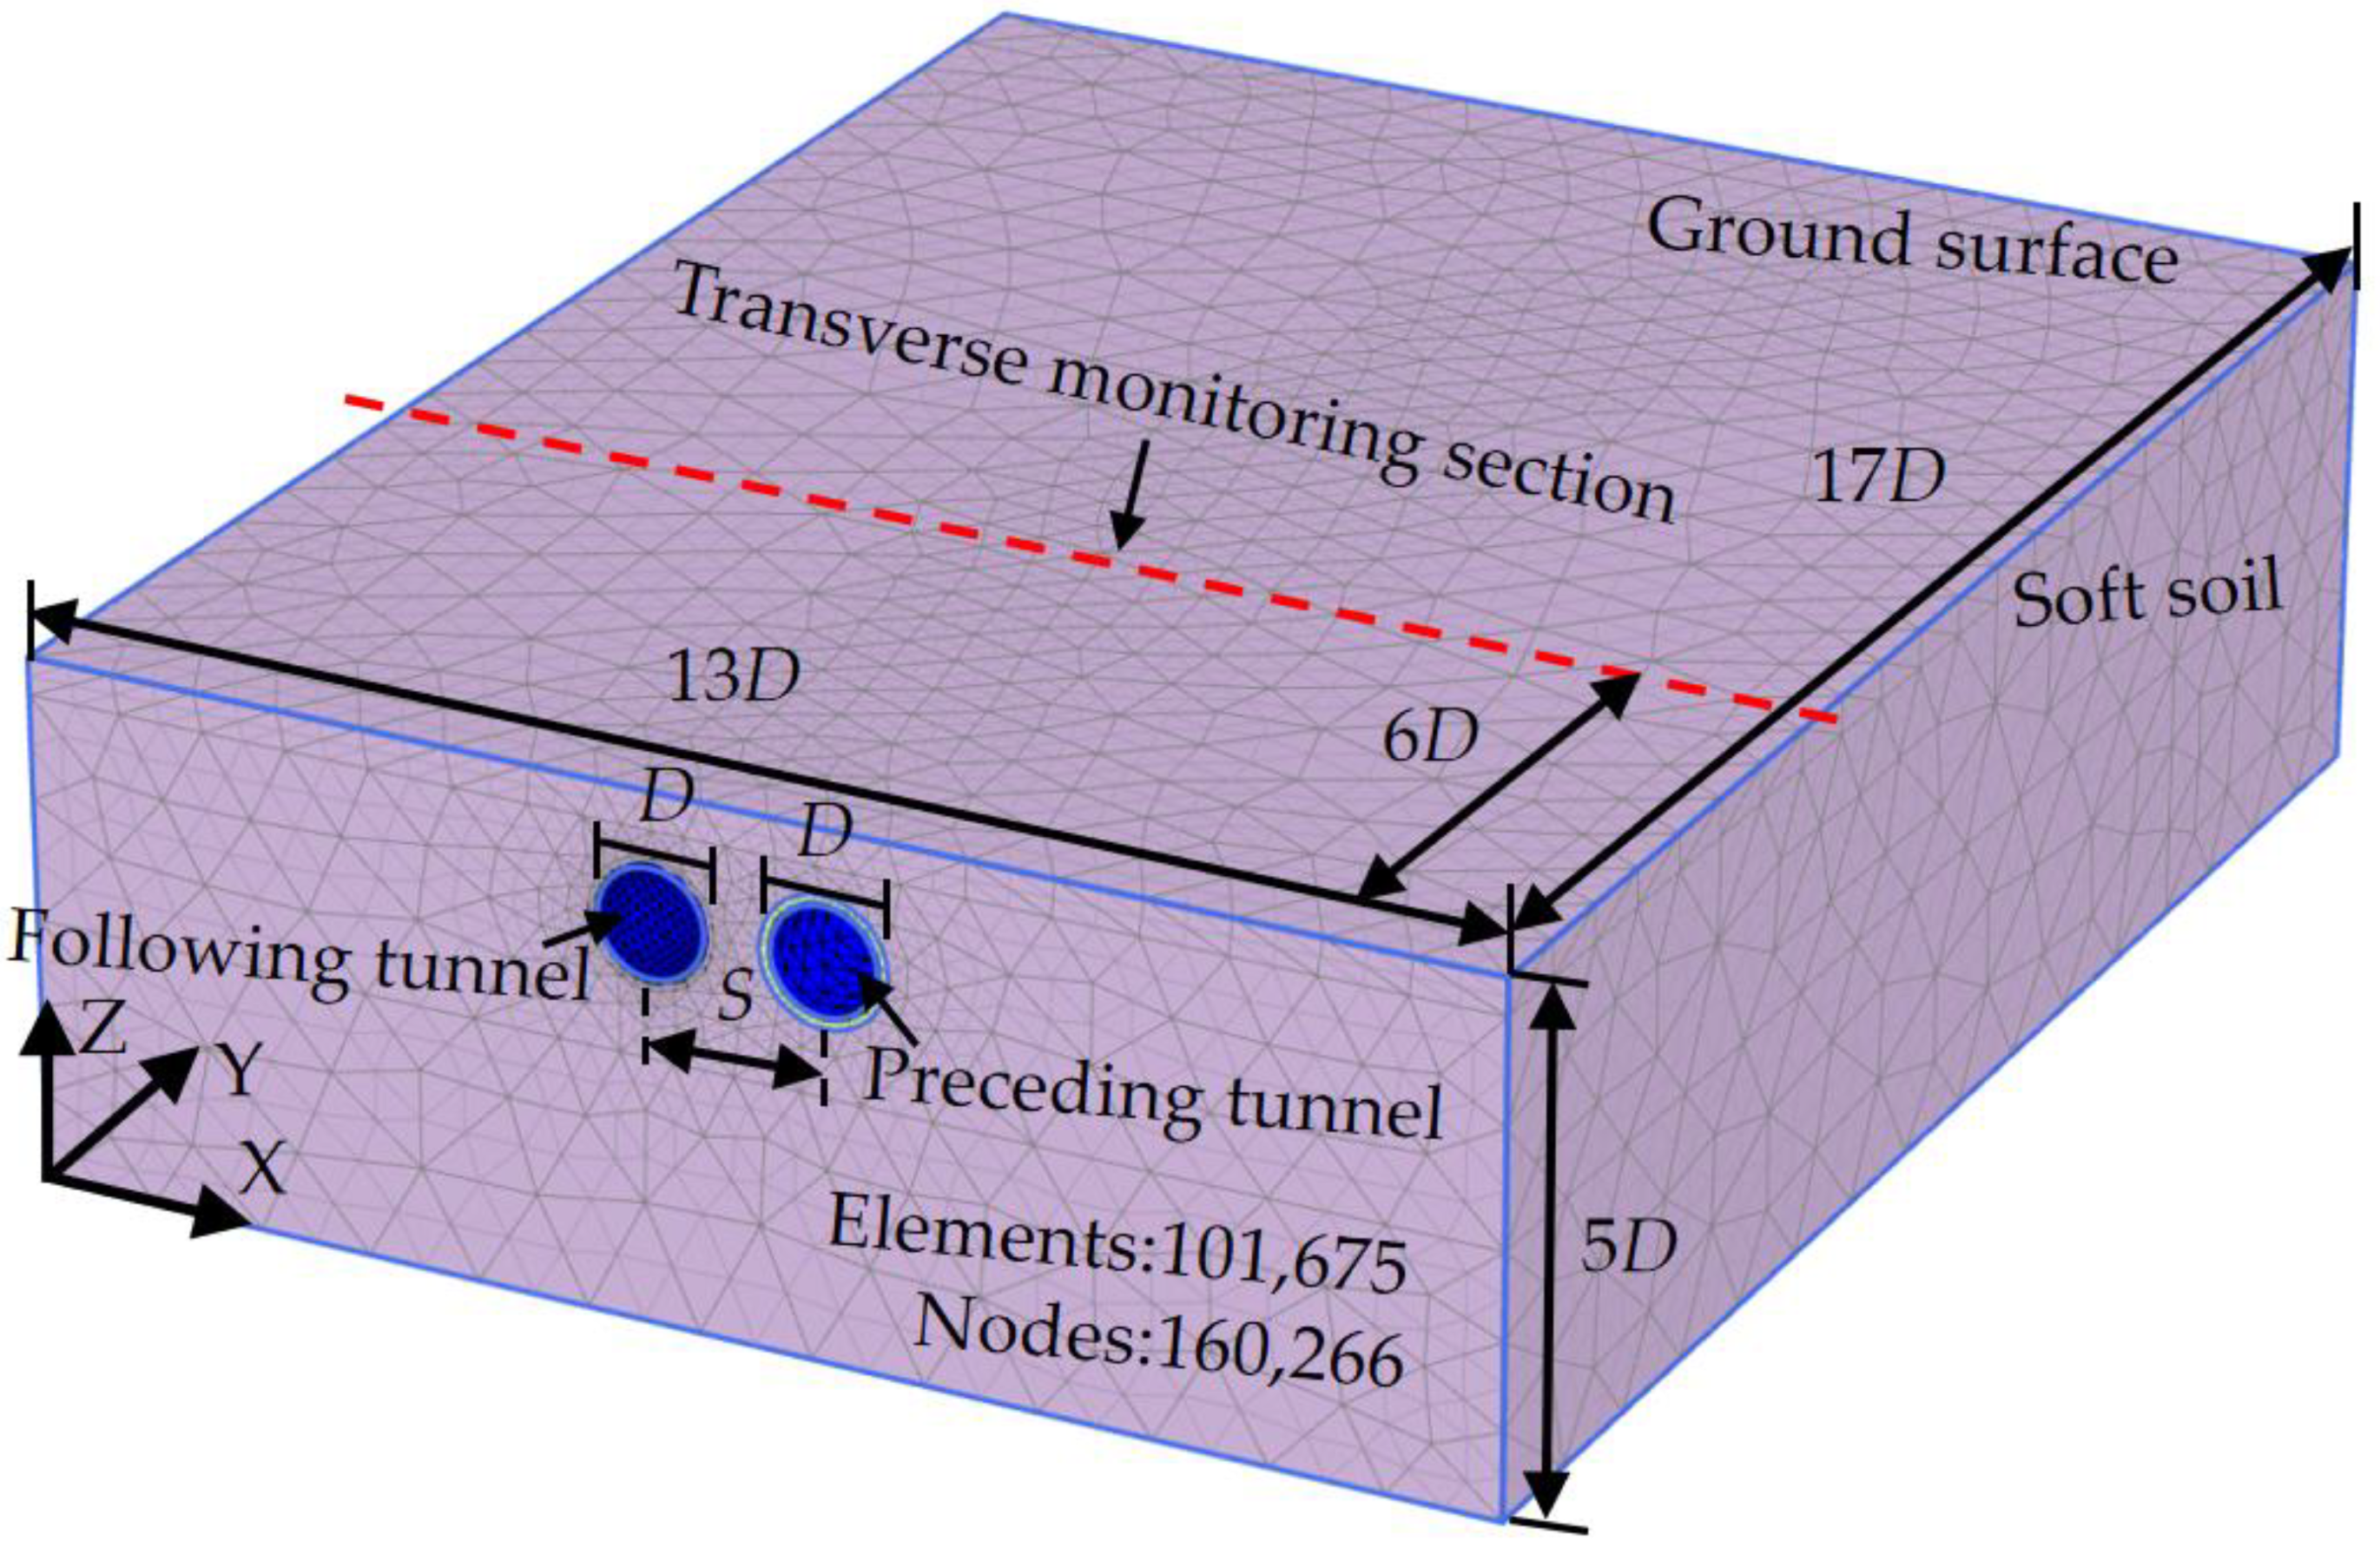
3. Three-Dimensional Finite Element Modeling

The model was developed using PLAXIS 3D software. This software has been used and validated by many researchers to investigate different problems related to tunneling [29,30,31]. The small strain-hardening (HSS) model was adopted to mimic soil behaviors. The model could take into account the nonlinear characteristics and the unloading behavior of soils reasonably well. The values of model parameters were determined based on the ground investigation report, and they are listed in Table 1.
A schematic view of the FEM model is provided in Figure 3. The diameter and cover depth of both tunnels were 15 and 7.5 m, respectively. The model was sufficiently large to avoid boundary effects with 13 D along the X directions and 5 D along the Z direction, and the excavation length along the Y direction was about 17 D. The boundary conditions for the model are as follows: the ground surface was free, the four vertical surfaces were fixed in the normal directions, and the base of the model was fixed. The groundwater table was assumed to be well below the tunnel invert; therefore, seepage was not considered in the analyses. The model includes approximately 101,675 non-uniform elements and 160,266 nodes, and the 10-node tetrahedral elements were adopted. In order to analyze the impact of construction of the following tunnel on the preceding tunnel, the transverse monitoring section (marked with a red dashed line in Figure 3) was set at a distance of 6 D from the starting location of excavation.
The tunnel construction process was modeled using a step-by-step approach. Each excavation step corresponds to an advancement of the tunnel face of 4 m, which is equal to the width of two lining rings [4]. A pressure equal to the initial ground horizontal stress was applied at the tunnel face [36]. The distribution of the jacking force, which acts on linings of the last ring, was assumed to be linear over the height of the tunnel [19,20]. A radial pressure was used to simulate the grouting pressure, taking into account the effect of gravity, over a length of 4 m behind the shield. The procedures for excavation of paralleled twin tunnels are summarized as follows [37]:
(1)
According to the lateral pressure coefficient K0, the initial boundary and stress conditions of the soil layer are established under the self-weight of soil.
(2)
The soft soil layer is reinforced and then the displacement caused by the reinforcement is reset.
(3)
The right tunnel is excavated, 4 m at each step, and relevant pressure is applied.
(4)
Since the focus of this paper is on the influence mechanism of the left tunnel excavation (the following tunnel) on the right tunnel (preceding tunnel), the soil displacement will be cleared away after the completion of the excavation of the right tunnel.
(5)
The left tunnel is excavated, 4 m at each step, and relevant pressure is applied until the construction is completed.
Furthermore, the established numerical model was calibrated by adopting the theoretical formula on surface settlement of paralleled twin tunnels presented by Zhou et al. [37]. Considering the disturbance caused by preceding tunnel excavation, the disturbance correction factor η is introduced as follows:
η ( x ) = M ( e x 2 2 1 ) ( 1 e W 2 8 ) 1 + 1 + M
where 1 + M is the maximum disturbance correction factor, W is influence range of the surface subsidence, x is the horizontal distance between the point and the axis of the preceding tunnel. With η, the equation of the surface settlement caused by the following tunnel construction considering the influence of the preceding tunnel excavation is proposed [37]:
S ( x ) = η ( x ) V 2 π i exp ( x d ) 2 2 i 2
where V is the stratum loss, i is the width of settlement trough, and d is the distance between paralleled twin tunnels.
Figure 4 presents the comparison between the numerical and analytical results, in which Equations (1) and (2) were adopted to predict ground settlement caused by excavation of twin tunnels in unreinforced stratum, i.e., t = 0.00 D. It can be seen that the trends of the two curves are consistent, and the R2 (goodness of fit) is about 0.936. Both of the results show that the maximum settlement point at the ground surface is not located on the axis of the following tunnel but is offset by about 0.3 D to the preceding tunnel.

4. Results and Analyses

In order to understand the impact of excavation of the following tunnel (left) on the preceding tunnel (right), this section presents settlement of the ground surface, displacement of the preceding tunnel, convergence deformation of the preceding tunnel, and internal force of lining of the preceding tunnel as the excavation face of the following tunnel advances. The responses of the transverse section corresponding to the 45th ring (counting from the model boundary at y = 0 m) have been extracted. For simplicity, the section and the ring hereafter is called the transverse monitoring section and the measured ring, respectively.

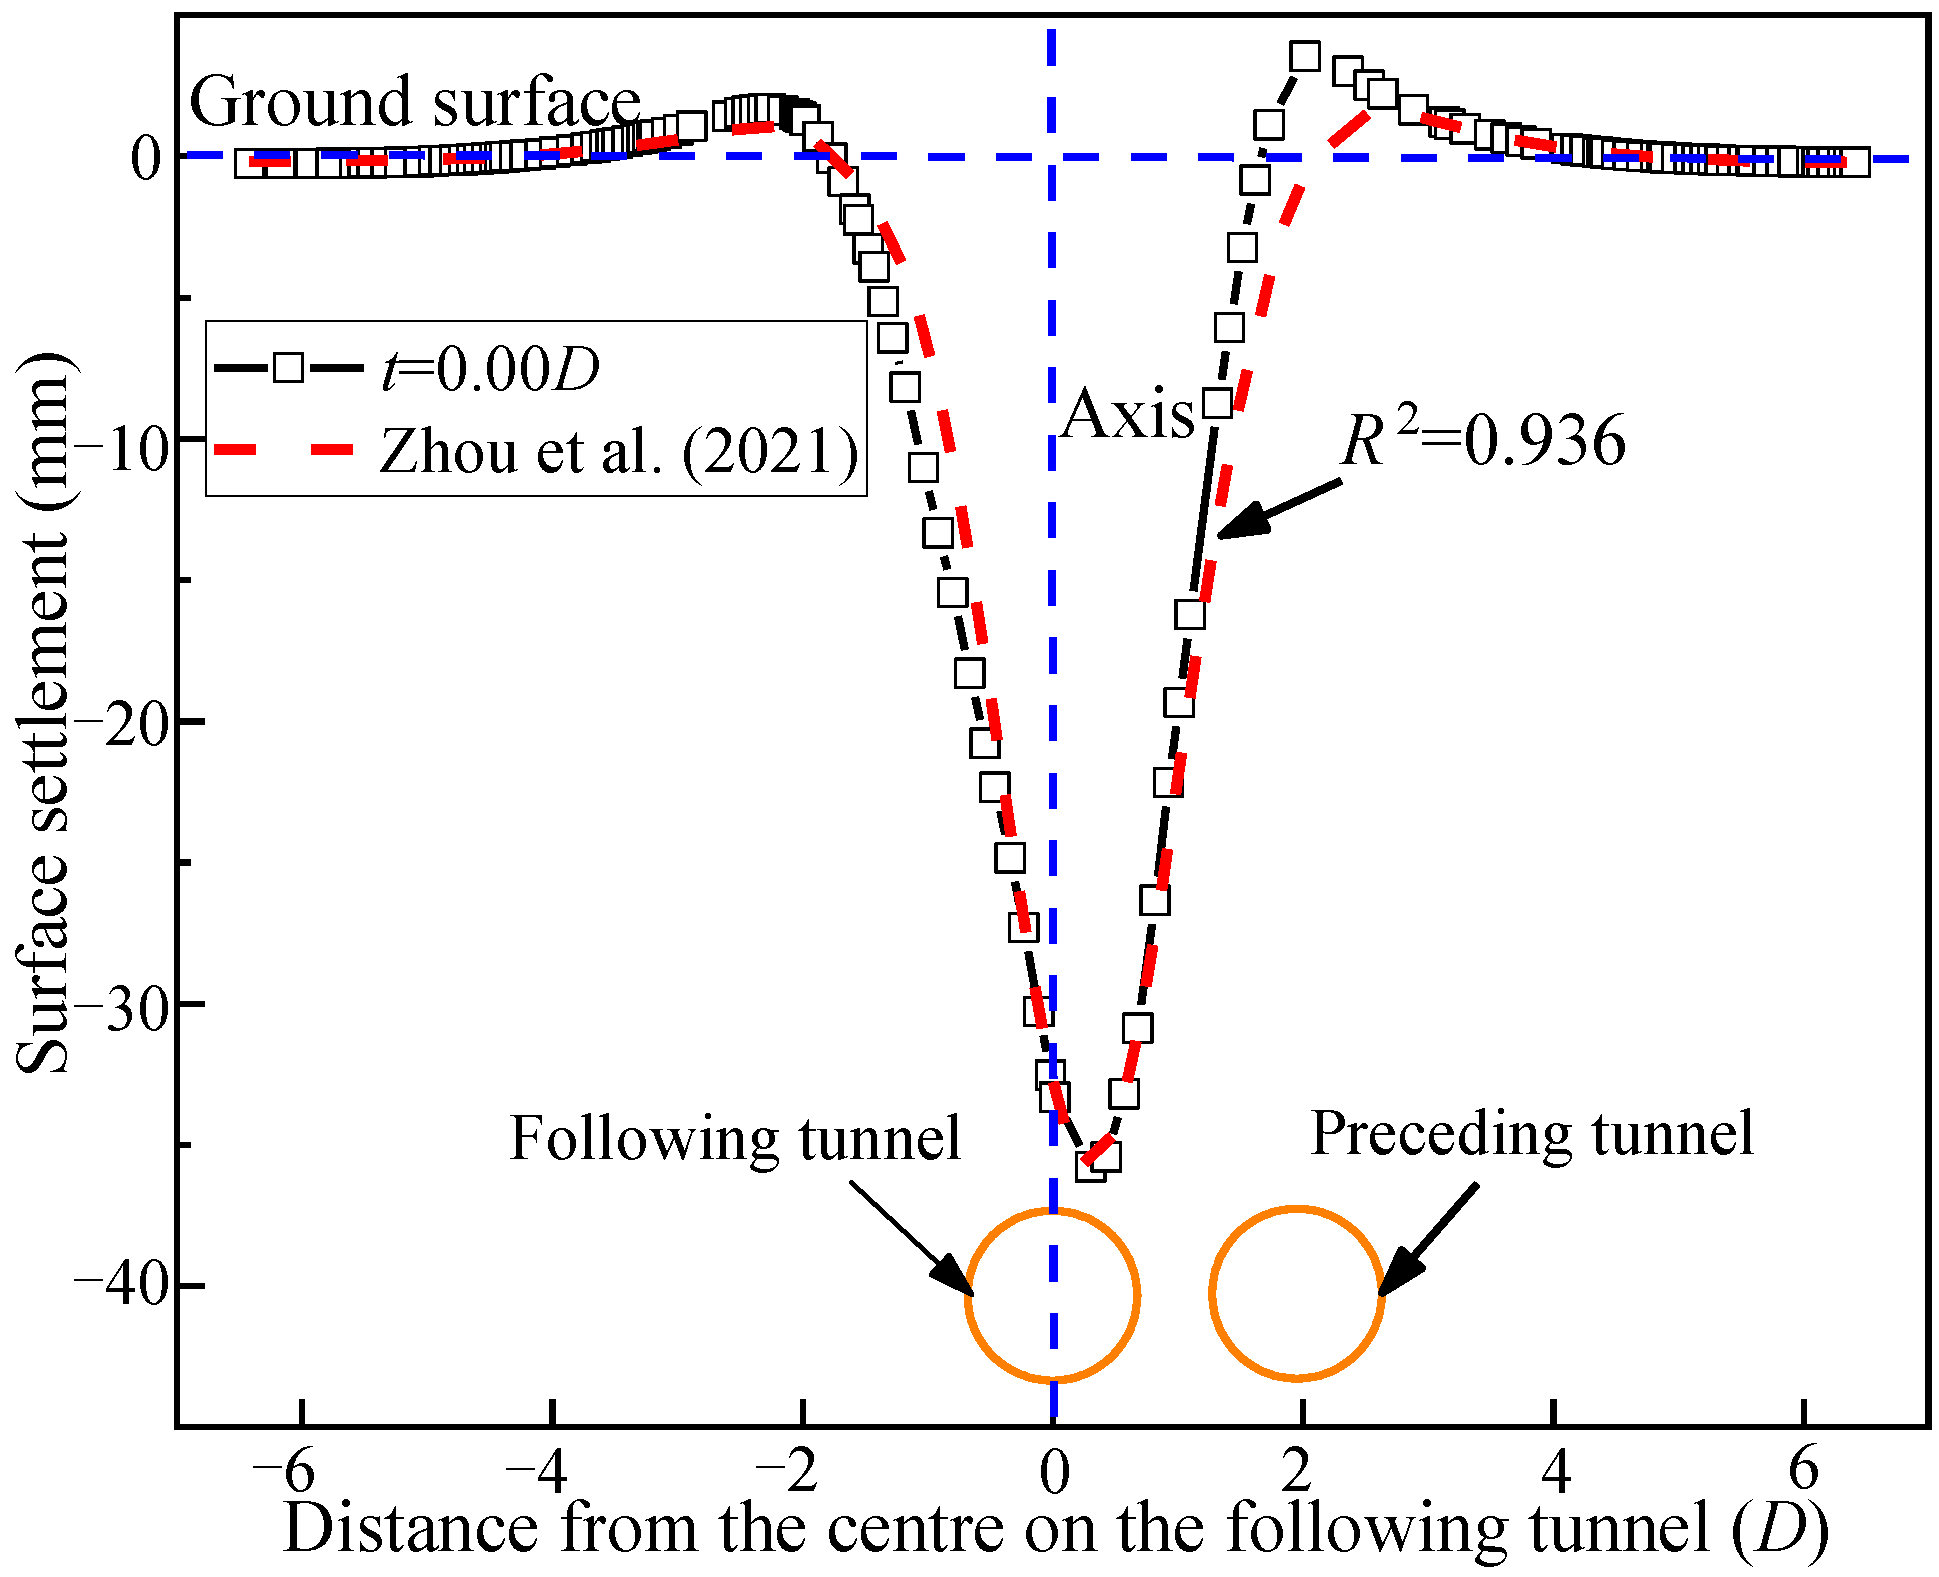
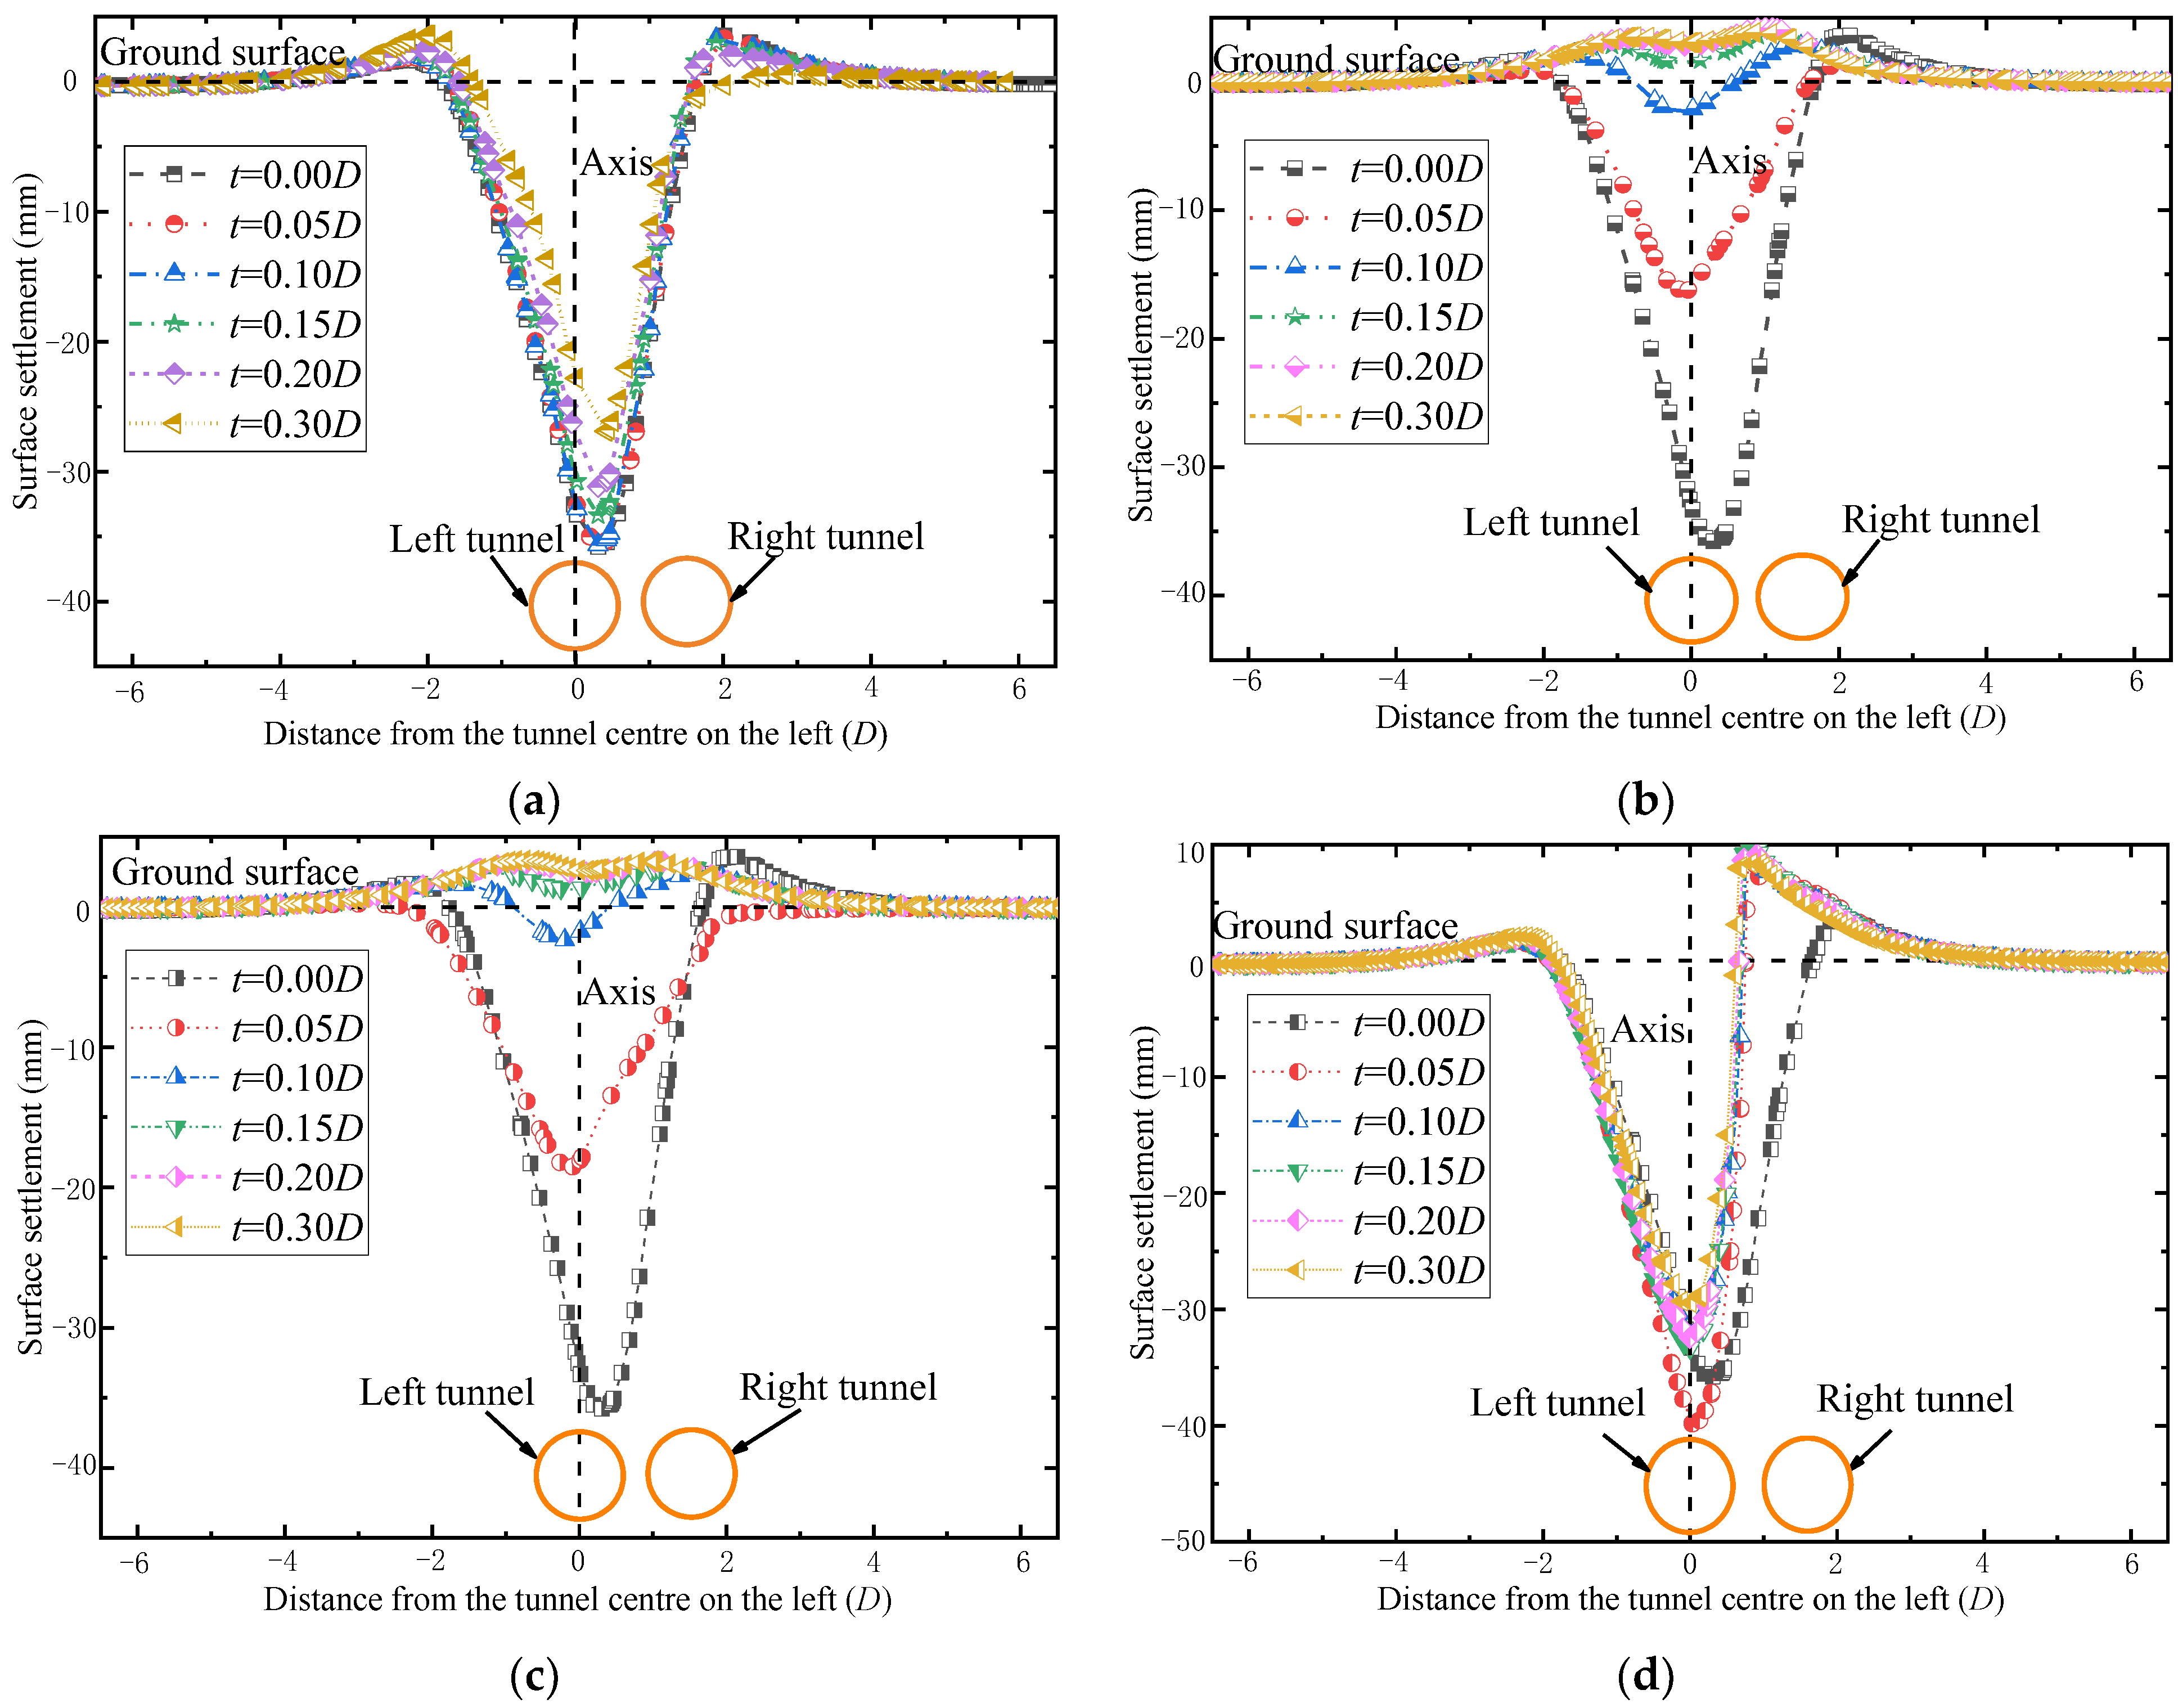
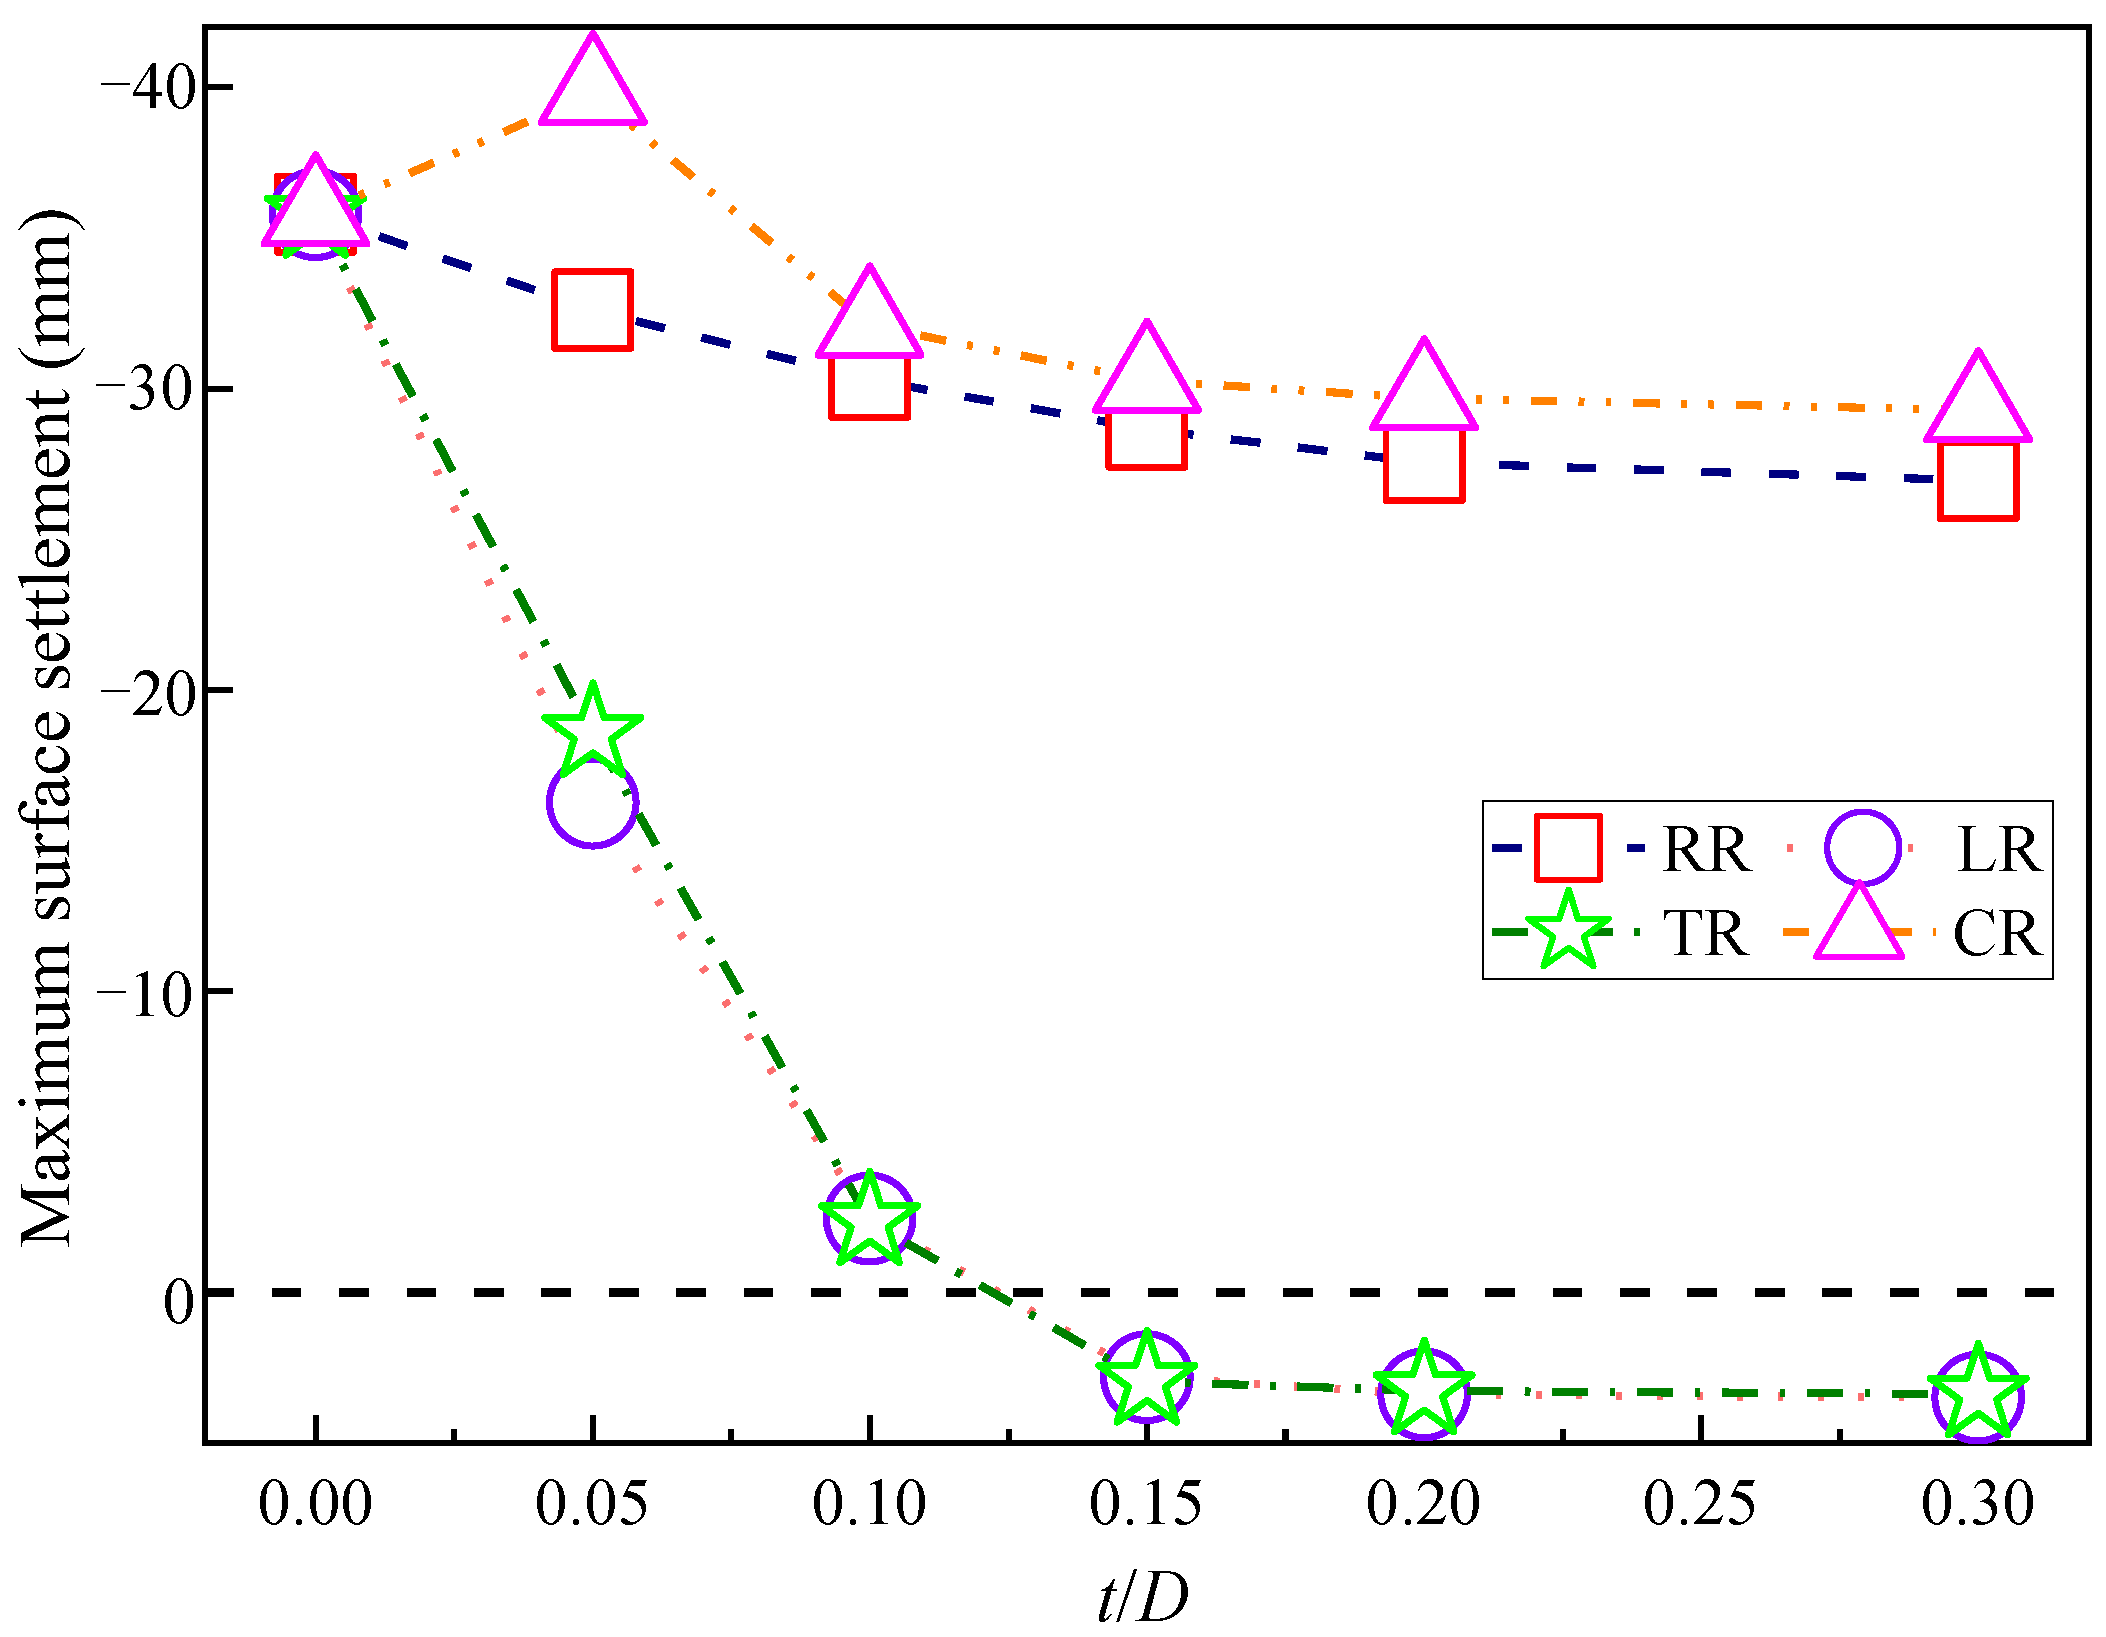
4.1. Settlement of Ground Surface

During construction, the additional soil stress caused by the excavation of the following tunnel is transmitted through the ground movements and thus affects the stability of the preceding tunnel. Therefore, in order to understand the twin tunnels’ interactions, it is important to investigate the ground surface settlement (vertical downward displacement at the ground surface), and especially, ground movements between the twin tunnels [4,20,38,39].
Figure 5 shows the settlement of the ground surface at the transverse monitoring section under different scenarios. Figure 5a shows the surface settlements for the ring reinforcement of the right tunnel (RR). It can be clearly seen that the surface settlement profile is asymmetric but still approximately conforms to Peck’s curve. An asymmetric profile of the settlement has also been observed through field measurements at shield tunneling sites [37]. The maximum settlement, Smax, is 35.78, 32.60, 30.30, 28.66, 27.54, and 26.95 mm for t = 0.0 D, 0.05 D, 0.10 D, 0.15 D, 0.20 D, and 0.30 D, respectively. When t = 0.30 D, the Smax is reduced by about 24.6% compared with the case of t = 0.0 D, indicating that the RR has some effect on decreasing the surface settlement.
The surface settlement for the cases with the ring reinforcement of the left tunnel (LR) and the twin tunnels (TR) are shown in Figure 5b,c. The shapes and values of two sets of profiles are relatively close. During the excavation process of the following tunnel, the accumulated ground loss was mainly caused by the following tunnel, and the stress release zone was concentrated around the following tunnel. Therefore, the LR could effectively hinder the transmission of soil stress and reduce the disturbance to the ground surface. It suggests that the reinforcement of the following tunnel plays a more important role in surface settlement, while the reinforcement of the preceding tunnel plays an auxiliary role. When t is relatively small (t < 0.10 D), the surface is subject to settlement. However, with the increase in t (t > 0.10 D), the surface starts to heave. This is because the stiffness and thickness of the reinforcement layer are relatively large, and the accumulated ground loss caused by excavation of the following tunnel is small, but the rebound of the soil layer due to the release of soil stress is relatively large. In Figure 5b, Smax is 35.78, 16.25, 2.45, 2.81, 3.38, and 3.49 mm for t = 0.0 D, 0.05 D, 0.10 D, 0.15 D, 0.20 D, and 0.30 D, respectively. When t = 0.30 D, the Smax is reduced by about 90.2% compared with the case of t = 0.0 D. The degree of impact by the TR is similar. The results indicate that the LR and TR can play a significant role in reducing surface settlement.
Figure 5d shows the surface settlement for the cases with cement wall reinforcement (CR). It is seen that the left and right sides of the settlement curve are not symmetrical with respect to the symmetrical axis of the left tunnel. The CR has blocked the transmission of the soil displacement caused by the loss of soil layer around the following tunnel, but the heaving of soil due to stress release during excavation of the following tunnel still propagates to the right side of the wall reinforcement. This results in heaving of the ground surface on the right. However, the accumulated loss of the soil layer still causes a certain surface settlement on the left side of the wall reinforcement. Generally, with the increase in t, the ground settlement has not changed significantly. The Smax is 35.78, 39.81, 32.09, 30.26, 29.68, and 29.28 mm for t = 0.0 D, 0.05 D, 0.10 D, 0.15 D, 0.20 D, and 0.30 D, respectively. When t = 0.30 D, the Smax is reduced by about 18.2% compared with the case of t = 0.0 D. Similarly, it shows that the CR has no significant effect in reducing the settlement of the ground surface.
Figure 6 shows the variation of the maximum surface settlement with t under different reinforcement strategies. In general, both the RR and CR limit the transmission of the stress release from the following tunnel excavation to the preceding tunnel, but do not directly limit its transmission to the surface, so that the surface settlement has not been significantly reduced by the RR and CR to the allowable value (Smax < 20 mm). For the LR and TR, the soil layer around the following tunnel is reinforced, which can effectively decrease the disturbance to the ground surface due to excavation of the following tunnel.

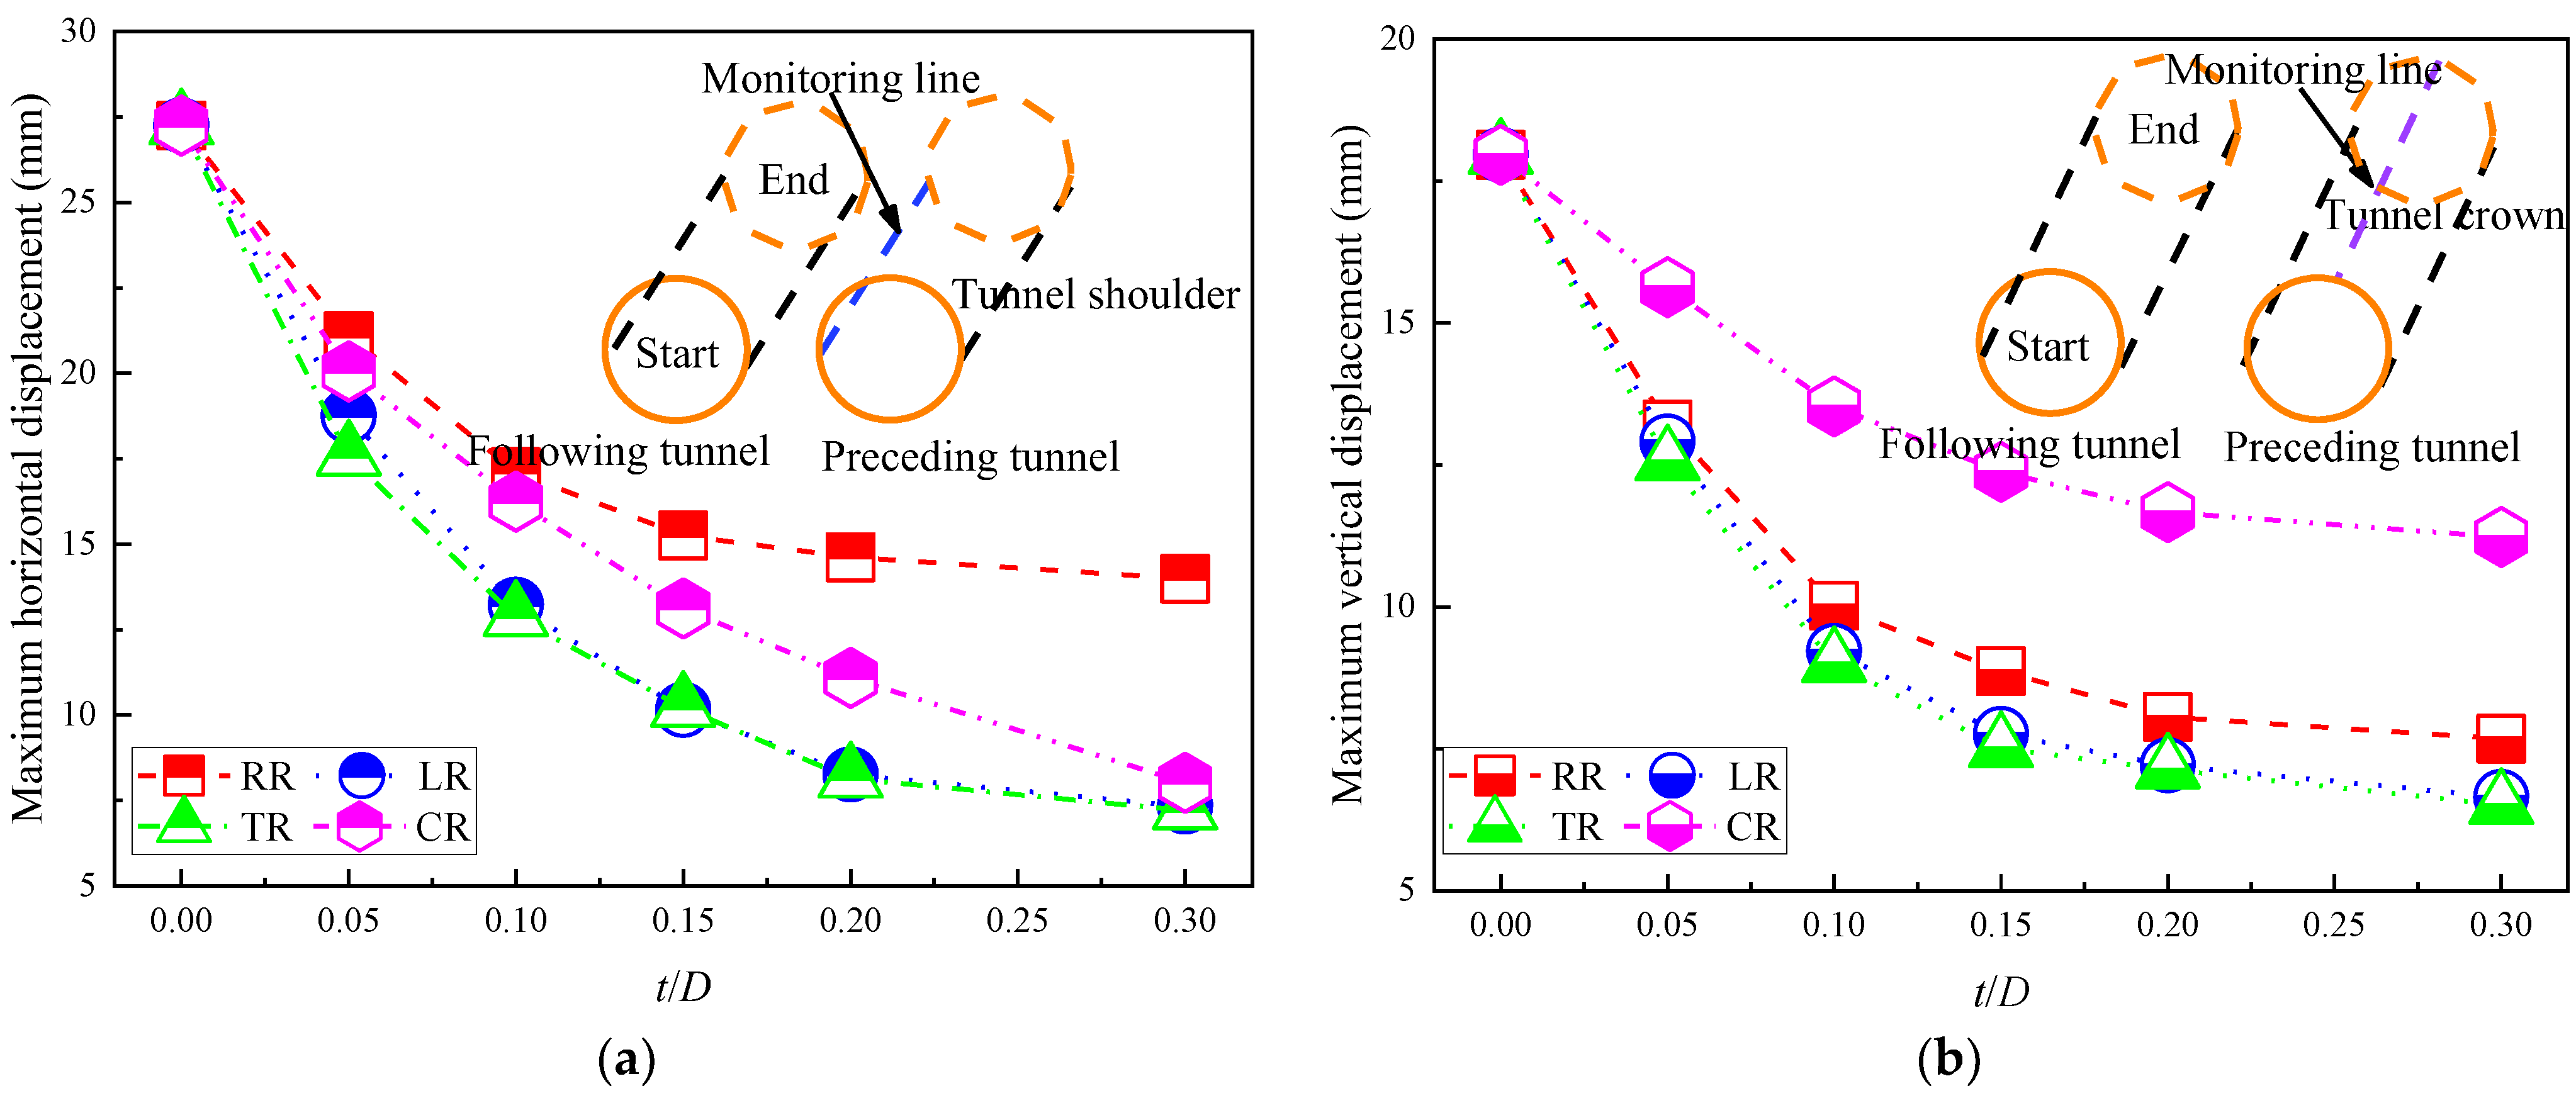
4.2. Displacement of the Preceding Tunnel

The displacement of the preceding tunnel resulting from construction of the following tunnel is another major concern, which refers to the horizontal or vertical displacement of the tunnel along the excavation direction. According to a previous study on the influence mechanism of the following tunnel on the preceding tunnel, it was found that the maximum horizontal displacement of the preceding tunnel was located at the tunnel shoulder and the maximum vertical displacement was located at the tunnel crown [40,41]. Therefore, after the excavation of the following tunnel was completed, the horizontal at the shoulder and the vertical displacement at the crown of the preceding tunnel would be monitored, and the maximum displacement would be extracted. In this paper, the horizontal displacement to the right and the vertical displacement in the upward direction is defined as positive.
The maximum displacements under different cases as obtained from the numerical simulation are presented in Table 2. Explanation of the data, e.g., 27.25/17.96 is the maximum horizontal displacement/maximum vertical displacement at t = 0.00D of the RR. In addition, decrease rate = (value t=0.00D − value t=0.30D)/value t=0.00D. It can be seen that, with the increase in t, the maximum value of horizontal and vertical displacement gradually decreases. In terms of the decrease rate, the LR and TR are more effective than RR and CR.
Figure 7 shows the variation of the maximum horizontal displacement at the shoulder and the vertical displacement at the crown of the preceding tunnel with the reinforcement thickness. It can clearly be seen that the trends of different curves are similar. During the excavation of the following tunnel, the LR and TR could effectively reduce both displacements of the preceding tunnel, while the CR could only significantly reduce the horizontal displacement and RR could only significantly reduce the vertical displacement.

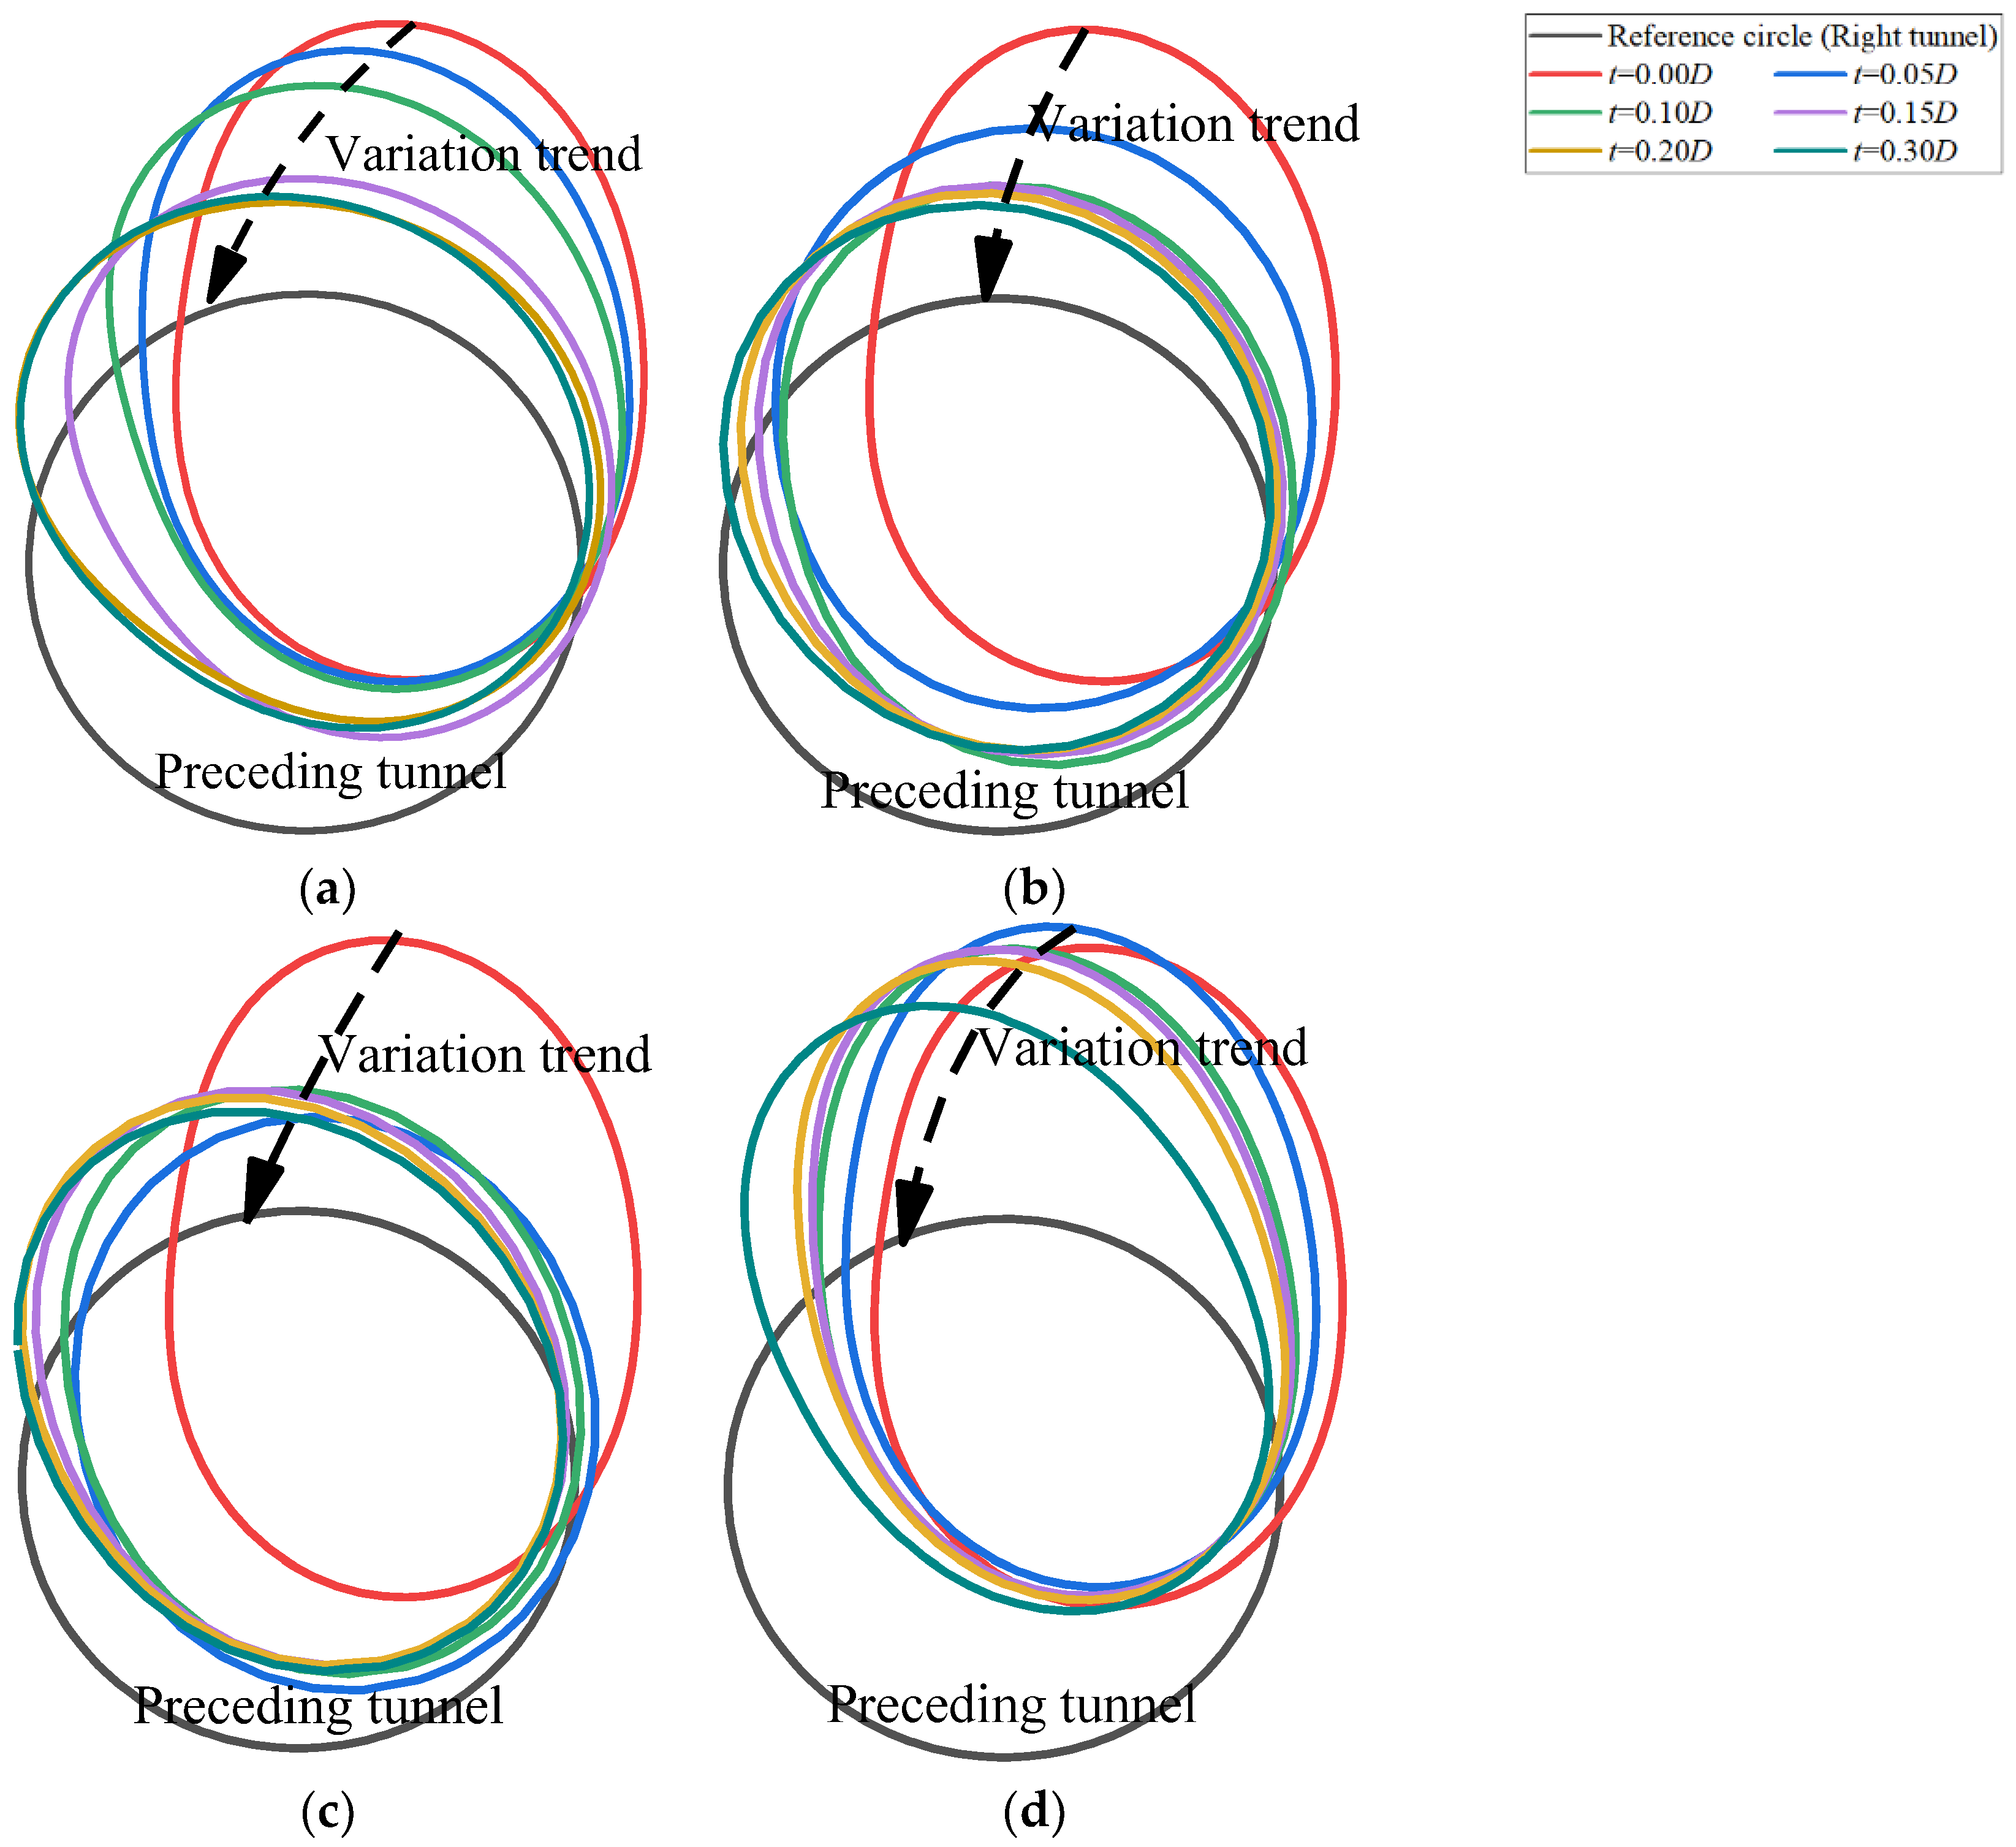
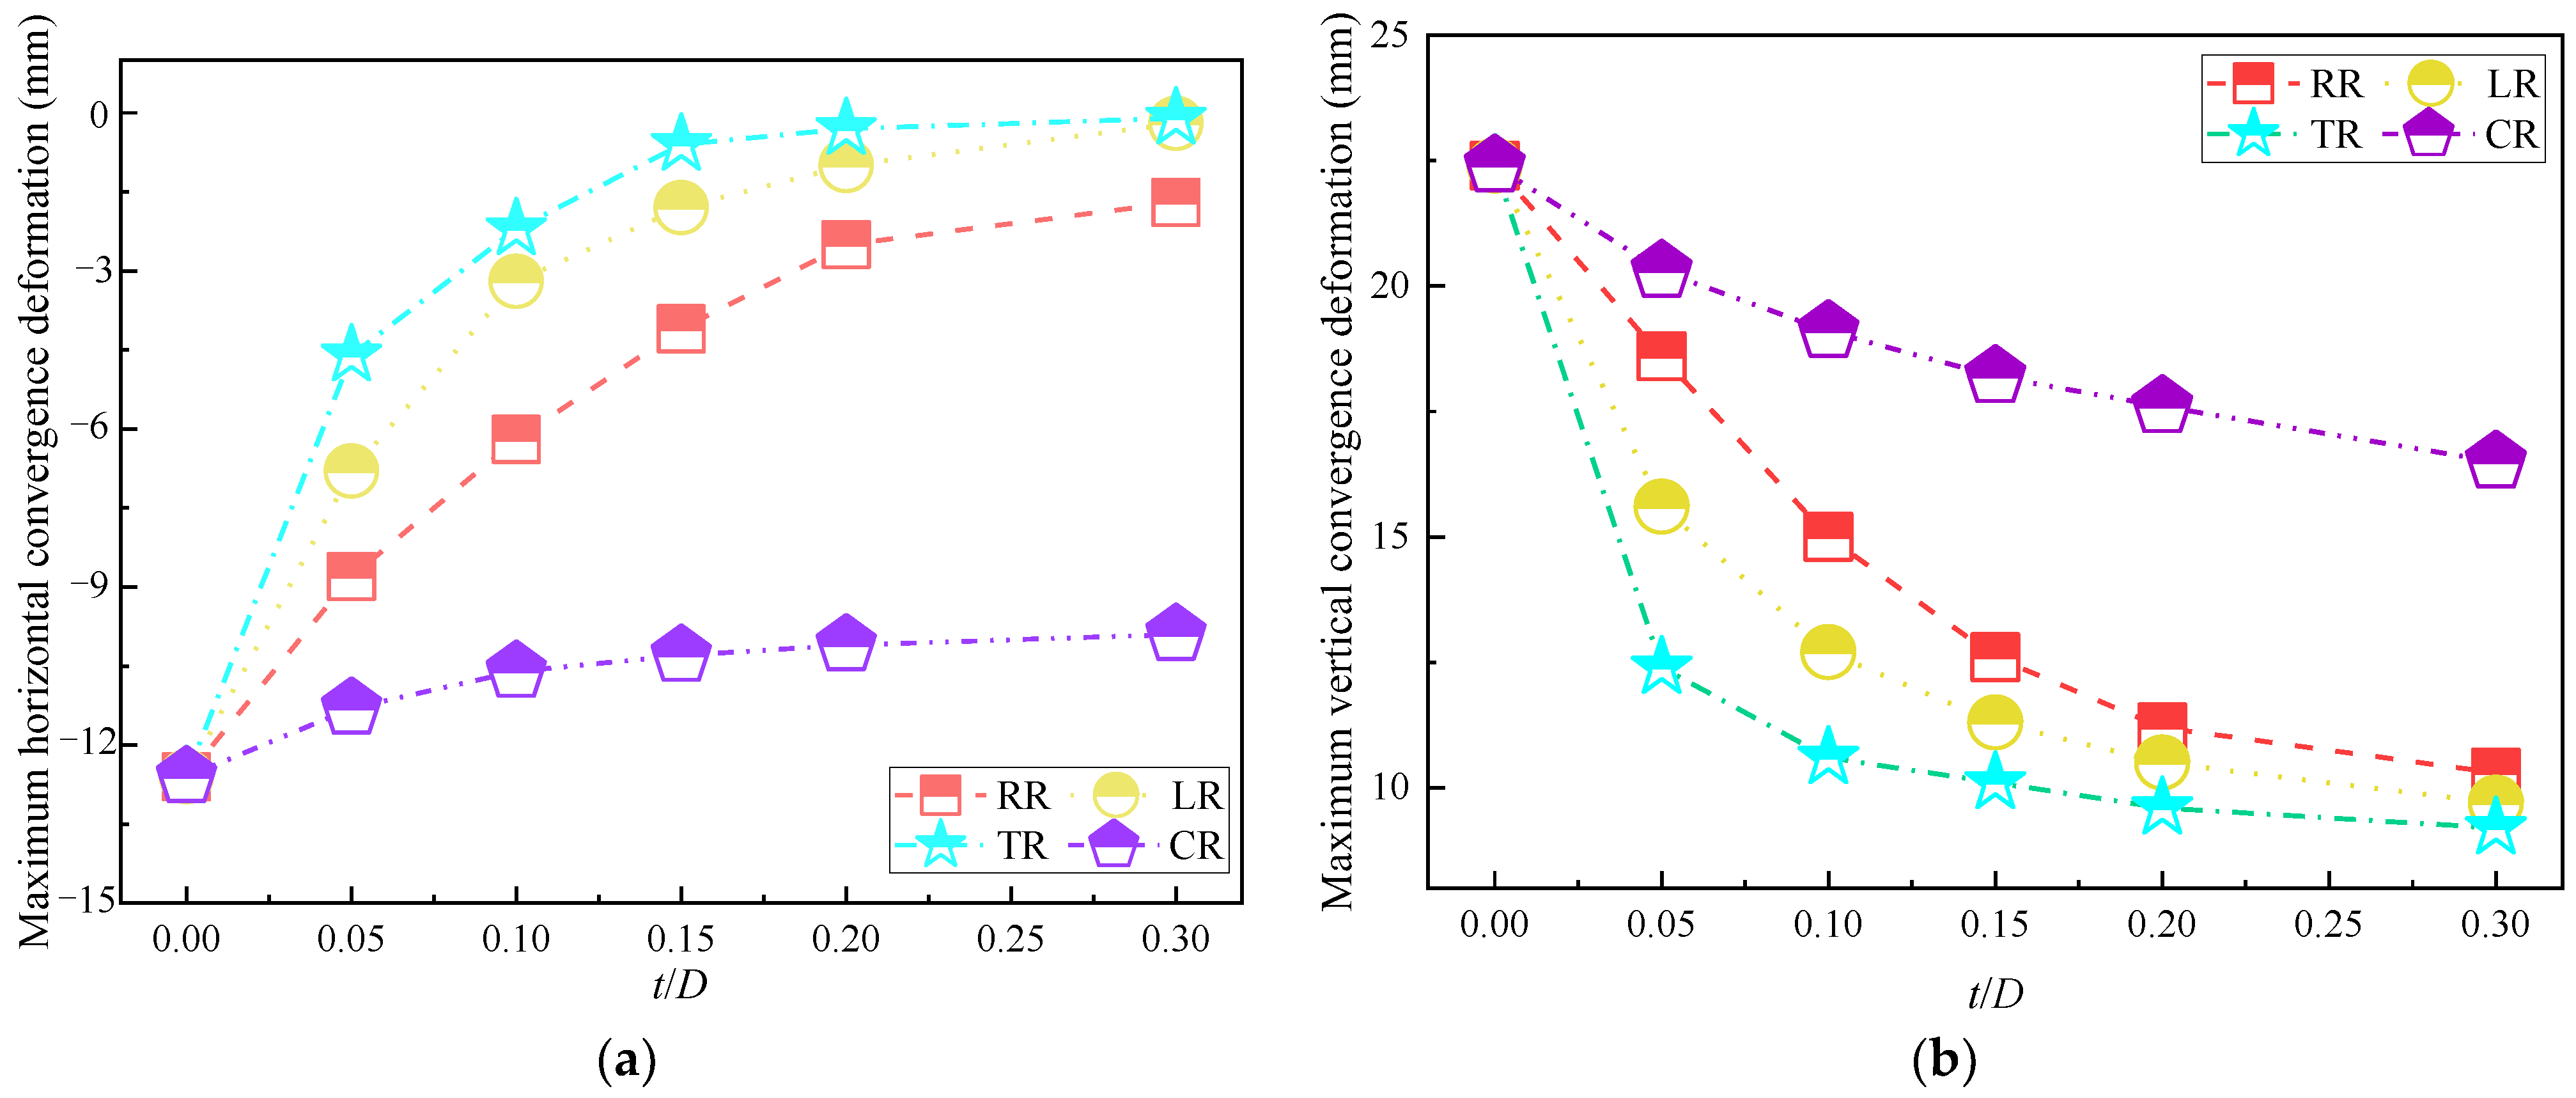
4.3. Convergence of the Preceding Tunnel

The convergence deformation of the lining in the transverse monitoring section of the preceding tunnel after the completion of the following tunnel is depicted in Figure 8. The black line in the figure shows the shape of the lining before excavation of the following tunnel and the lines in other colors show the deformed shape after excavation. In addition, the convergence deformation of lining is defined as the variation of tunnel diameter. The horizontal convergence is the variation of tunnel diameter in the horizontal direction, and the vertical convergence is the variation of tunnel diameter in the vertical direction. A positive value of convergence deformation indicates an increase in the diameter when quantifying the deformation.
Figure 8a shows the convergence deformation of lining for the cases of RR. With the increase in t, the deformation tends to decrease. The vertical convergence is 22.4, 18.6, 15.0, 12.6, 11.2, and 10.3 mm, and the horizontal convergence values are −12.6, −8.8, −6.2, −4.1, −2.5, and −1.7 mm for t = 0.0 D, 0.05 D, 0.10 D, 0.15 D, 0.20 D, and 0.30 D, respectively.
In the case of t = 0.0 D (i.e., the soil is not improved), the tunnel is elongated in the vertical direction while compressed in the horizontal direction and the shape of the lining resembles a standing “duck egg” [42,43]. As the value of t increases, the “duck egg” gradually becomes oblique.
Figure 8b shows the convergence deformation of the linings for the LR. It can be seen that the variation of the shape with the change of t is similar to that of the RR. The vertical convergence of the linings are 22.4, 15.6, 12.7, 11.3, 10.5, and 9.7 mm and the horizontal convergence values are −12.6, −6.8, −3.2, −1.8, −1.0, and −0.2 mm for t = 0.0 D, 0.05 D, 0.10 D, 0.15 D, 0.20 D, and 0.30 D, respectively. As the value of t increases, the convergence decreases faster in the LR than in the RR. It indicates that the LR has a better restraint effect on convergence deformation of the preceding tunnel lining than the RR.
Figure 8c shows the convergence deformation of the lining for the TR. With the increase in t, the convergence deformation of the lining gradually decreases. The tendency is very close to the cases of LR. The vertical convergence values of the linings are 22.4, 12.4, 10.6, 10.1, 9.6, and 9.2 mm and the horizontal convergence values are −12.6, −4.6, −2.2, −0.6, −0.3, and −0.1 mm for t = 0.0 D, 0.05 D, 0.10 D, 0.15 D, 0.20 D, and 0.30 D, respectively. It should be noted that, at the moment in which the following tunnel passes over the measured section of the preceding tunnel, the release stress can be effectively reduced by the LR, so the disturbance transmitted to the preceding tunnel has been very small, and the reinforcement of the preceding tunnel plays a less obvious role here. Therefore, in accordance with the phenomena observed in the above-mentioned ground settlement and tunnel deformation, only the LR can effectively reduce the disturbance of the excavation to the preceding tunnel.
The convergence deformations of the linings for the CR are shown in Figure 8d. The vertical convergence values of the linings are 22.4, 20.3, 19.1, 18.2, 17.6, and 16.5 mm and the horizontal convergence values are −12.6, −11.3, −10.6, −10.3, −10.1, and −9.9 mm for t = 0.0 D, 0.05 D, 0.10 D, 0.15 D, 0.20 D, and 0.30 D, respectively. Compared with other strategies, when t = 0.3 D, the convergence of the lining by the CR still remains large, which indicates that the CR has a weaker effect on the control of the development of convergence deformation of the preceding tunnel lining.
Based on the results in Figure 8, the maximum convergence under different cases is summarized, as shown in Figure 9. With the increase of t, the maximum convergence decreases under all of the four strategies, but the effectiveness of increasing reinforcement thickness becomes weak when t is larger than 0.2 D. Among all strategies, TR is the most effective at controlling the development of convergence. When t = 0.3 D, this approach can reduce the horizontal convergence by 98.4% and vertical convergence by 56.7% when compared with the case of t = 0.0 D. The LR shows a similar effect, which results in a reduction of 86.5% horizontally and 54% vertically. In light of these observations, reinforcement of the soil layer around the following tunnel is vital in controlling the impact of construction of the following tunnel on the preceding one.

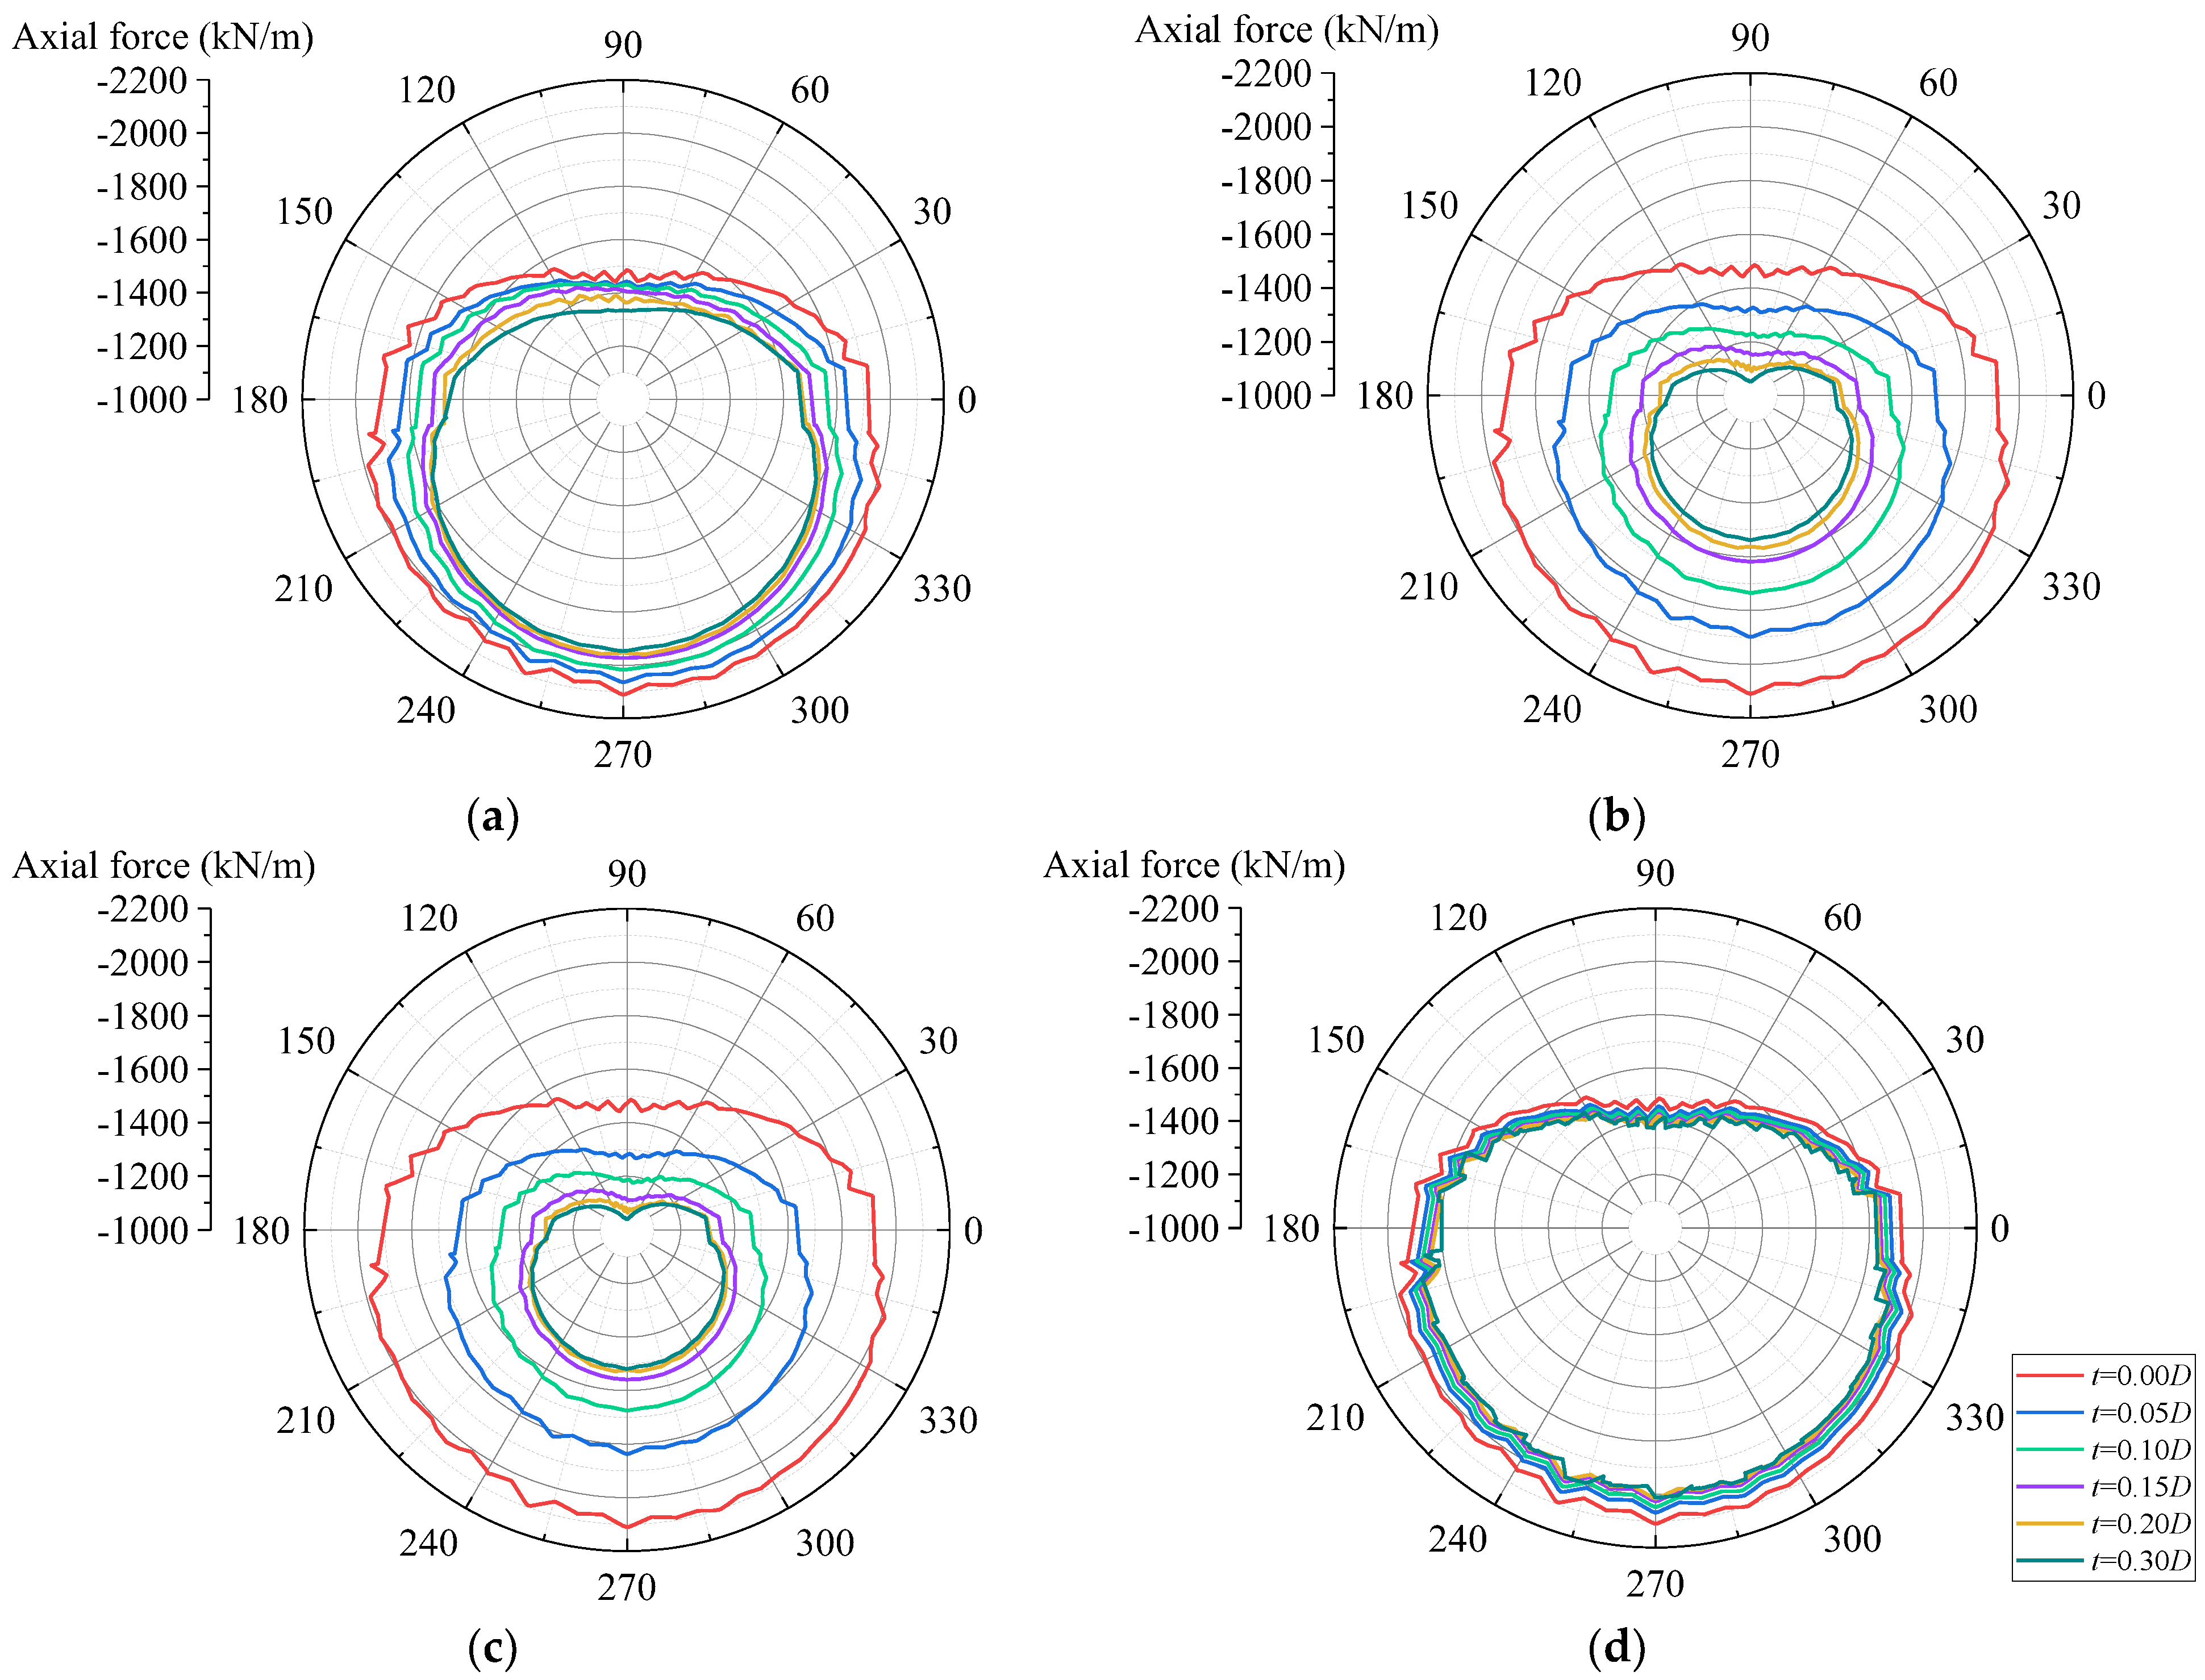
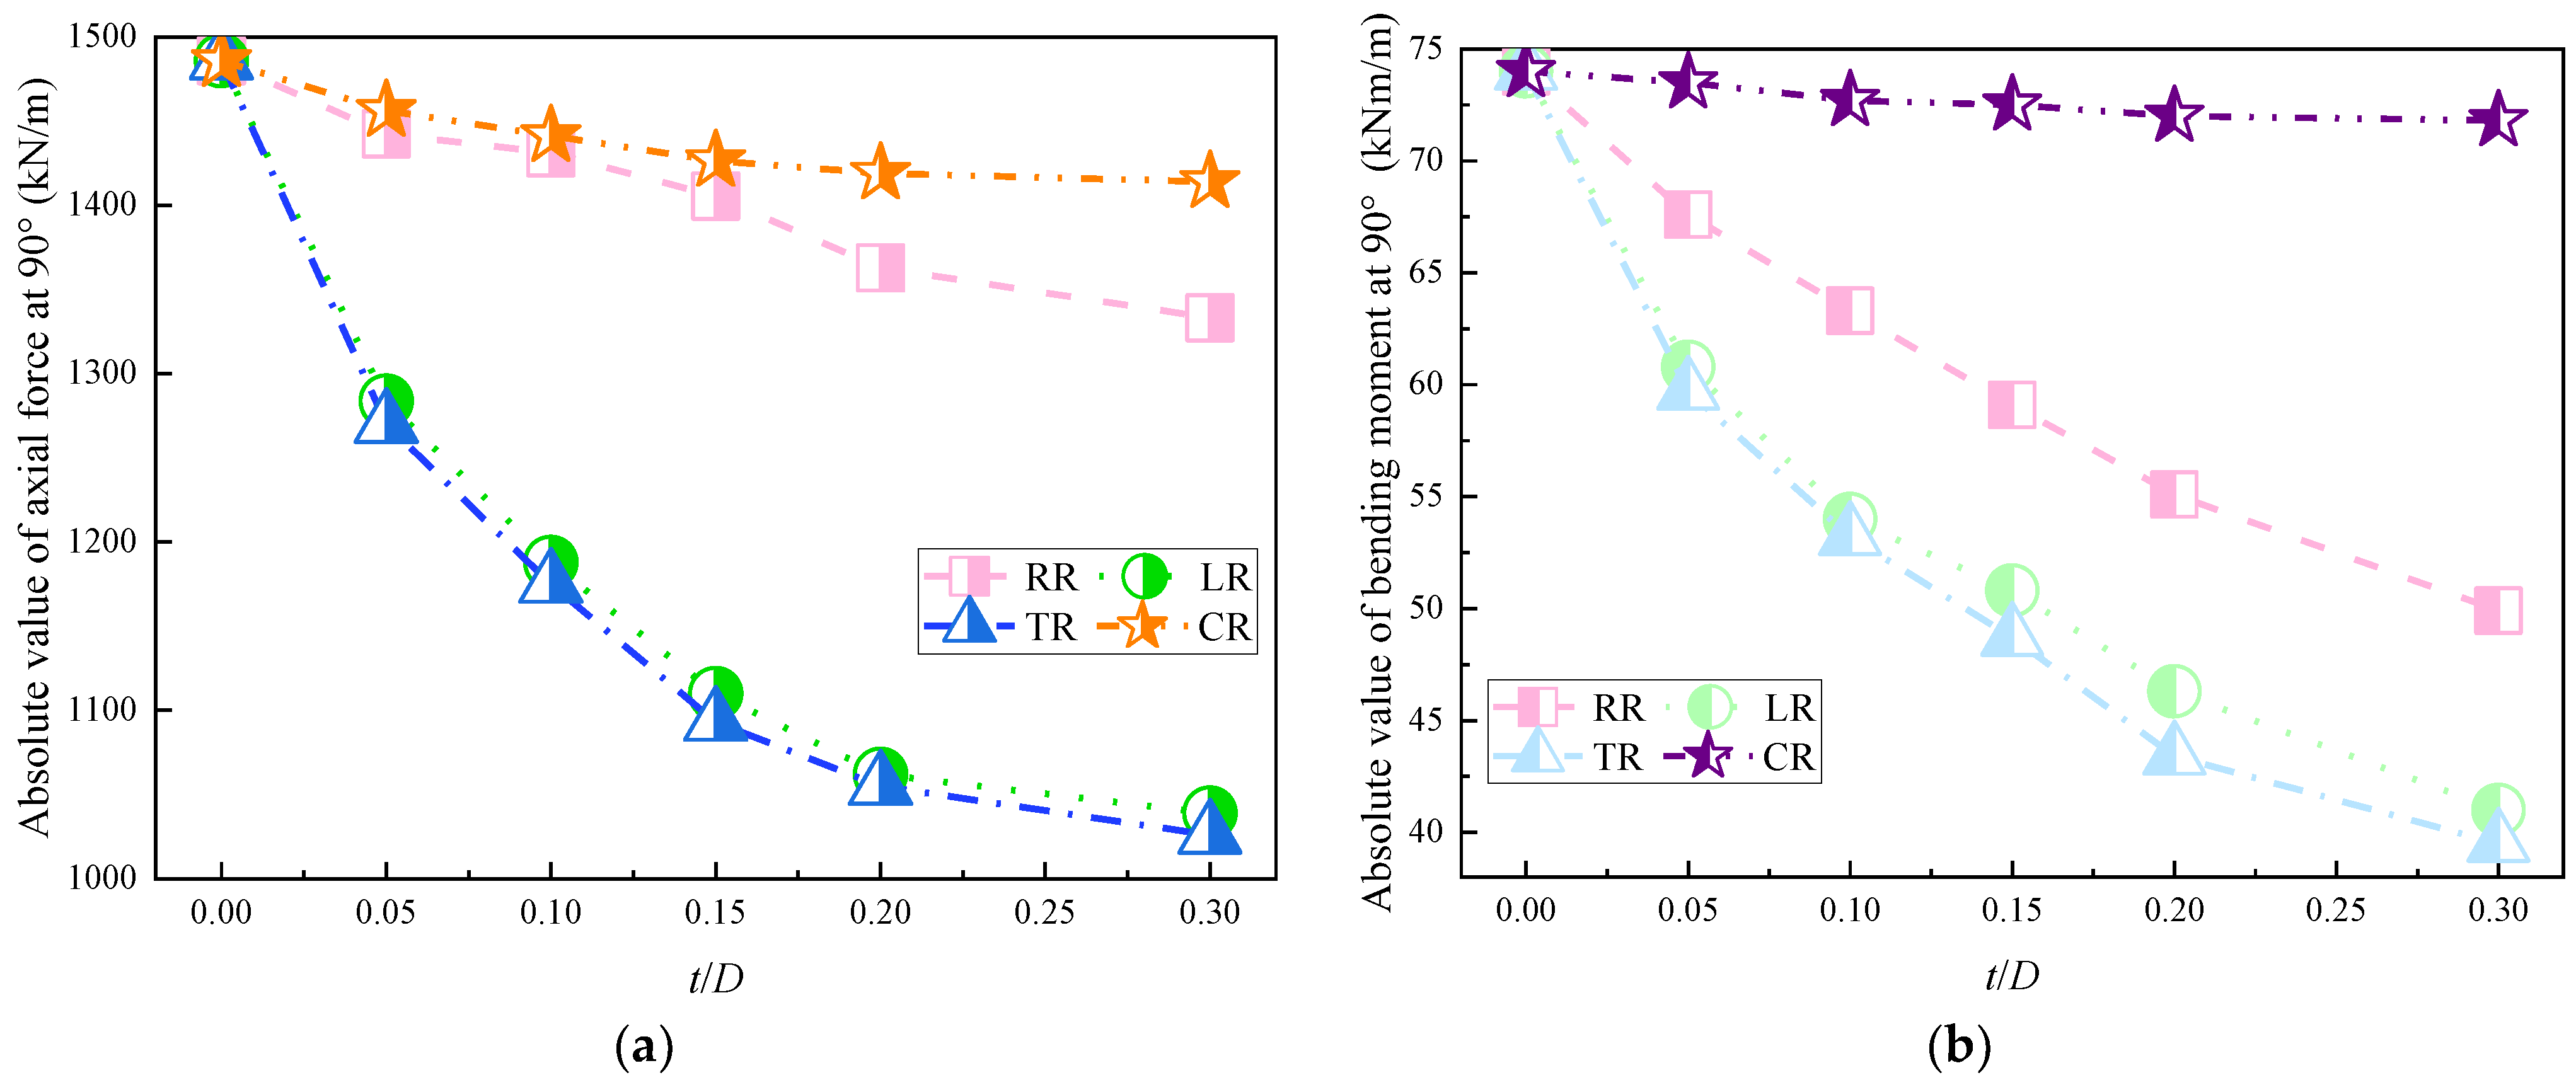
4.4. Internal Force of the Lining of the Preceding Tunnel

4.4.1. Axial Force

Figure 10 presents the axial force distribution of the lining of the preceding tunnel under different reinforcement strategies, where the axial force refers to the internal force on the tunnel lining that coincides with the hoop axis. In the figure, the negative value of axial force corresponds to the tension of tunnel lining. The force on the center of the circle is −1000 kN/m, while the force on the outermost circle is −2200 kN/m.
The axial force of the lining of the preceding tunnel upon the completion of the following tunnel when the soil layer is reinforced with the strategies of RR is shown in Figure 10a. It is seen that, with the increase in t, the axial force of the preceding tunnel lining generally decreases. In the case of t = 0.00 D, the maximum and minimum absolute values of axial forces are 2115.1 and 1432.5 kN/m, respectively, while in the case of t = 0.30 D, the corresponding values are 1785.3 and 1352.6 kN/m, respectively. For reinforcement with t = 0.30 D, the maximum absolute axial force decreases by about 15.6%, and the minimum absolute axial force decreases by about 5.6%, which is not a significant change.
Figure 10b shows the axial force of lining of the preceding tunnel upon the completion of the following tunnel when the soil layer is reinforced with the strategies of LR. It can clearly be seen that the variation trend of axial force with the increase in t is similar to Figure 10a, but the decrease rate is faster. The LR can reduce the disturbance to the preceding tunnel due to the excavation of the following tunnel more effectively. When t = 0.30 D, the maximum and minimum absolute values of axial forces are 1516.9 and 1039.8 kN/m. Compared with the case t = 0.00 D, the maximum absolute axial force decreases by about 28.3%, and the minimum absolute axial force decreases by about 27.4%.
For the cases of TR, the maximum and minimum absolute values of axial forces are 1513.9 and 1034.8 kN/m when t = 0.30 D. Compared with the case of t = 0.00 D, the maximum absolute axial force decreases by about 28.5%, and the minimum absolute axial force decreases by about 27.7%. The degree of impact of reinforcement in TR is similar to that in LR, which also indicates that reinforcement of the preceding tunnel plays a minor role.
For the cases of CR, the maximum and minimum axial forces are 2010.7 and 1390.8 kN/m, respectively, when t = 0.30 D. Compared with t = 0 D, the maximum absolute axial force decreases by about 5.0%, and the minimum absolute axial force decreases by about 3%. This shows that, during the excavation of the following tunnel, the CR has a weak ability to reduce the axial force of the preceding tunnel lining.

4.4.2. Bending Moment of the Lining of the Preceding Tunnel

Figure 11 shows the distribution of the bending moment of the measured lining of the preceding tunnel, where the bending moment refers to the moment induced by all axial forces acting on the cross section of the tunnel lining. In the figure, the positive value of the bending moment corresponds to the case that the outer side of the lining is in tension, or the inner side is in compression.
Figure 11a shows the bending moment of the preceding tunnel lining upon the completion of the following tunnel when the soil layer is reinforced with the strategies of the RR. With the increase in t, the bending moments at the tunnel vault and tunnel intrados gradually decrease, while the bending moments at the right and left haunch gradually increase. These phenomena are closely related to the deformation presented in Figure 8a. When t = 0.00 D, the shape of the preceding tunnel lining resembles a standing “duck egg”, and the maximum bending moment of the lining is basically located on the arch crown and arch invert. With the increase in t, the shape of the lining shown in Figure 8a gradually changes to the oblique “duck egg”; the maximum bending moment is basically located on the left and right haunch. When t = 0.00 D, the bending moment at 90° is 74.4 kN·m/m. When t = 0.30 D, the bending moment at 90° is 49 kN·m/m, and reinforcement of the soil layer around the preceding tunnel results in a reduction of about 33.8%.
The bending moment distributions of the preceding tunnel lining upon the completion of the following tunnel when the soil layer is reinforced with the strategies of the LR are shown in Figure 11b. With the increase in t, the variation trend of the bending moment is similar to the cases of the RR. From Figure 8b, it can be found that, as t increases, the convergence decreases at a faster rate in the LR than in the RR, and the same is the case for the variation rate of the bending moment. The position of the maximum bending moment in the cases of the LR is gradually shifted from 90° or 270° to 165° or 345° of the lining. When t = 0.30 D, the maximum bending moment at 90° is 42.1 kN·m/m, which decreases by about 43.4% in comparison with the case of t = 0.00 D.
Figure 11c shows the bending moments for the cases of the TR. It can be clearly seen that the characteristic of the bending moments is the same as that of the LR. When t = 0.30 D, the maximum bending moment at 90° is 41.3 kN·m/m. Compared with the case of t = 0.00 D, the maximum bending moment decreases by about 44.5%.
Figure 11d presents the bending moments for the cases of the CR. Similar to the axial force response presented in Figure 10d, the reinforcement strategy of the CR seems to have little effect on reducing the bending moment of the lining of the preceding tunnel. When t = 0.30 D, the bending moment at 90° is 71.8 kN·m/m. Compared with t = 0.00 D, it decreases by only 3.0%.
Figure 12 summarizes the variation of the maximum axial force and bending moment at 90° of the preceding tunnel lining with t. It can clearly be seen that, with the increase in t, the decreasing rate in the cases of the LR is similar to that in the cases of the TR, while the decreasing rate in the cases of the CR is the lowest. During the excavation of the following tunnel, the transfer of construction disturbances can be effectively hindered only by the reinforcement of the following tunnel, and the effect of the reinforcement of only the preceding tunnel is less significant. Reinforcement of the soil layer between the two tunnels seems to have a very weak effect in terms of controlling the disturbance.

4.5. Comparison

Table 3 shows the improvement efficiency of different reinforcement strategies in terms of response of the ground surface and the preceding tunnel. The data in the table refer to the decreased rate of the maximum value in the case of t = 0.30 D compared with that in the case of t = 0.00 D. It is clear that the efficiency of the LR and TR are very close, both of which seem to be very effective in reducing the disturbance to the preceding tunnel. However, the reinforcement strategies of the CR and RR are not as effective as expected. To take both engineering safety and cost savings into account, reinforcement of the soil layer around the following tunnel should be an appropriate strategy.

5. Conclusions

In this study, a series of three-dimensional numerical analyses were carried out, to simulate construction of a pair of paralleled twin tunnels in a reinforced soil layer. The influence of the following tunnel excavation on the preceding tunnel when adopting different reinforcement strategies was revealed. On the basis of the numerical results, it is possible to draw the following conclusions:
(1)
The surface settlement profile due to the excavation of the twin tunnels is asymmetric. The reinforcement strategies of the LR and TR can reduce the surface ground settlement and preceding tunnel deformation more effectively than the strategies of the RR or CR. When t = 0.30 D, the LR and TR can reduce the settlement by more than 90%, the maximum horizontal displacement of the preceding tunnel by more than 73%, and the maximum vertical displacement of the preceding tunnel by more than 63%.
(2)
After the completion of the excavation of the following tunnel, with an increase in t, the shape of the preceding tunnel lining gradually changes from a standing “duck egg” to an oblique “duck egg”. Among all strategies, the TR is the most effective at controlling the development of convergence. When t = 0.3 D, this approach can reduce the horizontal convergence by 98.4% and vertical convergence by 56.7% when compared with the case of t = 0.0 D. The LR shows a similar effect, which results in a reduction of 86.5% horizontally and 54% vertically.
(3)
With an increase in t, the bending moments at the tunnel vault and tunnel intrados gradually decrease, while the bending moments at the right and left haunch gradually increase. When t = 0.30 D, the LR and TR can reduce the maximum bending moment at 90° by more than 43%.
(4)
In light of the numerical observations, the reinforcement of the soil layer around the following tunnel (i.e., LR) is an appropriate strategy, considering both engineering safety and cost savings.

Author Contributions

Conceptualization, C.H., K.Z. and D.S.; methodology, B.D., D.L. and Q.S.; data curation, C.H. and B.D.; data analysis, K.Z. and Q.S.; writing—original draft preparation, Q.S.; writing—review and editing, D.S.; supervision, C.H.; project administration, K.Z.; funding acquisition, D.S. and C.H. All authors have read and agreed to the published version of the manuscript.

Funding

This research work was funded by the National Natural Science Foundation of China (Grant No. 52090081), the Natural Science Foundation of Shenzhen (Grant No. JCYJ20210324094607020), Key Research and Development Project of Guangdong Province (Grant No. 2019B111105001), and Scientific Research Project of China Railway 15th Bureau (Grant No. CR15CG-ZH-HQMZSD-2021-00001(KJ)).

Institutional Review Board Statement

Not applicable.

Informed Consent Statement

Not applicable.

Data Availability Statement

All data included in this study are available upon request by contact with the corresponding author.

Conflicts of Interest

No potential conflicts of interest were reported by the authors.

References

  1. Chakeri, H.; Hasanpour, R.; Hindistan, M.A.; Ünver, B. Analysis of interaction between tunnels in soft ground by 3D numerical modeling. Bull. Eng. Geol. Environ. 2011, 70, 439–448. [Google Scholar] [CrossRef]
  2. Chapman, D.N.; Ahn, S.K.; Hunt, D.V. Investigating ground movements caused by the construction of multiple tunnels in soft ground using laboratory model tests. Can. Geotech. J. 2007, 44, 631–643. [Google Scholar] [CrossRef]
  3. Fu, J.Y.; Qing, Z.B.; Yu, Y.Z.; Mei, Z.D. Three-dimensional numerical analysis of the interaction of two crossing tunnels in soft clay. Undergr. Space 2019, 4, 310–327. [Google Scholar]
  4. Do, N.A.; Dias, D.; Oreste, P.; Djeran-Maigre, I. Three-dimensional numerical simulation of a mechanized twin tunnels in soft ground. Tunn. Undergr. Space Technol. 2014, 42, 40–51. [Google Scholar] [CrossRef]
  5. Kim, S.H.; Burd, H.J.; Milligan, G.W.E. Model testing of closely spaced tunnels in clay. Geotechnique 1998, 48, 375–388. [Google Scholar] [CrossRef]
  6. Kumar, P.; Shrivastava, A.K. Physical Investigation of Deformation Behaviour of Single and Twin Tunnel under Static Loading Condition. Appl. Sci. 2021, 11, 11506. [Google Scholar] [CrossRef]
  7. Choi, J.I.; Lee, S.W. Influence of existing tunnel on mechanical behavior of new tunnel. KSCE J. Civ. Eng. 2010, 14, 773–783. [Google Scholar] [CrossRef]
  8. He, C.; Feng, K.; Fang, Y.; Jiang, Y.C. Surface settlement caused by twin-parallel shield tunnelling in sandy cobble strata. J. Zhejiang Univ. SCIENCE A 2012, 13, 858–869. [Google Scholar] [CrossRef]
  9. Ng, C.W.W.; Lu, H.; Peng, S.Y. Three-dimensional centrifuge modelling of the effects of twin tunnelling on an existing pile. Tunn. Undergr. Space Technol. 2013, 35, 189–199. [Google Scholar] [CrossRef]
  10. Suwansawat, S.; Einstein, H.H. Describing settlement troughs over twin tunnels using a superposition technique. J. Geotech. Geoenvironmental Eng. 2007, 133, 445–468. [Google Scholar] [CrossRef]
  11. Chen, R.P.; Zhu, J.; Liu, W.; Tang, X.W. Ground movement induced by parallel EPB tunnels in silty soils. Tunn. Undergr. Space Technol. 2011, 26, 163–171. [Google Scholar] [CrossRef]
  12. Li, S.; Feng, X.; Li, Z.; Chen, B.; Jiang, Q.; Wu, S.; Xu, J. In situ experiments on width and evolution characteristics of excavation damaged zone in deeply buried tunnels. Sci. China Technol. Sci. 2011, 54, 167–174. [Google Scholar] [CrossRef]
  13. Zheng, H.; Li, P.; Ma, G.; Zhang, Q. Experimental investigation of mechanical characteristics for linings of twins tunnels with asymmetric cross-section. Tunn. Undergr. Space Technol. 2022, 119, 104209. [Google Scholar] [CrossRef]
  14. Ocak, I. Interaction of longitudinal surface settlements for twin tunnels in shallow and soft soils: The case of Istanbul Metro. Environ. Earth Sci. 2013, 69, 1673–1683. [Google Scholar] [CrossRef]
  15. Klar, A.; Vorster, T.E.B.; Soga, K.; Mair, R.J. Soil—Pipe interaction due to tunnelling: Comparison between Winkler and elastic continuum solutions. Géotechnique 2005, 55, 461–466. [Google Scholar] [CrossRef]
  16. Wang, Y.; Wang, Q.; Zhang, K.Y. An analytical model for pipe-soil-tunneling interaction. Procedia Eng. 2011, 14, 3127–3135. [Google Scholar] [CrossRef] [Green Version]
  17. Liang, R.; Xia, T.; Hong, Y.; Yu, F. Effects of above-crossing tunnelling on the existing shield tunnels. Tunn. Undergr. Space Technol. 2016, 58, 159–176. [Google Scholar] [CrossRef]
  18. Liang, R.; Xia, T.; Huang, M.; Lin, C. Simplified analytical method for evaluating the effects of adjacent excavation on shield tunnel considering the shearing effect. Comput. Geotech. 2017, 81, 167–187. [Google Scholar] [CrossRef]
  19. Yamaguchi, I.; Yamazaki, I.; Kiritani, Y. Study of ground-tunnel interactions of four shield tunnels driven in close proximity, in relation to design and construction of parallel shield tunnels. Tunn. Undergr. Space Technol. 1998, 13, 289–304. [Google Scholar] [CrossRef]
  20. Hefny, A.M.; Chua, H.C.; Zhao, J. Parametric studies on the interaction between existing and new bored tunnels. Tunn. Undergr. Space Technol. 2004, 19, 471. [Google Scholar]
  21. Chehade, F.H.; Shahrour, I. Numerical analysis of the interaction between twin-tunnels: Influence of the relative position and construction procedure. Tunn. Undergr. Space Technol. 2008, 23, 210–214. [Google Scholar] [CrossRef]
  22. Do, N.A.; Dias, D.; Oreste, P.; Djeran-Maigre, I. Three-dimensional numerical simulation for mechanized tunnelling in soft ground: The influence of the joint pattern. Acta Geotech. 2014, 9, 673–694. [Google Scholar] [CrossRef]
  23. Zhao, X.; Wang, H.; Li, Z.; Dai, G.; Yin, Z.; Cao, S.; Zhou, J. Numerical Study on the Deformation of Tunnels by Excavation of Foundation Pit Adjacent to the Subway. Appl. Sci. 2022, 12, 4752. [Google Scholar] [CrossRef]
  24. Tyagi, A.; Lee, F.H. Influence of tunnel failure on the existing large-diameter tunnel in improved soil surround. Tunn. Undergr. Space Technol. 2022, 120, 104276. [Google Scholar] [CrossRef]
  25. Contini, A.; Cividini, A.; Gioda, G. Numerical evaluation of the surface displacements due to soil grouting and to tunnel excavation. Int. J. Geomech. 2007, 7, 217–226. [Google Scholar] [CrossRef]
  26. Tyagi, A.; Zulkefli, M.F.B.; Pan, Y.; Goh, S.H.; Lee, F.H. Failure modes of tunnels with improved soil surrounds. J. Geotech. Geoenvironmental Eng. 2017, 143, 04017088. [Google Scholar] [CrossRef]
  27. Tyagi, A.; Liu, Y.; Pan, Y.T.; Ridhwan, K.B.M.; Lee, F.H. Stability of tunnels in cement-admixed soft soils with spatial variability. J. Geotech. Geoenvironmental Eng. 2018, 144, 06018012. [Google Scholar] [CrossRef]
  28. Tyagi, A.; Liu, Y.; Pan, Y.T.; Lee, F.H. Equivalent strength for tunnels in cement-admixed soil columns with spatial variability and positioning error. J. Geotech. Geoenvironmental Eng. 2020, 146, 04020101. [Google Scholar] [CrossRef]
  29. Nawel, B.; Salah, M. Numerical modeling of two parallel tunnels interaction using three-dimensional finite elements method. Geomech. Eng. 2015, 9, 775–791. [Google Scholar] [CrossRef]
  30. Ng, C.W.W.; Wang, R.; Boonyarak, T. A comparative study of the different responses of circular and horseshoe-shaped tunnels to an advancing tunnel underneath. Géotechnique Lett. 2016, 6, 168–175. [Google Scholar] [CrossRef]
  31. Liu, X.; Suliman, L.; Zhou, X.; Abd Elmageed, A. Parallel tunnel settlement characteristics: A theoretical calculation approach and adaptation analysis. Geomech. Eng. 2022, 28, 225–237. [Google Scholar]
  32. Yang, J.; Gu, X.Q. Shear stiffness of granular material at small strains: Does it depend on grain size? Géotechnique 2013, 63, 165–179. [Google Scholar] [CrossRef] [Green Version]
  33. Bolton, M.D. The strength and dilatancy of sands. Geotechnique 1986, 36, 65–78. [Google Scholar] [CrossRef]
  34. Gu, X.; Hu, J.; Huang, M.S. K0 of granular soils: A particulate approach. Granul. Matter 2015, 17, 703–715. [Google Scholar] [CrossRef]
  35. Fu, Y.; He, S.; Zhang, S.; Yang, Y. Parameter analysis on hardening soil model of soft soil for foundation pits based on shear rates in Shenzhen Bay, China. Adv. Mater. Sci. Eng. 2020, 2020, 703–715. [Google Scholar] [CrossRef] [Green Version]
  36. Mollon, G.; Dias, D.; Soubra, A.H. Probabilistic analyses of tunneling-induced ground movements. Acta Geotech. 2013, 8, 181–199. [Google Scholar] [CrossRef] [Green Version]
  37. Zhou, Z.; Ding, H.; Miao, L.; Gong, C. Predictive model for the surface settlement caused by the excavation of twin tunnels. Tunn. Undergr. Space Technol. 2021, 114, 104014. [Google Scholar] [CrossRef]
  38. Hasanpour, R.; Chakeri, H.; Ozcelik, Y.; Denek, H. Evaluation of surface settlements in the Istanbul metro in terms of analytical, numerical and direct measurements. Bull. Eng. Geol. Environ. 2012, 71, 499–510. [Google Scholar] [CrossRef]
  39. Lambrughi, A.; Rodríguez, L.M.; Castellanza, R. Development and validation of a 3D numerical model for TBM–EPB mechanised excavations. Comput. Geotech. 2012, 40, 97–113. [Google Scholar] [CrossRef]
  40. Arnau, O.; Molins, C. Three dimensional structural response of segmental tunnel linings. Eng. Struct. 2012, 44, 210–221. [Google Scholar] [CrossRef] [Green Version]
  41. Klappers, C.; Grübl, F.; Ostermeier, B. Structural analyses of segmental lining-coupled beam and spring analyses versus 3D-FEM calculations with shell elements. Tunn. Undergr. Space Technol. 2006, 21, 254–255. [Google Scholar] [CrossRef]
  42. Zheng, G.; Zhang, T.; Diao, Y. Mechanism and countermeasures of preceding tunnel distortion induced by succeeding EPBS tunnelling in close proximity. Comput. Geotech. 2015, 66, 53–65. [Google Scholar] [CrossRef]
  43. Do, N.A.; Dias, D.; Oreste, P. 3D numerical investigation of mechanized twin tunnels in soft ground–Influence of lagging distance between two tunnel faces. Eng. Struct. 2016, 109, 117–125. [Google Scholar] [CrossRef]
Figure 1. Location of the Mangzhou Tunnel project in Zhuhai, China.
Applsci 12 10335 g001
Figure 2. Sketch of reinforcement strategies for paralleled twin tunnels: (a) RR; (b) LR; (c) TR; (d) CR.
Applsci 12 10335 g002aApplsci 12 10335 g002b
Figure 3. Finite element model for construction simulation of paralleled twin tunnels.
Applsci 12 10335 g003
Figure 4. Comparison between numerical and analytical results [37].
Applsci 12 10335 g004
Figure 5. Settlement of ground surface at the transverse monitoring section: (a) RR; (b) LR; (c) TR; (d) CR.
Applsci 12 10335 g005
Figure 6. Variation of the maximum surface settlement with t.
Applsci 12 10335 g006
Figure 7. The maximum displacement of the preceding tunnel: (a) horizontal displacement; (b) vertical displacement.
Applsci 12 10335 g007
Figure 8. The shape of the preceding tunnel: (a) RR; (b) LR; (c) TR; (d) CR.
Applsci 12 10335 g008
Figure 9. Variation of the maximum convergence of the preceding tunnel with t: (a) horizontal direction; (b) vertical direction.
Applsci 12 10335 g009
Figure 10. Axial force of the lining of preceding tunnel under different cases: (a) RR; (b) LR; (c) TR; (d) CR.
Applsci 12 10335 g010
Figure 11. Bending moment of the lining of preceding tunnel: (a) RR; (b) LR; (c) TR; (d) CR.
Applsci 12 10335 g011
Figure 12. Variation of the maximum axial force and the bending moment at 90° of the preceding tunnel lining with t: (a) axial force; (b) bending moment.
Applsci 12 10335 g012
Table 1. Main parameters of the HSS model.
ParameterValueMethodParameterValueMethod
Soft SoilImproved SoilSoft SoilImproved Soil
c’ (kPa)13.1350Triaxial consolidated and drained testG0ref (MPa)40.1350G0ref = (1.5~2.5)Eurref [32]
φ’ (°)13.343Triaxial consolidated and drained testPref (kPa)100100Plaxis manual
Ψ (°)0.10.1Ψ = 0 when φ’ < 30° [33]νur0.20.2Plaxis manual
K00.770.318K0 = 1 − sin φ’ [34]Eurref (MPa)16.03200Eurref = (3~8)Eoedref [35]
Rf0.90.9Plaxis manualm0.80.1Plaxis manual
E50ref (MPa)2.2930E50ref = (0.7~1.0) Es1–2 [35]γ0.71 × 10−44 × 10−4γ0.7 = (1~4) × 10−4 [32]
Eoedref (MPa)1.9127Eoedref = 0.9Es1–2 [35]
(Note: c’: effective cohesion; φ’: effective friction angle; Ψ: dilation angle; K0: lateral pressure coefficient; Rf: failure ratio; E50ref: secant stiffness in standard drained triaxial test; Eoedref: tangent stiffness for primary oedometer loading; G0ref: reference shear modulus at very small strains (ε < 10−6); Pref: reference stiffness stress; νur: Poisson’s ratio for unloading-reloading; Eurref: unloading/reloading stiffness from drained triaxial test; m: power for stress-level dependency of stiffness; γ0.7: shear strain corresponding to an initial shear modulus of 70%).
Table 2. The maximum value of horizontal and vertical displacements (in mm).
Reinforcement Strategyt/D = 0.00t/D = 0.05t/D = 0.10t/D = 0.15t/D = 0.20t/D = 0.30Decrease Rate (%) (2)
RR27.25/17.96 (1)21.09/13.2117.11/10.0215.25/8.8714.62/8.0613.99/7.6848.7/57.2
LR27.25/17.9618.75/12.9113.22/9.2210.15/7.768.26/7.217.32/6.6573.1/63.0
TR27.25/17.9617.56/12.5612.87/9.0110.21/7.518.14/7.147.21/6.5173.5/63.8
CR27.25/17.9620.06/15.6316.25/13.5313.12/12.3811.09/11.678.02/11.2370.6/37.5
Note: (1) The maximum horizontal displacement/the maximum vertical displacement; (2) decrease rate = (Value t=0.00D − Value t=0.30D)/Value t=0.00D.
Table 3. Comparison of improvement efficiency.
Reinforcement StrategySurface
Settlement
Tunnel DisplacementLining ConvergenceAxial ForceBending Moment
at 90°
HorizontalVerticalHorizontalVertical
RR24.6%48.7%57.2%86.5%54%5.6%33.8%
LR90.2%73.1%63.0%98.4%56.7%27.4%43.4%
TR90.6%73.5%63.8%98.6%57.3%27.7%44.5%
CR18.2%70.6%37.5%21.4%26.3%3.0%3.0%
Publisher’s Note: MDPI stays neutral with regard to jurisdictional claims in published maps and institutional affiliations.

