Article

Bond Strength Properties of GFRP and CFRP according to Concrete Strength

1
Department of Architectural Engineering, Mokwon University, 88 Doanbukro, Daejeon 35349, Korea
2
Research Center, Korea Concrete Institute, Seoul 06130, Korea
*
Author to whom correspondence should be addressed.
Appl. Sci. 2022, 12(20), 10611; https://doi.org/10.3390/app122010611
Submission received: 17 September 2022 / Revised: 9 October 2022 / Accepted: 10 October 2022 / Published: 20 October 2022
(This article belongs to the Special Issue Multi-Performance Analysis of Concrete from Life Cycle Perspective)

Abstract

:
Reinforced concrete is the most commonly used material in the construction industry. However, one disadvantage of reinforced concrete is that environmental factors cause materials to penetrate the concrete and cause steel bar corrosion. Rebar corrosion increases its volume significantly by approximately 3–6 times, which lowers concrete–rebar adhesion. This severely affects the serviceability and durability of concrete structures. The economic and social impacts of such deterioration are extremely large. To reduce corrosion, glass fiber-reinforced plastics (GFRP) and carbon fiber-reinforced plastics (CFRP) can be applied to concrete. The rebar–concrete bond strength is an important factor to be considered while applying GFRP and CFRP. Thus, we experimentally investigated the adhesion strength of GFRP and CFRP in relation to the strength of concrete and water–cement ratio according to ASTM C 234 to correlate the data for the development of GFRP and CFRP as substitutes for deformed reinforcing bars. The results showed that a lower water–cement ratio yielded higher compressive strength and bond strength; the bond strength of GFRP was approximately 23% lower than that of CFRP. The coating of the rebar surface required for GFRP and CFRP application in reinforced concrete structures ought to be investigated in the future.

1. Introduction

Reinforced concrete is the most commonly used construction material because the coefficient of thermal expansion values of the rebar and concrete are similar, and because the high tensile strength of rebar complements the limitations of concrete [1]. In Korea, the number of reinforced structures has increased since the 1980s due to rapid urbanization. The demand for coarse aggregate and fine aggregate has also increased, and the country faced a shortage of river gravel and river sand supply. Therefore, rubble and washed sea sand were substituted for coarse and fine aggregate. However, the salt content of sea sand accelerates the corrosion of rebar.
Simultaneously, concrete inhibits corrosion in reinforced structures through its strong alkaline properties; however, cracks on its surface caused by drying, shrinkage, and other factors are inevitable. Various deterioration factors permeate the concrete through these cracks and accelerate rebar corrosion [2,3]. Rebar corrosion causes the structure’s load carrying capacity to diminish. Corrosion damages the rebar’s rib, lowers bond strength, and eventually shortens its service life [4]. The bond strength reduction is affected by the strength of concrete, surface conditions of rebar, fiber reinforcement, cracks in concrete and anchorage length, cover thickness, and stress conditions around the concrete. The uncertainty caused by these factors increases the maintenance costs when addressing corrosion damage, which inhibits economic and social prospects [5]. To solve these problems, previous studies have suggested methods such as epoxy coating the surface of deformed reinforcing bars and increasing the concrete coating thickness [6]. However, difficulties have occurred during construction because of the cracking of the epoxy coating on the rebar’s surface. Further, the increase in cover thickness leads to a heavier load. Subsequently, fiber-reinforced plastics (FRP) were developed to solve this problem [6]. FRP is a fiber-reinforced material used for specialized structures in many industries, such as the aerospace industry since the 1960s. It became a commonly used material in the construction industry in the 1990s. In the construction industry, short fibers are mixed in the concrete, whereas long fibers wrap the outside of the structure to reinforce it.
FRP benefits from the fiber’s high tensile strength and possesses noncorrosive and nonconductive properties [7]. Because of its high corrosion resistance, FRP is used as a replacement for rebar in structures that will potentially be exposed to salt damage. It is also a lightweight material, exhibiting one fourth the weight of steel, which effectively reduces the weight of the structure. This allows FRP to create a lightweight structure that possesses a high strength. However, FRP possesses engineering disadvantages such as low modulus of elasticity and brittle fracture. Furthermore, there is a limit on the increase of the diameter of reinforcing bars [8].
Glass fiber-reinforced plastics (GFRP) and carbon-reinforced plastics (CFRP) were developed to solve the problems of FRP; they have several independent benefits. First, GFRP is inexpensive; however, it is made of glass fiber and contains thorn-shaped protrusions on the surface [9], which pose a risk when used on site. Moreover, since GFRP has a small elastic modulus—approximately 0.2 times that of that of rebar—there is a possibility that a relatively large deflection may occur compared to a rebar with the same reinforcing ratio [10]. CFRP possesses a higher modulus of elasticity and tensile strength than GFRP. It is also lightweight and makes construction convenient. Moreover, CFRP exhibits a high corrosion resistance and economic feasibility due to advanced technology and increased demand [11,12].
Bond strength is a crucial factor for the bearing strength of reinforced concrete structures. When bond strength is reduced, it affects the monolithic behavior of rebar and concrete, resulting in a decline in structural capacity [13]. Similar to the process of verifying the bond strength of deformed bar and FRP, the examination of bond strength between reinforcing bar and concrete is required in the case of GFRP and CFRP before they are used in a reinforced concrete structure. The application of GFRP and CFRP is severely limited because the current structural design standards cannot be adopted for GFRP and CFRP owing to the difference in the mechanical behaviors such as tensile, compression, and adhesion performance from existing deformed rebars [14]. In this study, a bond strength experiment was conducted based on ASTM C 234, which was used in a previous study, to examine the bond strength of GFRP and CFRP. The water–cement ratio was set at 40%, 50%, and 60%; GFRP and CFRP rebars with a diameter of 13 mm were used to test the concrete strength.

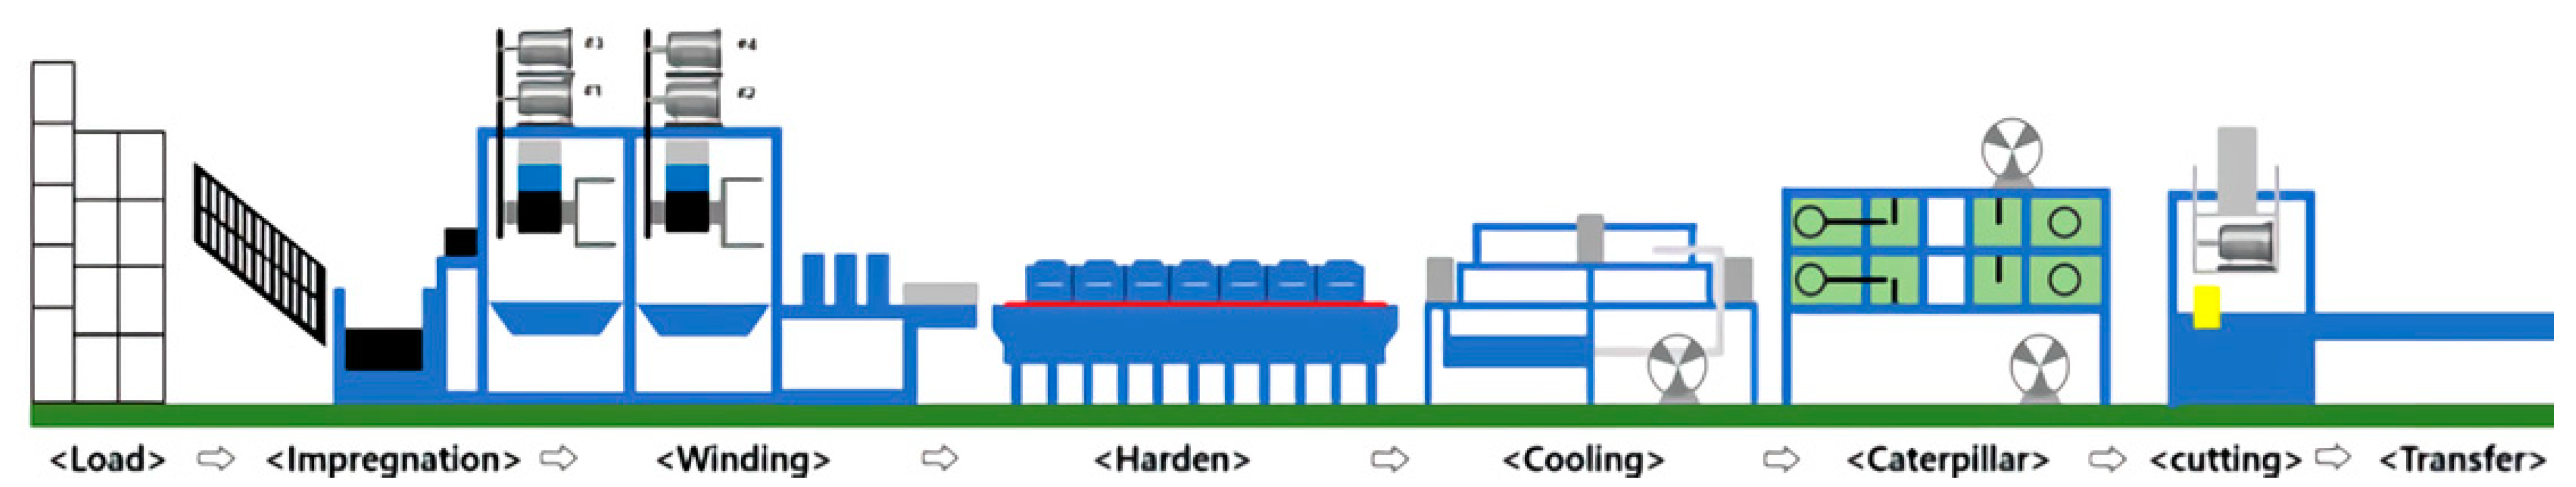
2. Manufacturing Process of GFRP and CFRP

The GFRP and CFRP used in this experiment were produced through the pultrusion process as shown in Figure 1. The pultrusion process is designed to form various types of fibers similar to the shape of rebar in the rebar production process.
The first step is unwinding the loaded yarn and impregnating it on the hardening body. The impregnated yarn is molded into a bar shape, and winding is carried out by constantly snaking a rib wire that forms a knot shape on the bar. The yarn with ribs is hardened to the inside, cooled in water and air, undergoes the caterpillar process, and cut at certain lengths in the production process. This process makes stronger products than those produced by the method of simply twisting and bonding fibers.

3. Experimental Procedure
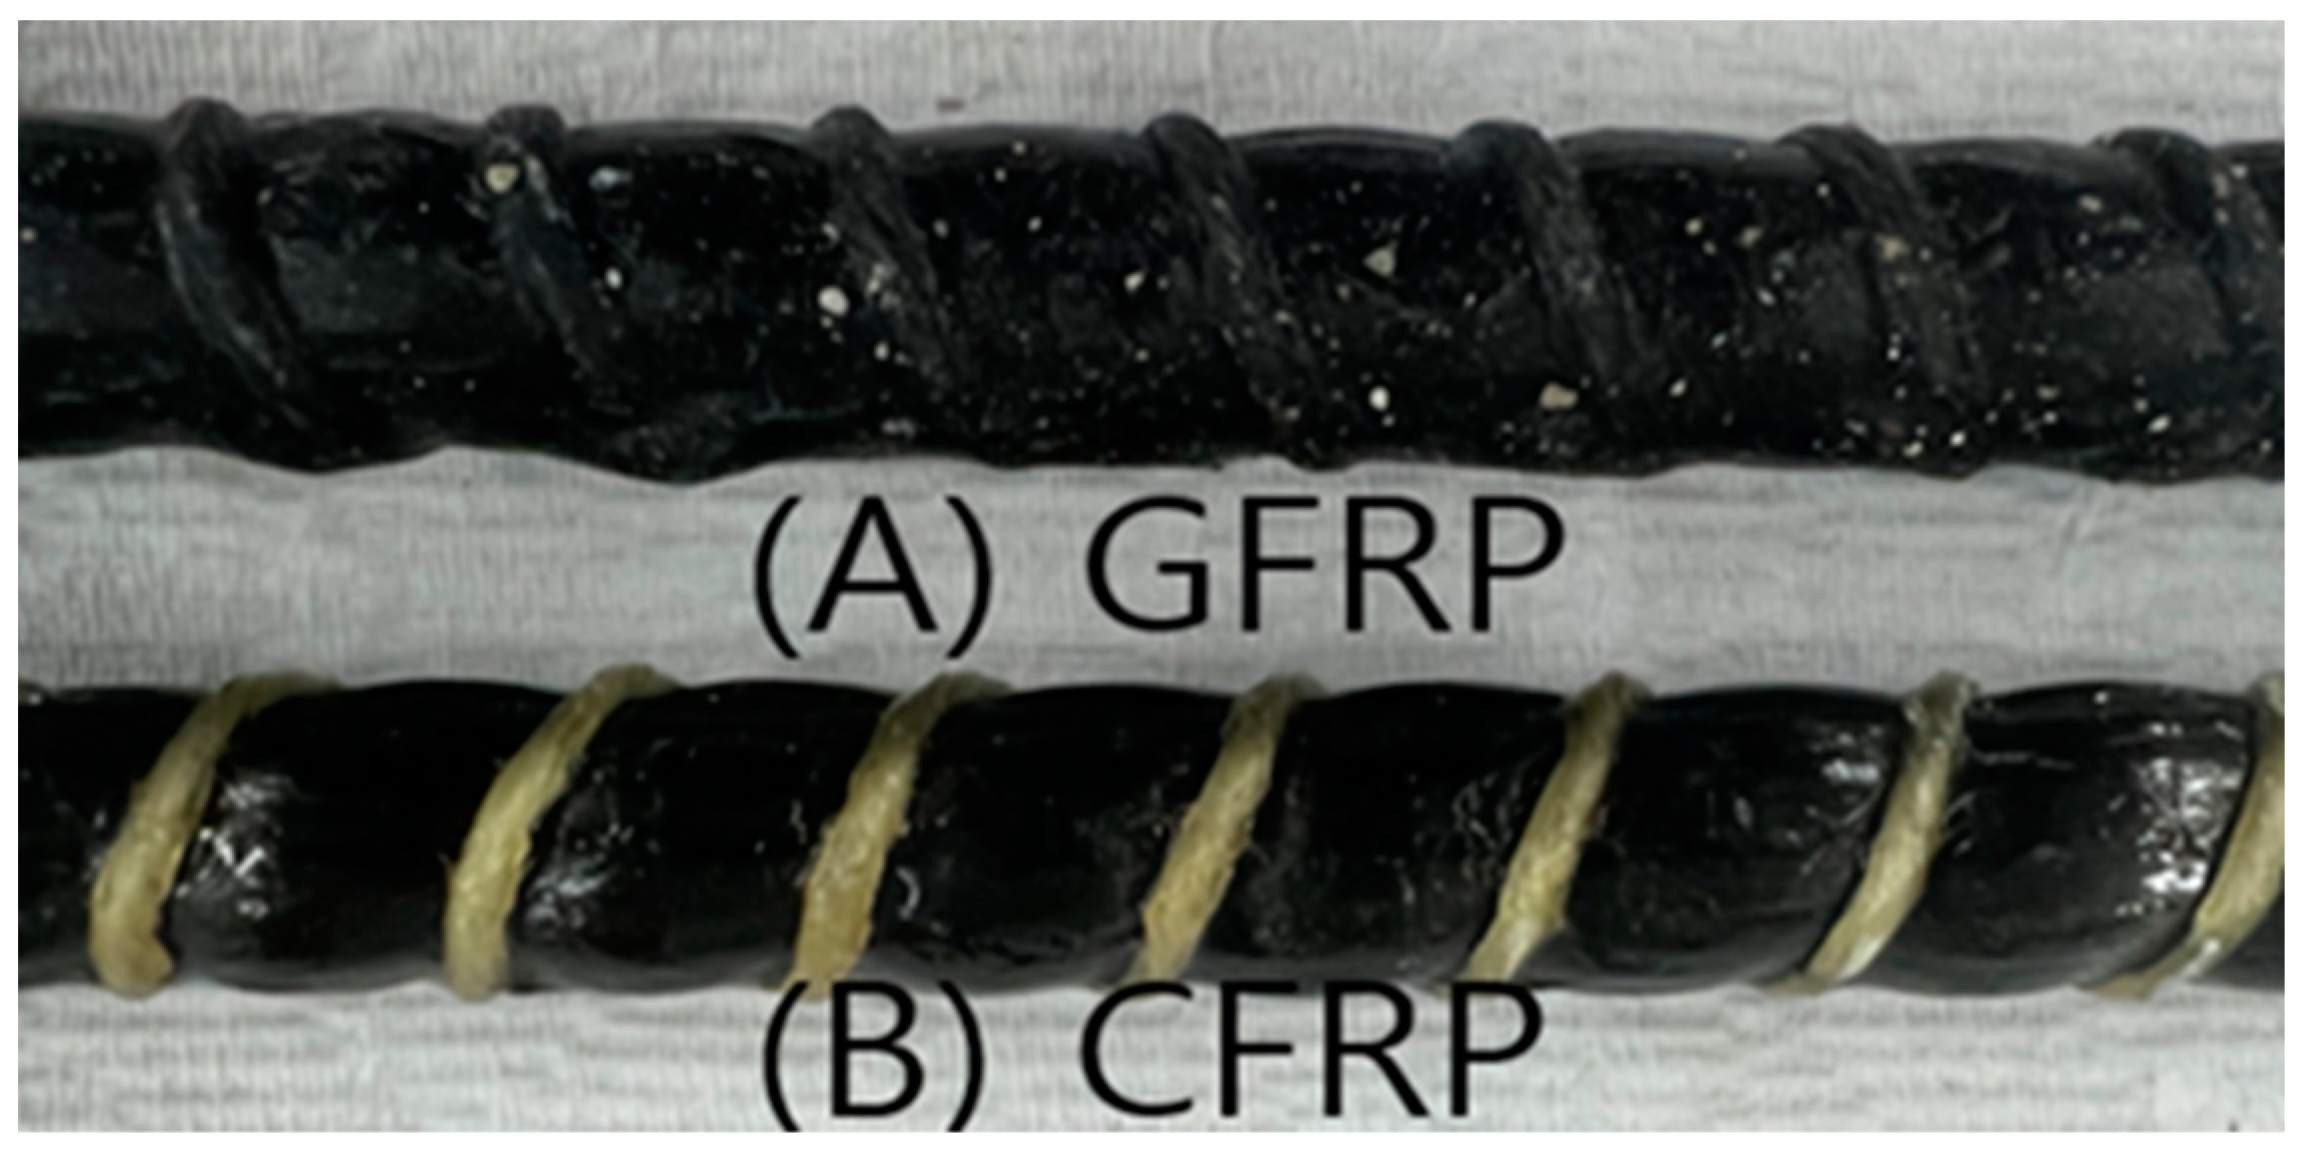
The experiment plan is shown in Table 1. The water–cement ratio was set at 40%, 50%, and 60% to compare and analyze the bond strength of the GFRP and CFRP according to the level of concrete strength. Figure 2 shows the test specimens that were made to check the bond strength of the GFRP and CFRP. For each specimen, form removal was performed 1 day after setting, and water curing was performed at 20 ± 2 °C for 28 days.

3.1. Materials

The GFRP and CFRP used in this experiment were developed as shown in Figure 3 by N company. Their physical properties are listed in Table 2 and Table 3. The cement used was Type 1 Ordinary Portland Cement manufactured by H company, and its physical properties are shown in Table 4. The fine aggregate used was river sand, procured from E company, and the physical properties are shown in Table 5. The coarse aggregate used was crushed stones, and its physical properties are shown in Table 6.

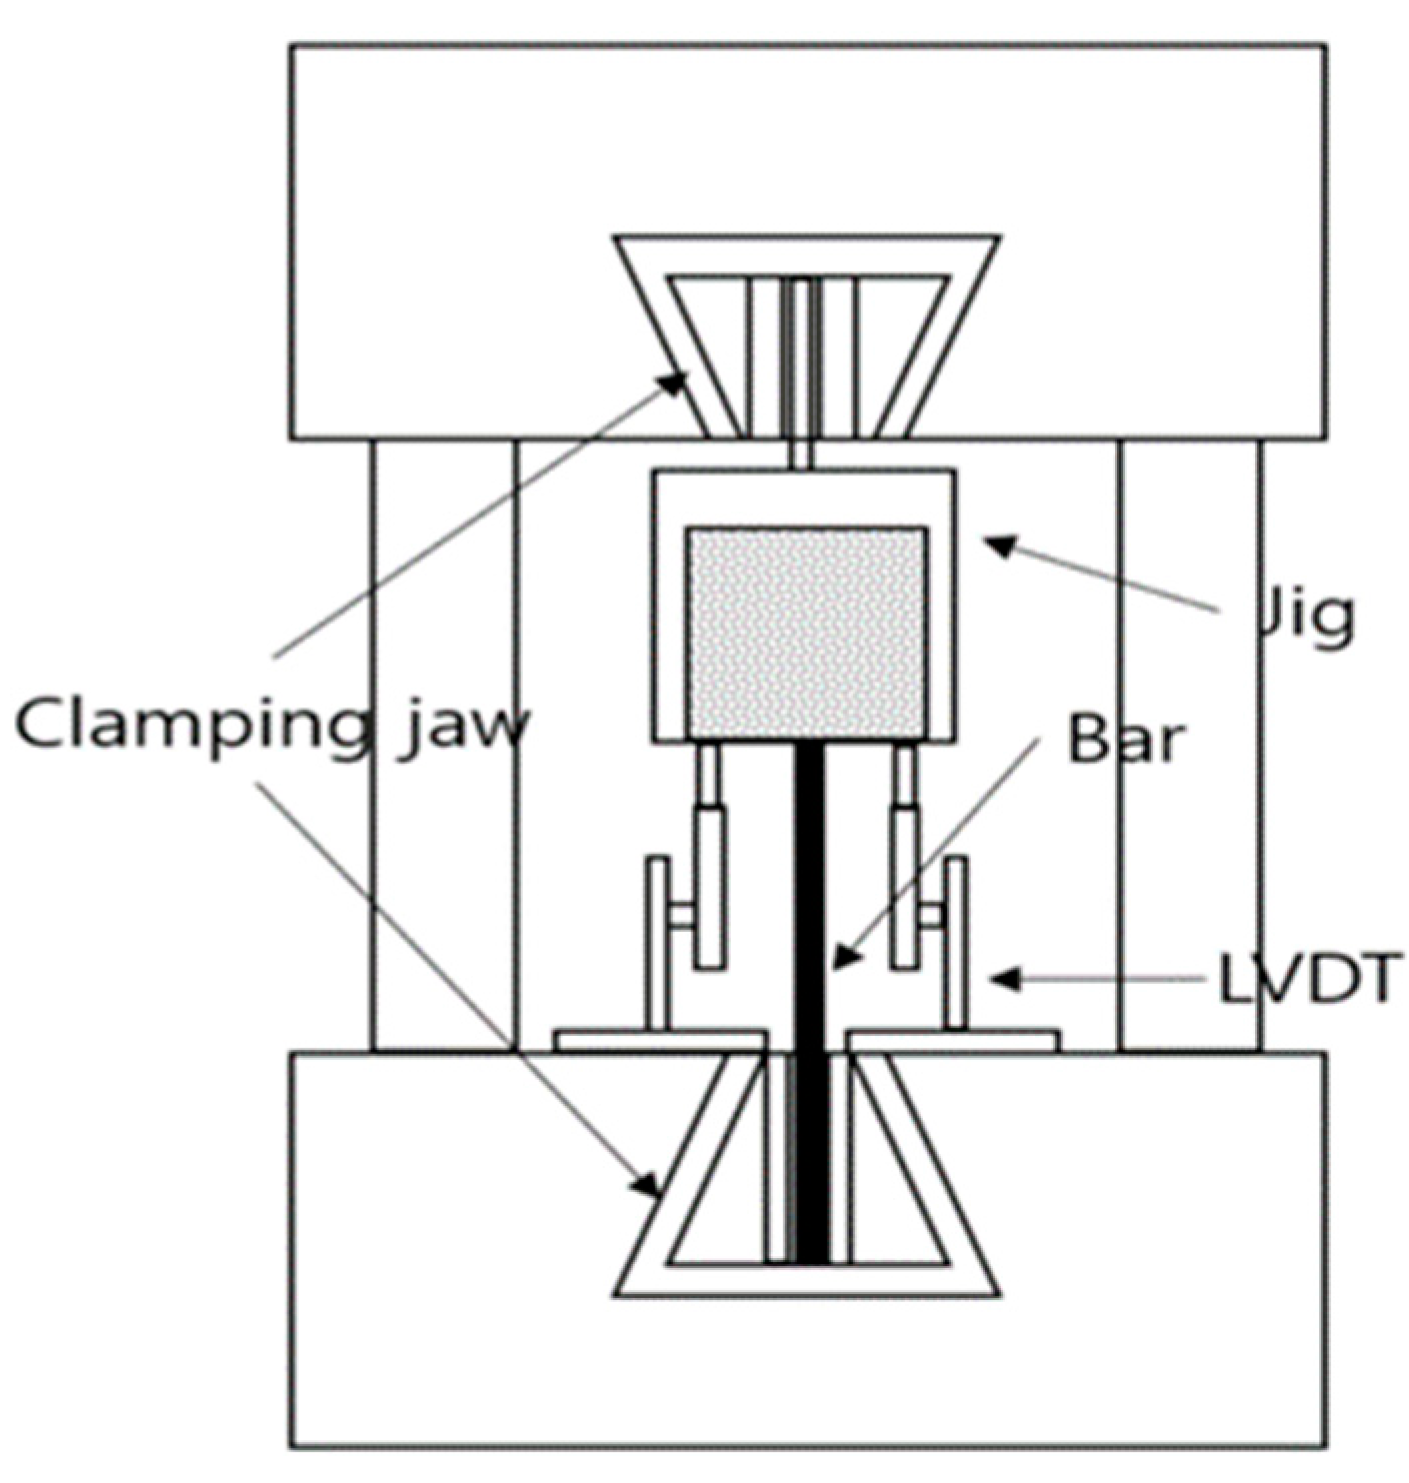
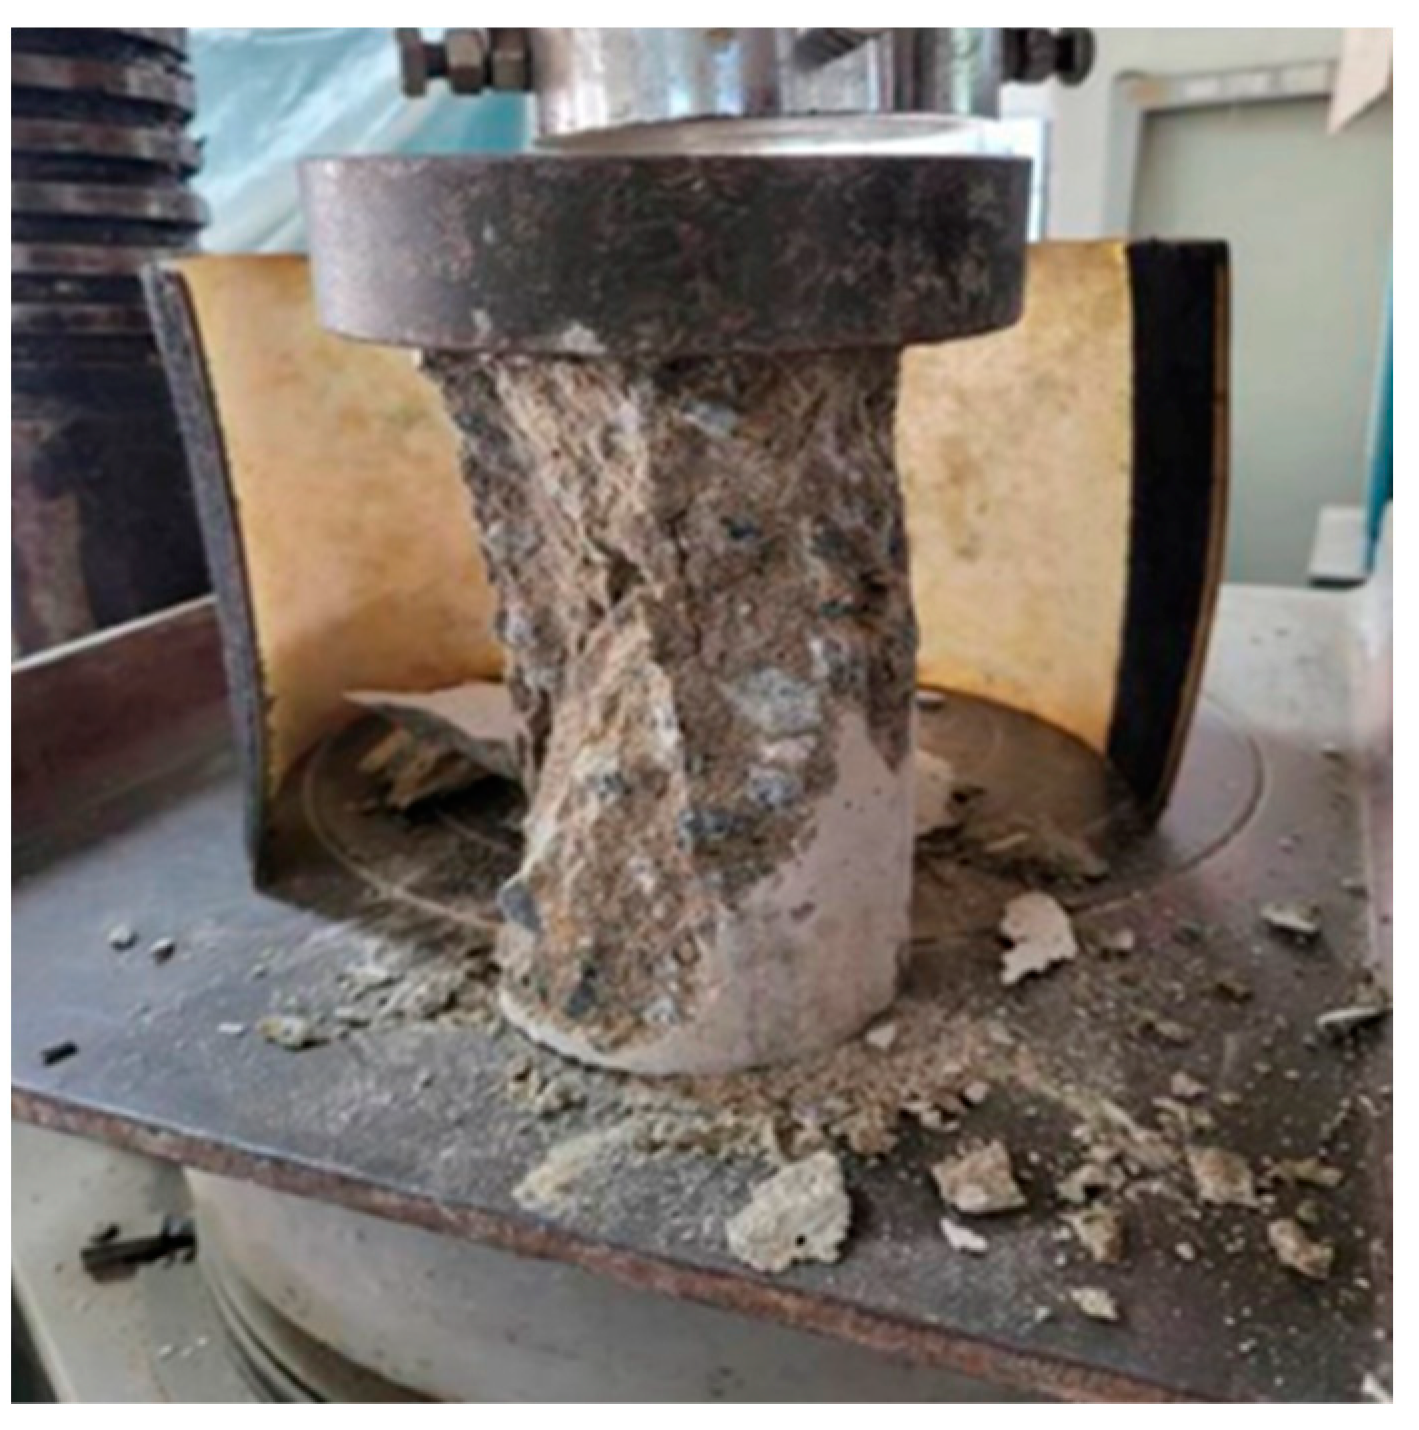
3.2. Experimental Test Methods

The mix formulation used in this experiment is shown in Table 7. A twin-shaft mixer was used for concrete tempering, and fluidity was secured by using superplasticizing admixture (SP) water reducing agent for smooth concrete application. Three compressive strength test specimens were made for each water–cement ratio using a cylindrical mold of 100 mm × 200 mm based on KS F 2405, and the mean of the three specimens was used. Bond strength test specimens were made using a cube mold with an inner diameter of 150 mm × 150 mm × 150 mm, as shown in Figure 4, based on ASTM C 234 [15]. To form a non-adhesive surface in the bond strength experiment, PE foam was used in areas except for four times the diameter of the buried length (4d). Three specimens were made for each water–cement ratio, and the mean of the three specimens was used.
The bond strength experiment was conducted as shown in Figure 5. After the bond strength test specimens were placed horizontally on the jig, linear variable differential transformers (LVDT) were installed at the bottom of both sides to check the slip between the concrete and rebar according to the load. Moreover, to prevent the rebar from splitting during the experiment, a sufficient length of action was secured in the clamping jaw. The bond strength experiment was conducted at a strain rate of 0.001 mm/s using the universal test machine (UTM) with a maximum load of 300 ton.

4. Results and Discussion

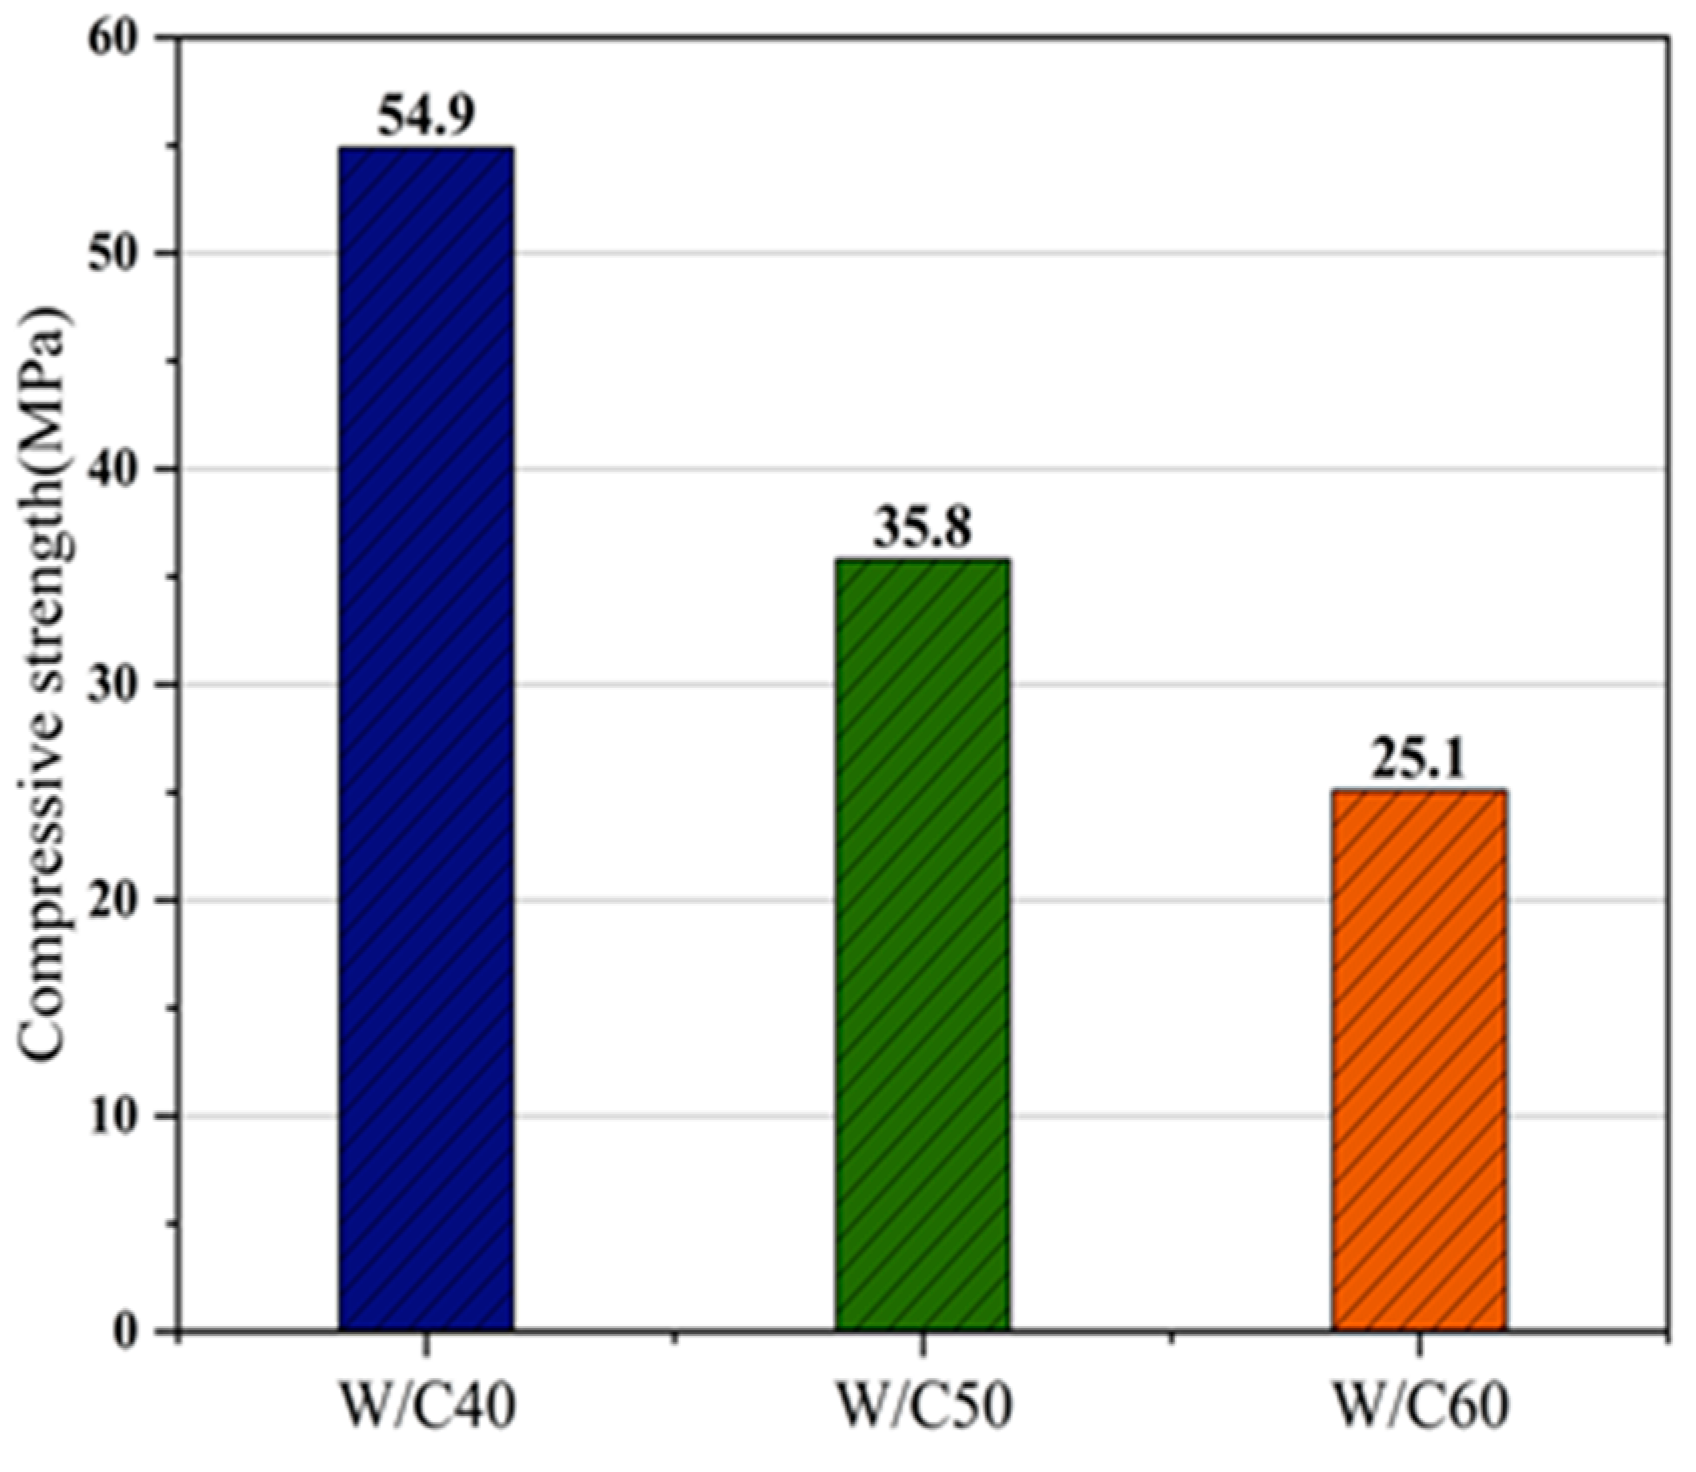
4.1. Compressive Strength
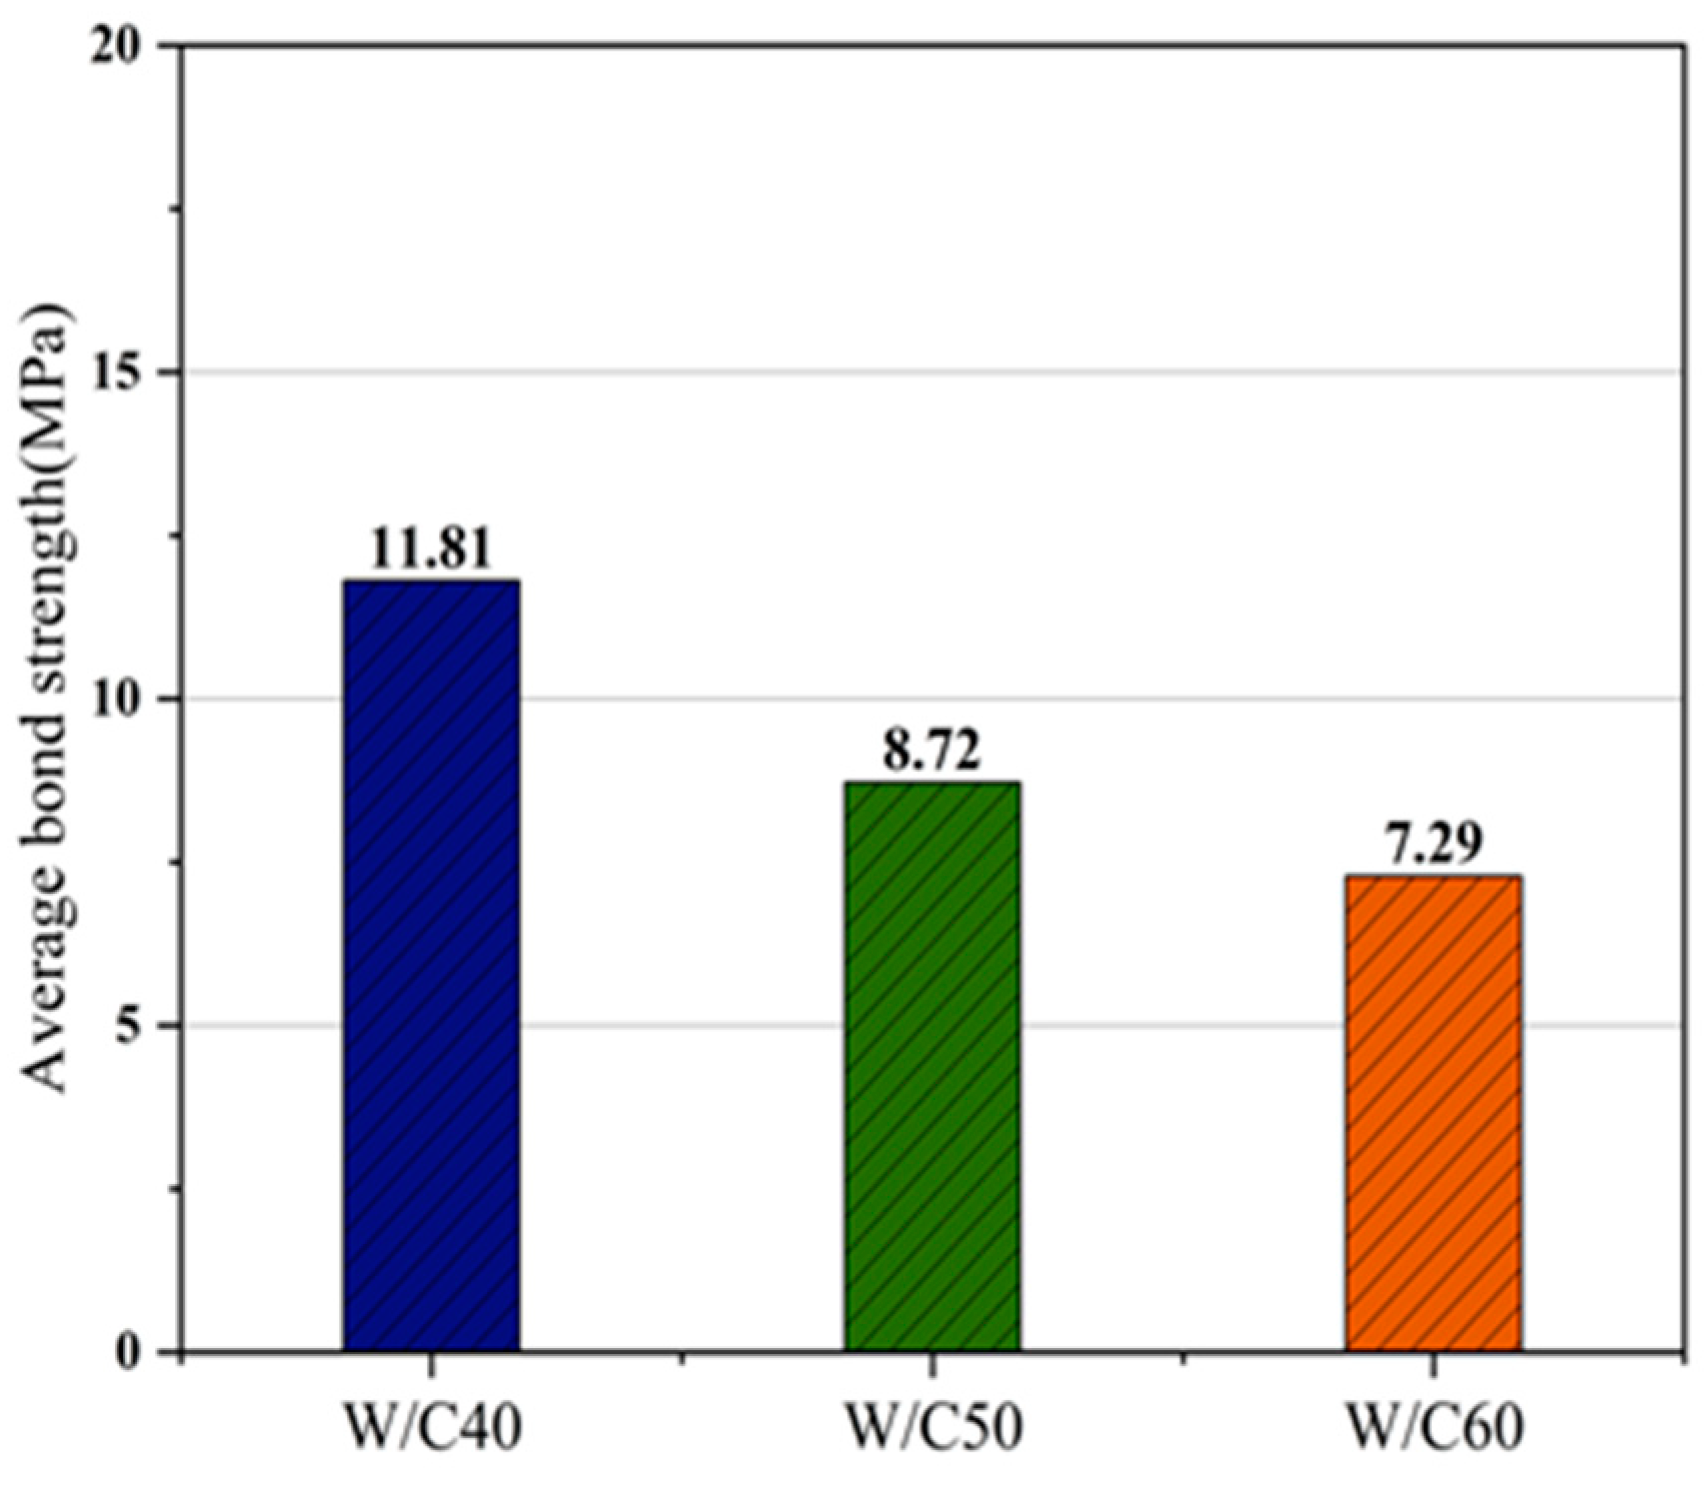
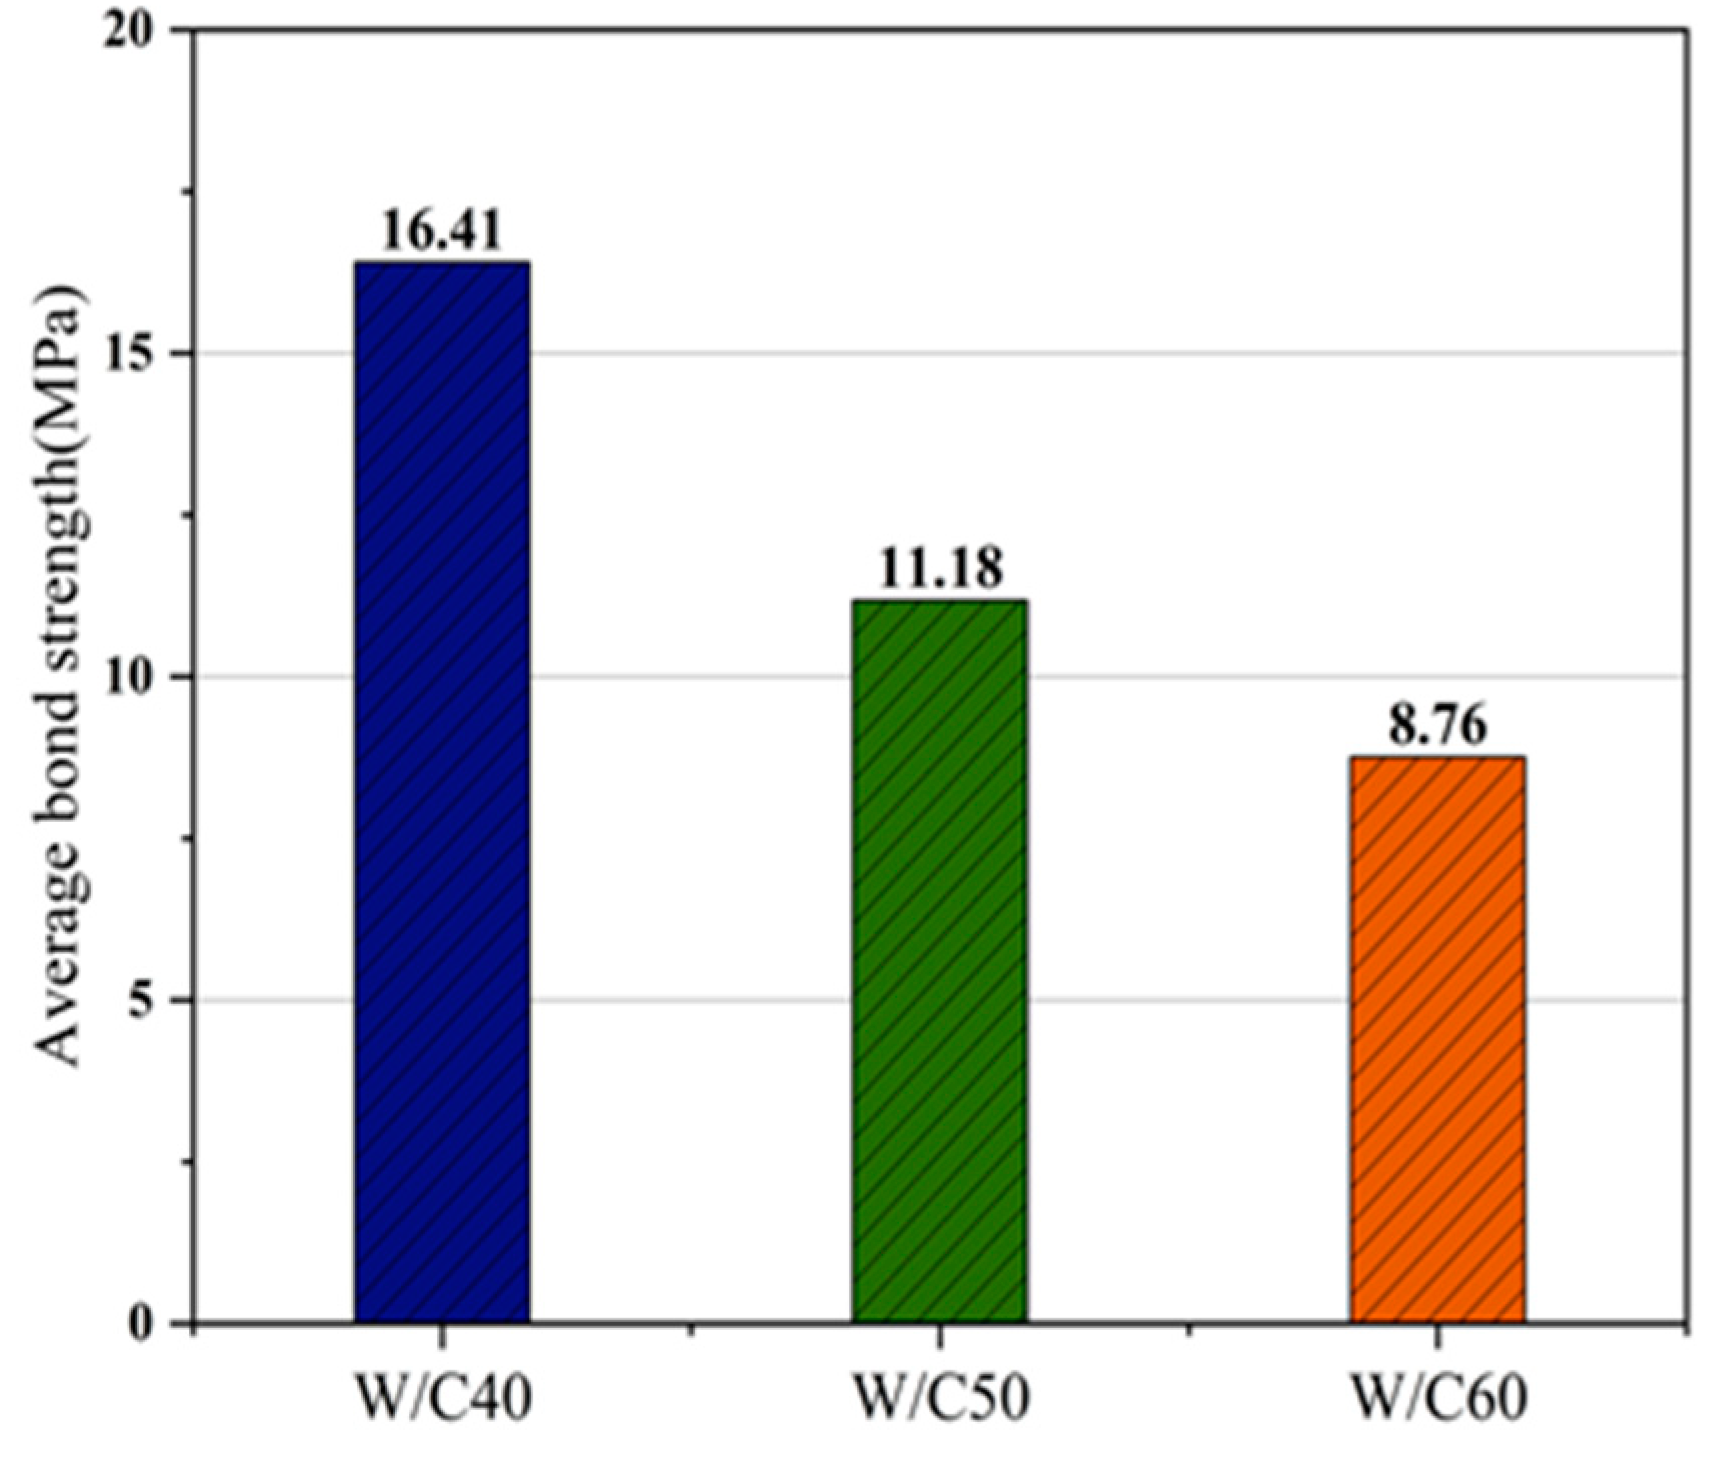
The results of the compressive strength of the concrete at 28 days are shown in Figure 6, and the fracture shape during measurement is shown in Figure 7. The compressive strength was 54.9, 35.8, and 25.1 MPa for water–cement ratios of 40%, 50%, and 60%, respectively.

4.2. Bond Strength

Average bond strength was calculated using Equation (1). In Equation (1), u   is the average bond stress, p   is the maximum load applied to the test specimen, d b   is the diameter of the rebar, and l d is the embedded length of the rebar (4 d b ).
u = p π d b l d
The bond strength results of the test specimens at 28 days are shown in Figure 8 and Figure 9. The GFRP bond strength was 11.81, 8.72, and 7.29 MPa for water–cement ratios of 40%, 50%, and 60%, respectively. The CFRP bond strength was 16.41 MPa with the 40% water–cement ratio, 11.18 MPa with 50%, and 8.76 MPa with 60%. The GFRP and CFRP showed higher bond strength in lower water–cement ratios. This suggests that a lower water–cement ratio generates more hydrate between the concrete and rebar, which increases the strength of the surface between the rebar and concrete, thereby showing high bond strength. These test results show that the attachment strength tended to increase with a decreasing water–cement ratio, which is consistent with the trend observed for deformed rebar attachment strength in previous studies [16,17].

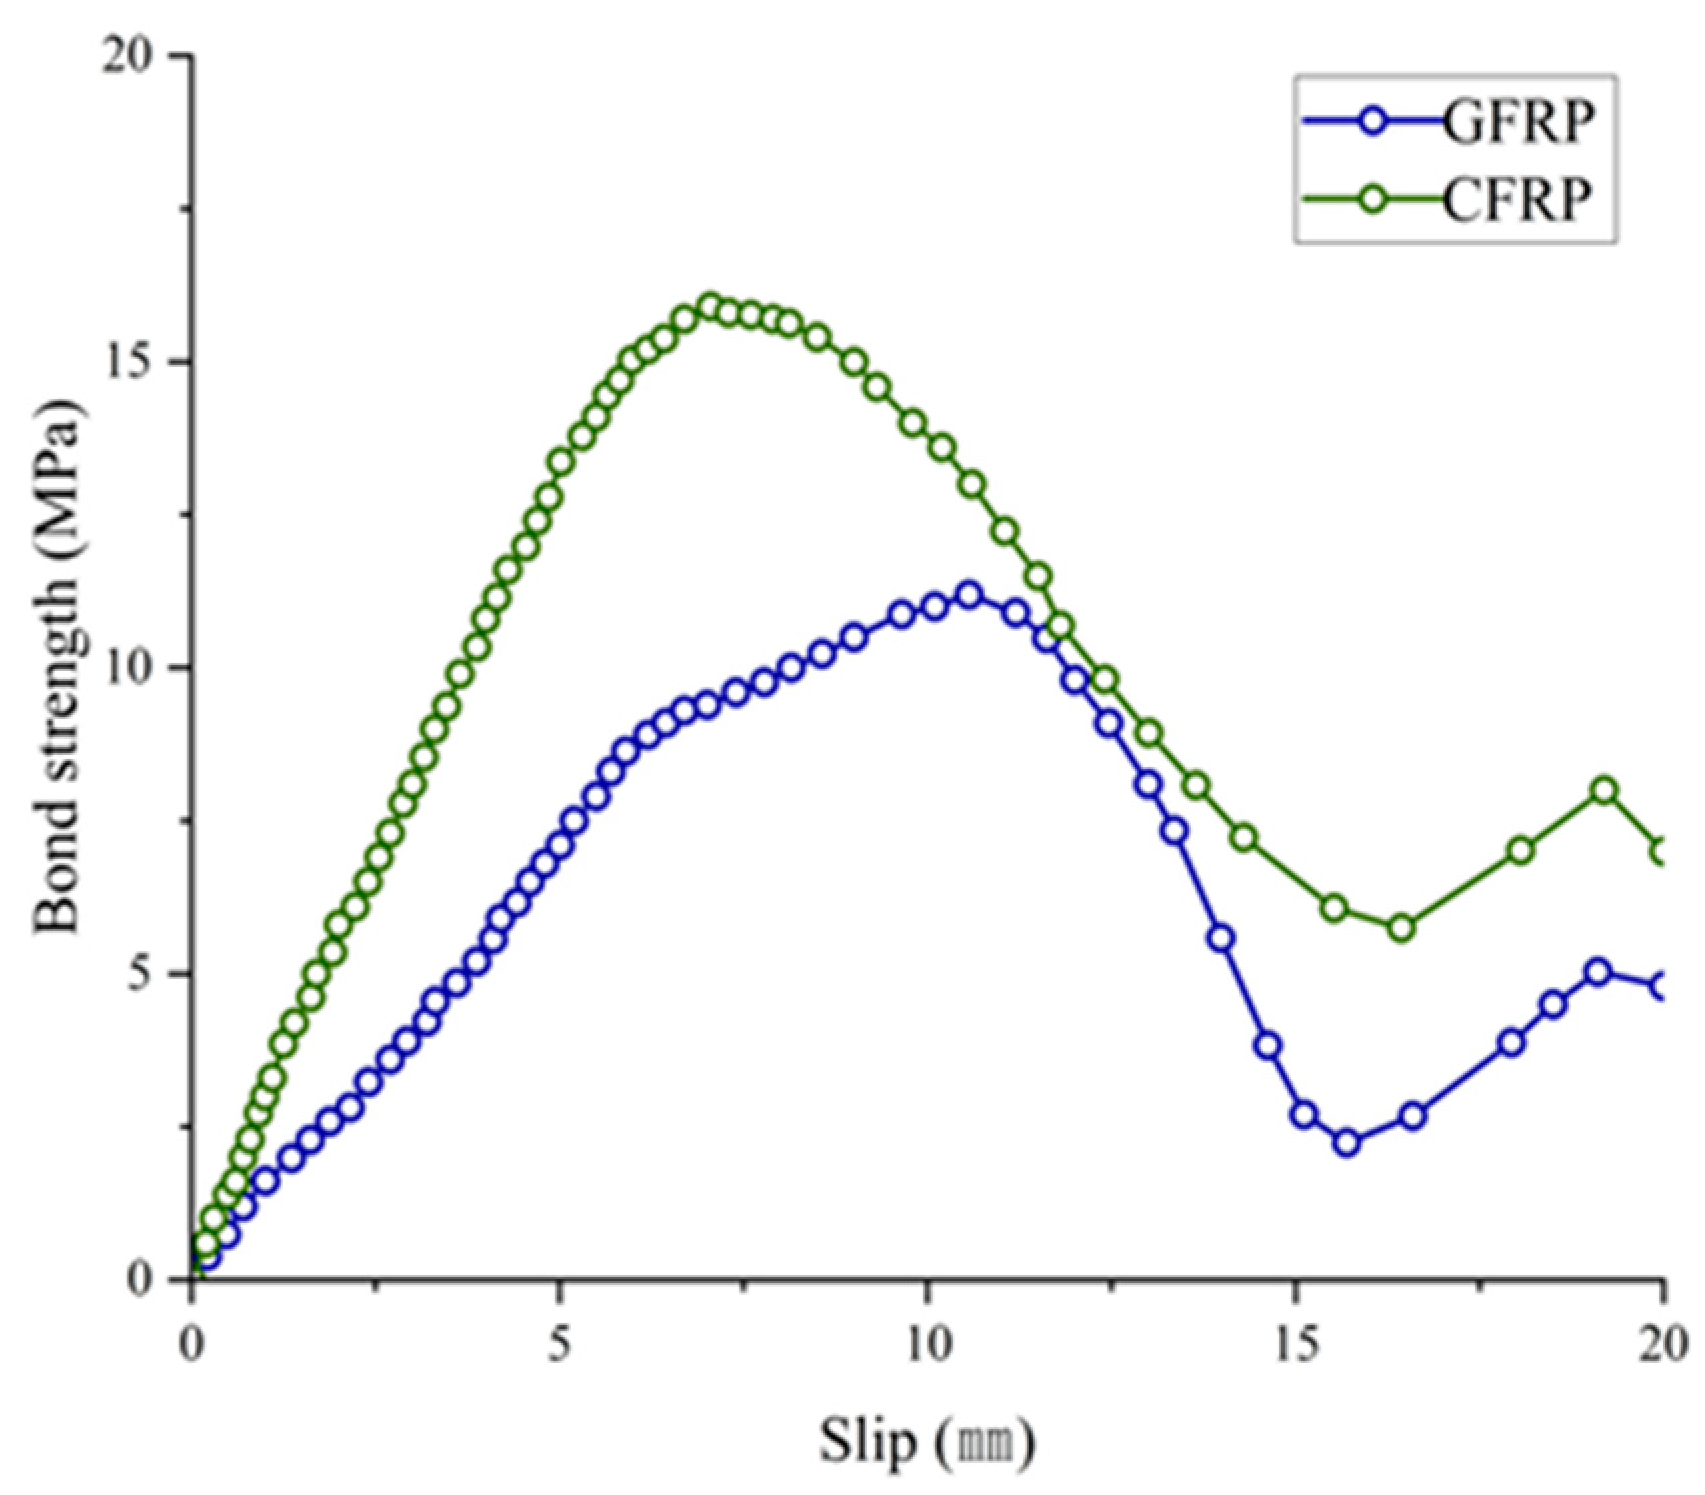
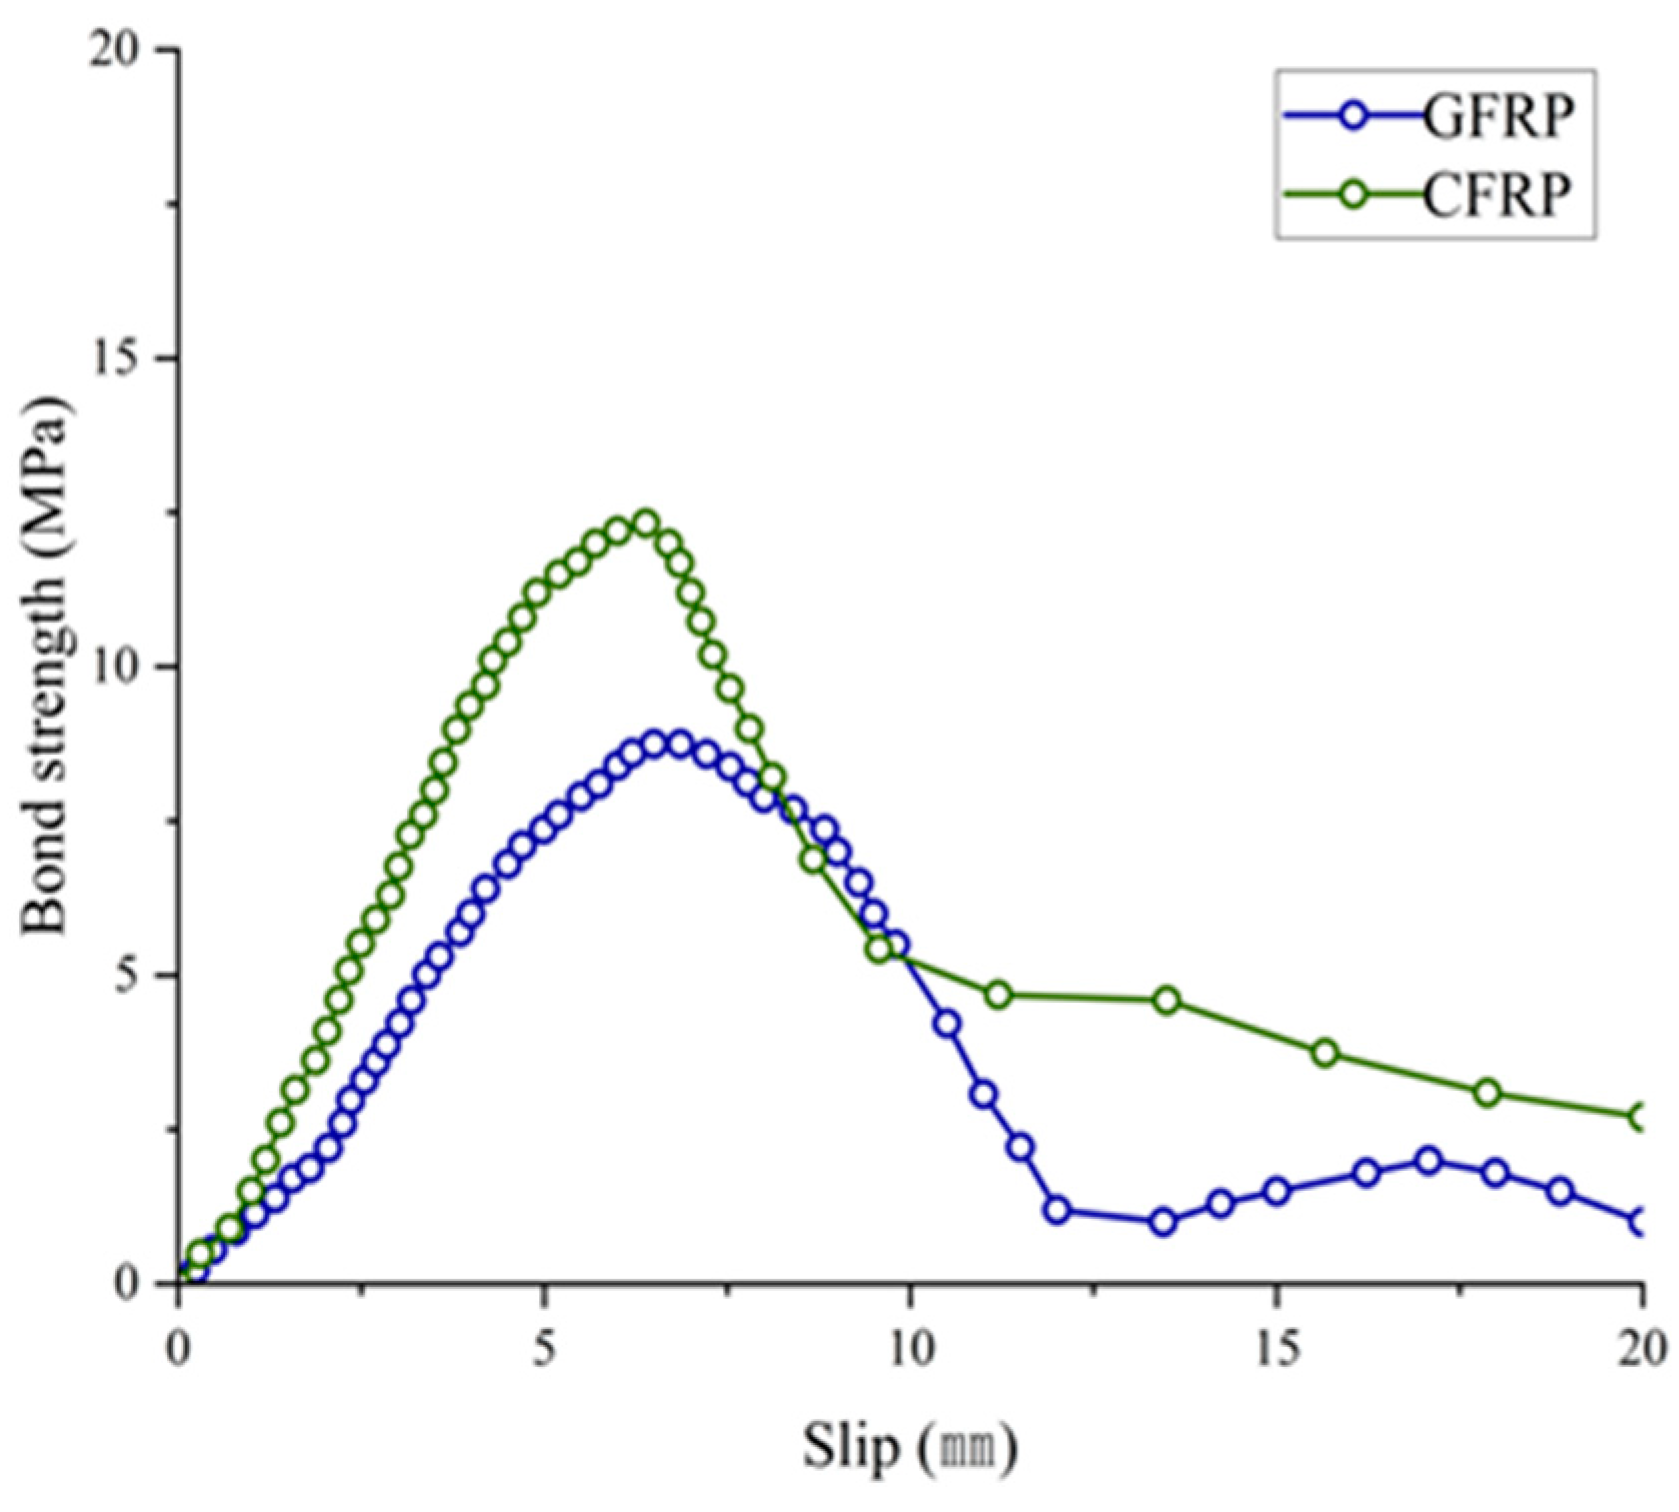
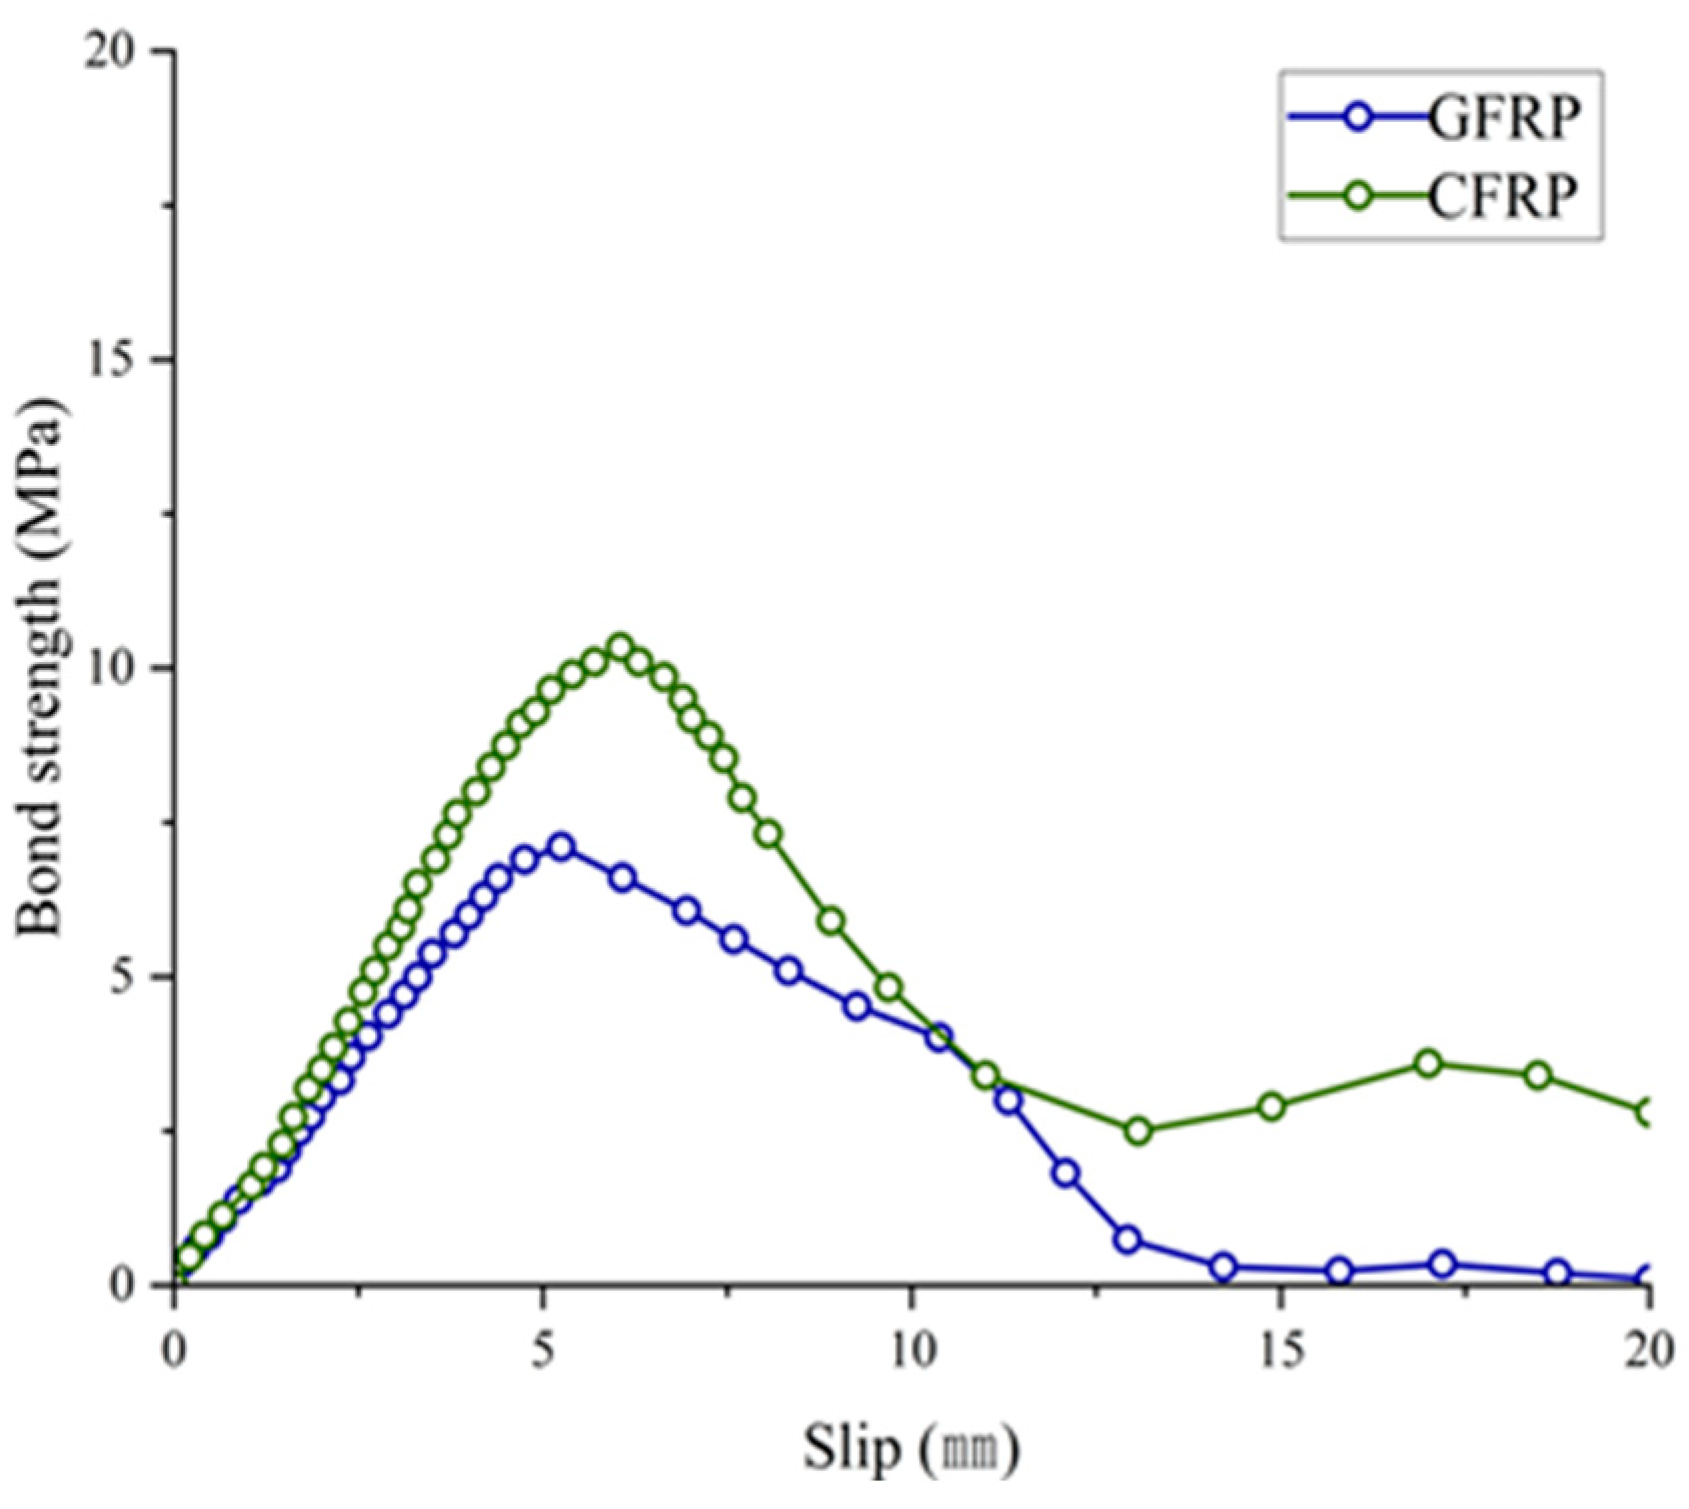
4.3. Bond Strength and Slip Relationship

Table 8 summarizes the experimental data of the bond strength of the GFRP and CFRP according to the water–cement ratio. The notation of the test specimens is as follows: free end slip is represented by the mean of the LVDTs installed at the bottom of both sides measured at maximum bond strength.
CW_D#N
C = type of rebar used in the test specimen
W = water–cement ratio
D = diameter of rebar used in the test specimen
N = number of test specimens
Figure 10 shows the relationship between bond strength and slip of the GFRP. It was found that the increase in bond strength of the GFRP also led to the increase in slip. At the water–cement ratio of 40%, the bond strength increased after maximum bond strength. This may be because the high compressive strength cracked the ribs on the surface of the GFRP, and the ribs remaining on the bonded surface between the concrete and GFRP led to the increase in bond strength. For the water–cement ratio of 50%, the bond strength increased slightly after maximum bond strength. On the other hand, for the water–cement ratio of 60%, the bond strength showed a gentle slope after maximum bond strength and then declined. Moreover, a lower water–cement ratio led to more slip of maximum bond strength.
Figure 11 is a graph showing the relationship between bond strength and slip of the CFRP. For the water–cement ratio of 40%, similar to GFRP, high compressive strength cracked the ribs on the surface of the CFRP, and the ribs remaining on the bonded surface between the concrete and the CFRP led to an increase in bond strength. In addition, the concrete with 50% and 60% water–cement ratio showed a similar trend as the GFRP.

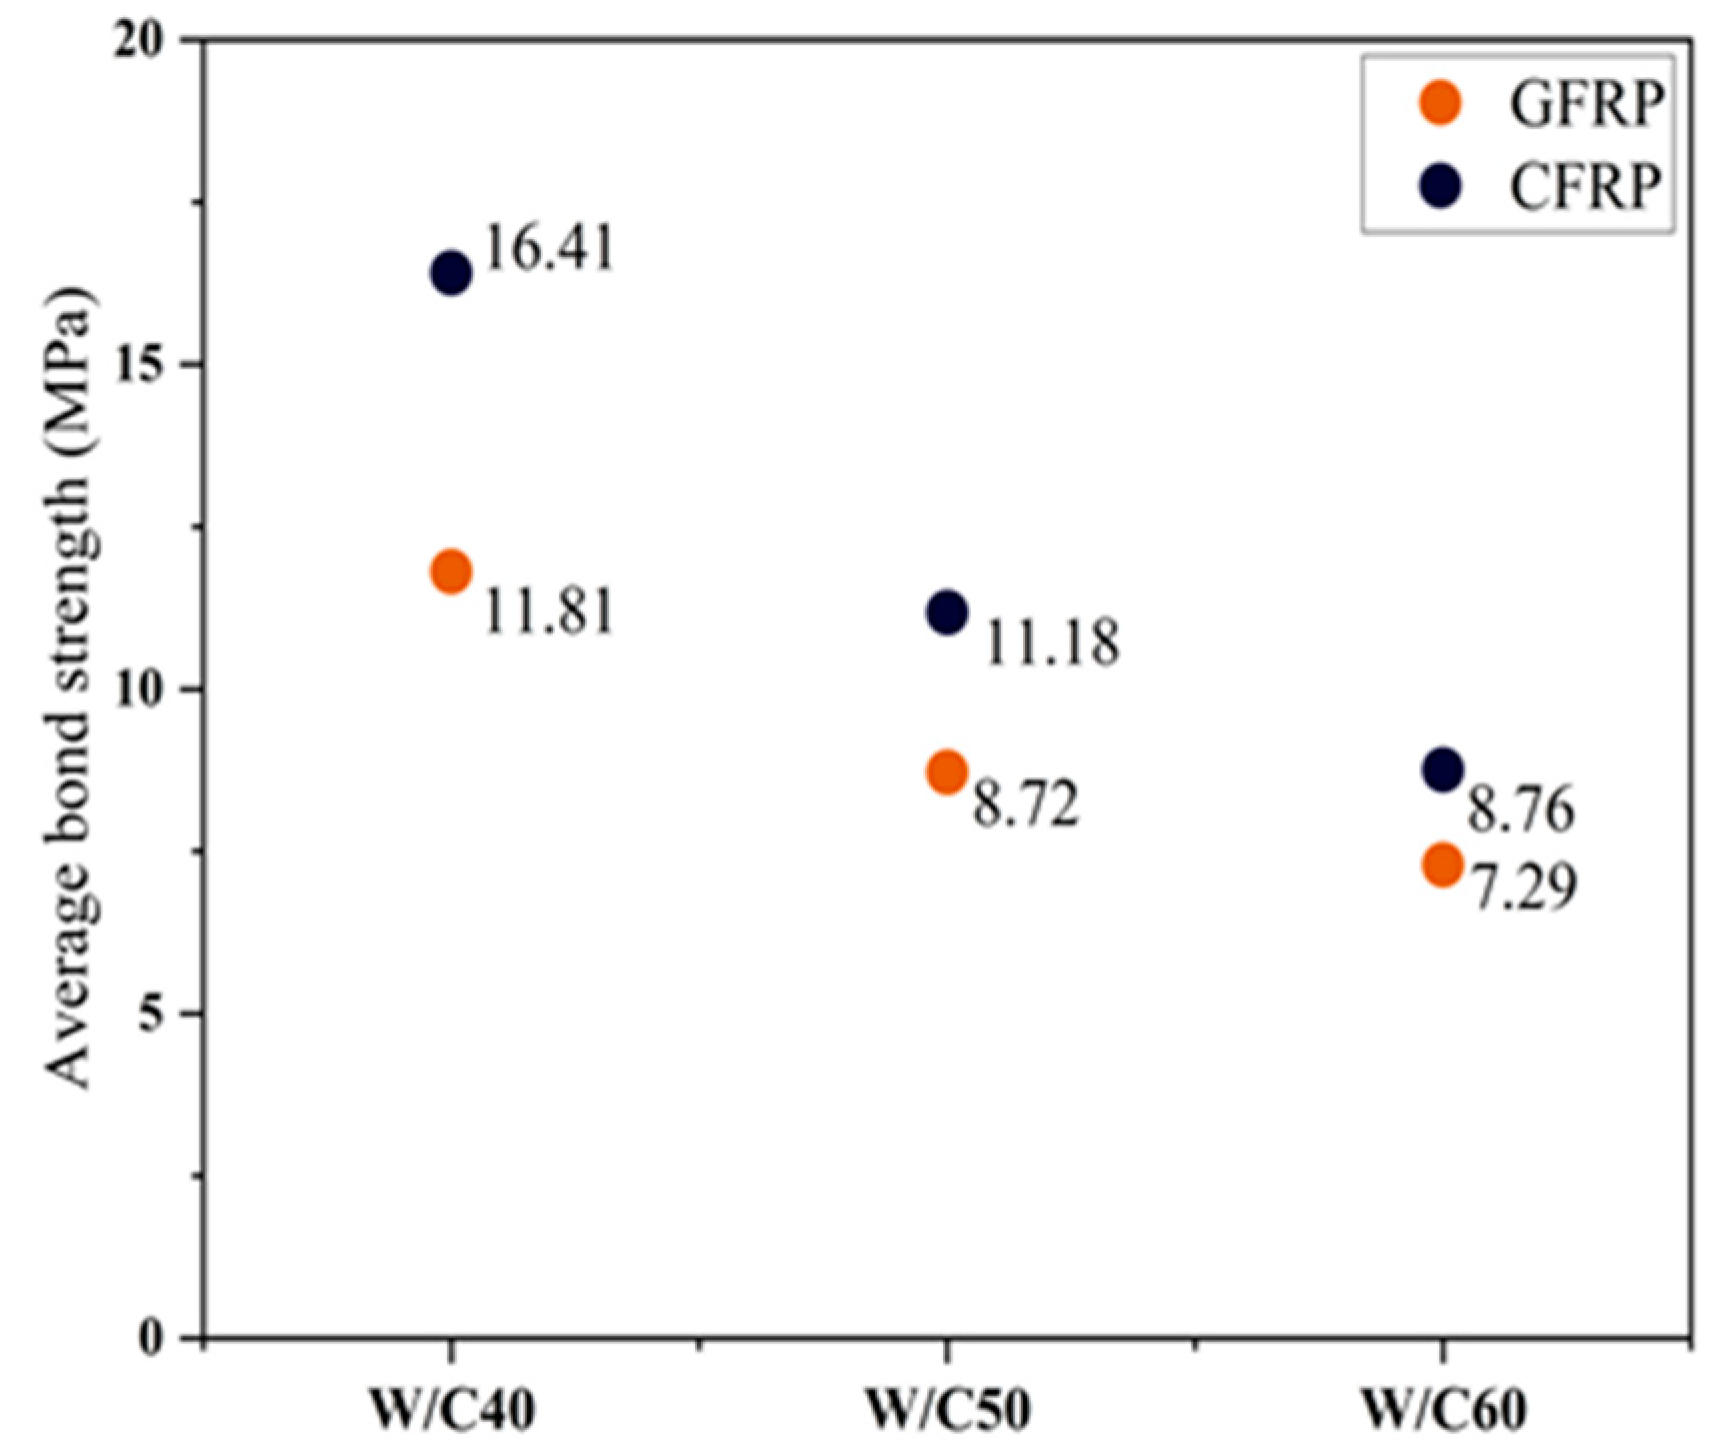
4.4. Comparison by Fiber Type

Figure 12 shows the results of comparing the bond strengths of the GFRP and the CFRP. For the 40% water–cement ratio, the CFRP showed approximately 28% higher bond strength than the GFRP, and for 50%, the CFRP showed approximately 23% higher bond strength than the GFRP. Moreover, for the 60% water–cement ratio, the CFRP showed approximately 17% higher bond strength than the GFRP. In other words, a low water–cement ratio resulted in a greater difference between the bond strength of the GFRP and CFRP. The concrete possessed a denser structure surrounding the concrete reinforcing bars attachment side. Furthermore, in concrete of the same strength, the adhesion strength of the reinforcing bars with higher tensile strength was higher. The reinforcing bars with high tensile strength significantly resisted the pull-out load even if they possessed the same frictional force [18]. These test results were similar to those of previous studies. In addition, as GFRP has a lower tensile strength than CFRP, the attachment tip between the concrete and reinforcing bar in the GFRP experiences stress concentration, which reduces the attachment strength of the GFRP.
Figure 13, Figure 14 and Figure 15 show graphs comparing the relationship between slip and bond strength of the GFRP and CFRP by water–cement ratio. The CFRP was 17–28% higher than the GFRP because the CFRP had about 35% higher tensile strength than the GFRP. Overall, bond strength and slip of the GFRP and CFRP showed similar trends despite the different water–cement ratios. Figure 16 and Figure 17 show the fracture shapes of the bonded surface of the GFRP and CFRP. The upper part of the image shown is the part clamped by the clamping jaw, and the lower part is the bonded surface of the concrete and rebar. Both the GFRP and CFRP failed to withstand the bearing pressure, and the surface coating cracked, resulting in low adhesion strength. On comparing the results of the adhesion strength of concrete, GFRP, and CFRP in this study with a previous study, it was found that the trend of the slip relationship according to the adhesion strength of the GFRP and CFRP exhibited a similar overall pattern [19,20,21,22,23].

5. Conclusions

The following conclusions were drawn from the experiment on the bond strengths of GFRP and CFRP by concrete strength based on the scope of the study.
(1)
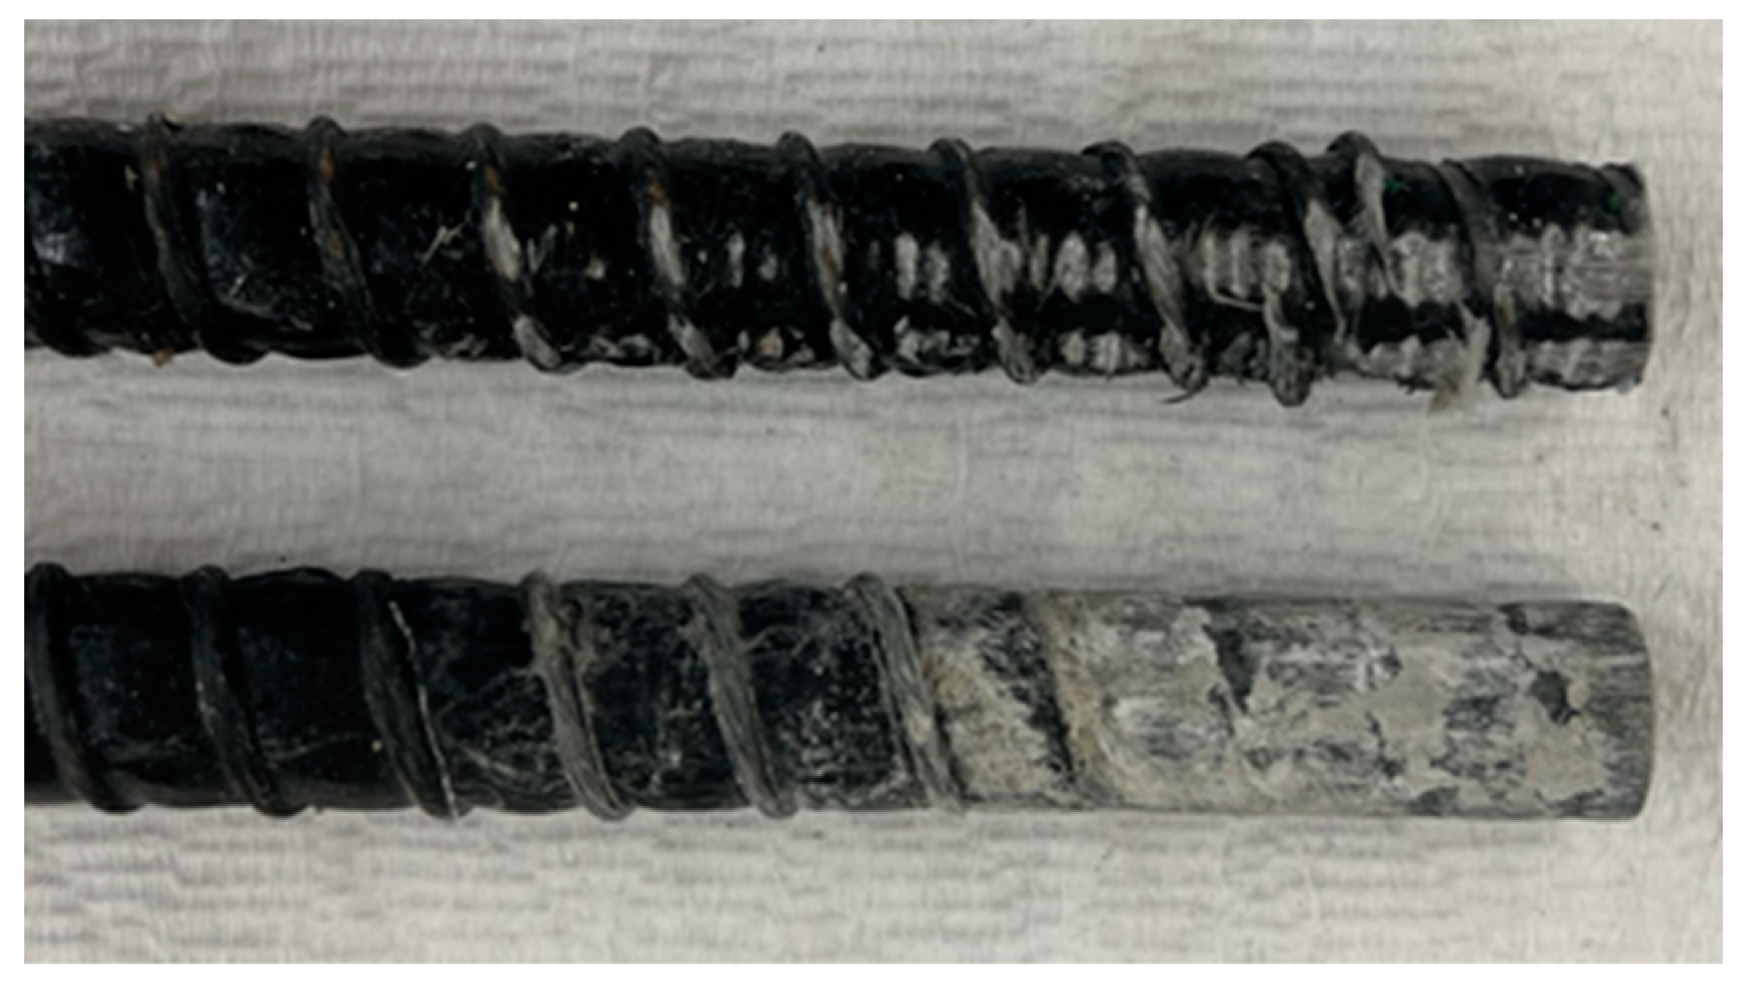
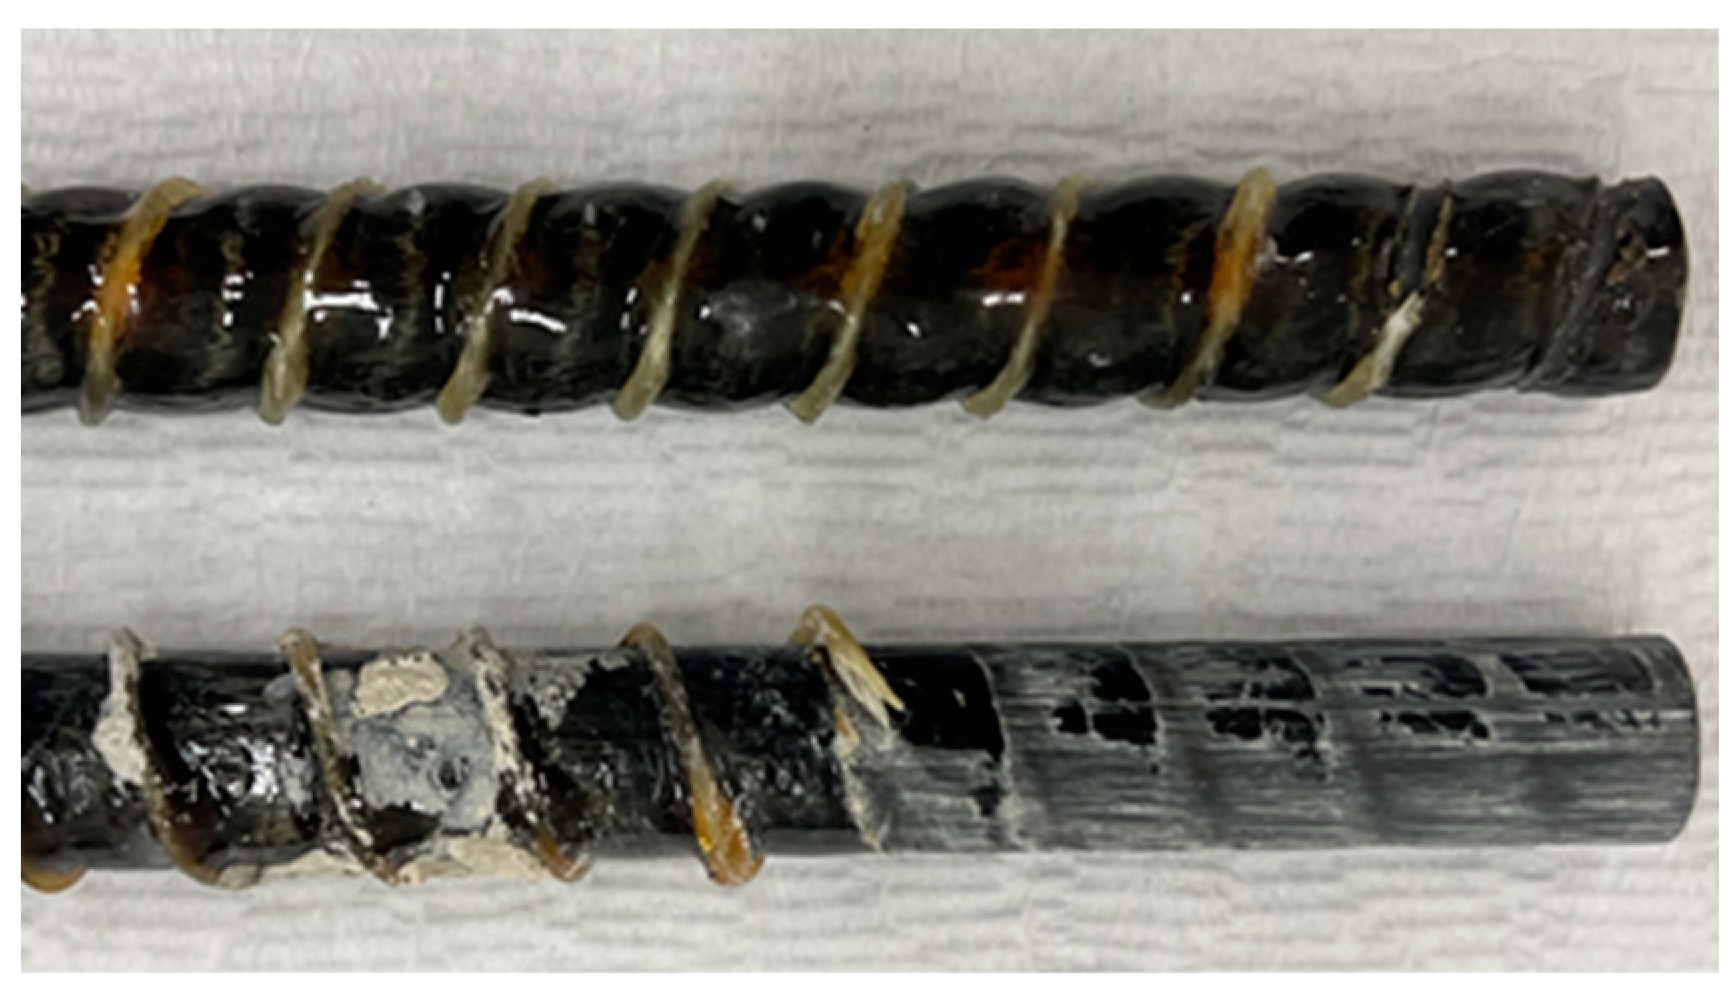
While investigating the relationship between bond strength and slip, bond strength tended to increase after rib failure in the concrete with a 40% water–cement ratio. This can be attributed to the increased bond strength in the remaining intact concrete–rebar ribs under high compressive strength.
(2)
For all water–cement ratios, it was found that higher the compressive strength of the concrete, the better the adhesion strength between the concrete, and the CFRP or GFRP. This could be attributed to the effect on the increase in strength.
(3)
When comparing the bonding strength of the GFRP and CFRP, the bonding strength of the CFRP, which has higher tensile strength, was greater than that of the GFRP. This could be attributed to the resistance offered by the reinforcing bar with high tensile strength against the pull-out load even under the same frictional force.
This experimental study was aimed toward investigating the adhesion strength of GFRP and CFRP at three levels of W/C and the same reinforcement diameter. Other parameters affecting adhesion strength between concrete, and CFRP or GFRP could not be explained through the results of this study. In the future, research on GFRP and CFRP according to the concrete mixing level and rebar diameter ought to be investigated.

Author Contributions

Formal analysis, J.K. and S.J.; experiment, J.K., S.J. and H.K.; writing—original draft preparation, J.K. and S.J.; writing—review and editing, J.K., S.J. and H.K.; visualization, J.K.; supervision, S.P.; project administration, S.P., Y.K. and J.K. All authors have read and agreed to the published version of the manuscript.

Funding

This work is supported by the Korea Agency for Infrastructure Technology Advancement (KAIA) grant funded by the Ministry of Land, Infrastructure, and Transport (Grant 22CFRP-C163390-02).

Conflicts of Interest

The authors declare no conflict of interest. The funders had no role in the design of the study; in the collection, analyses, or interpretation of data; in the writing of the manuscript; or in the decision to publish the results.

References

  1. Lee, Y.H.; Choi, J.H.; Kim, H.C.; Kim, D.H.; La, S.J. Experimental Study on Bond Strength of CFRP Rebar in concrete. J. Archit. Inst. Korea 2008, 24, 53–60. [Google Scholar]
  2. Saetta, A.V.; Scotta, R.V.; Vitaliani, R.V. Analysis of chloride diffusion into partially saturated concrete. ACI Mater. J. 1993, 90, 441–451. [Google Scholar]
  3. Kim, J.S.; Lee, S.H. Bond Behaviors of Epoxy Coated Reinforcements Using Direct Pull-out Test. J. Korean Recyl. Constr. Res. Inst. 2017, 5, 298–304. [Google Scholar]
  4. Oh, B.H.; Kim, K.H.; Jang, S.Y.; Jing, T.R.; Jang, B.S. Cracking Behavior of Reinforced Concrete Structures due to Reinforcing Steel Corrosion. J. Korea Concr. Inst. 2002, 14, 851–863. [Google Scholar]
  5. Lee, S.T.; Park, K.P.; Park, K.T.; You, Y.J.; Seo, D.W. A Study on the Application of FRP Hybrid Bar to Prevent Corrosion of Reinforcing Bar in Concrete Structure. J. Korea Acad. Ind. Coop. Soc. 2019, 20, 559–568. [Google Scholar]
  6. Okelo, R.; Robert, L.Y. Bond strength of fiber reinforced polymer rebars in normal strength concrete. J. Compos. Constr. 2005, 9, 203–213. [Google Scholar] [CrossRef]
  7. Lee, J.Y.; Yi, C.K.; Kim, T.Y.; Park, J.S.; Park, Y.H. Bond Failure Surface of Glass Fiber Reinforced Polymer Bars. J. Korea Concr. Inst. 2008, 20, 383–391. [Google Scholar]
  8. ACI Committee 440. Guide for the Design and Construction of Concrete Reinforce with FRP Bars. 2006. Available online: https://basalt-fibers.com/wp-content/uploads/2021/05/Standart_ACI-4401R15.pdf (accessed on 12 September 2022).
  9. Kim, T.Y.; Park, J.S.; Lee, J.Y.; Kim, K.H. Effect of Compressive Strength of Concrete on the Bond Strength of Glass Fiber Reinforcement Plastic Bars. J. Archit. Inst. Korea 2005, 21, 69–76. [Google Scholar]
  10. You, Y.J.; Park, Y.H.; Park, J.S. Service and Ultimate Load Behavior of Bridge Deck Reinforced with GFRP Rebars. J. Korean Soc. Civil Eng. 2008, 28, 719–727. [Google Scholar]
  11. Kim, H.J.; Kim, J.S.; Kim, Y.J.; Choi, J.W.; Park, S.G. Bond Strength Properties of CFRP Rebar in Concrete According to the Concrete Strength. J. Korean Recycl. Constr. Res. Inst. 2017, 9, 569–577. [Google Scholar]
  12. Yoon, S.J.; Ho, S.W.; Kim, K.S. An Experimental Study about Flexural Behavior of Timber Beam with Near Surface Mounted CFRP Bar. J. Archit. Inst. Korea 2016, 18, 131–138. [Google Scholar]
  13. Kim, H.U.; Jee, N.Y. Effect of the Rebar Corrosion Rate on Bond Strength in Reinforced Concrete. J. Archit. Inst. Korea 2005, 21, 159–166. [Google Scholar]
  14. Jung, K.S.; Park, K.T.; You, Y.J.; Seo, D.W.; Kim, B.C.; Park, J.S. Evaluation of Bond Strength for FRP Hybrid Bar According to Coating Methods using Silica Sands. J. Korea Acad. Ind. Coop. Soc. 2017, 18, 118–125. [Google Scholar]
  15. ASTM C 234-91a; Standard Test Method for Comparing Concretes on the Basis of the Bond Developed with Reinforcing Steel. American Society of Testing and Material: West Conshohocken, PA, USA; ASCE: Reston, VA, USA, 1991. Available online: https://kupdf.net/download/bond-strength-of-concrete-with-rebar_6025699fe2b6f5fa1608fdd2_pdf (accessed on 10 September 2022).
  16. Lee, S.S.; Joo, H.J.; Kang, I.K.; Yoon, S.J. Structural Behavior of the Reinforced Concrete Filled GFRP Tube. Compos. Res. 2010, 23, 44–51. [Google Scholar]
  17. Lee, H.J.; Suh, J.I.; Yoo, S.W. Bond Behavior of Concrete According to Replacement Ratio of Fly Ash and Compressive Strength of Concrete. J. Korean Recycl. Constr. Res. Inst. 2016, 4, 19–24. [Google Scholar]
  18. Kwak, S.T.; Yoon, Y.S. A Bond Characteristics of High Strength Steel Reinforced Concrete Members. J. Korean Soc. Civil Eng. A 2002, 22, 85–94. [Google Scholar]
  19. Gao, J.; Xu, P.; Fan, L.; Terrasi, G.P. Study on Bond-Slip Behavior between Seawater Sea-Sand Concrete and Carbon Fiber-Reinforced Polymer (CFRP) Bars with Different Surface Shapes. Polymers 2022, 14, 2689. [Google Scholar] [CrossRef]
  20. Bazli, M.; Zhao, X.-L.; Bai, Y.; Raman, R.K.S.; Saadi, S.A. Bond-slip behaviour between FRP tubes and seawater sea sand concrete. Eng. Struct. 2019, 197, 109421. [Google Scholar] [CrossRef]
  21. Solyom, S.; Di Benedetti, M.; Balázs, G.L. Bond of FRP bars in air-entrained concrete: Experimental and statistical study. Constr. Build. Mater. 2021, 300, 124193. [Google Scholar] [CrossRef]
  22. Ifrahim, M.S.; Sangi, A.J.; Hamza, S.M. Experimental Study on Bond Strength of Locally Manufactured GFRP Bar. Eng. Proc. 2022, 22, 4. [Google Scholar]
  23. Zhao, J.; Luo, X.; Wang, Z.; Feng, S.; Gong, X.; Shumuye, E.D. Experimental Study on Bond Performance of Carbon- and Glass-Fiber Reinforced Polymer (CFRP/GFRP) Bars and Steel Strands to Concrete. Materials 2021, 14, 1268. [Google Scholar] [CrossRef] [PubMed]
Figure 1. The manufacturing process of glass fiber-reinforced plastic (GFRP) and carbon fiber-reinforced plastic (CFRP).
Applsci 12 10611 g001
Figure 2. Bond strength test specimen.
Applsci 12 10611 g002
Figure 3. Reinforcement bars. (A) Glass fiber-reinforced plastic (GFRP) and (B) carbon fiber-reinforced plastic (CFRP).
Applsci 12 10611 g003
Figure 4. Bar bond strength mold.
Applsci 12 10611 g004
Figure 5. Test equipment.
Applsci 12 10611 g005
Figure 6. Compressive strength of concrete.
Applsci 12 10611 g006
Figure 7. Fracture shape of concrete specimen.
Applsci 12 10611 g007
Figure 8. Average bond strength results of GFRP.
Applsci 12 10611 g008
Figure 9. Average bond strength results of CFRP.
Applsci 12 10611 g009
Figure 10. Bond strength and slip of GFRP.
Applsci 12 10611 g010
Figure 11. Bond strength and slip of CFRP.
Applsci 12 10611 g011
Figure 12. Average bond strength by FRP type.
Applsci 12 10611 g012
Figure 13. Bond strength and slip by FRP type(W/C 40).
Applsci 12 10611 g013
Figure 14. Bond strength and slip by FRP type(W/C 50).
Applsci 12 10611 g014
Figure 15. Bond strength and slip by FRP type(W/C 60).
Applsci 12 10611 g015
Figure 16. Fracture shape of the GFRP surface.
Applsci 12 10611 g016
Figure 17. Fracture shape of the CFRP surface.
Applsci 12 10611 g017
Table 1. Experimental parameters.
FactorsLevels
W/C (%)40%, 50%, 60%3
bar typeCFRP, GFRP2
curing conditiontemperature 20 ± 2 °C1
aggregate typeriver sand and crushed gravel2
test itemcompressive strength (28 days), bond strength (28 days)2
Table 2. Physical properties of GFRP.
Diameter (mm)FiberTensile Strength (MPa)
13glass fiber 4400TEX1106
Table 3. Physical properties of CFRP.
Diameter (mm)FiberTensile Strength (MPa)
13carbon fiber 24K1714
Table 4. Physical properties of cement.
TypeSpecific GravityBlaine
(cm2/g)
Setting Time (h:m)Compressive Strength (MPa)
InitialFinal3 Days7 Days28 Days
13.143,7504:306:2036.949.160.6
Table 5. Physical properties of sand.
TypeDensity
(g/m3)
Fineness Modulus (g/cm2)Absorption
(%)
river sand2.562.570.94
Table 6. Physical properties of gravel.
TypeDensity
(g/m3)
Fineness Modulus (g/cm2)Absorption
(%)
crushed gravel2.637.5310.8
Table 7. Mix proportion of concrete.
W/C (%)Air (%)S/a
(%)
Water (kg/m3)Unit Weight (kg/m3) Unit   Volume   ( L / m 2 )
CSGCSG
40546175438743910139293344
50546175350776950111305359
6054617529979797793314369
Table 8. Bond strength and slip.
Specimen NameUltimate State
Bond Strength (MPa)Free End Slip
(mm)
Load
(kN)
G40_13#111.2911.6723.96
G40_13#210.6911.0122.69
G40_13#313.489.1328.61
G50_13#18.456.4317.94
G50_13#28.758.6318.57
G50_13#39.006.3819.10
G60_13#17.8510.1116.66
G60_13#27.115.2515.09
G60_13#36.9511.5614.75
C40_13#118.7210.4139.74
C40_13#215.848.1433.62
C40_13#314.7023.1931.20
C50_13#112.336.3826.17
C50_13#28.896.1018.87
C50_13#312.3511.2126.21
C60_13#110.346.0521.95
C60_13#27.7116.1316.37
C60_13#38.2412.2217.49
G = GFRP, C = CFRP
Publisher’s Note: MDPI stays neutral with regard to jurisdictional claims in published maps and institutional affiliations.

