Article

Geospatial Analytics for Preliminarily Landscape Active Tectonic Assessment of the Wadi Araba Basin, Western Gulf of Suez, Egypt

1
Department of Geology, Faculty of Science, Al-Azhar University, Cairo 11651, Egypt
2
Department of Civil Engineering, College of Engineering, King Saud University, Riyadh 11421, Saudi Arabia
3
Department of Civil, Geo, and Environmental Engineering, Technical University of Munich, Arcisstrasse 21, 80333 Munich, Germany
*
Author to whom correspondence should be addressed.
Appl. Sci. 2022, 12(23), 12152; https://doi.org/10.3390/app122312152
Submission received: 31 October 2022 / Revised: 19 November 2022 / Accepted: 24 November 2022 / Published: 28 November 2022
(This article belongs to the Special Issue Geographic Visualization: Evaluation and Monitoring of Geohazards)

Abstract

:
The Gulf of Suez area represents one of the most famous tectonic structures in the Red Sea, with a long history of low-, moderate-, and high-intensity earthquakes. This paper provides geomorphic analytics of the fault-initiated mountain front sinuosity (Smf) and the stream gradients that cross various segments of the fault scarps. The results from the mountain front sinuosity index (Smf) and the valley floor width to valley height ratio index (Vf) suggest different levels of activities along the different fault segments. The analysis of the stream gradient index reflects that streams running through the fault segments mostly have higher river gradient values identified by knickpoint spots. With regard to the strike variation in the mountain front sinuosity, valley floor width to valley height ratio, and stream river gradients, the results are compatible with the predominant mountain front’s relief. Finally, the calculated geomorphic results show that the eastern segments might reflect higher seismic signals with respect to the central and western segments of the entire Wadi Araba basin. Thus, more careful studies are required to investigate seismic hazard possibilities.

1. Introduction

Tectonic geomorphology is defined as the study of landscapes affected by tectonics. It also provides significant signals that alert us to seismic hazards associated with regions of known fault traces. Fault-generated mountain fronts represent an interface, where different surface processes interact with active tectonics [1]. The interaction between the strength of rocks and rates of surface processes produces the final landscape interface [1,2,3]. Tectonic evaluations are usually investigated using geologic, geomorphic, and geodetic data [4,5,6]. Recent tectonic expressions along tectonic elements such as faults and folds have provided clues to various tectonic landscapes [4,7]. The appraisal of relative tectonic signals, which represent the core of this study, was discussed and assessed in many studies found in the literature. The authors of Ref. [8] assessed the active tectonics of the Hindu Kush (NW Pakistan and NE Afghanistan) using digital elevation model (DEM)-derived morpho-tectonic indices and drainage systems. The preliminary relative tectonic activity signals of the Wadi Ghoweiba catchment in the Gulf of Suez area were recognized based on integration between tectonic geomorphology, remote sensing, and GIS techniques [9]. This theoretical framework was applied effectively to the economic development of water resources in the Mikir massif in India [10]. The authors of this paper estimated and evaluated the active tectonics deduced from morpho-tectonic indices to achieve their target. Calculating geomorphic indices including the mountain front sinuosity index (Smf), the valley floor width to valley floor height ratio index (Vf), and stream length gradient index (SL) along deformed landscapes is a very effective strategy for investigating the tectonic signatures. Geomorphic analytics have widely been applied along many deformed areas, including in California [3,11]; Central America [12]; Southern Spain [13]; Eastern Anatolia [14]; Pakistan [15]; India [16]; Central Iran [17]; and Egypt [18]. We investigate the Wadi Araba basin to gain insights through a tectonic activity assessment of the entire landscape.
The northern end of the Red Sea rift, including the Gulf of Suez, has been recognized as an excellent example of a major continental rift system that provides a huge natural laboratory for investigating tectonic activity signatures and fault systems [19]. The Red Sea, together with its northwestern arm, the Gulf of Suez, shows different tectonic evaluation stages which indicate that the latest continental rift in the Gulf of Suez is a transitional stage in the central part of the Red Sea [19,20]. The Suez rift extends ~300 km as a continental rift between the African plate and Sinai Peninsula [21,22,23,24]. The author of Ref. [20] recognized three different tectonic dip blocks linked by two accommodation zones from north to south: The Galala-Abu Zenima accommodation zone and Morgan accommodation zone [22]. The Gulf of Suez is characterized by a moderate slip rate along active faults and earthquake recurrence intervals. The seismic activity of this rift is driven and migrated northward from the southern part of the Gulf of Suez [25,26]. Compared to active plate boundaries, the northern Red Sea and Gulf of Suez area reflects low to moderate signals of tectonic activity.
The Wadi Araba basin is one of the major broad structure-controlled valleys in the northern part of the Gulf of Suez separating the Northern and Southern Galala Plateaus. It represents the onshore region of a central half graben. The Wadi Araba basin follows the direction of the Syrian Arc structure system. Although the tectonic evolution and structural architecture of the Gulf of Suez have been discussed by many researchers, the activity of the highly deformed Wadi Araba has not been quantified, making it hard to evaluate the local seismic signals. The presence of many huge construction projects and populated cities around the study zone (e.g., the new Galala City) increases the importance of studying the seismicity behaviors of the Northern and Southern Galala Plateaus through modern techniques, such as remote sensing, geospatial analysis, and tectonic geomorphology. Bare surfaces without vegetation and clear exposures of the surface morphology due to the semi-arid climate provide suitable conditions to extract data on the mountain front sinuosity, shape of valleys, and river gradients, all of which can be helpful in describing short- and long-term seismic deformations in the study area.
This work aims to analyze and investigate mountain fronts and river morphologies that could help us understand the seismic signals of the entire Wadi Araba basin and present a classification of tectonic activity for each single fault segment to carry out a seismic hazard assessment of the active potential of the basin. For this task, effective morphometric indices including the mountain front sinuosity index, valley width to valley height ratio index, stream length gradient index, and hypsometric integral index were calculated and extracted.

2. Study Area

The central part of the Gulf of Suez area has a long history of tectonic events. The Wadi Araba basin is located in the central part of the Gulf of Suez zone (Figure 1). It has a length of about 80 km and a width of about 30 km, oriented in the NE–SW direction. Along the Wadi Araba basin, there is a major river running through the whole length that is fed by valleys from the Northern and Southern Galala Plateaus. The Northern Galala Plateau is bounded by steep cliffs to the north, east, and south, whereas the Southern Galala Plateau is edged by steep cliffs to the north and east. The highest point of the Northern Galala Plateau is recorded as 1249 m and the altitude decreases westward to reach 400–500 m at the El-Maaaza Plateau. The highest point of the Southern Galala Plateau is 1349 m. This plateau is more dissected than the northern plateau.
The rock units recorded in the study area include marine and non-marine successions varying in age from Paleozoic to Quaternary. The whole succession is underlain by Precambrian basement rocks. Regarding the Oligo-Miocene event of the Suez rifting, the lithology of the study basin is classified into three major tectonostratigraphic events: the pre-, syn-, and post-rift [22]. Different rock types were recorded in the study basin, including rocks from the Upper Carboniferous Rod El-Hamal Formation. This formation is composed of limestone, shale, and thin layers of sandstone [27]. Rocks from the Permian–Triassic period were recorded in the Qisieb Formation. It has a thickness of about 44 m in the Northern Galala Plateau and consists of interbedded ferruginous, continental, red beds of sandstone and variegated shale [22]. The overlaying Lower Cretaceous Malha Formation consists mainly of white to grey cross-bedded continental sandstone, passing into marine beds [27] (Figure 2). The Upper Cretaceous is represented, from older to younger, by undifferentiated deposits in the Galala Formation and St. Antony Formation, respectively. The Galala Formation is located mainly at the western flank of the study basin and represented by marine limestone with shale (Figure 2). The St. Antony Formation consists of chalky limestone and shallow-water marl [27]. The Lower and Middle Eocene are represented by the Abu Rimth Formation and Mokkattam Group, respectively [28] (Figure 2). The youngest Quaternary units in the study area are represented by the Quaternary and Wadi deposits [28] (Figure 2). The Upper Cretaceous, Quaternary, and Wadi deposits cover the majority of the study area (Figure 2).
The Wadi Araba deformation basin is a major Late Cretaceous inversion anticline form [29]. It comprises two major ENE anticlines. This plunging anticline has a steep southern limb, where a nearly vertical Upper Cretaceous section is exposed in the northern wall of the Southern Galala Plateau [22,29]. The southern flanks of both folds are found in both ENE deformation zones [22]. The northeastern tip of the Wadi Araba basin reaches to the western side of the Gulf of Suez Rift [29,30]. The listric faults of the northern and central half grabens of the Suez Rift overlap each other in the zone of Wadi Araba basin, confirming the basin effect on the boundaries of these two faults that caused the propagation of the two mega-half grabens during the rift opening event [29].

3. Materials and Methods

3.1. Data

Different data were combined in order to assess the relative tectonic activity of the study area. A 30 m resolution digital elevation model obtained from the Shuttle Radar Topography Mission (SRTM) was downloaded from earthexplorer.usgs.gov (https://earthexplorer.usgs.gov/). The NH 36 SW Beni Sueif geological map sheet was prepared and rectified. A topographic map was scanned and processed to help the DEM model extract various morphotectonic indices.

3.2. Morph-Tectonic Analysis

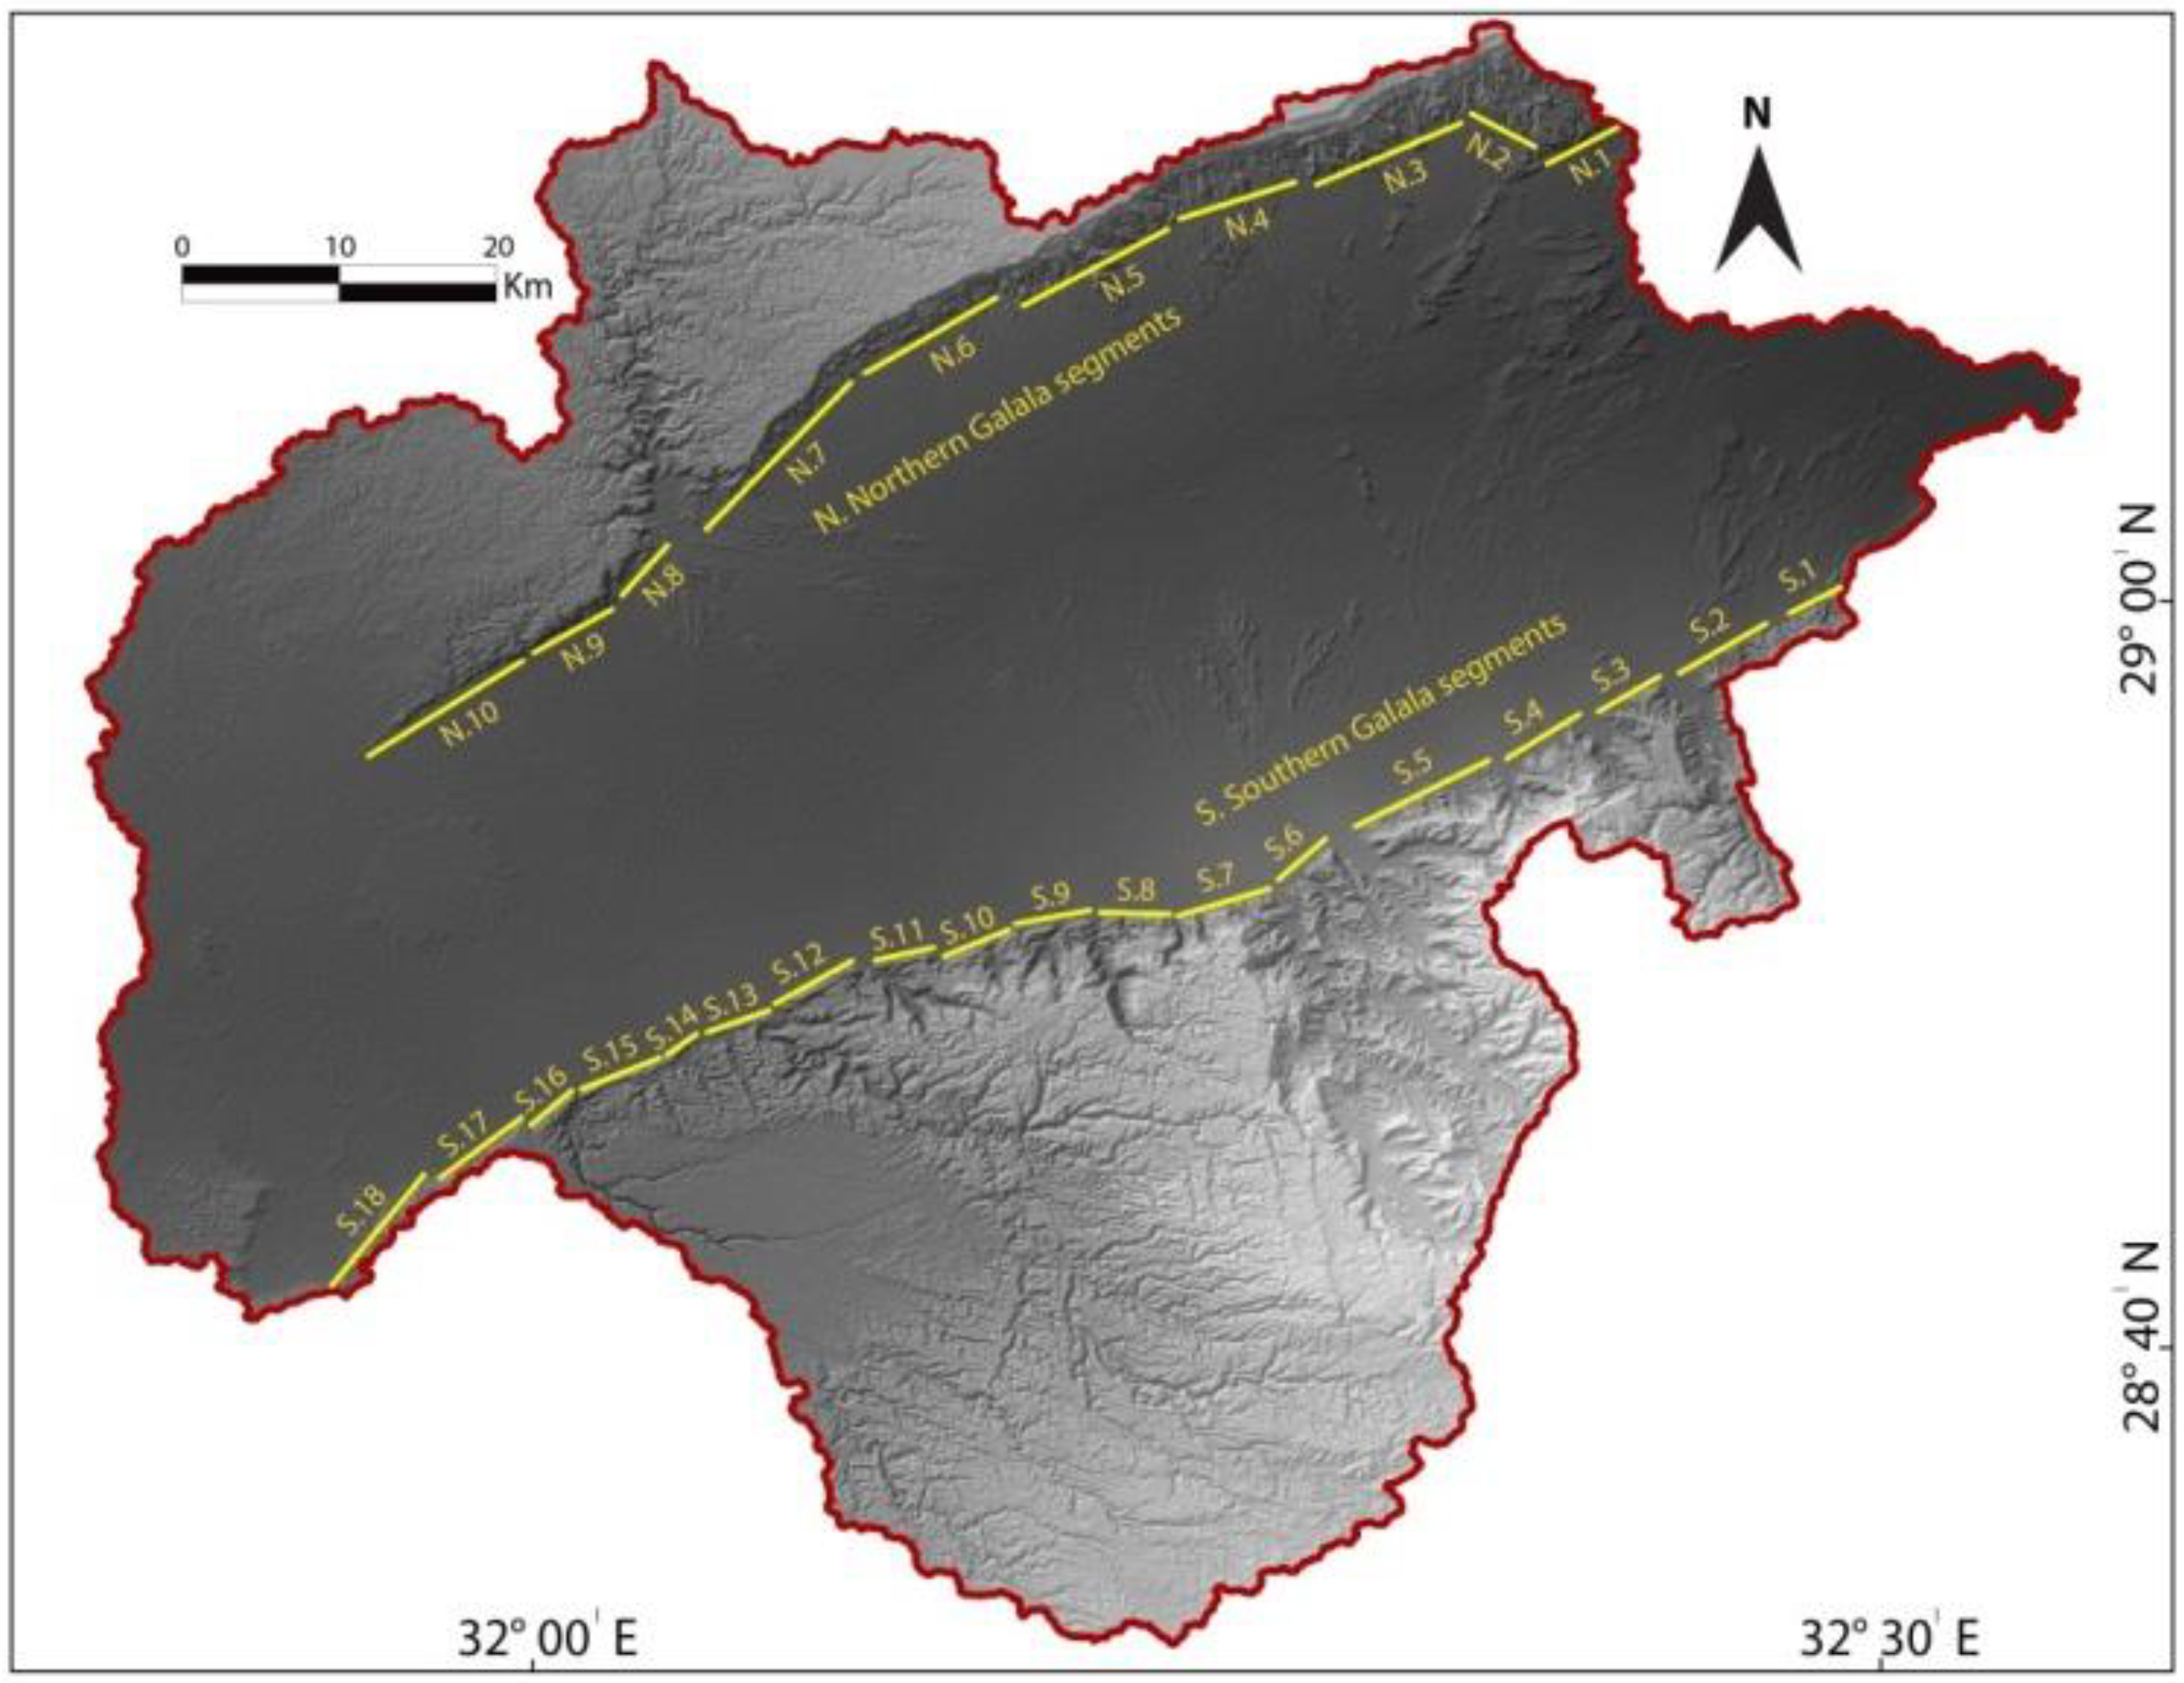
Modern and advanced techniques, including remote sensing and GIS on high resolution data, are excellent tools to apply to high-resolution data for structural and lithological mapping [31,32,33] and for assessing natural geological hazards [10,34,35,36,37]. In this paper, the technique of analysis required many steps. The geological map sheet was rectified and prepared as a layer underneath the topographic layer by using ArcGIS. The geological units of the study area were extracted and mapped. Based on the rock strength index results, one layer of the level of rock resistance is added. An SRTM digital elevation model was prepared and corrected by using hydrology tools in spatial tools in the Arc toolbox. A Hill-shade map was modeled and visualized to calculate the Smf index values. The northern flank of the Wadi Araba was segmented into 10 segments, while the southern edge was classified into 18 segments. The flow direction, flow accumulation, and stream extraction were applied with the hydrology tool to produce maps of the streams and drainage systems. The extracted maps were used to calculate the rest of the indices including SL, Vf, and H. The morpho-tectonic indexes are described in the following subsections.

3.2.1. Rock Strength Index

This work began with examining and evaluating the strength of the rocks over the entire Wadi Araba basin. The rock strength was defined according to the field observations from previous similar works [1,11,14]. We define rock strength according to the author of Ref. [38]. This author categorizes the rock hardness according to the constituent and cement material that aids in the resistance against weathering processes and fluvial erosion. However, in this study, we define the classes of rock strength as a) the low strength class (e.g., alluvium, limestone, marl, conglomerates, and sandstones), the moderate strength class (e.g., shale and sandy limestone), and finally the high strength class (e.g., basalt, marble, quartz, gabbro, and gneiss).

3.2.2. Stream Length Gradient Index (SL)

The SL is defined as a study of the effect of lithology resistance in rivers and channels of the proposed area [39,40]. This index’s values are obtained from the following formula:
SL = (dH/dL) × L
where (dH/dL) indicates the local slope of the channel segment being investigated, and L is the channel distance from where the channel midpoint of the river reach divides, for which this index is extracted [39,40] (Figure 3). The SL index provides higher values when streams flow over harder materials or actively uplifting regions, and the values are lower over softer rocks or slowly uplifting regions [1,11].

3.2.3. Mountain Front Sinuosity Index (Smf)

Mountain front sinuosity (Smf) is recognized as a very useful tool to investigate the tectonic activity of mountain fronts [18]. The Smf index can be extracted from the following formula:
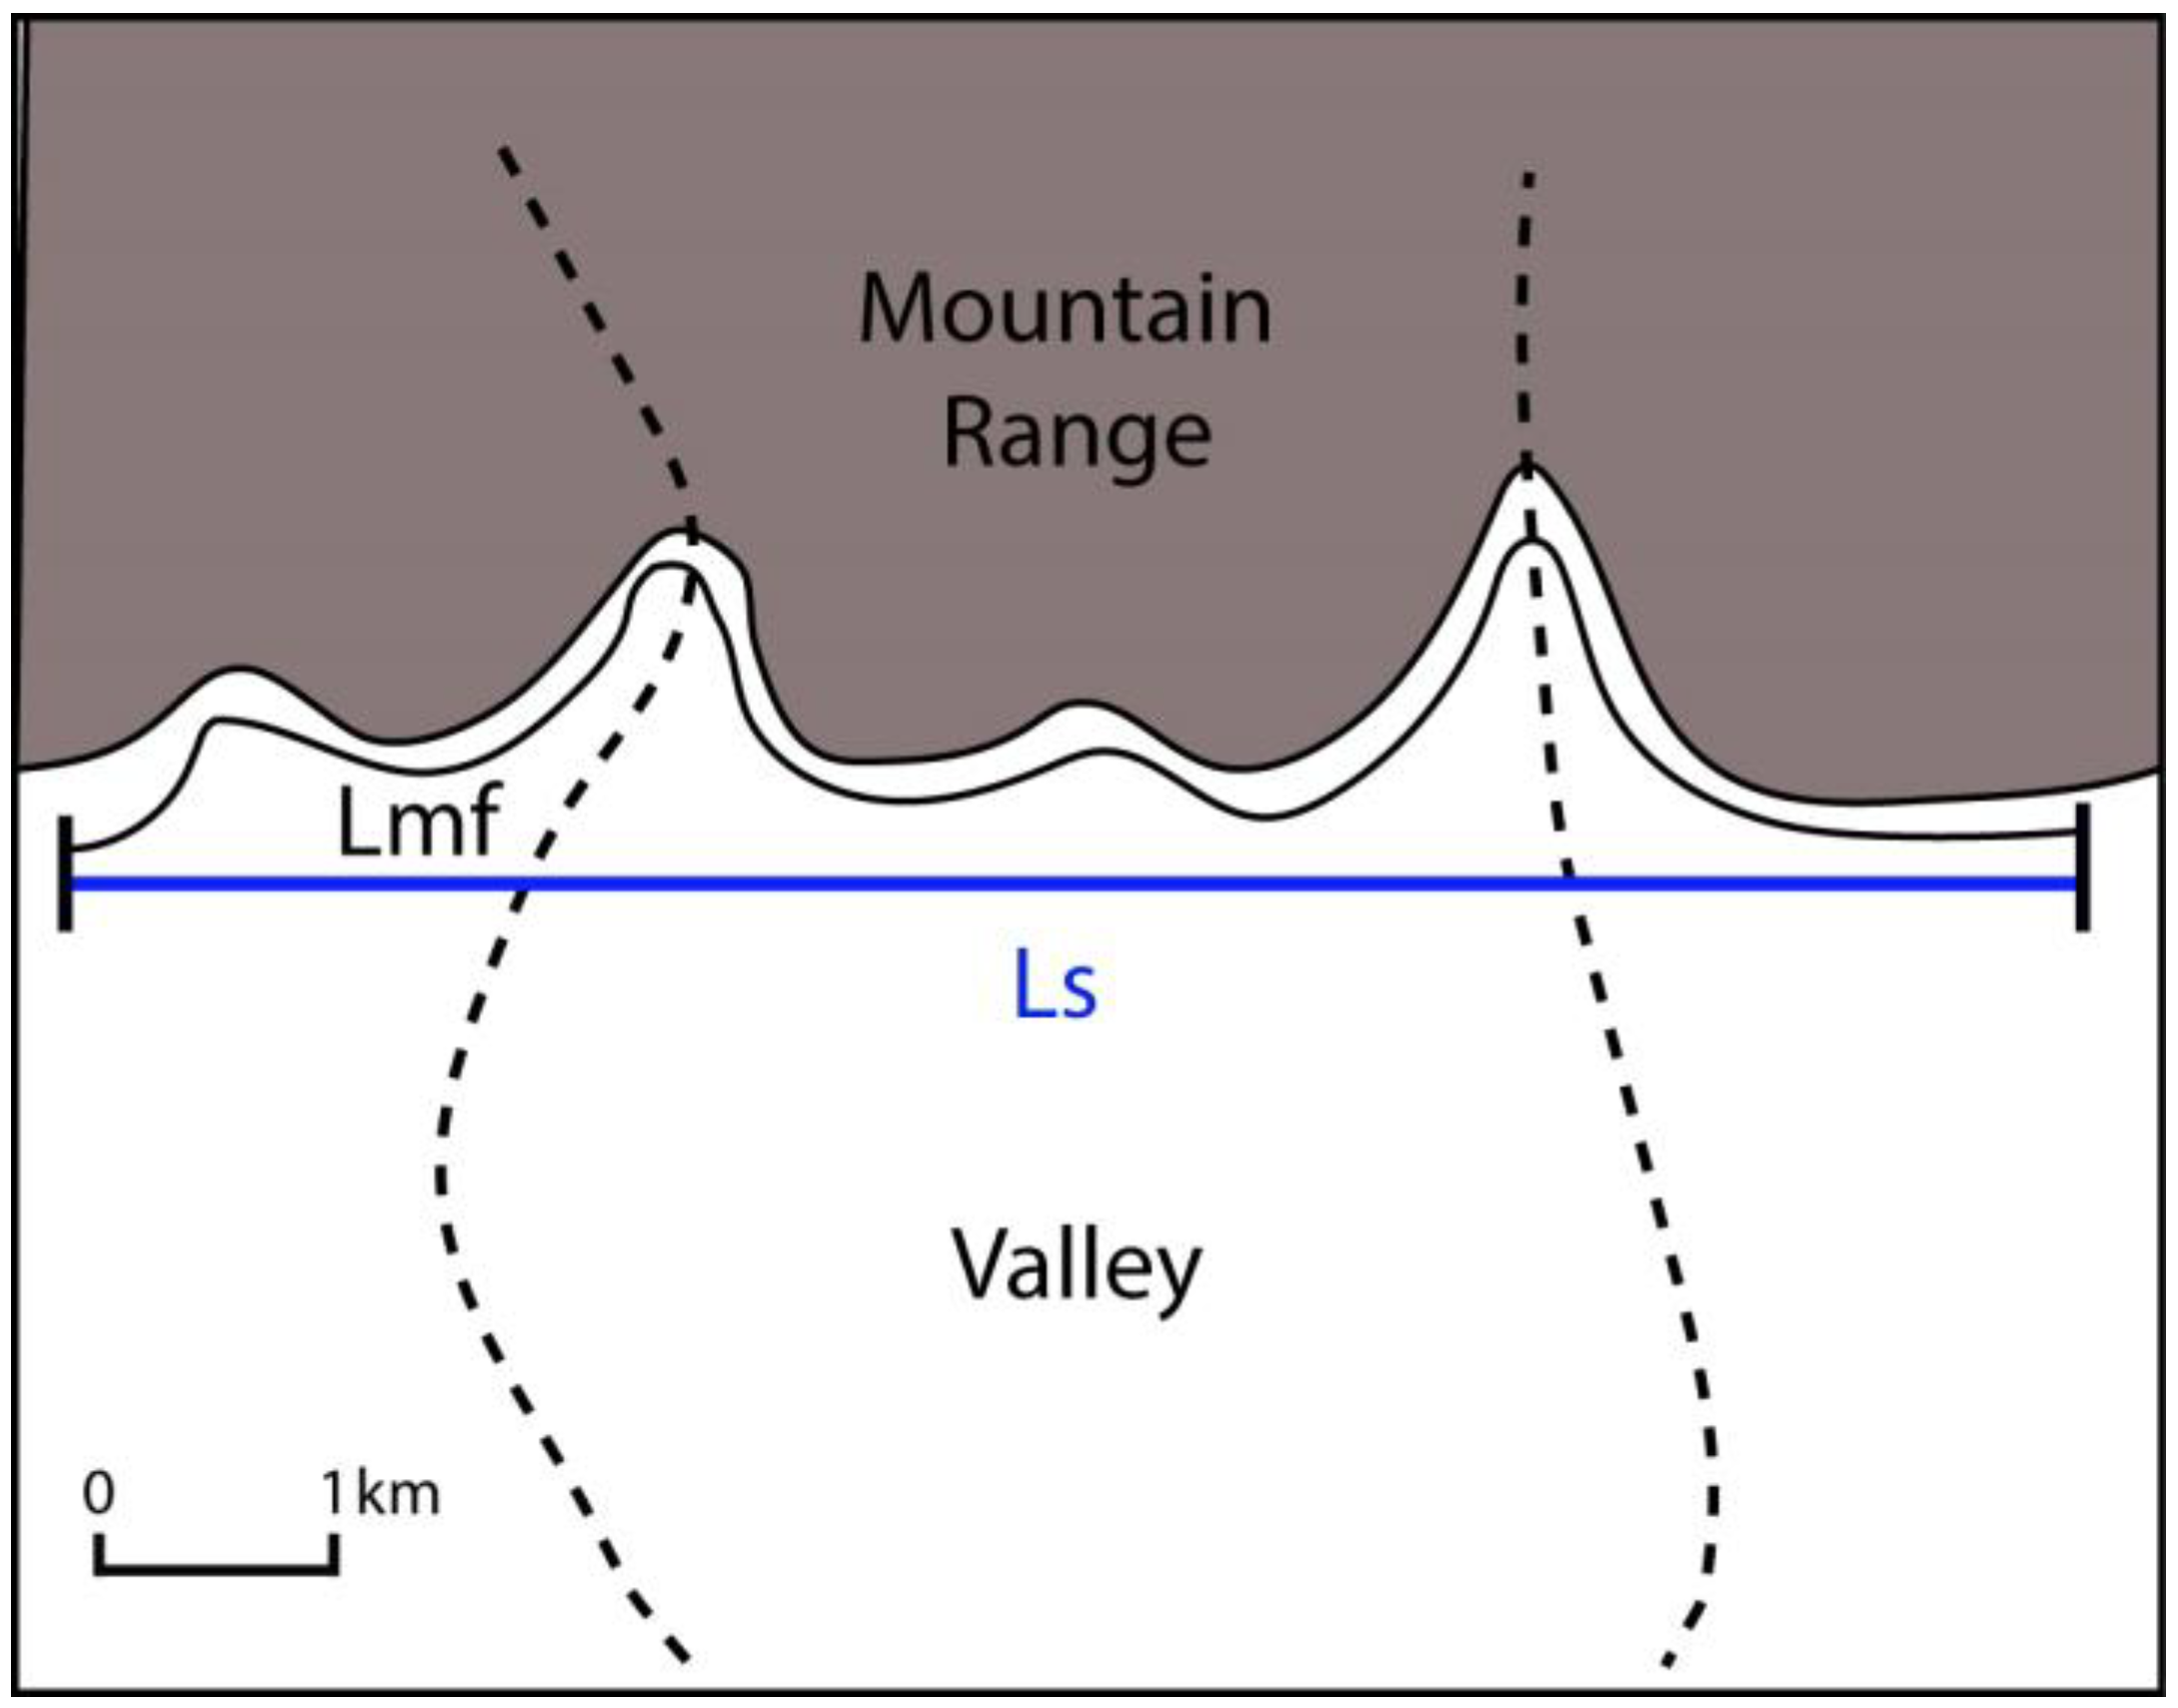
Smf = Lmf/Ls
where Lmf is the measurement of the straight distance of a mountain front, and Ls indicates the sinuous distance of the same front [8,41] (Figure 4). This index is a parameter that explains the interaction between tectonic signals and erosion [3]. Mountain fronts deformed by active fault segments indicate low Smf values, whereas higher values reflect strong actions by erosion processes.

3.2.4. Valley Floor Width to Valley Height Ratio Index (Vf)

The valley floor width to valley floor height ratio (Vf) is recognized as an observation of incised rivers marking regions undergoing upliftment, with V-shaped valley and U-shaped valley being the differentiation between them [16]. It is calculated by the formula:
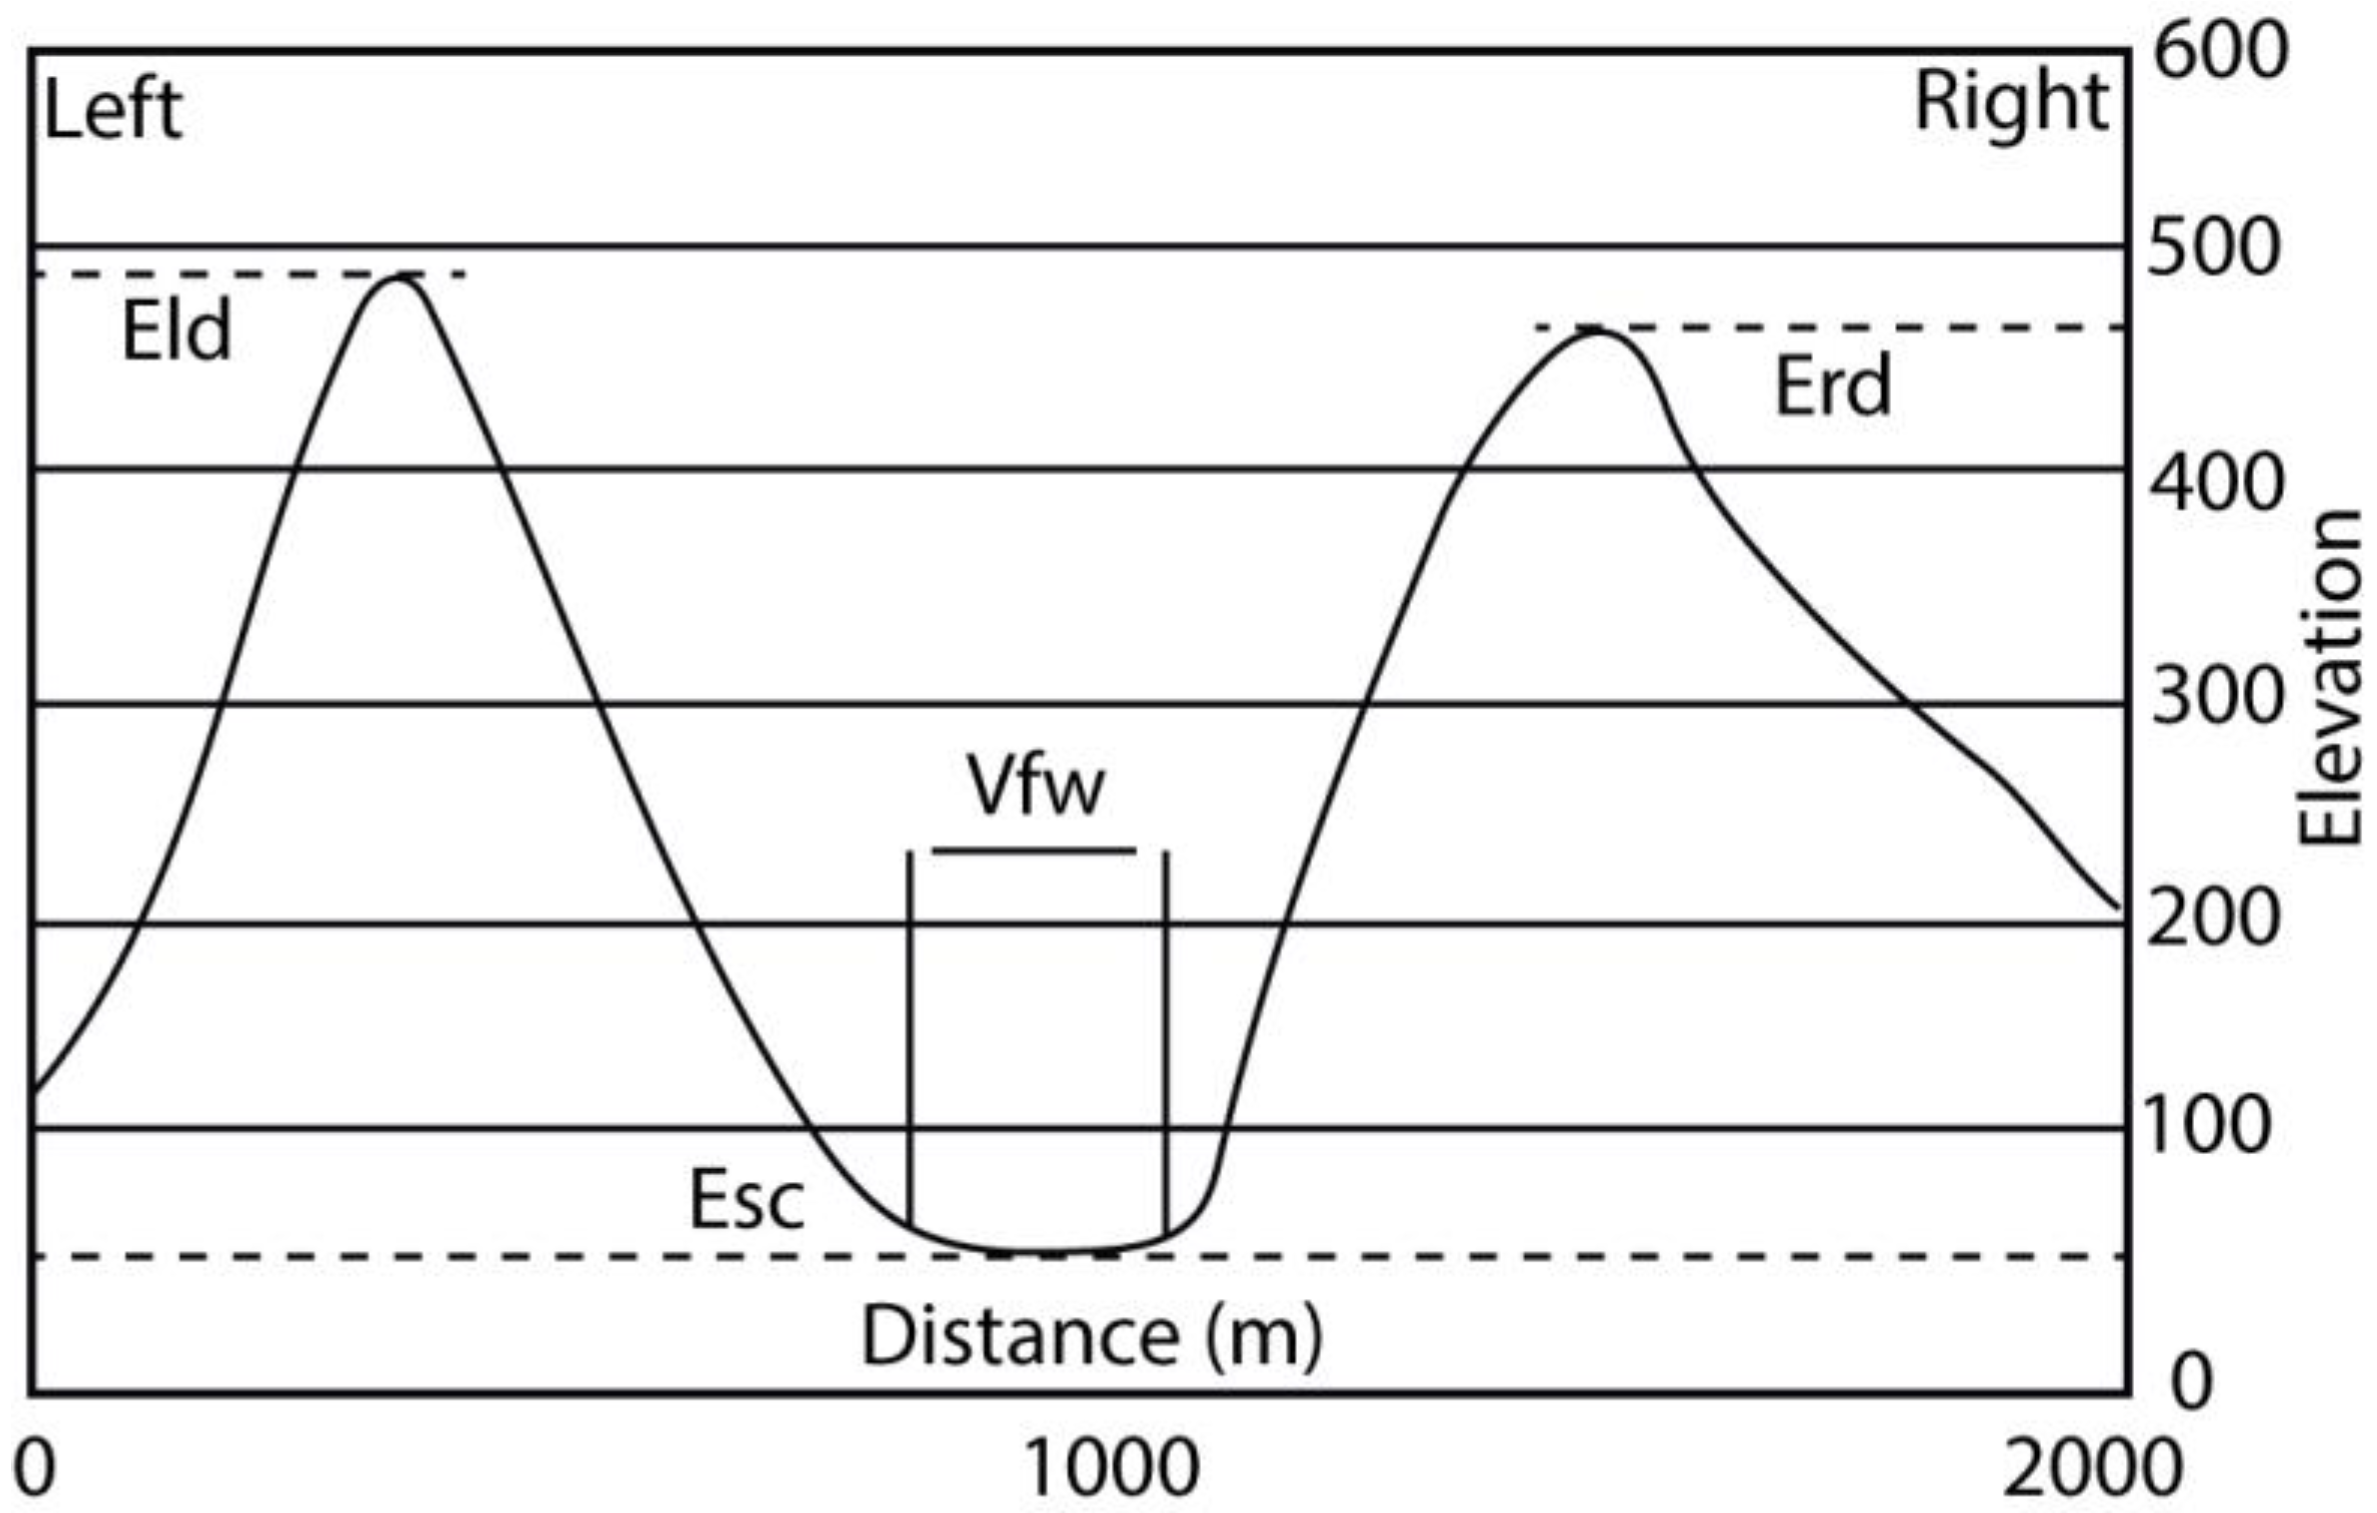
Vf = 2Vfw/[(Eld − Esc) + (Erd − Esc)
where Vfw is the width of the examined valley; Eld and Erd indicate the two elevations of the left and right valley wall, respectively; and Esc is the elevation of the valley floor (Figure 5). Generally, high Vf values indicate flat-floored valleys associated with a low rapid uplift and valley incision rates, whereas low values of Vf indicate V-shaped valleys.

4. Results

4.1. Rock Strength Index

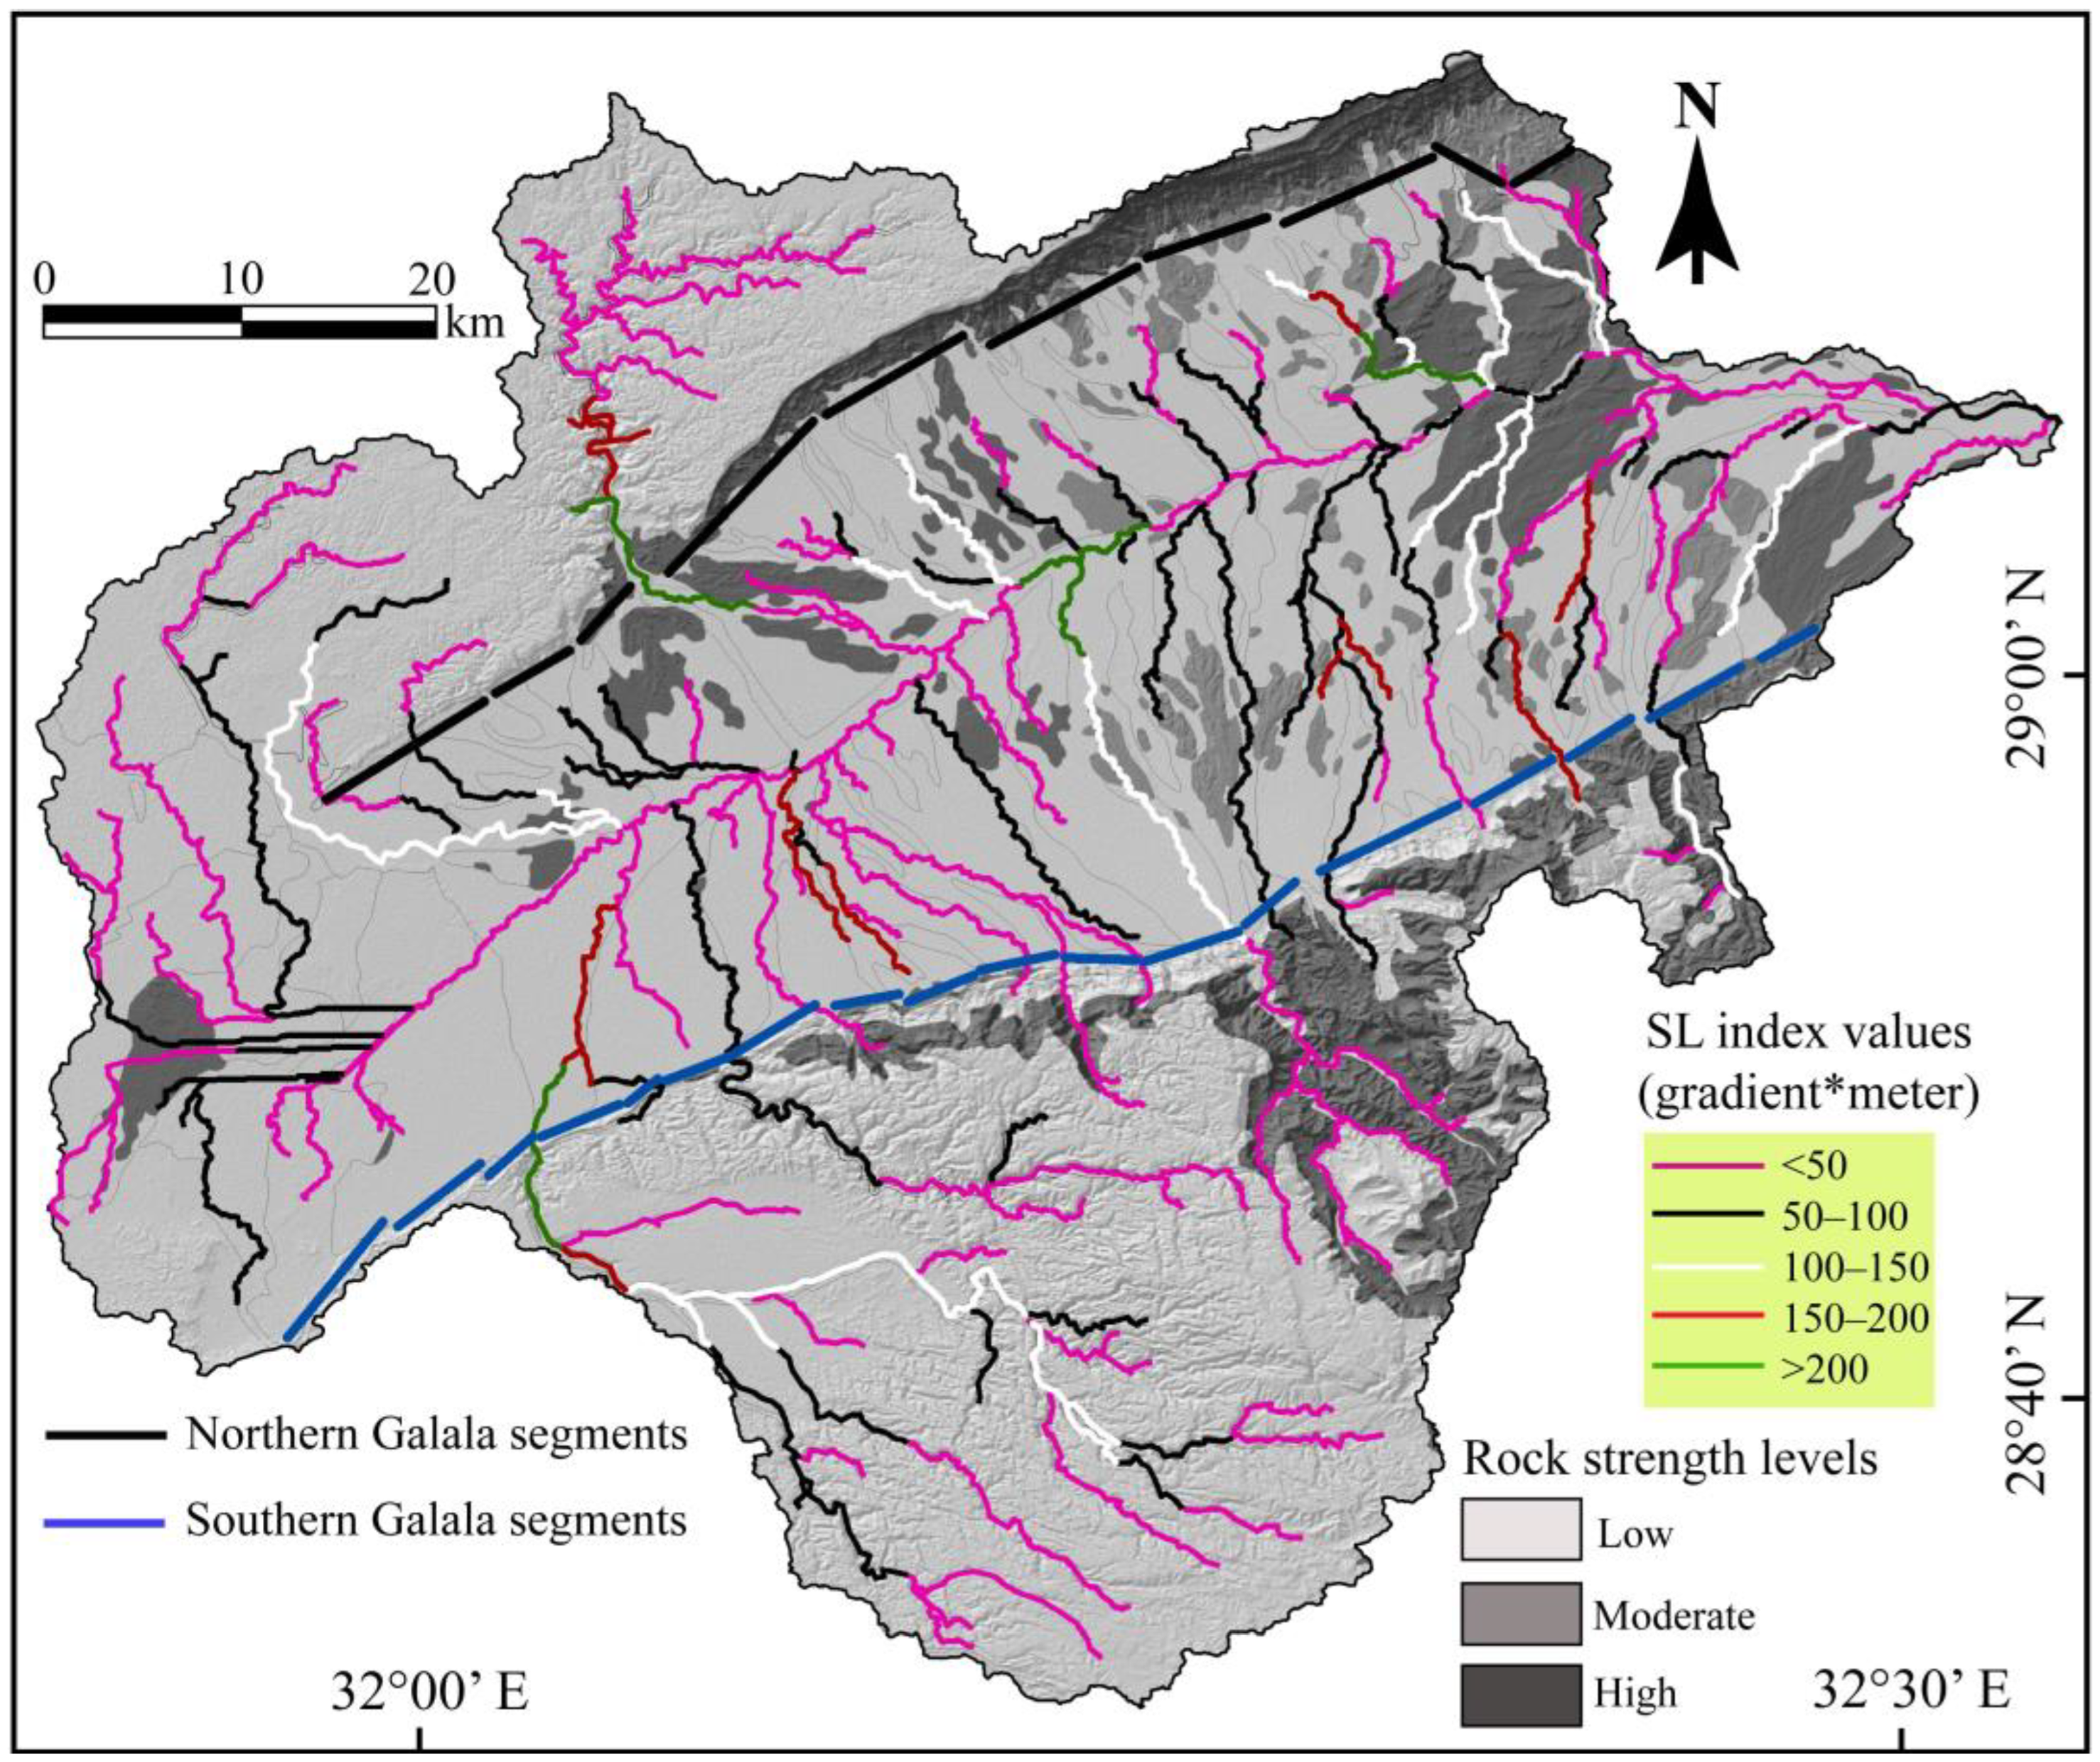
The Wadi Araba basin and mountain fronts of the Northern and Southern Galala Plateaus consist of carbonate, green shale, sandstone, dolomitic limestone, and Quaternary and Wadi deposits. In the study area, low to moderate strength rocks prevail, whereas high strength rocks were not recorded. This implies the presence of only low and medium strength levels. This, in turn, reduces the effect of the rocks and materials on the calculated morpho-tectonic indices (Figure 6).

4.2. Stream Length Gradient Index (SL)

The SL index values range from <50 to >200 over the streams and rivers draining into the Northern and Southern Galala Plateaus. The lowest SL values were recorded along the main river of the Wadi Araba basin and across most of the mountain front segments of the Southern Galala Plateau, particularly in the central segments. The second lowest values were recorded along the upstream reaches of the draining basins on the Wadi Araba basin floor. The effects of the two highest values are very weak; they were recorded mainly along the river crossing the valley between segments 7 and 8, which goes along the mountain front of the Northern Galala Plateau (Figure 6).

4.3. Mountain Front Sinuosity (Smf) Index

The calculated values of the SL index range from 1.12 to 2.82 (Table 1; Figure 7). These values confirm that some front segments are inactive, whereas the other segments reflect topographic signals of active uplifting. The lowest value was from segment 2 along the Southern Galala Plateau (S1 = 1.12), while the highest value was recorded for segment 15 of the same plateau (S15 = 2.82). In this study, there is no obvious trend along the two mountain plateaus.

4.4. Valley Floor Width to Valley Height Ratio Index (Vf)

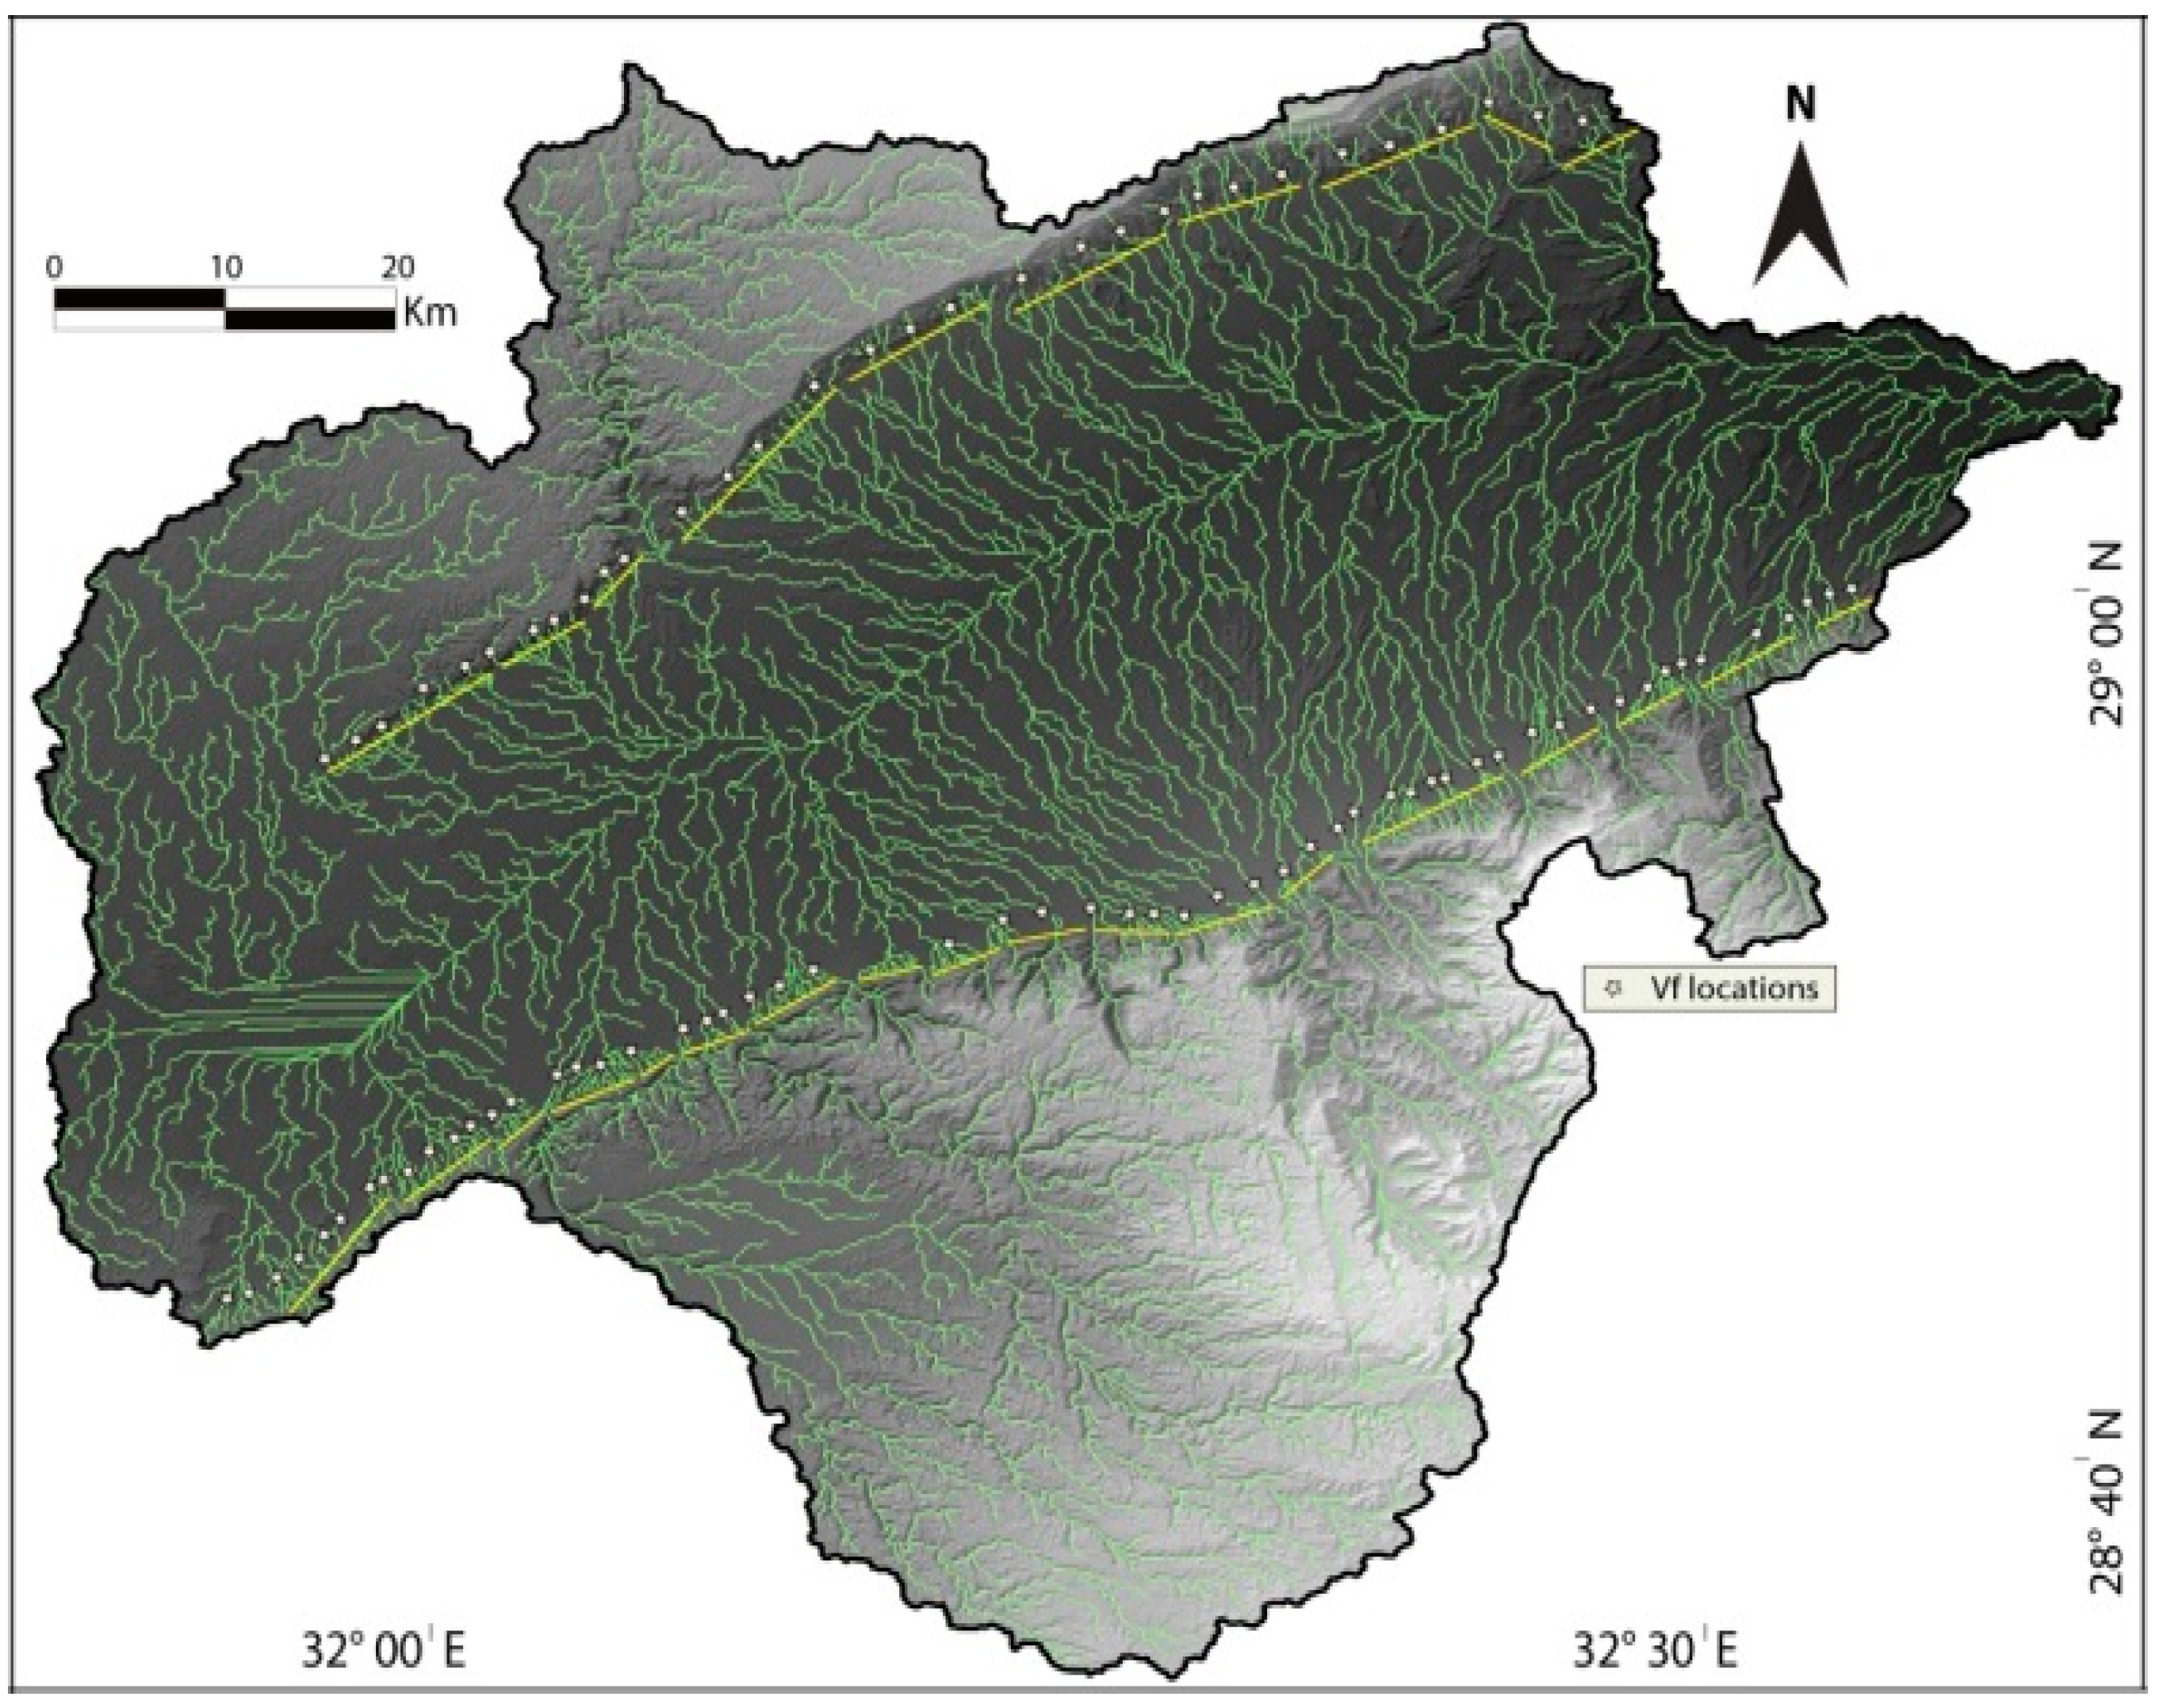
The mean values of the Vf index range between 0.53 and 1.75 (Table 1; Figure 8). These index values confirm that most of the rivers reflect a topographical transition between the “U” and “V” topographic shapes. The highest value recorded for this index was plotted for segment 16 along the Southern Galala Plateau, whereas the lowest value was calculated for segment 17 along the Northern Galala Plateau.

5. Discussion

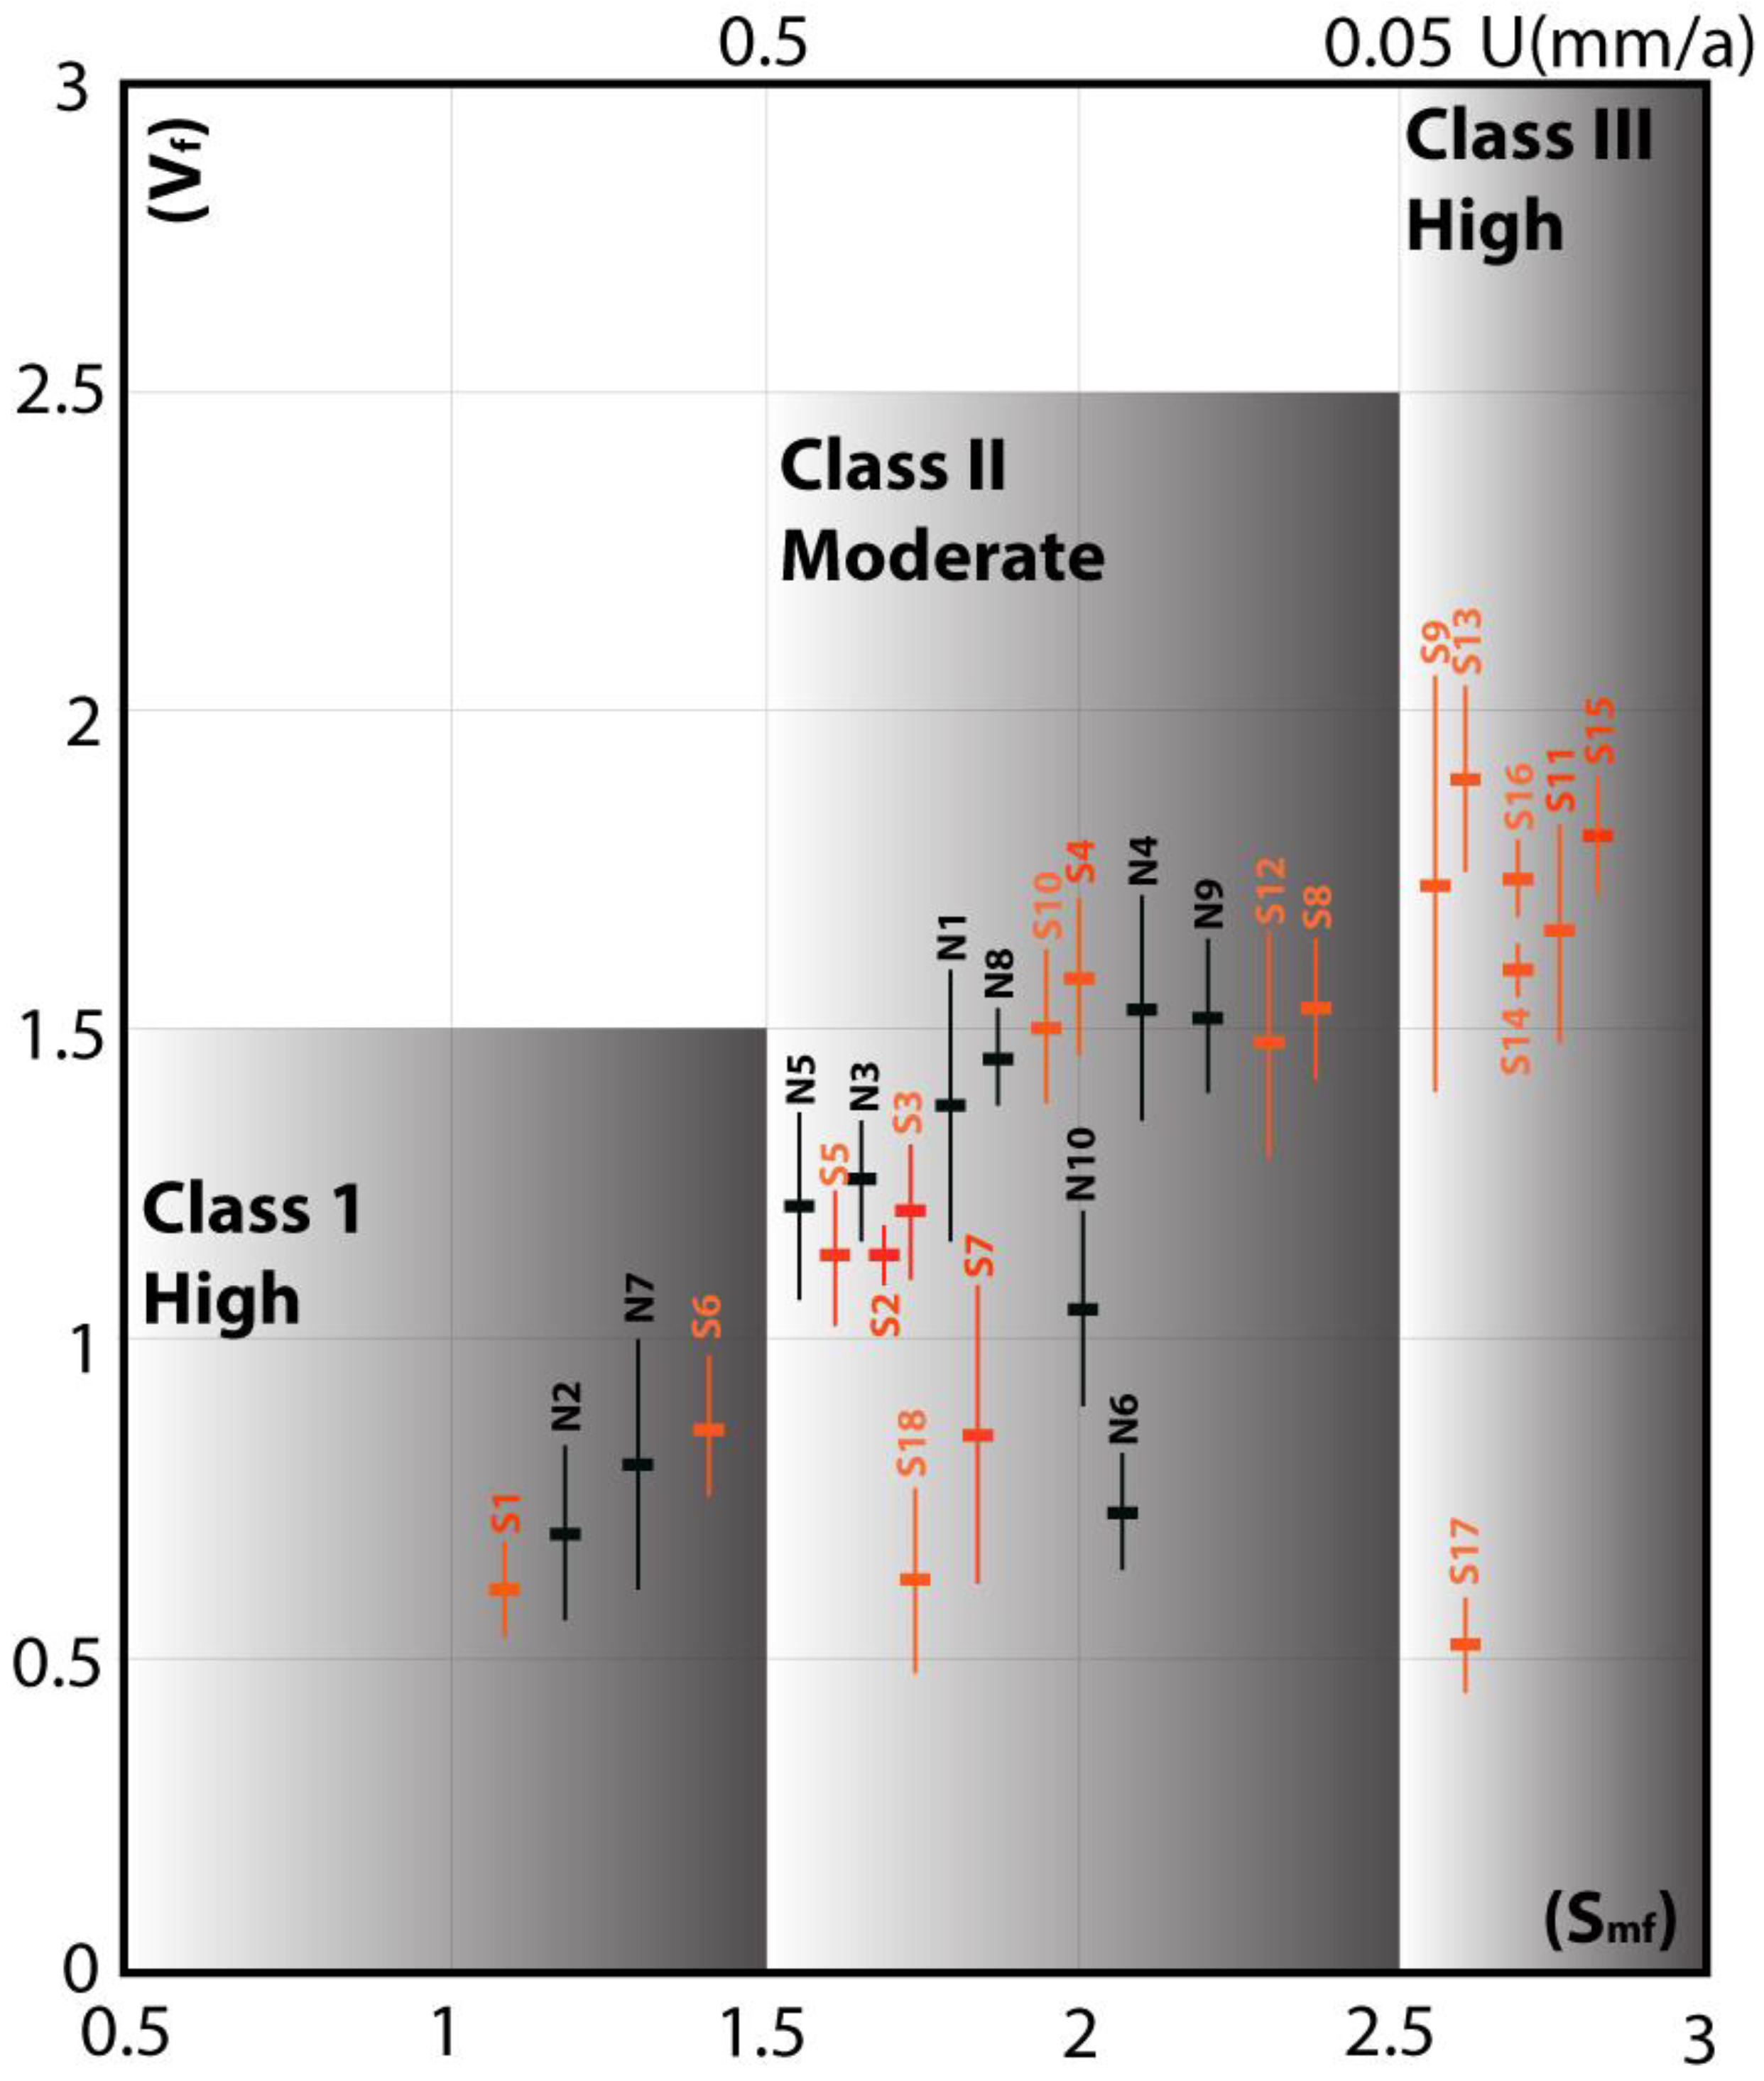
In order to discuss the various tectonic activity signals of the Wadi Araba basin, we examined and analyzed the results of all calculated morpho-tectonic indices. The results of the Smf and Vf indices show a well-correlated relationship for all mountain front segments, with the exception of segments N6, N10, S7, S17, and S18 (Figure 9). These segments have similar Smf values regarding the other segments, but they indicate a very high Vf index value. These inconsistent values indicate anomalies in the signals that give rise to very high mean values with relatively low Smf values. This case was recorded by the author of Ref. [1]. Therefore, we agree with his conclusion, which states that the Smf index values are more significant than the mean Vf values in terms of recognizing the activity of the front segments.
The authors of Ref. [2] applied a method that used Smf and Vf results to define the tectonic activity classes. Mountain fronts indicated by active signatures have low Smf values (1.00:1.50), whereas higher values of Smf (>3.00) indicate fronts that are strongly affected by erosion processes. Many authors concluded that high Smf values may explain that the range-bounding fault segment responsible for the front formation could be some distance away from the erosion-affected mountain front [1,2,11,42]. When mountain fronts’ values are plotted against Vf values, it reveals that most segments fall within the limits of Class 2 (moderate tectonic activity), which indicates uplift rates between 0.05 and 0.5 mm/yr [3]. Accordingly, the morpho-tectonic analysis shows that the Northern and Southern Galala Plateaus mostly reflect moderate signals of active tectonics. The role of rock and material resistance in streams is applied to understand the development of the topography results due to erosion actions and the stream flow over the underlying rocks and soils of different strengths. The significance of this index confirms that the SL values provide higher results when streams flow over resistant rocks or materials or uplifting regions and record lower values when rivers run over less resistant rocks or weakly uplifting areas. In this study, some of the SL values abruptly changed over the same rock units. This situation could be recorded as an anomaly, as the SL index should reflect the same values over the same rock resistance. Based on the SL index values, and due to the mountain fronts having rocks with very low and low resistance, the SL index value confirms that most mountain front segments reflect moderately active tectonic signatures.
Regarding regional seismic hazards, most of the seismic risk studies have concentrated on long-term deformation and high-strain regions that are affected by major earthquakes and significant slip rates [1,18]. Moreover, high-intensity earthquakes in continental low-strain regions produce slow slip rates (e.g., Cairo earthquake and Gulf of Suez earthquakes in Egypt in 1992 and 2012, respectively [25,26,43]; the Van earthquake in Turkey, 2011 [44]), reflecting the need for similar studies in the Gulf of Suez. Most of the Egyptian seismic signals were recorded in the northern Red Sea, including the Gulf of Suez, with some seismic activity coming from the middle and southern parts of Egypt [43,45,46]. The average magnitude of these seismic activities was recorded as (4–7). Although regional GPS observations [46] indicate that the modern strain rate along the Gulf of Suez is low, the results of this work indicate that this situation has been similar over medium and longer timescales. However, it does not mean that the Gulf of Suez region should not expect to experience a significant seismic hazard; when earthquakes are infrequent for moderately active regions, they may end up being quite serious. Therefore, more active tectonics investigations along the Gulf of Suez are needed to understand the regional tectonic hazards in the northern Red Sea area.

6. Conclusions

This work presents a preliminary investigation of a morpho-tectonic analysis of basin-generated mountain fronts and river gradients that cross the Northern and Southern Galala Plateaus. The values of the river and stream gradient analysis indicate that each segment of the fault zone reflects activity signals. It reveals some anomaly signals as well, due to abnormal SL changes over the same lithology. The analysis of the mountain front and valley floor width to valley floor height ratio indices indicates that the Wadi Araba basin has a moderate degree of tectonic activity. These calculated results are in agreement with the recorded earthquake intensities. Because the eastern segments of both the Northern and Southern Galala Plateaus have a higher tectonic activity class, they likely reflect a higher seismic risk signal with respect to the western segments of the study basin. Therefore, the Wadi Araba basin should be evaluated more carefully to provide a better understanding of the regional seismic risks or hazards.

Author Contributions

Conceptualization, M.E. and B.B.; methodology, A.A. and B.B.; software, M.E.; validation, M.E., H.B. and B.B.; formal analysis, M.E.; investigation, M.E. and A.A.; resources, M.E. and B.B.; data curation, M.E. and H.B.; writing—original draft preparation, M.E. and B.B.; writing—review and editing, A.A. and B.B.; visualization, A.A; supervision, B.B.; project administration, B.B.; funding acquisition, B.B. and A.A. All authors have read and agreed to the published version of the manuscript.

Funding

This research was funded by the Researchers Supporting Project, grant number RSP-2021-2022/296, King Saud University, Riyadh, Saudi Arabia.

Data Availability Statement

Not applicable.

Acknowledgments

The authors are thankful to the academic editor for the handling of the manuscript. The authors are also grateful to the two anonymous reviewers; their recommendations and discussions helped us to improve our manuscript. This work was discussed, modified, and improved by the structural geology and tectonics lab of the Department of Geology, Faculty of Science, Al-Azhar University.

Conflicts of Interest

The authors declare no conflict of interest.

References

  1. Yildirim, C. Relative Tectonic Activity Assessment of the Tuz Gölü Fault Zone Central Anatolia, Turkey. Tectonophysics 2014, 630, 183–192. [Google Scholar] [CrossRef]
  2. Bull, W.B.; McFadden, L.D. Tectonic Geomorphology North and South of the Garlock Fault, California. In Geomorphology in Arid Regions. Proceedings of the Eighth Annual Geomorphology Symposium, 23–24 September 1977, Binghamton, NY, USA; Doehring, D.O., Ed.; State University of New York: Albany, NY, USA, 1977; pp. 559–589. [Google Scholar]
  3. Rockwell, T.K.; Keller, E.A.; Johnson Donald, L. Tectonic Geomorphology of Alluvial Fans and Mountain Fronts near Ventura, California. In Tectonic Geomorphology. Proceedings of the 15th Annual Geomorphology Symposium, 15–26 September 2022; Allen and Unwin Publishers: Boston, MA, USA, 1985; pp. 183–207. [Google Scholar]
  4. Khalifa, A.; Çakir, Z.; Owen, L.A.; Kaya. Evaluation of the Relative Tectonic Activity of the Adıyaman Fault within the Arabian-Anatolian Plate Boundary (Eastern Turkey). Geol. Acta 2019, 17, 1–17. [Google Scholar] [CrossRef] [Green Version]
  5. Dumont, J.F.; Santana, E.; Vilema, W. Morphologic Evidence of Active Motion of the Zambapala Fault, Gulf of Guayaquil (Ecuador). Geomorphology 2005, 65, 223–239. [Google Scholar] [CrossRef]
  6. Molin, P.; Pazzaglia, F.J.; Dramis, F. Geomorphic Expression of Active Tectonics in a Rapidly-Deforming Forearc, Sila Massif, Calabria, Southern Italy. Am. J. Sci. 2004, 304, 559–589. [Google Scholar] [CrossRef]
  7. Gordon, R.G. THE PLATE TECTONIC APPROXIMATION: Plate Nonrigidity, Diffuse Plate Boundaries, and Global Plate Reconstructions. Annu. Rev. Earth Planet. Sci. 1998, 26, 615–642. [Google Scholar] [CrossRef]
  8. Mahmood, S.A.; Gloaguen, R. Appraisal of Active Tectonics in Hindu Kush: Insights from DEM Derived Geomorphic Indices and Drainage Analysis. Geosci. Front. 2012, 3, 407–428. [Google Scholar] [CrossRef]
  9. Khalifa, A. Preliminary Active Tectonic Assessment of Wadi Ghoweiba Catchment, Gulf of Suez Rift, Egypt, Integration of Remote Sensing, Tectonic Geomorphology, and Gis Techniques. Al-Azhar Bull. Sci. 2020, 31, 35–42. [Google Scholar] [CrossRef]
  10. Baruah, M.P.; Bezbaruah, D.; Goswami, T.K. Active Tectonics Deduced from Geomorphic Indices and Its Implication on Economic Development of Water Resources in South-Eastern Part of Mikir Massif, Assam, India. Geol. Ecol. Landsc. 2020, 6, 99–112. [Google Scholar] [CrossRef]
  11. El Hamdouni, R.; Irigaray, C.; Fernández, T.; Chacón, J.; Keller, E.A. Assessment of Relative Active Tectonics, Southwest Border of the Sierra Nevada (Southern Spain). Geomorphology 2008, 96, 150–173. [Google Scholar] [CrossRef]
  12. Wells, S.G.; Bullard, T.F.; Menges, C.M.; Drake, P.G.; Karas, P.A.; Kelson, K.I.; Ritter, J.B.; Wesling, J.R. Regional variations in tectonic geomorphology along a segmented convergent plate boundary, pacific coast of costa rica. Geomorphology 1988, 1, 239–265. [Google Scholar] [CrossRef]
  13. Medina-Cascales, I.; García-Tortosa, F.J.; Martin-Rojas, I.; Pérez-Peña, J.V.; Alfaro, P. Tectonic Geomorphology of an Active Slow-Moving, Intrabasinal Fault: The Galera Fault (Guadix-Baza Basin, Central Betic Cordillera, Southern Spain). Geomorphology 2021, 393, 107941. [Google Scholar] [CrossRef]
  14. Khalifa, A.; Çakir, Z.; Owen, L.A.; Kaya, Ş. Morphotectonic Analysis of the East Anatolian Fault, Turkey. Turk. J. Earth Sci. 2018, 27, 110–126. [Google Scholar] [CrossRef]
  15. Ul-hadi, S.; Khan, S.D.; Owen, L.A.; Khan, A.S.; Sciences, A. Geomorphic Response to an Active Transpressive Regime: A Case Study along the Chaman Strike-Slip Fault, Western Pakistan. Earth Surf. Process. Landf. 2013, 264, 250–264. [Google Scholar] [CrossRef]
  16. Bhat, M.A.; Dar, T.; Bali, B.S. Morphotectonic Analysis of Aripal Basin in the North-Western Himalayas (India): An Evaluation of Tectonics Derived from Geomorphic Indices. Quat. Int. 2020, 568, 103–115. [Google Scholar] [CrossRef]
  17. Sharifi Paichoon, M. Tectonic Geomorphology and Quaternary Evolution of Playas: A Case Study of Ernan Playa, Central Iran. Arab. J. Geosci. 2021, 14, 1–18. [Google Scholar] [CrossRef]
  18. Khalifa, A.; Bashir, B.; Alsalman, A.; Öğretmen, N. Morpho-Tectonic Assessment of the Abu-Dabbab Area, Eastern Desert, Egypt: Insights from Remote Sensing and Geospatial Analysis. ISPRS Int. J. Geo-Inf. 2021, 10, 784. [Google Scholar] [CrossRef]
  19. Bosworth, W. Geological Evolution of the Red Sea: Historical Background, Review, and Synthesis; Springer: Berlin/Heidelberg, Germany, 2015; Volume 3. [Google Scholar] [CrossRef]
  20. Moustafa, A.R. Block Faulting in the Gulf of Suez. In Proceedings of the 5th Egypt Egyptian General Petroleum Company, Cairo, Egypt; 1976. Unpublished work. [Google Scholar]
  21. Bosworth, W.; Taviani, M.; Rasul, N.M.A. Neotectonics of the Red Sea, Gulf of Suez and Gulf of Aqaba. In Neotectonics of the Red Sea, Gulf of Suez and Gulf of Aqaba; Springer: Cham, Switzerland, 2019; pp. 10–35. [Google Scholar] [CrossRef]
  22. Said, S.M.; Sakran, S. Geometry and Kinematics of Right-Lateral Transpressional Faults and Growth Folds, the Western Side of the Gulf of Suez, Egypt. Geol. J. 2021, 57, 276–291. [Google Scholar] [CrossRef]
  23. Moustafa, A.R. Internal Structure and Deformation of an Accommodation Zone in the Northern Part of the Suez Rift. J. Struct. Geol. 1996, 18, 93–107. [Google Scholar] [CrossRef]
  24. Moustafa, A.R. Controls on the Development and Evolution of Transfer Zones: The Influence of Basement Structure and Sedimentary Thickness in the Suez Rift and Red Sea. J. Struct. Geol. 1997, 19, 755–768. [Google Scholar] [CrossRef]
  25. Kebeasy, R.M. Seismicity of Egypt. In Geology of Egypt; Said, R., Ed.; A. A. Balkema: Rotterdam, The Netherlands, 1990; pp. 51–59. [Google Scholar]
  26. Badawy, A. Seismicity of Egypt. Seismol. Res. Lett. 2005, 76, 149–160. [Google Scholar] [CrossRef]
  27. Alsharhan, A.S.; Salah, M.G. Lithostratigraphy, Sedimentology and Hydrocarbon Habitat of the Pre-Cenomanian Nubian Sandstone in the Gulf of Suez Oil Province, Egypt. GeoArabia 1997, 2, 385–400. [Google Scholar] [CrossRef]
  28. Corporation, C.; Conoco, G.P.; General Petroleum Corporation. Geological Map of Egypt, Scale 1:500,000; Gebel Hamata: Cairo, Egypt, 1987. [Google Scholar]
  29. Moustafa, A.R.; Khalil, S.M. Structural Setting and Tectonic Evolution of the Gulf of Suez, NW Red Sea and Gulf of Aqaba Rift Systems. In The Geology of Egypt; Springer: Cham, Switzerland, 2020; pp. 295–342. [Google Scholar] [CrossRef]
  30. Moustafa, A.R.; Khalil, M.H. Superposed deformation in the northern suez rift, egypt relevance to hydrocarbons exploration. J. Pet. Geol. 1995, 18, 245–266. [Google Scholar] [CrossRef]
  31. Radaideh, O.M.A.; Grasemann, B.; Melichar, R.; Mosar, J. Detection and Analysis of Morphotectonic Features Utilizing Satellite Remote Sensing and GIS: An Example in SW Jordan. Geomorphology 2016, 275, 58–79. [Google Scholar] [CrossRef] [Green Version]
  32. Khalifa, A.; Çakır, Z.; Kaya, Ş.; Gabr, S. ASTER Spectral Band Ratios for Lithological Mapping: A Case Study for Measuring Geological Offset along the Erkenek Segment of the East Anatolian Fault Zone, Turkey. Arab. J. Geosci. 2020, 13, 1–8. [Google Scholar] [CrossRef]
  33. Khalifa, A.; Bashir, B.; Çakir, Z.; Kaya, Ş.; Alsalman, A.; Henaish, A. Paradigm of Geological Mapping of the Adıyaman Fault Zone of Eastern Turkey Using Landsat 8 Remotely Sensed Data Coupled with Pca, Ica, and Mnfa Techniques. ISPRS Int. J. Geo-Inf. 2021, 10, 368. [Google Scholar] [CrossRef]
  34. Bhattarai, I.; Gani, N.D.; Xue, L. Geomorphological Responses of Rivers to Active Tectonics along the Siwalik Hills, Midwestern Nepalese Himalaya. J. Mt. Sci. 2021, 18, 1268–1294. [Google Scholar] [CrossRef]
  35. Obeidat, M.; Awawdeh, M.; Al-Hantouli, F. Morphometric Analysis and Prioritisation of Watersheds for Flood Risk Management in Wadi Easal Basin (WEB), Jordan, Using Geospatial Technologies. J. Flood Risk Manag. 2021, 14, e12711. [Google Scholar] [CrossRef]
  36. Khalifa, A.; Bashir, B.; Alsalman, A.; Bachir, H. Morphometric-Hydro Characterization of the Coastal Line between El-Qussier and Marsa-Alam, Egypt: Preliminary Flood Risk Signatures. Appl. Sci. 2022, 12, 6264. [Google Scholar] [CrossRef]
  37. Han, Z.; Yang, F.; Li, Y.; Dou, J.; Chen, N.; Hu, G.; Chen, G.; Xu, L. Gis-Based Three-Dimensional Sph Simulation for the 11 April 2018 Yabakei Landslide at Oita Nakatsu, Japan. Water 2021, 13, 3012. [Google Scholar] [CrossRef]
  38. Selby, M.J. A Rock Mass Strength Classification for Geomorphic Purposes: With Tests from Antarctica and New Zealand. Z. Geomorphol. 1980, 24, 31–51. [Google Scholar] [CrossRef]
  39. Ezati, M.; Gholami, E. Neotectonics of the Central Kopeh Dagh Drainage Basins, NE Iran. Arab. J. Geosci. 2022, 15, 1–18. [Google Scholar] [CrossRef]
  40. Hack, J.T. Stream-Profile Analysis and Stream-Gradient Index. J. Res. United States Geol. Surv. 1973, 1, 421–429. [Google Scholar]
  41. Faghih, A.; Samani, B.; Kusky, T.; Khabazi, S.; Roshanak, R. Geomorphologic Assessment of Relative Tectonic Activity in the Maharlou Lake Basin, Zagros Mountains of Iran. Geol. J. 2012, 47, 30–40. [Google Scholar] [CrossRef]
  42. Silva, P.G.; Goy, J.L.; Zazo, C.; Bardají, T. Faulth-Generated Mountain Fronts in Southeast Spain: Geomorphologic Assessment of Tectonic and Seismic Activity. Geomorphology 2003, 50, 203–225. [Google Scholar] [CrossRef]
  43. Badawy, A. Historical Seismicity of Egypt. Acta Geod. Geophys. Hung. 1999, 34, 119–135. [Google Scholar]
  44. Elliott, J.R.; Copley, A.C.; Holley, R.; Scharer, K.; Parsons, B. The 2011 Mw 7.1 Van (Eastern Turkey) Earthquake. J. Geophys. Res. 2013, 118, 1619–1637. [Google Scholar] [CrossRef]
  45. Ambraseys, N.N.; Melville, C.P.; Adams, R.D. The Seismicity of Egypt, Arabia and the Red Sea. In The Seismicity of Egypt, Arabia and the Red Sea; University of Cambridge: Cambridge, UK, 1994. [Google Scholar] [CrossRef]
  46. Hosny, A.; Omar, K.; Ali, S.M. The Gulf of Suez Earthquake, 30 January 2012, Northeast of Egypt. Rend. Lincei 2013, 24, 377–386. [Google Scholar] [CrossRef]
Figure 1. False color composite and google earth images showing location of the study basin.
Applsci 12 12152 g001
Figure 2. Detailed geological map of the study basin, modified from [28].
Applsci 12 12152 g002
Figure 3. Stream length gradient index scheme (modified from [40]).
Applsci 12 12152 g003
Figure 4. Scheme of calculation of mountain front sinuosity index, Smf.
Applsci 12 12152 g004
Figure 5. Scheme of calculation valley floor width to valley height ratio index, Vf.
Applsci 12 12152 g005
Figure 6. SL indices along the rivers and rock resistance levels according to the investigated basin.
Applsci 12 12152 g006
Figure 7. Segments of the Northern and Southern Galala Plateaus.
Applsci 12 12152 g007
Figure 8. Location of the Vf index along the stream crossing Northern and Southern Galala Plateaus.
Applsci 12 12152 g008
Figure 9. Plot of Smf and Vf for the mountain fronts of all segments and different tectonic activity classes. Vertical bars indicate the Vf index standard deviation for values.
Applsci 12 12152 g009
Table 1. Values of the mountain front sinuosity and valley floor width to valley floor height ratio of the study segments; the average classes of relative activity are presented as well. N: Northern Galala Plateau and S: Southern Galala Plateau.
Mountain FrontsSmfVfClass
N11.831.37Moderate
N21.220.70High
N31.651.26Moderate
N42.101.55Moderate
N51.551.30Moderate
N62.110.72Moderate
N71.380.79High
N81.841.45Moderate
N92.211.51Moderate
N102.001.10Moderate
S11.120.60High
S21.701.67Moderate
S31.731.71Moderate
S42.001.62Moderate
S51.611.70Moderate
S61.890.77High
S71.820.84Moderate
S82.381.56Moderate
S92.571.70Low
S101.921.50Moderate
S112.781.70Low
S122.321.48Moderate
S132.611.81Low
S142.691.65Low
S152.831.74Low
S162.691.75Low
S172.600.53Low
S181.700.71Moderate
Publisher’s Note: MDPI stays neutral with regard to jurisdictional claims in published maps and institutional affiliations.