Article

Process Improvement and Application of Pavement Management System Based on Pavement Conditions in Jeju Island

Department of Highway & Transportation Research, Korea Institute of Civil Engineering and Building Technology, Goyang-daero 283, Ilsanseo-gu, Goyang-si 10223, Republic of Korea
*
Author to whom correspondence should be addressed.
Appl. Sci. 2022, 12(24), 12548; https://doi.org/10.3390/app122412548
Submission received: 18 November 2022 / Revised: 2 December 2022 / Accepted: 6 December 2022 / Published: 7 December 2022
(This article belongs to the Section Civil Engineering)

Abstract

:
The objective of this study is to provide a process that can be applied in preparation for the introduction of an efficient and systematic pavement management system. This process includes features for selecting pavement segmentation (for management) and priority based on a cumulative difference approach(CDA), starting from the development of an index that reflects the pavement condition and current distribution status. For the index, which can reflect the current pavement conditions of sections to be managed, this study proposes a basic model form and establishes a simple modeling plan that uses only 3 points (maximum value, minimum value, and management standard) for typical flaws. For pavement segmentation, this study establishes a plan that uses a moving average combined with a minimum maintenance length standard to reflect existing condition distribution characteristics as much as possible. Finally, for priority, this study establishes a plan that performs selections using the averages of the index values of the sections that require maintenance, as determined via the segmentation step.

1. Introduction

Each of South Korea’s general road management organizations (Ministry of Land, Infrastructure, and Transport, and regional land management offices, local governments, etc.) manages roads of various classes (levels) within its scope of authority [1]; however, the same management standards are applied across these organizations, even though they have differently sized budgets that vary according to their management lengths and road classes. Although the actual level of management (surface condition) inevitably varies according to the size of the budget, each managing organization operates in a similar form regardless of the presence or absence of standards (condition indexes) for road management. However, there are limits to the reliability and assessment capabilities of such an approach.
To overcome these limitations and manage pavements in a systematic manner, a pavement management system (PMS) can be used. Presently, PMSs are being used on some high-level roads (expressways, national highways, special/metropolitan roads, etc.) in most large-scale organizations. South Korea’s main road management organizations (Ministry of Land, Infrastructure, and Transport and Korea Expressway Corporation) have been using PMSs to systematically manage pavements since 1990. To allow policy makers and road managers to ascertain pavement conditions at a network level and decide upon maintenance construction methods, the highway pavement condition index (HPCI) is used for expressways, whereas the national highway pavement condition index (NHPCI) is used for national highways. Additionally, South Korea developed its own indexes (Seoul Pavement Index or SPI, Busan Pavement Condition Index or BPCI, etc.), which are used in major special/metropolitan cities. Since 2020, a “Basic Law on Sustainable Infrastructure Management” has been in effect to systematically maintain and improve the performance of major national infrastructure, which has expanded the importance and necessity of PMSs. As such, comprehensive inspections of all expressways and national highways have been performed each year since 2021 [2], and preparations are being made to construct systems that will be used to perform systematic maintenance at organizations that currently manage lower-level roads, such as local roads and city roads.
However, even though indexes, such as HPCI and NHPCI have been developed and are used in PMSs, their corresponding approaches were designed to find condition indexes within a normal range based on managing roads with long lengths of several thousand kilometers or more (network level). As such, these indexes may have limitations in reflecting and managing regional characteristics (traffic environment, traffic volume, climate, etc.) for organizations that manage roads with shorter lengths, such as local roads, which are the typical focus of these organizations.
In one of these regions, Jeju Island, the pavement rate is 99%, second only to that of the capital area of Seoul, whereas the road length is long (2076 km·lane, as of 2021), with the main roads consisting of local roads. Furthermore, Jeju has the geographical characteristics of an island, with sea on four sides, rather than those of an inland area, and as South Korea’s main tourism region, its traffic volume is increasing rapidly each year because of continuous social and cultural development. As such, there is an increasing need for a system that can systematically manage pavements in the area [3].
Therefore, this study commences with the development of a performance index that reflects the special properties, such as distress distribution, of asphalt pavements, which constitute most of the pavements in Jeju Island. Subsequently, this study proposes an easier process that can be used in pavement management systems for the selection of repair sections, thereby providing systematic management and ensuring appropriate pavement condition levels.

2. Literature Review

The widespread development of pavements is a driver of national economic development and a major social overhead capital that, in many nations, is assigned huge budgetary sums for maintenance and new constructions every year. Therefore, beginning with the American Association of State Highway Officials (AASHO) road tests in the United States in the 1950s, it has become clear that there is a need for pavement management systems (PMS) to manage pavements efficiently. Thus, accordingly, various studies have been actively conducted in the last 70 years to manage pavements more systematically and efficiently. However, one of the problems that pavement engineers must solve is the development of a pavement maintenance and rehabilitation method that can provide a satisfactory level of service for road users.

2.1. Studies on Pavement Condition Indexes and Factors That Influence Performance

Most pavement condition indexes that are currently in use were developed to reflect the road management characteristics of a particular organization. Therefore, these indexes are typically not very applicable to other countries and other organizations. Although a variety of studies on efficient management have been attempted, it remains difficult to incorporate individually developed indexes into indexes that are actually used by management organizations. Individual researchers are also attempting various studies for efficient management, but it is difficult to reflect the findings in the index used for the actual management strategies as they are being developed independently. In addition, it is true that it is difficult to properly reflect a more diverse distribution of distresses due to aging and abnormal weather that have not been experienced so far.
To address this, separate indexes have been developed for each type of fault that constitutes the pavement condition index, and thus a combined index that merges these individual indexes has been proposed [4]. The final index that was proposed in the aforementioned study was in the form of an optimal function between dependent and independent variables based on nonlinear multiple regression analysis. The factors that affect surface distress (SD) and international roughness index (IRI), which constitute the pavement condition index, were analyzed, and the results showed that SD is most related to IRI, deicing amount, and temperature range, whereas IRI is most related to age, temperature range, and the number of days with precipitation [5].
The pavement condition index (PCI) is generally used in PMSs to synthesize and quantify the overall severity and amount of distress in a pavement surface [6]. In today’s environment, where worn pavement lengths are increasing in a geometrical trend, PCI can be used as a quantitative standard for performing rehabilitation. The relationships between distress type/severity and PCI have been analyzed with straightforward and adaptive modeling, typically using artificial neural network (ANN) techniques from among the various data analysis techniques that are presently available. The results showed that pavement condition is most affected by patching, longitudinal/transverse cracks, polished aggregate, alligator cracks, and raveling [7].
A previous study analyzed the factors that affect pavement conditions on Jeju Island, which is the same study target region as in this paper. Their results showed that pavement condition was most affected by surface distress, rut depth, IRI, temperature, precipitation, equivalent single axle loads (ESALs), number of days with precipitation, annual temperature range, and heat wave days. These trends were different from the factors that affect pavement conditions in inland areas [8].

2.2. Studies on Development of Pavement Management Strategies for Local Roads

In South Korea, as of 2021, the total road length consists of 4.3% expressways, 12.5% national highways, 19.1% special/metropolitan roads, 16.1% local roads, and 47.9% city roads and roads of lower management ranks. For close to 75% of this road length, excluding expressways, national highways, and some special/metropolitan roads (in Seoul and Busan), there is no quantitative standard that can be used to evaluate road conditions, which unavoidably limits systematic road management [9]. To manage roads systematically, an evaluation index that can be used for all roads has been developed via the analysis of the damage characteristics of asphalt pavements based on pavement condition survey data from each region (in city units) [10]. In that study, it was proposed that pavement structural strength must be considered as a very important variable when establishing a maintenance and rehabilitation strategy and that the skid resistance index is very important for allowing road users to travel safely in areas with heavy rainfall.
In addition, because there is a proportional relationship between pavement distress and vehicle operating cost (VOC), there is a need for a well-defined condition-rating system that reflects regional characteristics, including not only physical factors but also climate factors, which can affect performance. The results of using multi-attribute utility theory (MAUT) model based have shown that the condition of an asphalt pavement is affected by rut depth, longitudinal cracks, and the type of base, in that order. With regard to climate factors, it was determined that rainfall and atmospheric temperature are typically influential [11]. In addition, researchers have proposed multi-index condition indicators for urban road sections, such as the overall pavement condition index (OPCI), which uses a combined index concept in conjunction with indexes for structural capacity and skid resistance that include typical pavement distress in addition to climate characteristics [12].

2.3. Methods of Road Segmentation

Generally, among the processes involved in pavement management and rehabilitation, the logic of selecting sections for repair has a large role in not only cost efficiency but also maintaining regular performance [13]. However, up to now, research has focused mainly on developing maintenance methods, and relatively few strategies have been established for selecting sections for repair. In addition, although these researchers continue to conduct studies on selecting sections that require management procedures, such as pavement maintenance and rehabilitation, there are limitations to evaluating the quantitative effects of a proposed strategy due to the large number of external variables. In reality, it can be said that this is an area where limitations inherently exist, thus preventing road managers from acquiring the evidentiary data that they need the most. Generally, extended lengths of pavement are managed at a time, and there are inconsistencies when data for analysis are constructed using large amounts of survey data. Therefore, management is performed based solely on basic typical values (average, standard deviation, etc.). Inevitably, as the length of the road increases, the reliability of this approach decreases [14].
Pavement segmentation methods that have been used up to now include the cumulative difference approach (CDA), absolute difference approach (ADA), Bayesian segmentation algorithm (BSA) [15], classification and regression trees (CART), and quality control charts (C-Chart) [16]. Of these, CDA is currently recommended by the United States’ Federal Highway Administration (FHWA) for the segmentation of homogenous sections [17].
CDA is a method that can cumulate and visually plot the differences between the averages for the analyzed sections and the index values of each unit section, and is a relatively simple and powerful tool that can perform segmentation based on the sign (negative or positive) of the slope. The objective of this study is to propose an easy process; therefore, this study performed pavement segmentation based on surface performance data (crack rate, rut depth, roughness (IRI)) for asphalt pavement using CDA, which is accessible and recommended by the American Association of State Highway and Transportation Officials (AASHTO) `93 guide [18].

3. Methodology

3.1. Dataset Construction

This study used pavement surface condition survey data that were previously collected from 10 local roads on Jeju Island, and the database was constructed based on survey data in 10-m units. The database consisted of road names, directions, lanes, starting points, end points, sections, occurrence areas according to severity of each fault (linear cracks, patching, alligator cracks, potholes), total crack rates, rut depths, roughness, and location information (GPS-based latitude and longitude) [3].

3.2. Condition Index Development

In this study, a pavement condition index (PCI) was developed to reflect the characteristics of road surfaces resulting from fault occurrences and management statuses in a given region, based on the management standards and distribution of distress types in Jeju Island pavements. In addition, this study aimed to develop a PCI that is easy to apply to lower-level roads rather than for upper-level roads, which have a high standard for management. As such, this study aimed to simplify the composition of the index, the basic model form of which is as follows:
Pavement   Condition   index = A α × x B β
where A is the highest score of the index, α and β are coefficients, x is the amount of target fault occurrence in an analysis unit section, and B is the minimum value of target fault in the survey data.
For the Jeju Island PCI that was developed in this study, pavement distress survey data were used to perform basic data analysis (data distribution, outlier removal, etc.) and index modeling; the independent variables consisted of the crack rate (%), rut depth (mm), and roughness (IRI; m/km). In the current management of Jeju Island pavements, a PMS has not been completely established, and the classification boundaries in terms of severity level were found to be a crack rate of 20% or more, a rut depth of 20 mm or more, and a roughness of 7 m/km or more, based on the experience and knowledge of road managers while considering the driving comfort and safety of road users. This study aimed to derive a final model that reflects the current distribution of data in the condition index by examining Jeju pavement distress survey data based on the aforementioned classification boundaries.

3.3. Pavement Segmentation for Management

The pavement management process that is proposed in this study was developed with the goal of providing an efficient pavement management technology that can reflect the characteristics of regional roads in relatively low-level roads and is easy to use. It has been determined that this process can be applied as a single step via a surface survey until pavement segmentation.
For pavement segmentation, this study used the cumulative difference approach (CDA), which can distinguish homogeneity in the pavement conditions of continuous sections, as mentioned previously in Section 2.3. As shown in Figure 1a, CDA can be described using an initial assumption of a continuous and constant value ( r i ) that has a minimum of 3 unit sections along the project length (Ls) [18,19].
A x = 0 x 1 r 1 d x   + x 1 x r 2
The cumulative area A x of the generic point x considers the average value of the measured characteristic, as shown in the following equations, rather than simply using the integral of the continuous part along the distance.
r ¯ = 0 x 1 r 1 d x + x 1 x 2 r 2 d x + x 2 x 3 r 3 d x   L s = A r L s
A x ¯ = 0 x r d x = r ¯ x
In Figure 1b, the dotted line shows the cumulative area due to the average of the condition index for the entire target section. The cumulative difference variable Z c is simply the difference between the cumulative area values ( Z c = A x A ¯ x ) along the measured part at a given x . When Z c for a distance x is depicted as an image, it becomes easier to detect the location of the boundary where the slope of the Z c function changes its sign.

4. Development of Jeju Pavement Condition Index

4.1. Analysis Results for Jeju Island Pavement Condition Status

Before developing an index to reflect the current pavement conditions in Jeju Island, this study analyzed the distribution of road conditions in certain target sections to reflect the characteristics of roads in the Jeju region. The target of the field survey consisted of the three factors that have the greatest influence on pavement condition: crack rate (%), rut depth (mm), and roughness (m/km). Figure 2, Figure 3 and Figure 4 show graphs of the major fault distributions of the 10 local roads (LR) that were targeted in this analysis.
Detailed analysis of pavement stress in these sections showed that the main form of damage were cracks, which, among the fault types, had the highest proportion that exceeded management standards. The average values for the main damage types in the analysis target sections were determined to be 7.8% for the crack rate, 5.4 mm for the rut depth, and 2.6 m/km for IRI.
In the case of the crack rate, the classification boundary in terms of severity level (management standard) of 20% was determined to actually be the 88.1% percentile of the fault amount distribution. It is hypothesized that a fairly high proportion of pavement length exceed the management standard, because maintenance and rehabilitation are not performed immediately even when there are sections that exceed the maintenance standard. This is because of the difficulty of visually distinguishing whether there is a crack rate when users are driving vehicles on the road, or the differences between proportions (for example, between 20% and 30%).
Similarly, in the case of the rut depth, the classification boundary in terms of severity level of 20 mm was determined to be the 98% percentile of the fault amount distribution. It is thought that there are not many sections that deviate greatly from the management standard because rut depth is a factor that greatly affects the driving performance and driving comfort of road users, and thus is more strictly managed by road managers than the crack rate.
Meanwhile, in the case of roughness, the management standard of 7 m/km was determined to be at the 97.3% percentile. As local roads, the roads on Jeju Island are used at a much lower speeds (50–80 km/h) than those on expressways, which can have 100 km/h speed limits. Thus, the average IRI 2.6 m/km was considered to be quite satisfactory as it corresponds to the preservation treatments, which is the 4th level of the roughness management threshold of the expressway standard.
In combination, the results of analyzing the management standards for each type of fault showed that before a systematic PMS is introduced, management tends to be focused on the experience of road users. These road management patterns were observed to be similar to cases where IRI is used as a separate index apart from PCI (including the IRI concept) for the pavement management of extended lengths at a network level [20].

4.2. Data Calibration

Of the three distress types that constitute the Jeju Island pavement condition index, the crack rate unavoidably has an error rate because it is calculated via human (manual) analysis of surface images that were captured by automatic pavement condition survey equipment. The reliability of the crack rate analysis values has not been documented; however, in this field, it is generally recognized that an error rate of 5% or less exists [21]. On the other hand, the rut depth and roughness are immediately calculated during the survey using special equipment that is equipped with automatic pavement condition survey devices. Because the values are measured by equipment, although an error rate may exist, it is known to be extremely small. Therefore, the outlier removal rate was set at 5% for the crack rate data (2.5% each for the upper and lower bounds) and 0.5% for the rut depth and roughness (0.25% each for the upper and lower bounds). The outliers are removed in preparation for the database construction. The outlier removal standards are shown in Table 1.
After the outliers, which were judged to have a large effect on the index development results, were removed, the elements that constituted the final database that was constructed for this study included roads, directions, lanes, starting/ending points, pavement types, presence of earthworks/bridges, crack rates (%), rut depths (mm), and IRIs (m/km).

4.3. Index Development According to Distress Type

The objective of this section is to present an efficient pavement management technology for relatively low-level roads that can be easily applied to PMSs and that reflects the characteristics of regional roads. To accomplish this, the present state of pavement conditions on Jeju Island was analyzed, and a condition index that reflects the actual distribution of each type of fault was developed. To apply an easy modeling technique, which can be created based on understanding the distress distribution of the target region, this study performed modeling with cftool (curve fitting tool) on MATLAB using only the maximum values, minimum values, management standards, and basic model forms for the target fault types (refer to Section 3.2).

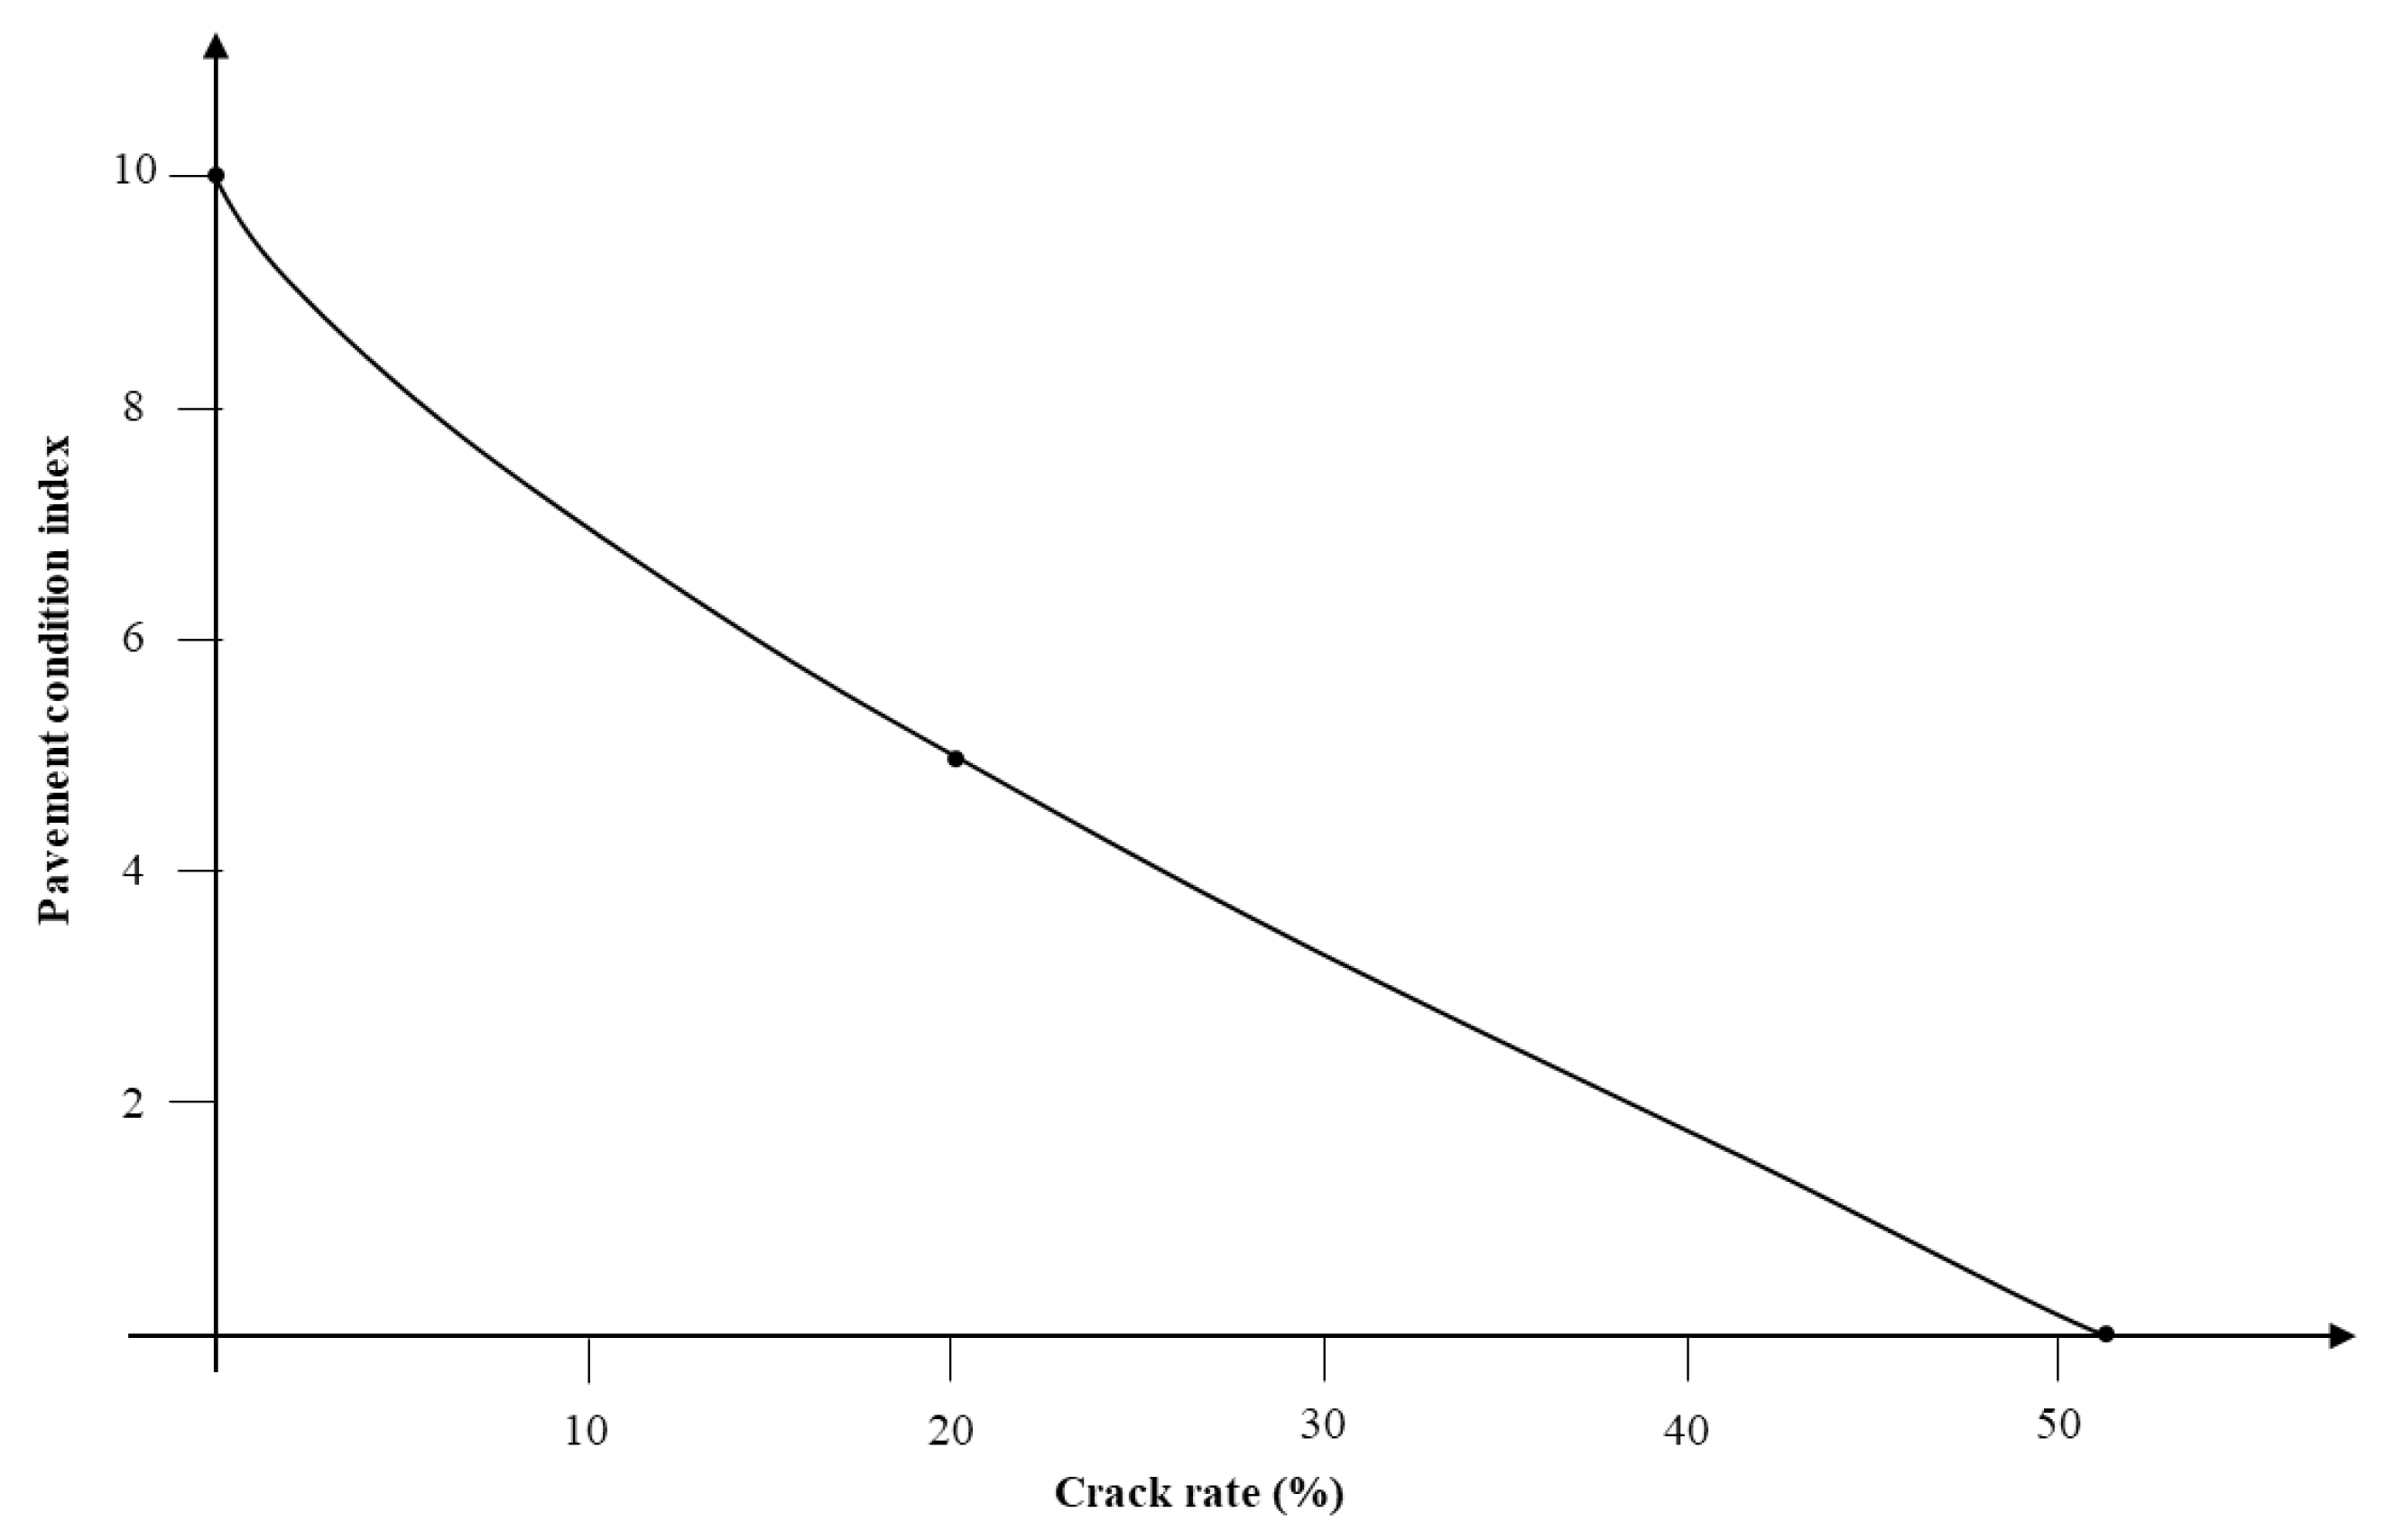
4.3.1. Crack Rate Index

As a result of considering the distribution of Jeju pavements in the development of the crack rate index, a model was obtained in which the index approaches 0 at the maximum crack rate, which is 51.943%; 10 at the minimum crack rate, which is 0%; and 5 at the repair standard crack rate, which is 20%. A diagram of this model is shown in Figure 5.
J P C I c = 10 0.5677 × C 0.7263

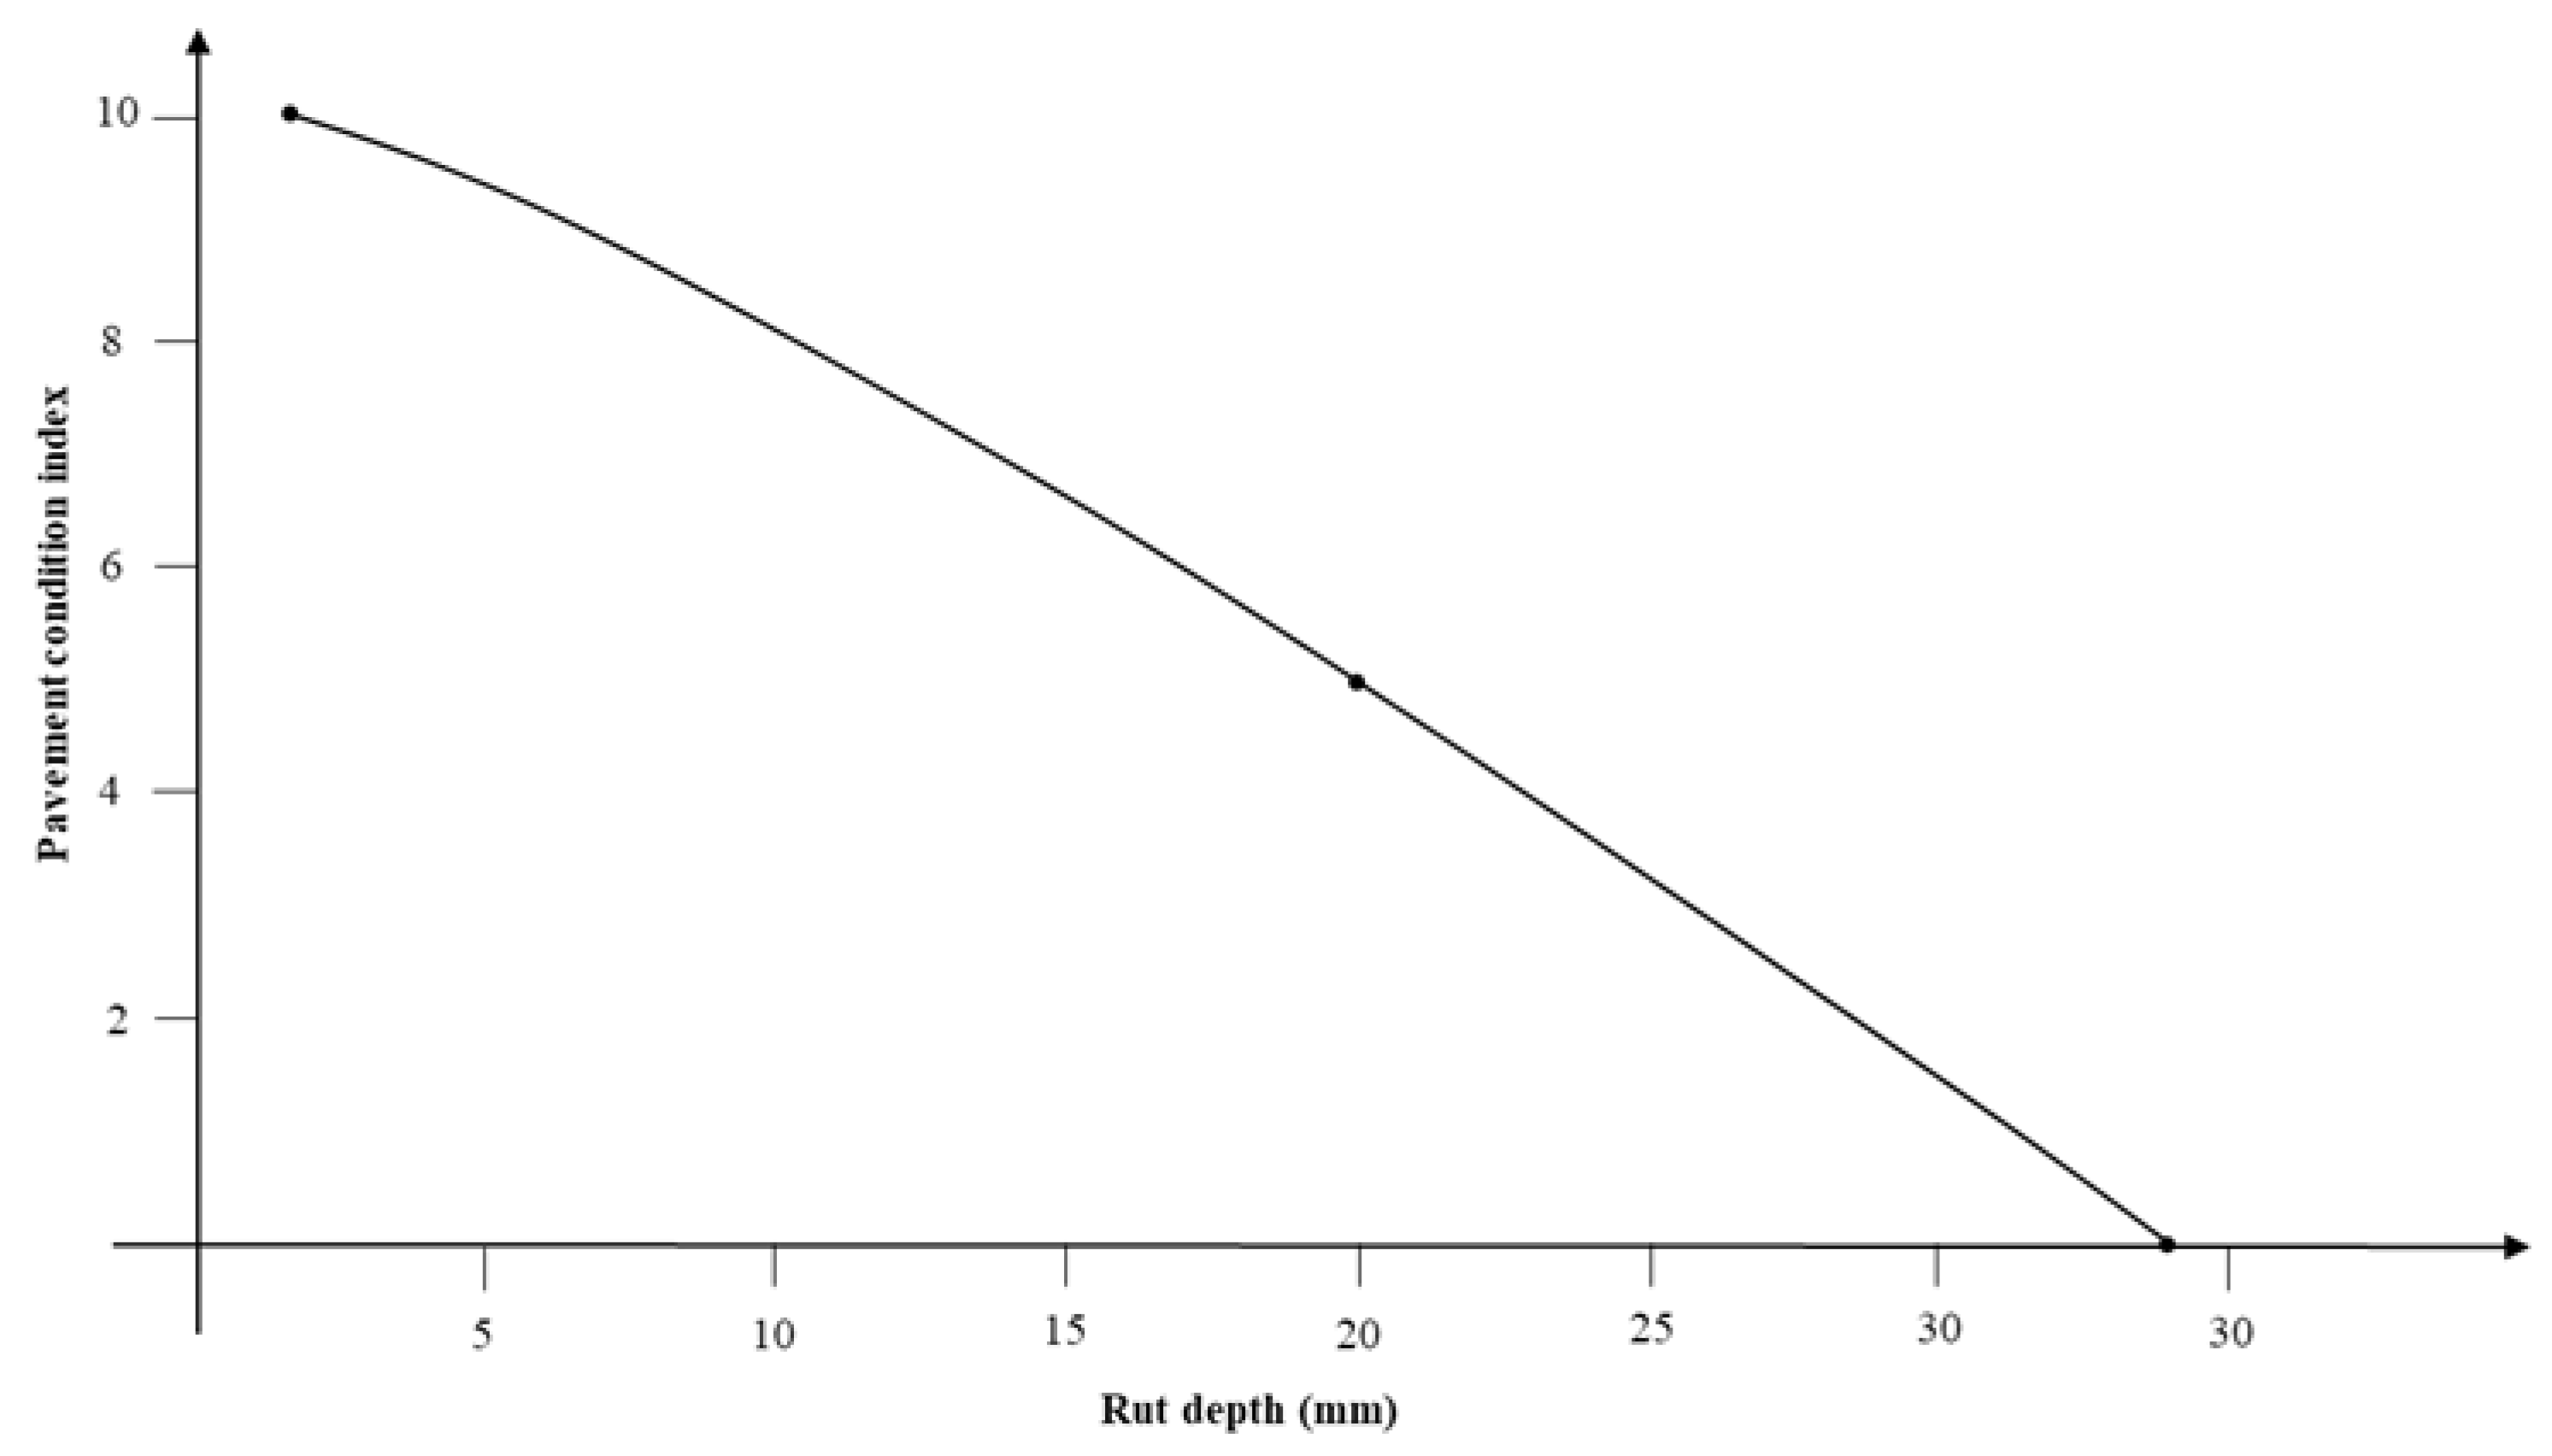
4.3.2. Rut Depth Index

As a result of considering the distribution of Jeju pavements in the development of the rut depth index, a model was obtained in which the index approaches 0 at the maximum rut depth, which is 33.92 mm; 10 at the minimum rut depth, which is 1.76 mm; and 5 at the repair standard rut depth, which is 20 mm. A diagram of this model is shown in Figure 6.
J P C I R D = 10 0.1438 × R D 1.76 1.222

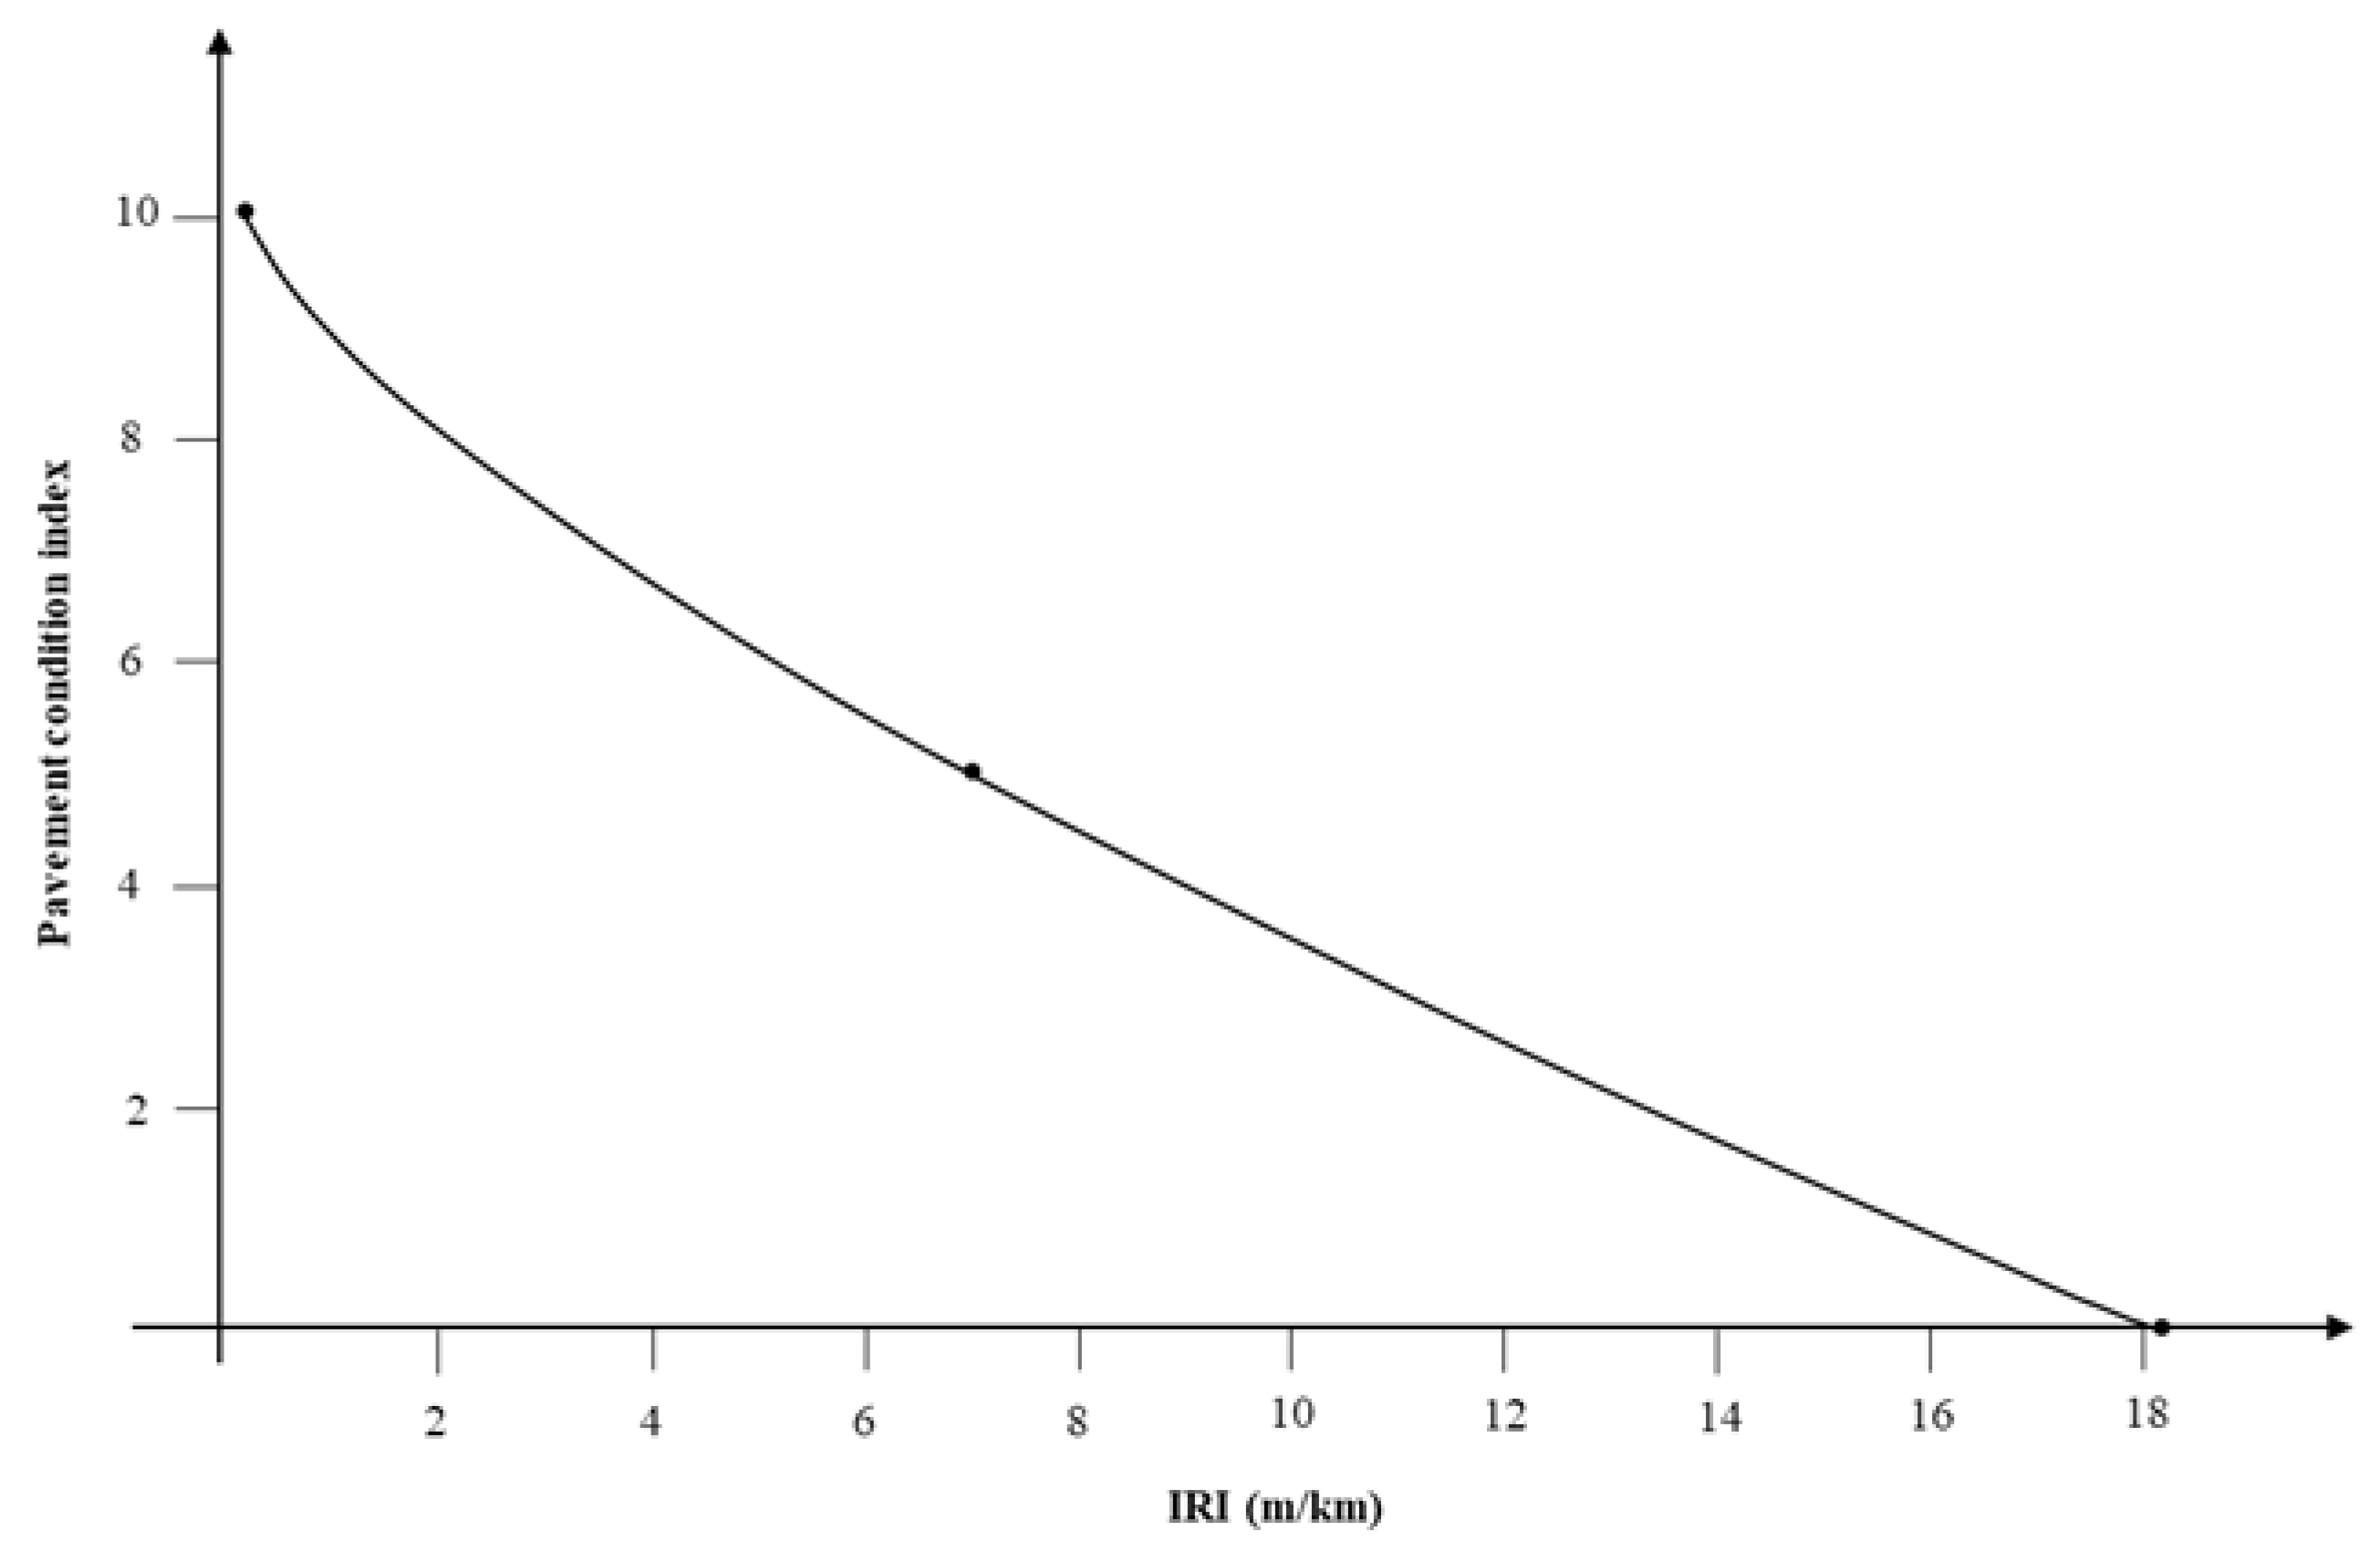
4.3.3. Roughness Index

Similarly, as a result of considering the distribution of Jeju pavements in the development of the roughness index, a model was obtained in which the index approaches 0 at the maximum IRI, which is 18.17 m/km; 10 at the minimum IRI, which is 0.2 m/km; and 5 at the repair standard IRI, which is 7 m/km. A diagram of this model is shown in Figure 7.
J P C I I R I = 10 1.274 × I R I 0.2 0.7133

4.3.4. Combined Index

The combined pavement condition index must be able to comprehensively consider the characteristics of the individual indexes that were developed (degree of damage for each distress type). Accordingly, this study developed a combined pavement condition index that can quantitatively compare pavement conditions in various cases, such as cases where the repair target standard is exceeded for one type of distress, and cases where the repair target standard for all three elements has not been exceeded but is being approached. After individual indexes were devised such that they can be equalized according to the damage condition for each pavement distress type, a combined Jeju PCI (hereafter referred to as JPCI) was developed via the nonlinear combination of these indexes as below.
J P C I = 10 10 J P C I c 5 + 10 J P C I R D 5 + 10 J P C I I R I 5 1 5
As with the individual indexes, JPCI also distinguishes grades on a 0–10 point scale. If J P C I c , J P C I R D , and J P C I I R I are each at the minimum value, which is 0 points, JPCI becomes smaller than 0. Therefore, the minimum value of JPCI was restricted to 0, and the JPCI value is assessed to be 0 if it is calculated to be a negative number. Moreover, the standard for selecting a section to be repaired was set to “JPCI = 5”, and JPCI is calculated to be less than 5 points if even one of the three individual indexes is calculated to be less than 5 points. Based on these limits, it is clear that fitting using a sigmoid function is sufficiently possible. However, in this study, it was judged that it is not suitable to propose the easiest possible method as the optimal process.
The pavement conditions on Jeju were divided into 5 ratings (“Very Good”, “Good”, “Fair”, “Poor” and “Very Poor”) based on the JPCI values. Table 2 outlines the 10-point rating system, which recommends a repair method and repair time according to each pavement condition. Additionally, the developed JPCI was applied to the PMS database to combine the pavement conditions for the different roads included in the analysis, as shown in Table 3.

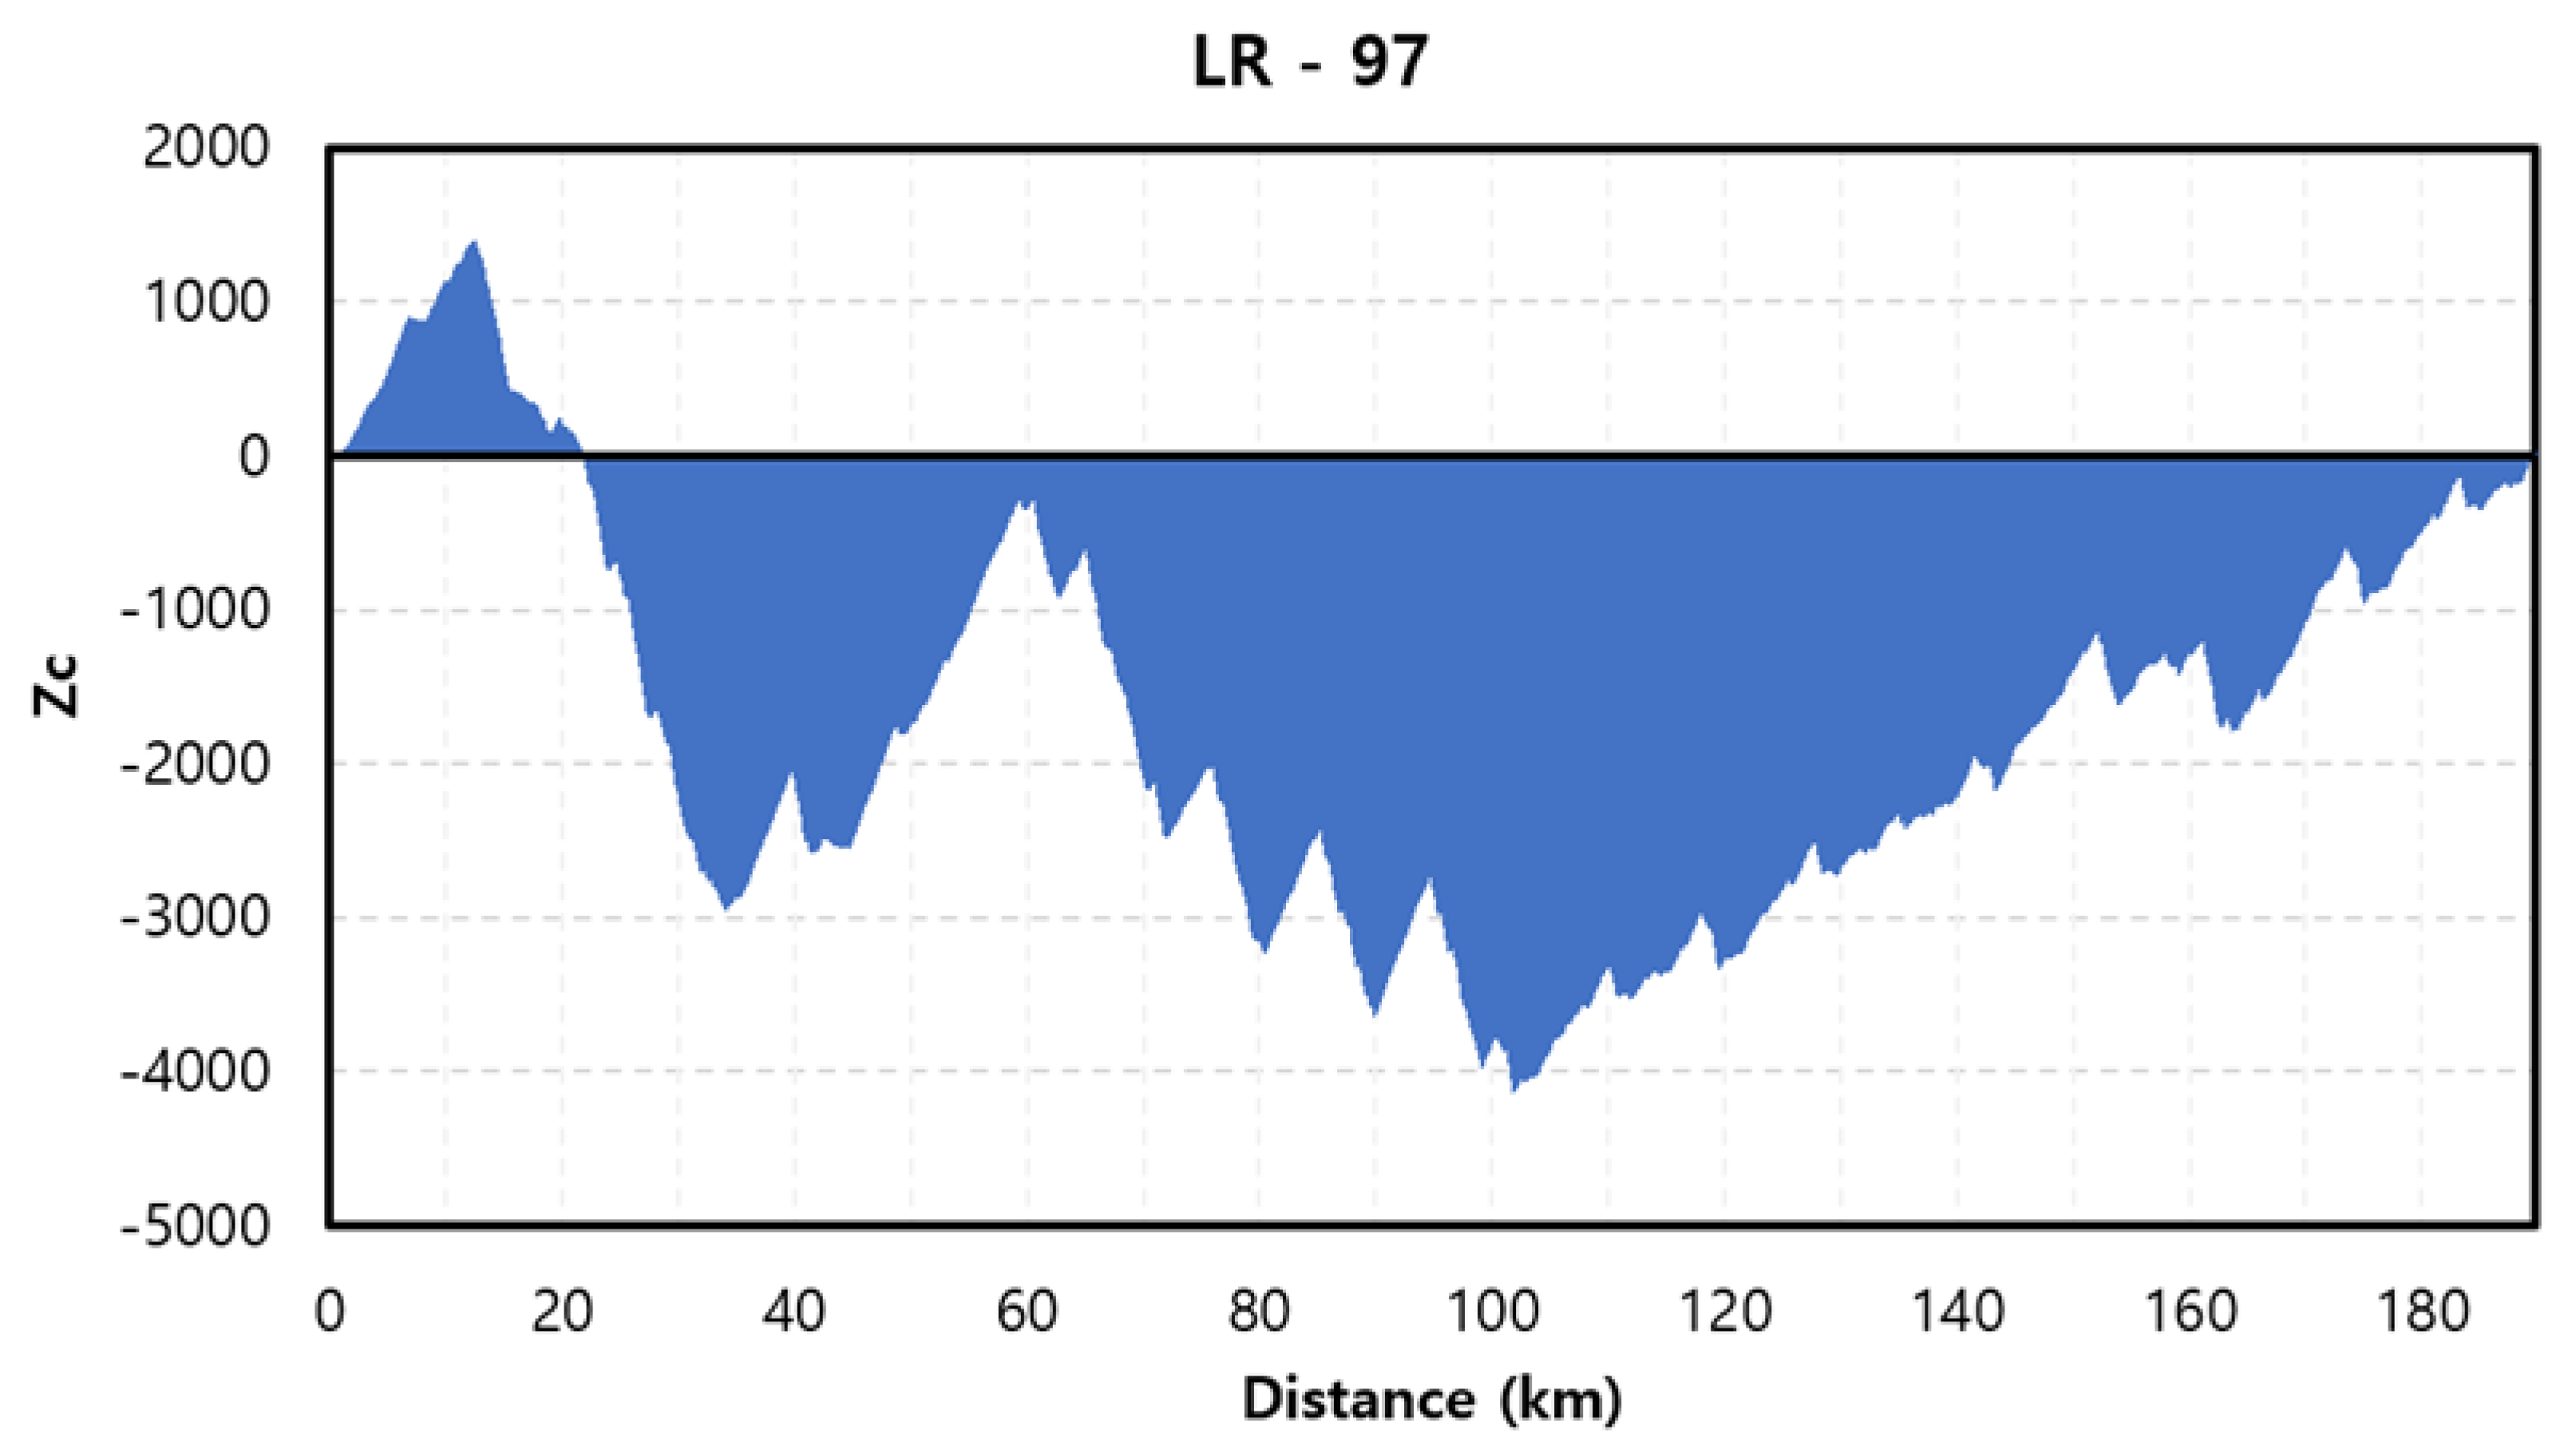
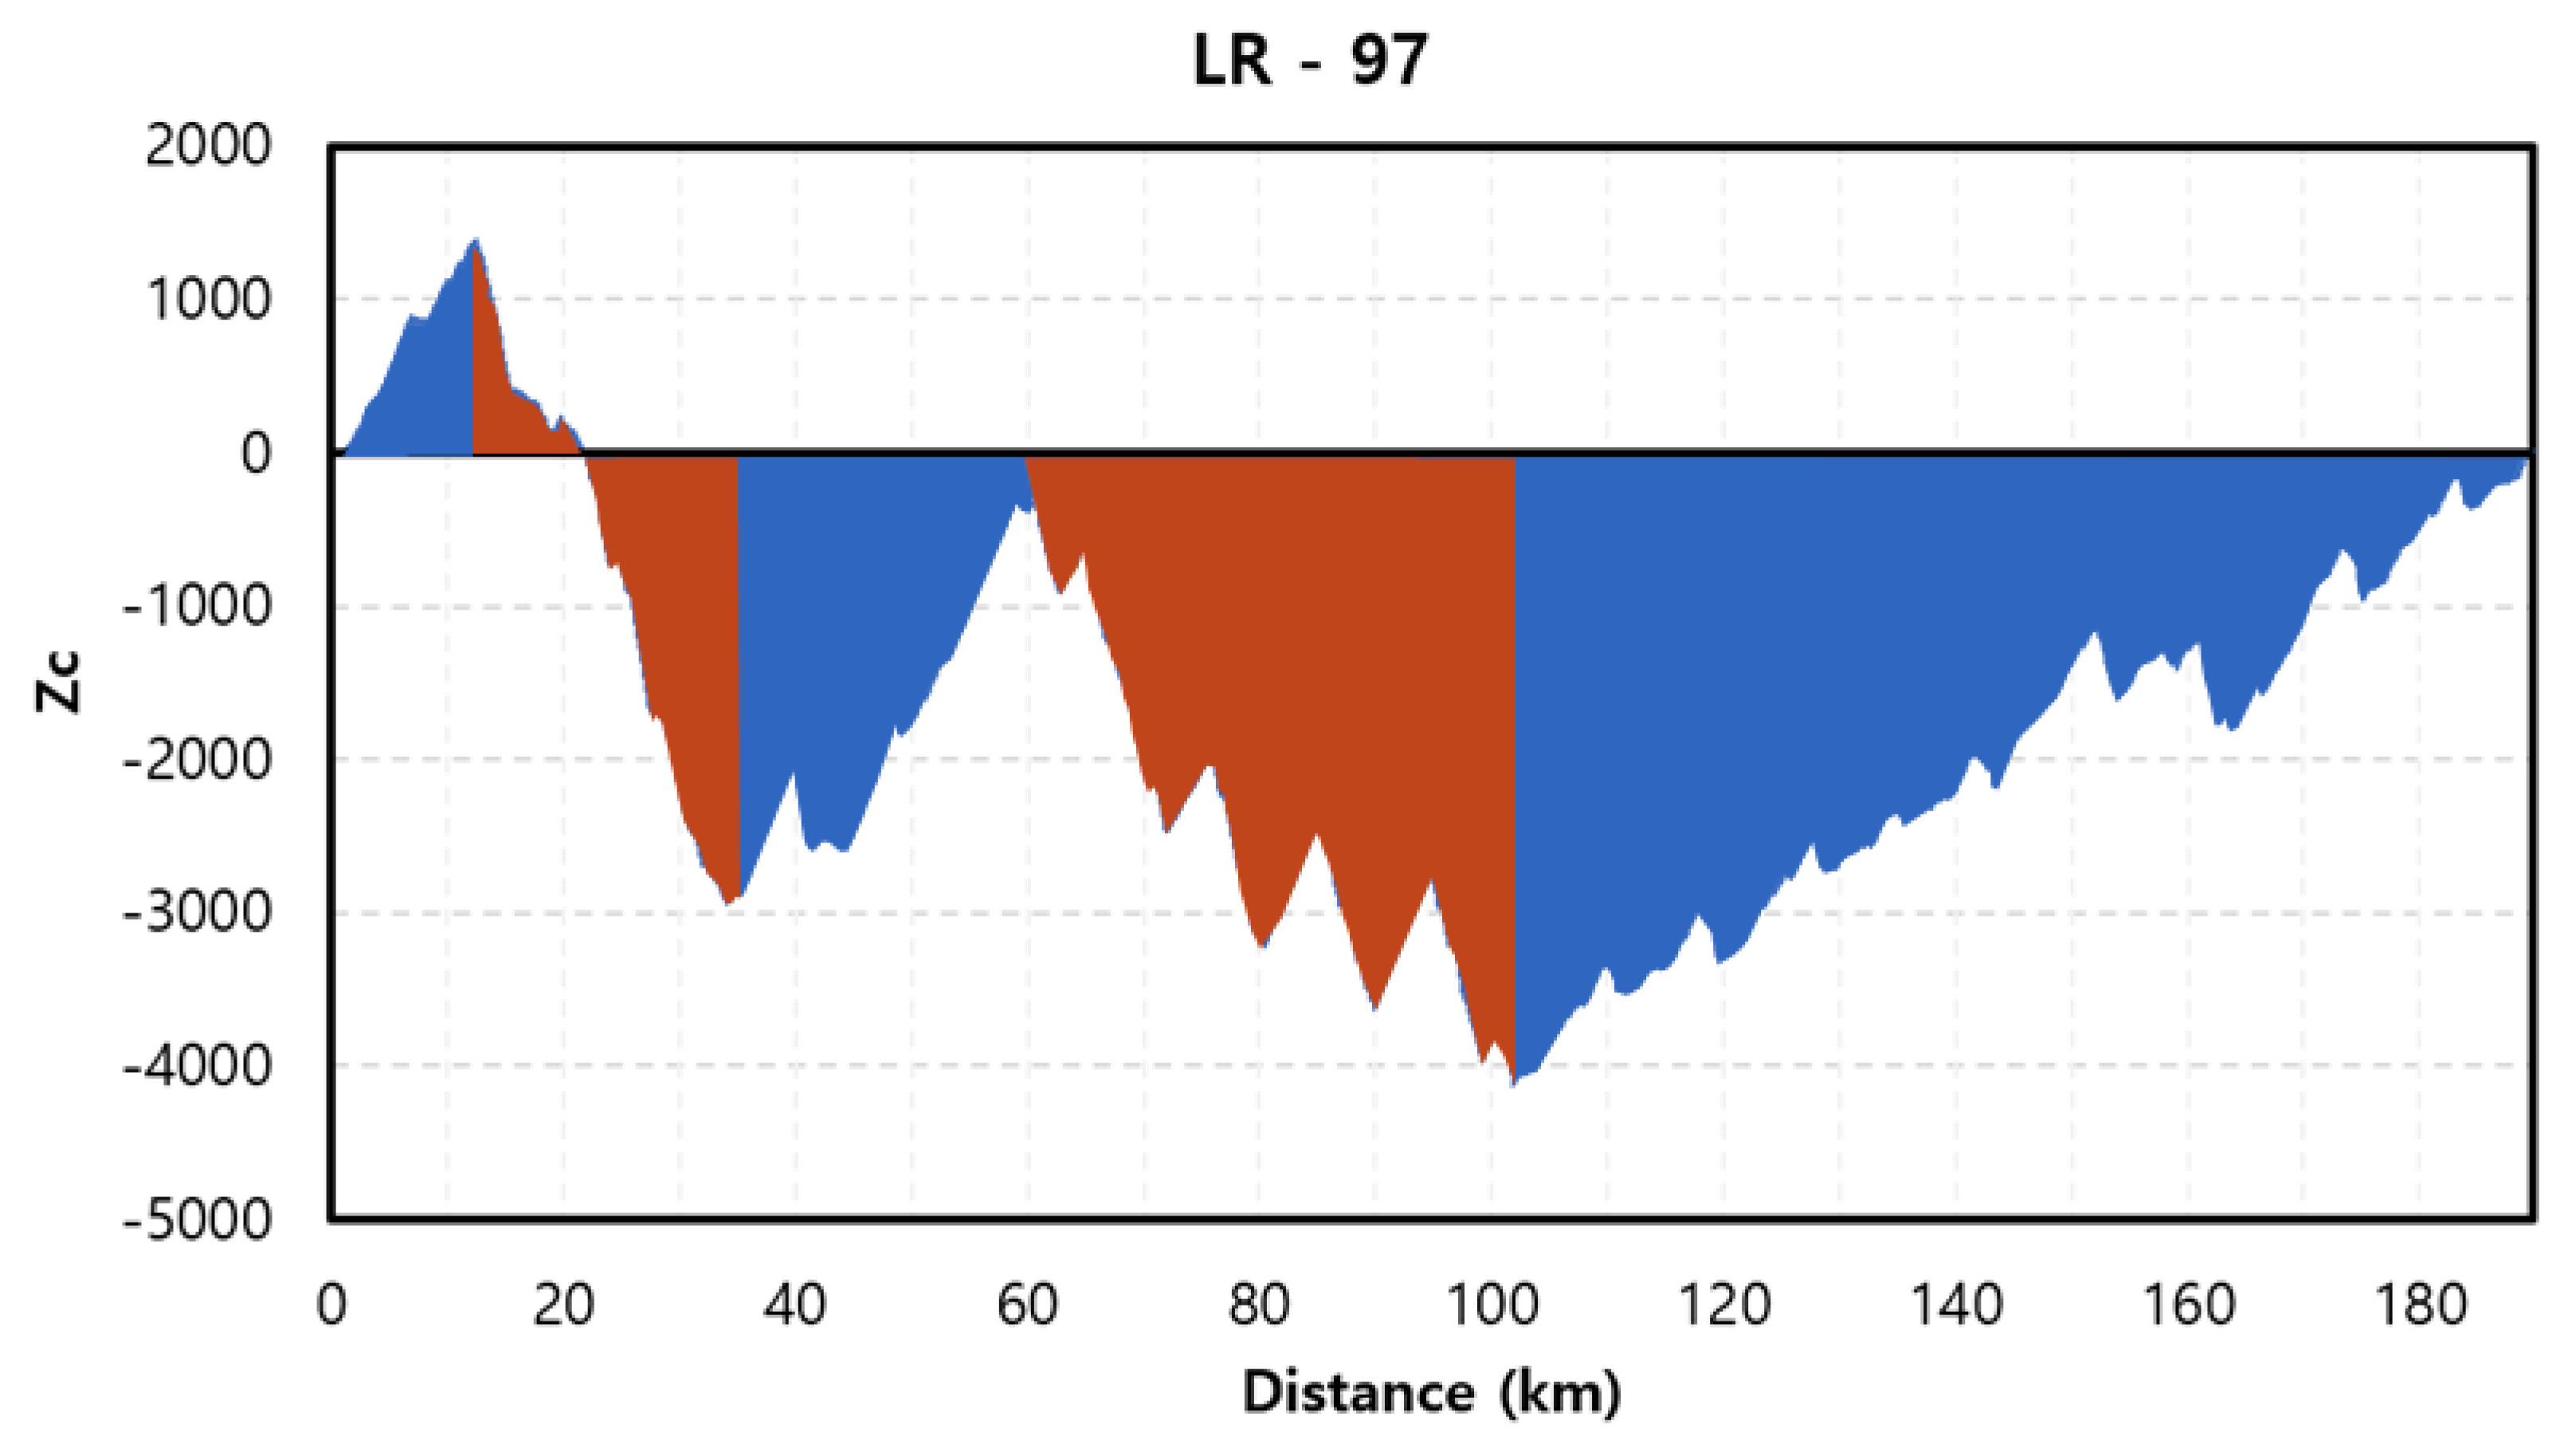
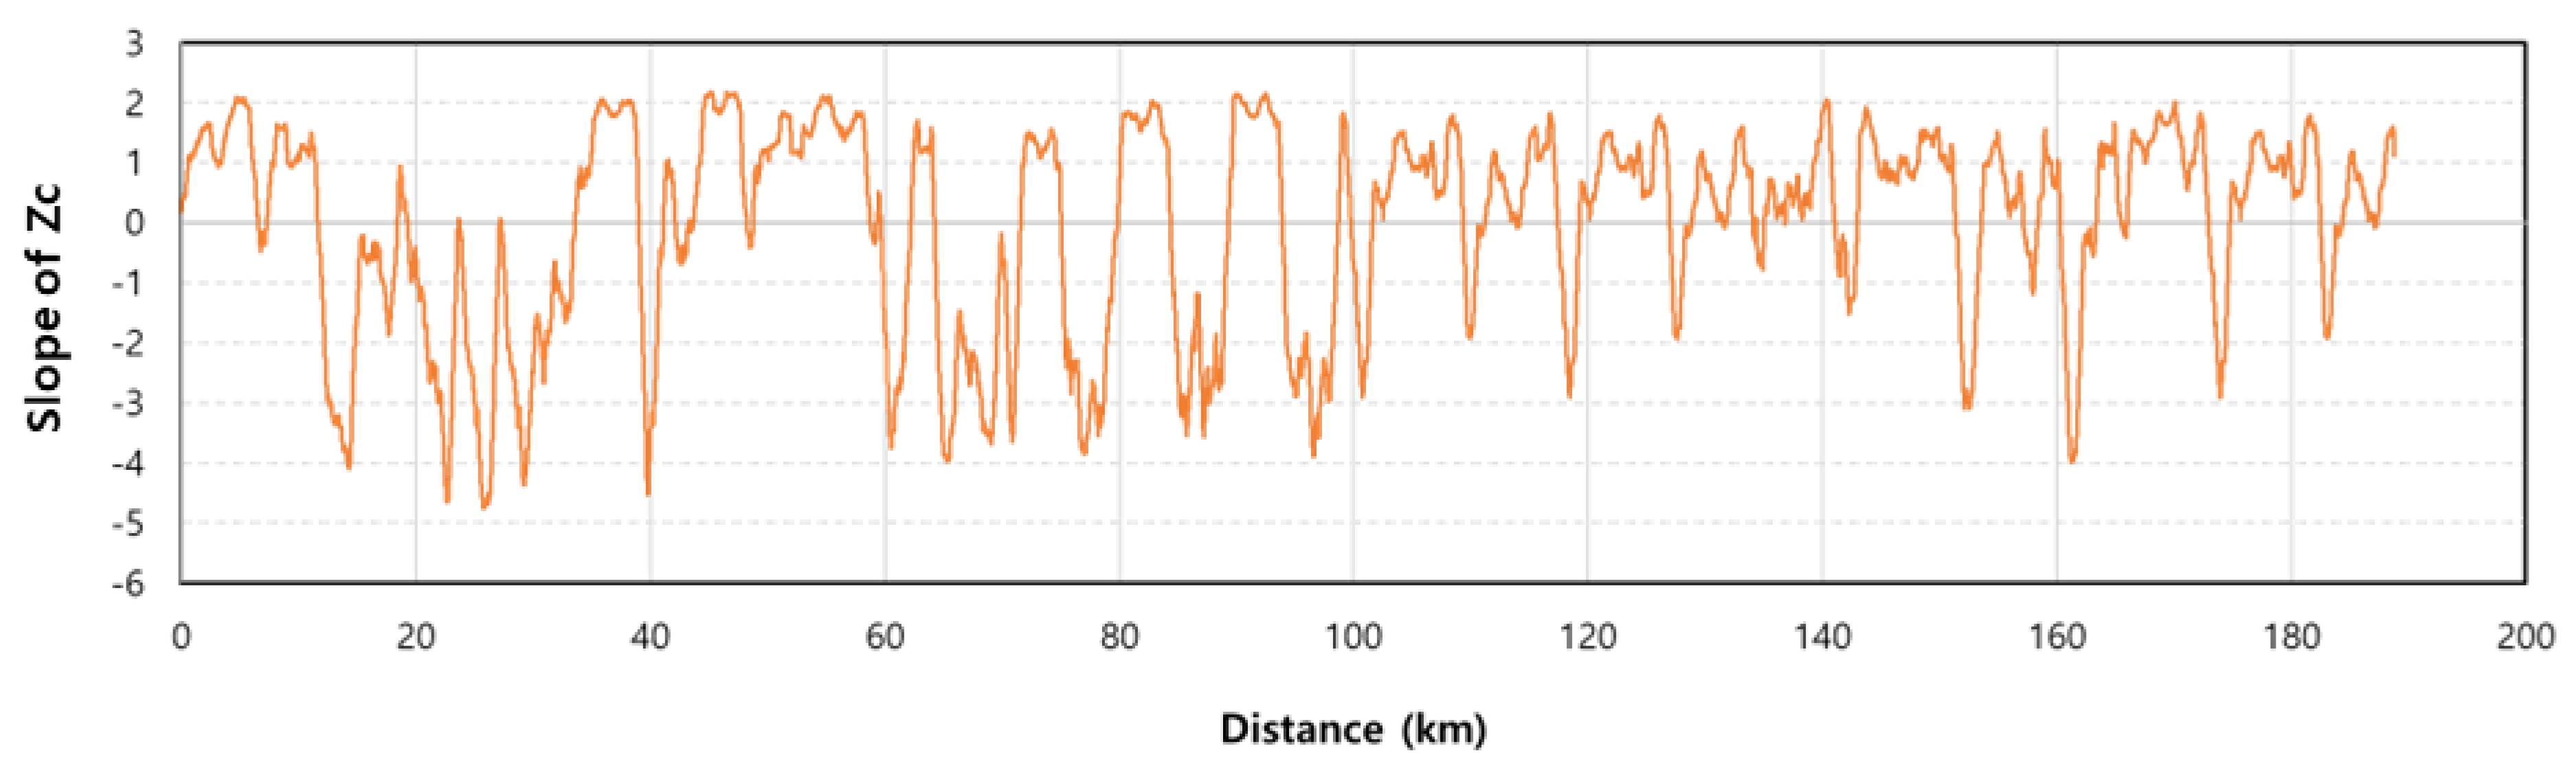
5. Pavement Segmentation Using JPCI-Based Cumulative Difference Approach; Case of LR-97

In this part of the study, the developed JPCI was used in a case study that applies a process that sets the priority of repair target sections, which were selected based on the pavement segmentation results. As mentioned in Section 3.3, in this study, the cumulative difference approach (CDA) was used in accordance with the AASHTO ’93 Guide to select the sections for repair. For this case study on segmentation based on CDA, LR (Local Road)-97 (line number), which has poor surface condition (9th) and a relatively long length (3rd), was selected. The results of using pure CDA are shown in Figure 8.

5.1. First Segmentation

The slope of the graph that is determined during segmentation using CDA can act as a measure of whether the JPCI at a certain point is higher or lower than the average for the road (6.335 in the case of LR-97). That is, the point where there is a change in the sign of the rate of change in the Z c value, which is calculated every 10 m, which is the survey unit section, can be assumed to be a point where the surface condition changes, i.e., the boundary of a homogenous section. However, in actuality, if CDA is used in making decisions for road units, the road is inevitably divided into short sections, as shown in Figure 8. This is no different from decisions made using the existing pavement condition index that is being used by the managing organization. As shown in Figure 9, there is a need for a method that can perform segmentation into larger ranges while maintaining the pattern.
In this study, the variability became very large when the amount of change in the calculated Z c value was used as is, causing difficulties in segmenting the sections. As such, a smoothing stage was performed using a moving average to more clearly divide the sections. The smoothing stage has a close relationship with the minimum repair length set by the managing organization. The minimum repair length is affected by various factors, such as the road environment, including the traffic volume and speed limit, and the work speed and processes involved in each construction method. In the case of the target region for this study, Jeju Island, the minimum repair length standard was 1 km. Figure 10 shows the results of performing smoothing with a moving average length of 1 km.
As previously mentioned, the points where the sign of the moving average changes (negative to positive or positive to negative), i.e., the points in Figure 10 where the slope of Zc is 0, can serve as the boundary points for whether maintenance is necessary. Based on this, the first-segmentation results can be derived. According to these results, the total length of the 189.76 km·lane was divided into 47 sections. Of these, the 23 lengths that needed repair were 71.61 km·lane, and had an average JPCI of 4.38, whereas the 24 lengths that did not need repair were 117.15 km·lane and had an average JPCI of 7.53. As such, the results of selecting sections that need repair (first-segmentation decision) can be considered rational. However, the average length of the actually divided 47 sections was 4.04 km·lane, and the section lengths were between 0.35 and 15.1 km·lane. For the sections that did not fulfill the minimum repair length standard of 1 km, it was necessary to perform section merging, while considering the lengths and conditions (JPCI) of the previous and subsequent sections.

5.2. Second Segmentation

The second segmentation refers to the process of merging sections based on identifying sections that do not exceed the minimum repair length standard of 1 km while considering the lengths of sections that do not need repair (positive slope) and that do need repair (negative slope). As mentioned previously, the average JPCI of the lengths that were set for each section during the first and second decision-making can help with the decision-making. As a result, the 47 sections that resulted from the first segmentation were reduced to 37 sections, and the 37 sections had an average length of 5.27 km·lane, with lengths ranging from 1.0 to 22.0 km·lane. The final segmentation results for the homogenous sections are shown in Table 4.

5.3. Priority Selection Based on Repair Budget–LR-97 Case Study Standard

It was found that the budget for managing pavements throughout Jeju Island at an appropriate standard was an average of 13.6 billion KRW for the past three years (2019–2022) and exhibited a trend of increase [22]. This is judged to be a case wherein the budget is increasing as pavement is included in the concept of asset management because of the geographical characteristics of Jeju Island (rapid climate change) and the “Basic Law on Sustainable Infrastructure Management” that was enacted in 2020. The results of calculating the actual repair budget according to the amount of maintenance that was performed on average over the past 3 years (2019–2021) showed that approximately 88 million KRW were invested for every 1 km·lane. From this analyzed evidence, the budget per 1 km·lane for the amount of needed repairs determined in this study can be calculated. Therefore, the required repair budget was calculated based on a comparison between the segmentation results of a segmentation method that uses the JPCI score for each 10-m unit section (management standard JPCI of 5 points or less) and segmentation results using CDA. This study aimed to devise a priority selection process for performing maintenance and rehabilitation within a suitable range (budget). First, Table 5 shows the results of a comparison of the amounts of repair and the budgets that were determined for LR-97 when pure JPCI was used (repair only the sections where the JPCI score fulfilled the repair standard, i.e., 5 or less) and when CDA was used (divide the road into homogenous sections and then repair sections with an average JPCI of 5 or less).
First, the amount of repairs, which was calculated as the sum of the sections in LR-97 with an index value of 5 or less (repair standard = 5, refer to Table 2) using the developed JPCI method was multiplied by 88 million KRW, which is the average maintenance and repair budget per 1 km·lane. As a result, it was determined that a total budget of 4.07 billion KRW is needed. Of course, during the actual selection of the sections to be repaired, the decision will be made through additional processes aside from finding the index values, such as detailed surveys. By contrast, when only JPCI is used to calculate the amount of repairs, it has a limitation in that it determines that repairs are required even in overly short sections because there is no standard for dividing homogenous sections. Nonetheless, the JPCI score grading system has an advantage in that anybody can distinguish the pavement conditions quantitatively according to the values of the numbers.
On the other hand, in the case of CDA-based segmentation, it was determined that a total budget of 6.259 billion is required, which is approximately 154% of the repair budget required when JPCI was used. These results indicate that CDA-based segmentation may include good road sections among the sections in poor condition, and it is judged that such cases may be considered for preventative overlay.
Finally, priority was selected using the average JPCIs of the sections that were to be repaired. Table 6 shows the results of selecting priority based on information regarding the sections that were selected for repair. The final process that was derived in this study is shown in Figure 11.
As the first step of the process, it is necessary to perform a pavement condition survey on the entire road length under a management organization. Second, it is necessary to identify the distribution of distress types in the target sections and the management threshold. Third, an index must be established using the basic model form provided by this study. These three steps are one-time tasks and provide quantitative figures that can be used as evidentiary data in the decision-making stage.
The fourth step is to apply CDA using the index values found in the third step and then derive the original segmentation graph based on Zx. The fifth step is to determine a moving average that includes the slope of Zc (i.e., whether repair is needed) and accounts for the minimum repair length (1 km in this study). Here, a problem can occur in which sections are divided into very short lengths because the road can be divided into 10-m unit sections when repair sections are selected using only row data (without using a moving average) and not using the minimum length concept. Therefore, the process must be performed with the application of a minimum repair length that considers various external factors.
The sixth step is to make the first-segmentation decision in which the boundary points for whether repair is needed are set as the inflection points, where the sign of the moving average value changes (from negative to positive, or positive to negative). The seventh step is to make the second-segmentation decision, which is a process of merging and diverging the first-segmentation results in accordance with the minimum repair length based on the sections that do not need repair (positive slope) and the length of the sections that do need repair (negative slope). In the first and second decision-making, it can help to also consider the average JPCI for the lengths set for each section. Finally, priority can be calculated via calculation of the average JPCIs for the sections that need repair as determined via the second decision-making.

6. Conclusions

This study proposed a process for pavement segmentation and prioritization using the relatively simple CDA method, based on an index that reflects the distress distribution and present condition of Jeju Island pavements. The process proposed in this study was demonstrated PMS due to limitations due to various causes (budget etc.) rather than applying them to advanced PMS, but it suggests a minimum strategy for management over a certain level. The major findings of this study are as follows.
  • JPCI was developed based on results that reflect the distribution (maximum, minimum, and management standard) of pavement conditions in the entire target road in terms of the following three factors: crack rate, rut depth, and roughness. Because of its basic model form, the process proposed in this study is likely to have an increased applicability;
  • The representative distress type in Jeju Island pavements was determined to be the crack rate. In practice, the management standard for this fault type was set at 20%; however, before the introduction of PMS management, it was difficult to distinguish, based on visual inspections, whether cracks have occurred while users are driving vehicles on the road, or the difference between, for example, 20% and 30%. As such, it was assessed that the proportion of sections that exceeded the management standard was higher than in the case of rutting or roughness. Although rut depth and roughness are also managed based on certain standards, specifically 20 mm and 7 m/km, respectively, these two distress types are easily felt, and furthermore, these factors have a big effect on the driving performance and driving comfort of road users. Therefore, it was inferred that these fault types are managed more strictly than the crack rate and thus include few values that greatly deviate from the management standard;
  • Through a smoothing process that is based on CDA results, it was possible to perform segmentation that reflects the characteristics of the Zc values. The smoothing process was performed using a moving average, and the variable range was set to be the minimum length for a repair section. In this study, segmentation was performed until the completion of the second decision-making, which was based on the minimum repair length. However, it was inferred that more practical results can be derived if judgment by a manager or engineer is used to perform merging and diverging of the sections that were determined to be in need of repair;
  • In the case of LR-97, when the amount of repair was calculated using CDA, the budget increased to approximately 154% of the budget for when the repair sections were selected using only JPCI. These results occurred because CDA performs segmentation based on the extent to which values deviate from the average for the target section rather than the physical size of the JPCI value. Thus, from a macroscopic point of view, there is a proportion of good sections that are included among the sections that need repair. Nonetheless, it was judged that this can be used as evidentiary data for decision-making regarding preventative overlays.

Author Contributions

Conceptualization, D.-H.J.; methodology, D.-H.J., B.-S.O.; software, D.-H.J.; validation, B.-S.O. and S.-H.L.; formal analysis, D.-H.J.; investigation, Y.-M.K.; resources, B.-S.O. and J.-Y.C.; data curation, D.-H.J.; writing—original draft preparation, D.-H.J. and B.-S.O.; writing—review and editing, D.-H.J., S.-H.L. and B.-S.O.; visualization, D.-H.J.; supervision, B.-S.O.; project administration, B.-S.O.; funding acquisition, S.-H.L. All authors have read and agreed to the published version of the manuscript.

Funding

This research was funded by the Korea Institute of Civil Engineering and Building Technology (KICT), grant number 20220246-001.

Institutional Review Board Statement

Not applicable.

Informed Consent Statement

Not applicable.

Acknowledgments

We conducted this study with research support from the Korea Institute of Civil Engineering and Building Technology (KICT), “Development of Jeju pavement maintenance and management technology for the regional characteristics of Jeju Island”. We express our gratitude to everyone involved.

Conflicts of Interest

The authors declare no conflict of interest.

References

  1. Ministry of Land, Infrastructure and Transport. MOLIT Statistics System, Road Status Survey; Ministry of Land, Infrastructure and Transport: Sejong, Republic of Korea, 2019.
  2. Ministry of Land, Infrastructre and Transport. 2021 PMS Final Report; Ministry of Land, Infrastructure and Transport: Sejong, Republic of Korea, 2021. (In Korean)
  3. Korea Institute of Civil Engineering and Building Technology. 2020 Operation and Improvement of the Jeju Pavement Management System(PMS); Korea Institute of Civil Engineering and Building Technology: Goyang-si, Republic of Korea, 2020. (In Korean) [Google Scholar]
  4. Jin, M.S.; Song, Y.W. Development of Pavement Condition Index for Asphalt Pavement. Int. J. Highw. Eng. 2004, 6, 55–63. [Google Scholar]
  5. Suh, Y.C.; Kwon, S.H.; Jung, D.H.; Jeong, J.H.; Kang, M.S. Development of HPCI Prediction Model for Concrete Pavement Using Expressway PMS Database. Int. J. Highw. Eng. 2017, 19, 83–95. [Google Scholar] [CrossRef]
  6. Sirhan, M.; Bekhor, S.; Sidess, A. Implementation of Deep Neural Networks for Pavement Condition Index Prediction, American Society of Civil Engineers. J. Transp. Eng. Part B 2022, 148, 04021070. [Google Scholar] [CrossRef]
  7. Issa, A.; Samaneh, H.; Ghanim, M. Predicting pavement condition index using artificial neural networks approach. Ain Shams Eng. J. 2021, 13, 101490. [Google Scholar] [CrossRef]
  8. Lee, J.H.; Lee, J.H.; Kim, Y.T.; Lee, K.H.; Ohm, B.S.; Woo, B.C.; Jeong, J.H. Analysis of Factors Affecting Performance of Jeju Island Local Pavement. Int. J. Highw. Eng. 2022, 24, 39–51. [Google Scholar] [CrossRef]
  9. MoLIT. Road Condition, e-National Indicators. Available online: https://www.http://www.index.go.kr/ (accessed on 17 November 2022).
  10. Moon, H.C.; Suh, Y.C. Development of Pavement Condition Index for the Municipal Pavements. Int. J. Highw. Eng. 2008, 10, 221–230. [Google Scholar]
  11. Imam, A.I.; Suleiman, A. Development of a Flexible Pavement Condition Rating Model Using Multi-attribute Utility Theory. Int. J. Pavement Res. Technol. 2022, 1–22. [Google Scholar] [CrossRef]
  12. Shah, Y.U.; Jain, S.S.; Tiwari, D.; Jain, M.K. Development of Overall Pavement Condition Index for Urban Road Network. Soc. Behav. Sci. 2013, 104, 332–341. [Google Scholar] [CrossRef] [Green Version]
  13. Kim, M.Y.; Prozzi, J.A. Segmentation of Highway Networks for Maintenance Operations, Technical Report, CHPP Report-UTA#8-2021. 2021. Available online: https://www.google.com/url?sa=t&rct=j&q=&esrc=s&source=web&cd=&ved=2ahUKEwi50Nf-w-n7AhXEDKYKHYtqDCEQFnoECA8QAQ&url=https%3A%2F%2Fwww.chpp.egr.msu.edu%2Fwp-content%2Fuploads%2F2021%2F10%2F31.-CHPP-Report-UTA8-2021.pdf&usg=AOvVaw2He21ZOC1l9TTHh-0DoXBV (accessed on 17 November 2022).
  14. Prashant, R.P.; Zala, L.B.; Amit, A.A. Flexible Pavement Overlay Design Using Cumulative Difference Approach of Homogeneous Section. Int. J. Tech. Innov. Morden Eng. Sci. (IJTIMES) 2018, 4, 474–483. [Google Scholar]
  15. Thomas, F. Generating Homogeneous Road Sections Based on Surface Measurements: Available Methods. In Proceedings of the 2nd European Pavement and Asset Management Conference, Berlin Germany, 21–23 March 2004; Statens väg-och transportforskningsinstitut: Linköping, Sweden, 2004. [Google Scholar]
  16. El Gendy, A.; Shalaby, A. Using quality control charts to segment road surface condition data. In Proceedings of the Seventh International Conference on Managing Pavement Assets, ICMPA 2008, Calgary, AB, Canada, 23–28 June 2008. [Google Scholar]
  17. Misra, R.; Das, A. Identification of Homogeneous Sections from Road Data. Int. J. Pavement Eng. 2003, 4, 229–233. [Google Scholar] [CrossRef]
  18. AASHTO. AASHTO Guide for design of pavement structure Appendix J: Analysis Unit Delineation By Cumulative Differences; American Association of State Highway and Transportation Official: Washington, DC, USA, 1993.
  19. Cafiso, S.; Graziano, A.D. Definition of Homogenous Sections in Pavement Measurements. Soc. Behav. Sci. 2012, 53, 1069–1079. [Google Scholar] [CrossRef] [Green Version]
  20. Arhin, S.A.; Williams, L.N.; Ribbiso, A.; Anderson, M.F. Predicting Pavement Condition Index Using International Roughness Index in a Dense Urban Area. J. Civ. Eng. Res. 2015, 5, 10–17. [Google Scholar] [CrossRef]
  21. Lee, J.H.; Jung, D.H.; Lee, M.S.; Jeon, S.I. A Feasibility Study for the Prediction of Concrete Pavement Condition Index (CPCI) Based on Machine Learning. Appl. Sci. 2022, 12, 8731. [Google Scholar] [CrossRef]
  22. Korea Institute of Civil Engineering and Building Technology. 2021 Operation and Improvement of the Jeju Pavement Management System(PMS); Korea Institute of Civil Engineering and Building Technology: Goyang-si, Republic of Korea, 2021. (In Korean) [Google Scholar]
Figure 1. Concepts of Cumulative Difference Approach to Analysis Unit Delineation [18].
Applsci 12 12548 g001
Figure 2. Crack rate (%) status of pavement for each road on Jeju Island subjected to analysis.
Applsci 12 12548 g002
Figure 3. Rut depth (mm) status of pavement for each road on Jeju Island subjected to analysis.
Applsci 12 12548 g003
Figure 4. Roughness(m/km) status of pavement for each road on Jeju Island subjected to analysis.
Applsci 12 12548 g004
Figure 5. Modeling by distress distribution (crack rate, %).
Applsci 12 12548 g005
Figure 6. Modeling by distress distribution (rut depth, mm).
Applsci 12 12548 g006
Figure 7. Modeling by distress distribution (roughness, m/km).
Applsci 12 12548 g007
Figure 8. JPCI-based segmentation results (Local Road-97).
Applsci 12 12548 g008
Figure 9. Smoothing concept for rapidly changing Zc slope (based on Figure 8).
Applsci 12 12548 g009
Figure 10. Slope smoothing results based on moving average.
Applsci 12 12548 g010
Figure 11. Process for pavement management system that considers regional pavement conditions and environment.
Applsci 12 12548 g011
Table 1. Outlier removal standard for each type of fault.
Distress TypeMinimum ValueMaximum Value
Crack rate (%)0.0051.943
Rut Depth (mm)1.7633.92
IRI (m/km)0.218.17
Table 2. Rating system for JPCI ratings.
JPCI RateClassPavement ConditionAction
8–10Very GoodAlmost-good-as-new pavementDo nothing
6–8GoodPartial damageGeneral/Preventive maintenance
4–6FairIntermittent breakage observed
(“JPCI = 5” corresponds to crack rate over 20% or
rut depth over 20 mm or
IRI over 7 m/km)
Preventive maintenance/
M&R strategy required
2–4PoorStructural distress or deterioration occurredLarge-scale rehabilitation (overlay, inlay, etc.) required
0–2Very PoorLarge scale distresses are widely distributed over the sectionReconstruction
Table 3. Current Jeju Island pavement conditions in terms of JPCI.
RouteLength (km)Avg.Rank (by JPCI)
Total2053.417.033-
LR-1132122.916.9126
LR-1131421.357.1733
LR-97189.766.3359
LR-1136847.777.1694
LR-111577.476.12710
LR-111742.107.1485
LR-111874.136.5997
LR-1135114.107.7761
LR-113976.006.4628
LR-Aejoro87.827.3762
Table 4. Segmentation results from first and second decision-making.
1st Decision2nd Decision
M&R Not NeededM&R NeededM&R Not NeededM&R Needed
Length (km·lane)117.1786.71118.6471.12
JPCI avg.7.534.387.454.38
Table 5. Length that requires repair and corresponding budget for each repair section selection scenario.
CriteriaLengthM&R Required LengthBudget for M&R (won)M&R Ratio
JPCI189.76 km46.32 km4.076 billion24.41%
CDA71.12 km6.259 billion37.48%
Table 6. Results of selecting priority of sections that need repair.
No.Start PointEnd PointLength (km·Lane)JPCI Avg.Priority
111.6533.621.954.376
239.0341.132.13.933
342.1343.661.536.0017
458.7662.263.54.497
564.2871.627.343.801
675.0779.914.843.801
784.489.364.964.004
893.9398.734.83.902
999.8101.641.844.5010
10109.35111.221.875.3015
11117.45119.291.844.5010
12127128.871.875.3015
13141.071431.935.2012
14151.37153.592.224.305
15157.14158.431.295.6016
16160.29163.373.084.6011
17172.94174.781.844.5010
18182.49184.362.325.3015
Total71.124.38-
Publisher’s Note: MDPI stays neutral with regard to jurisdictional claims in published maps and institutional affiliations.

