


Walking Speed in a Motorbike Lane Considering the Density of Evacuees and Motorbikes

 , , ,
, , ,
Abstract
:1. Introduction
2. Experimental Analysis of Evacuation in the Assumed Motorbike Lane
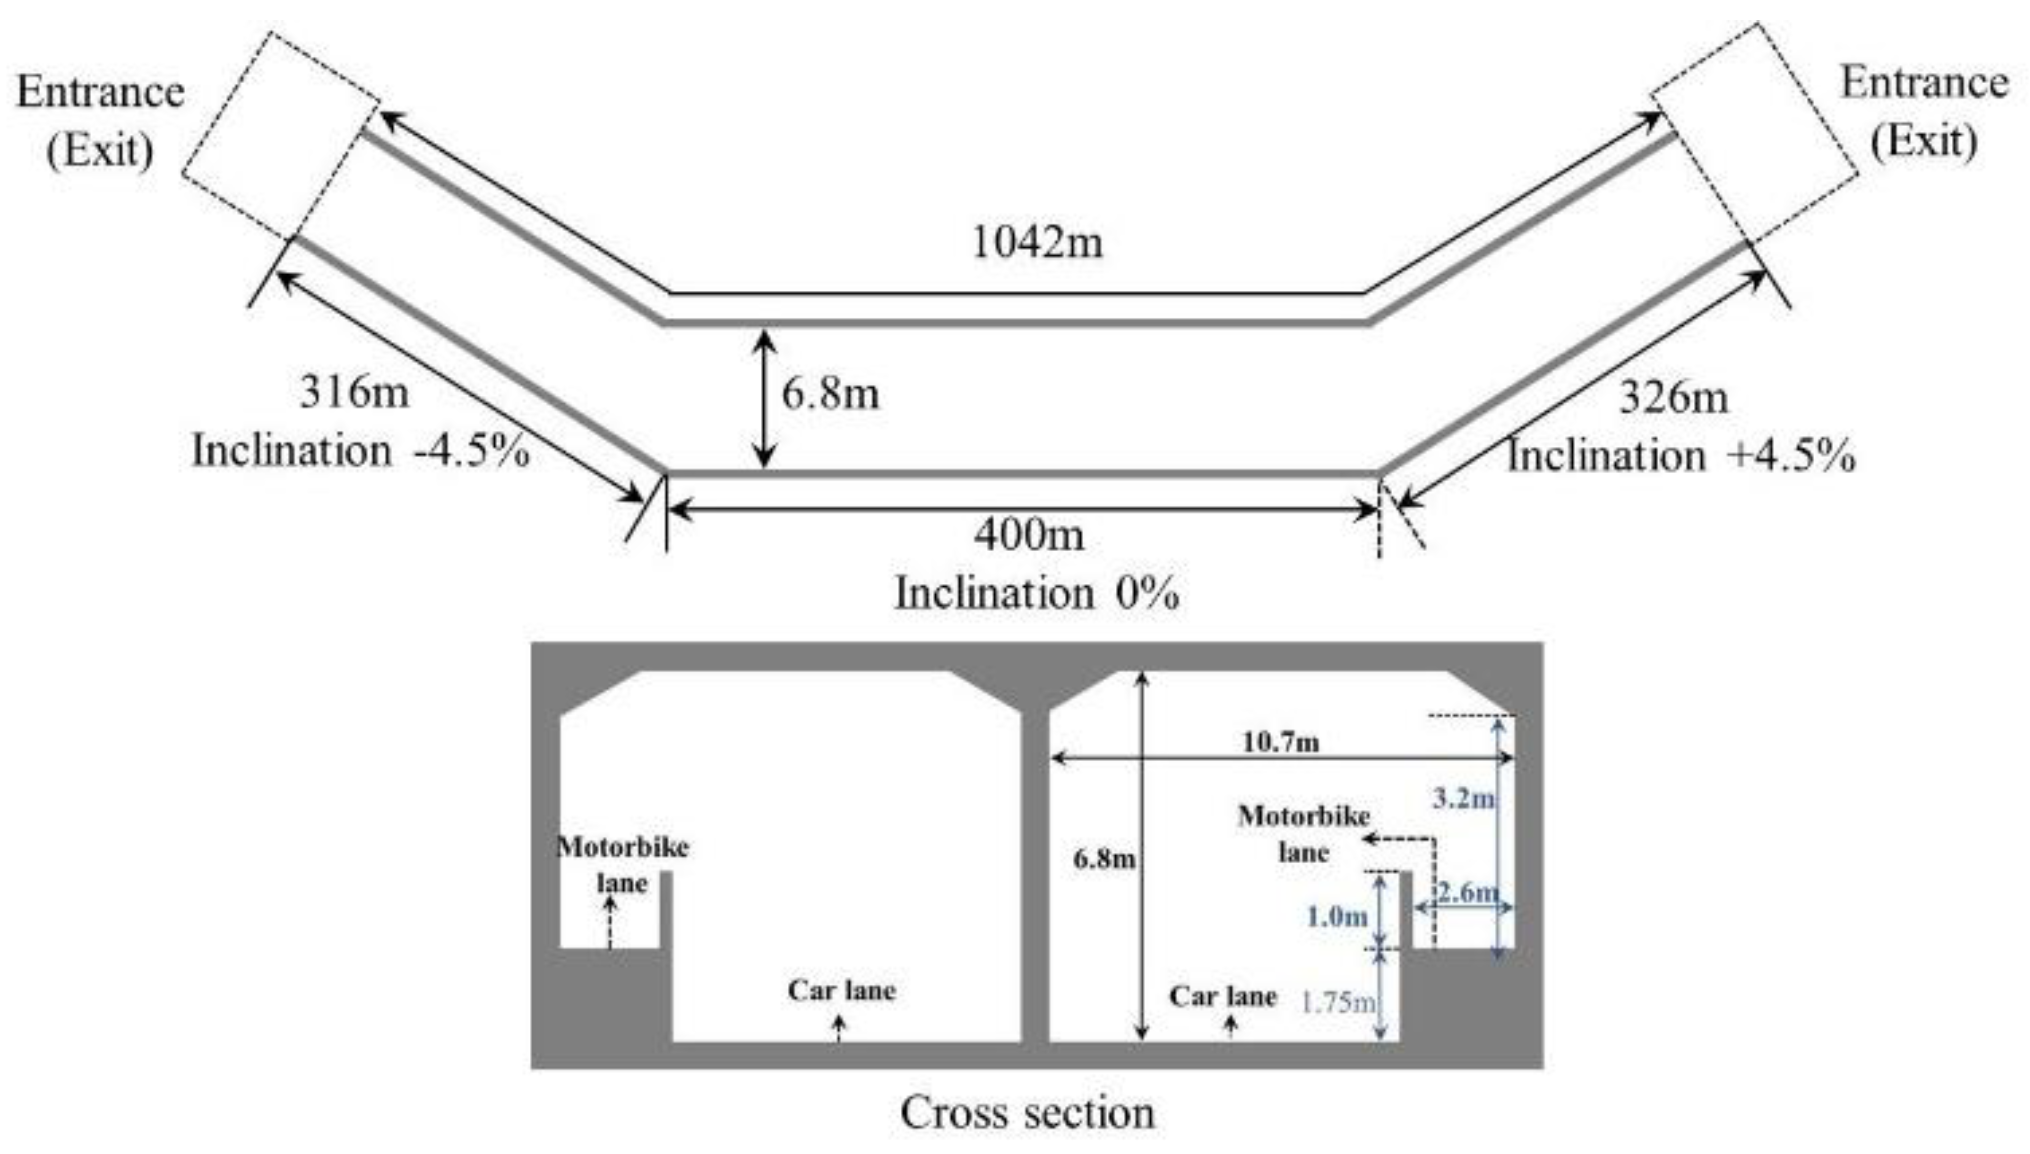
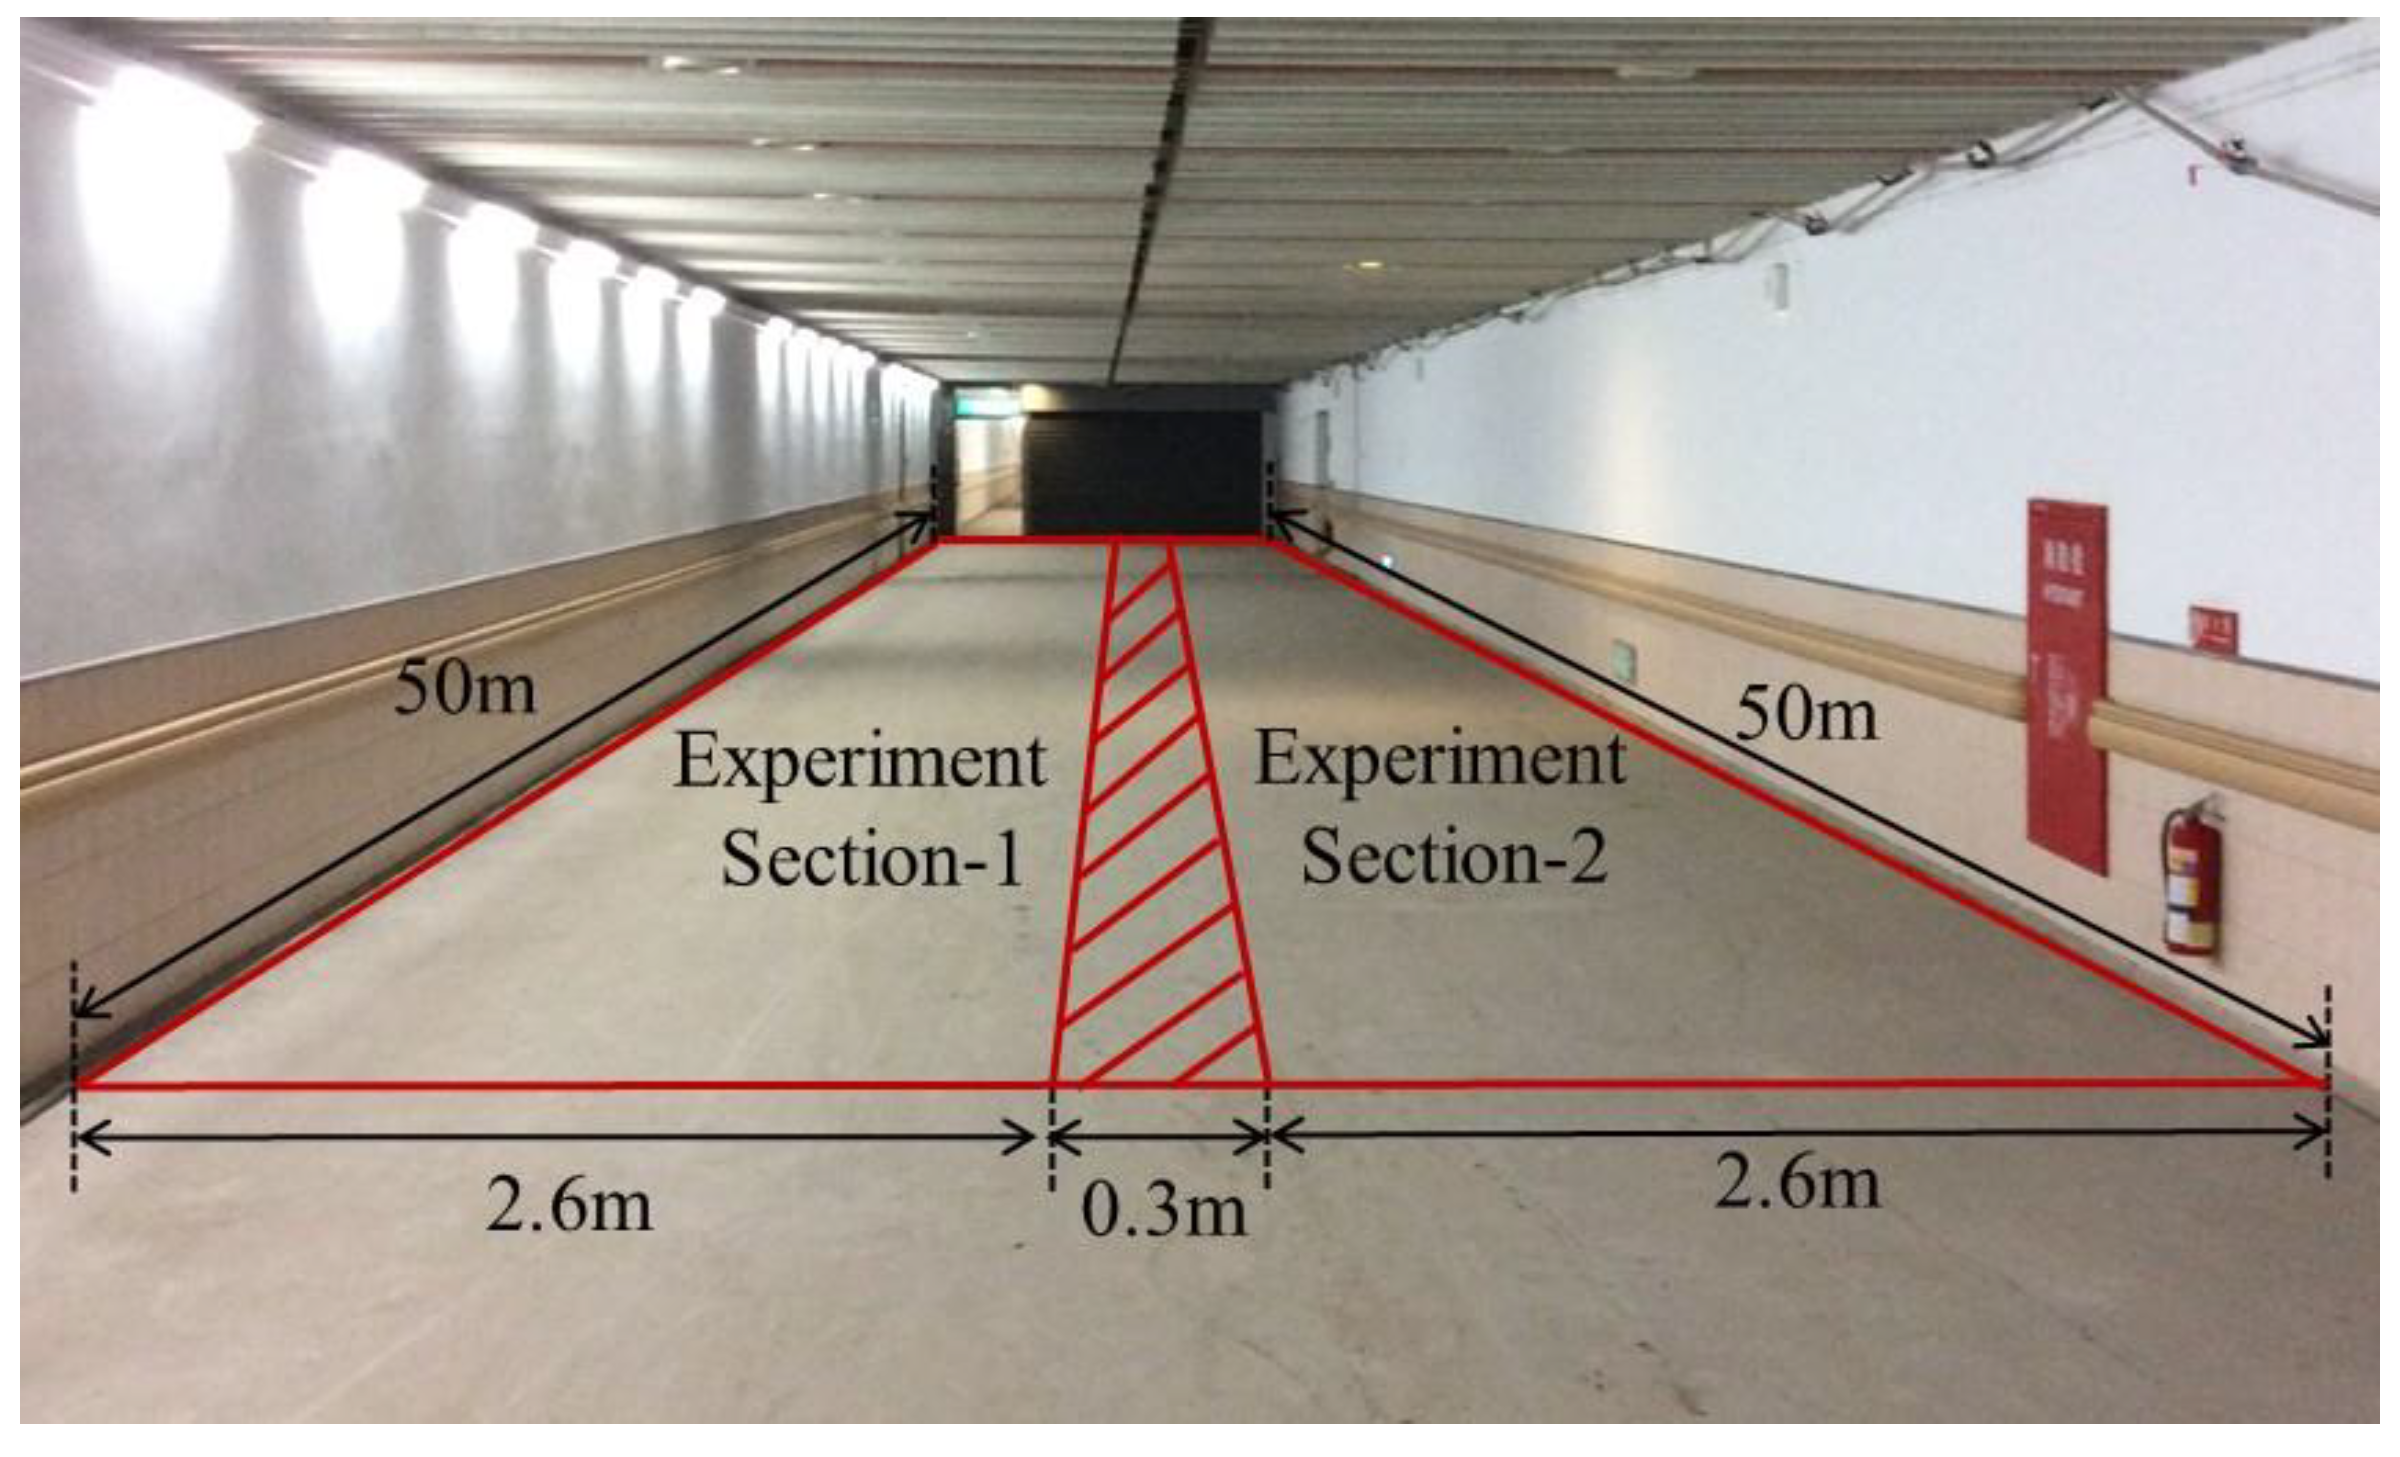
2.1. Differential Analysis of Assumed Motorbike Lane and Real Motorbike Lane in Cross-Harbor Tunnel
2.2. Experimental Conditions and Process
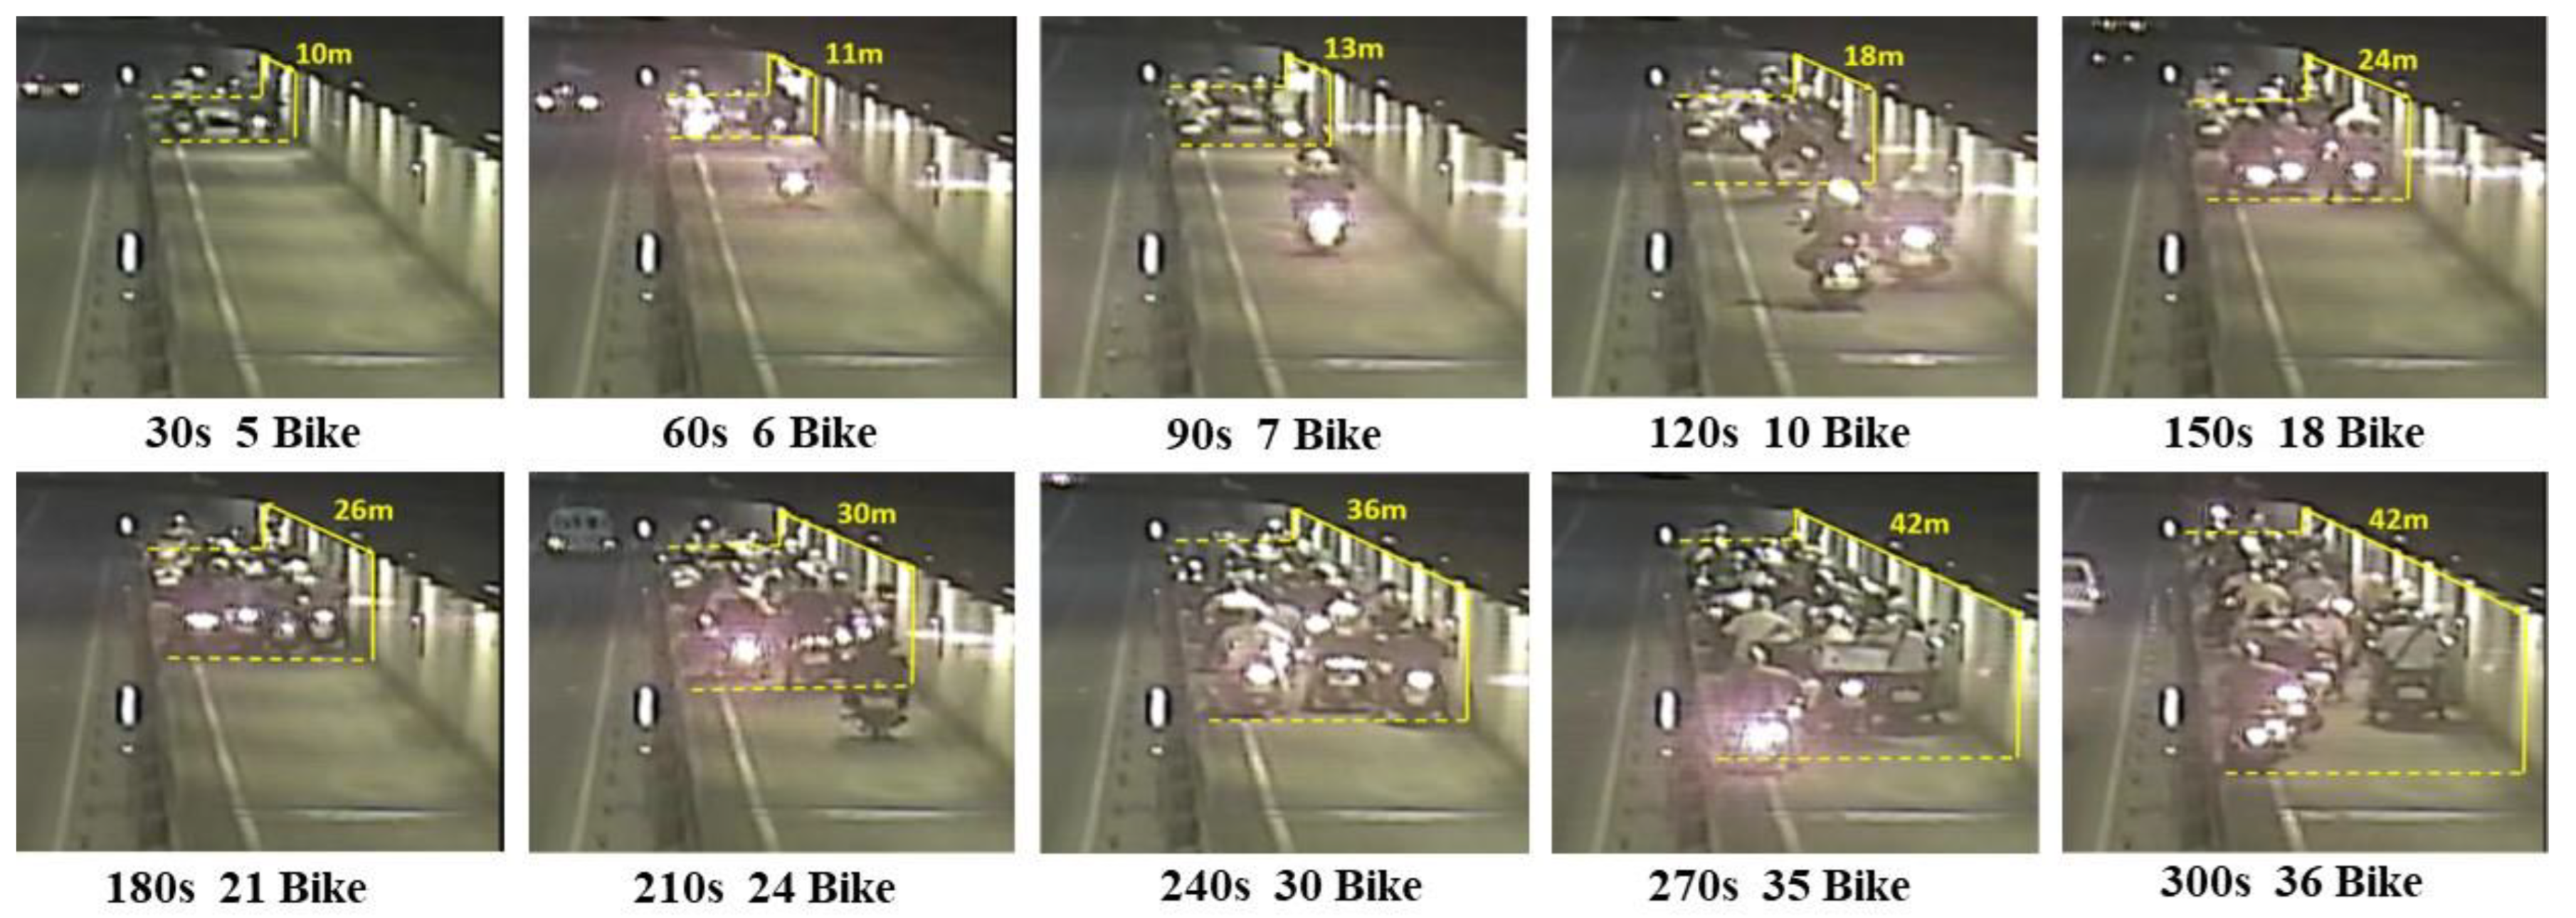
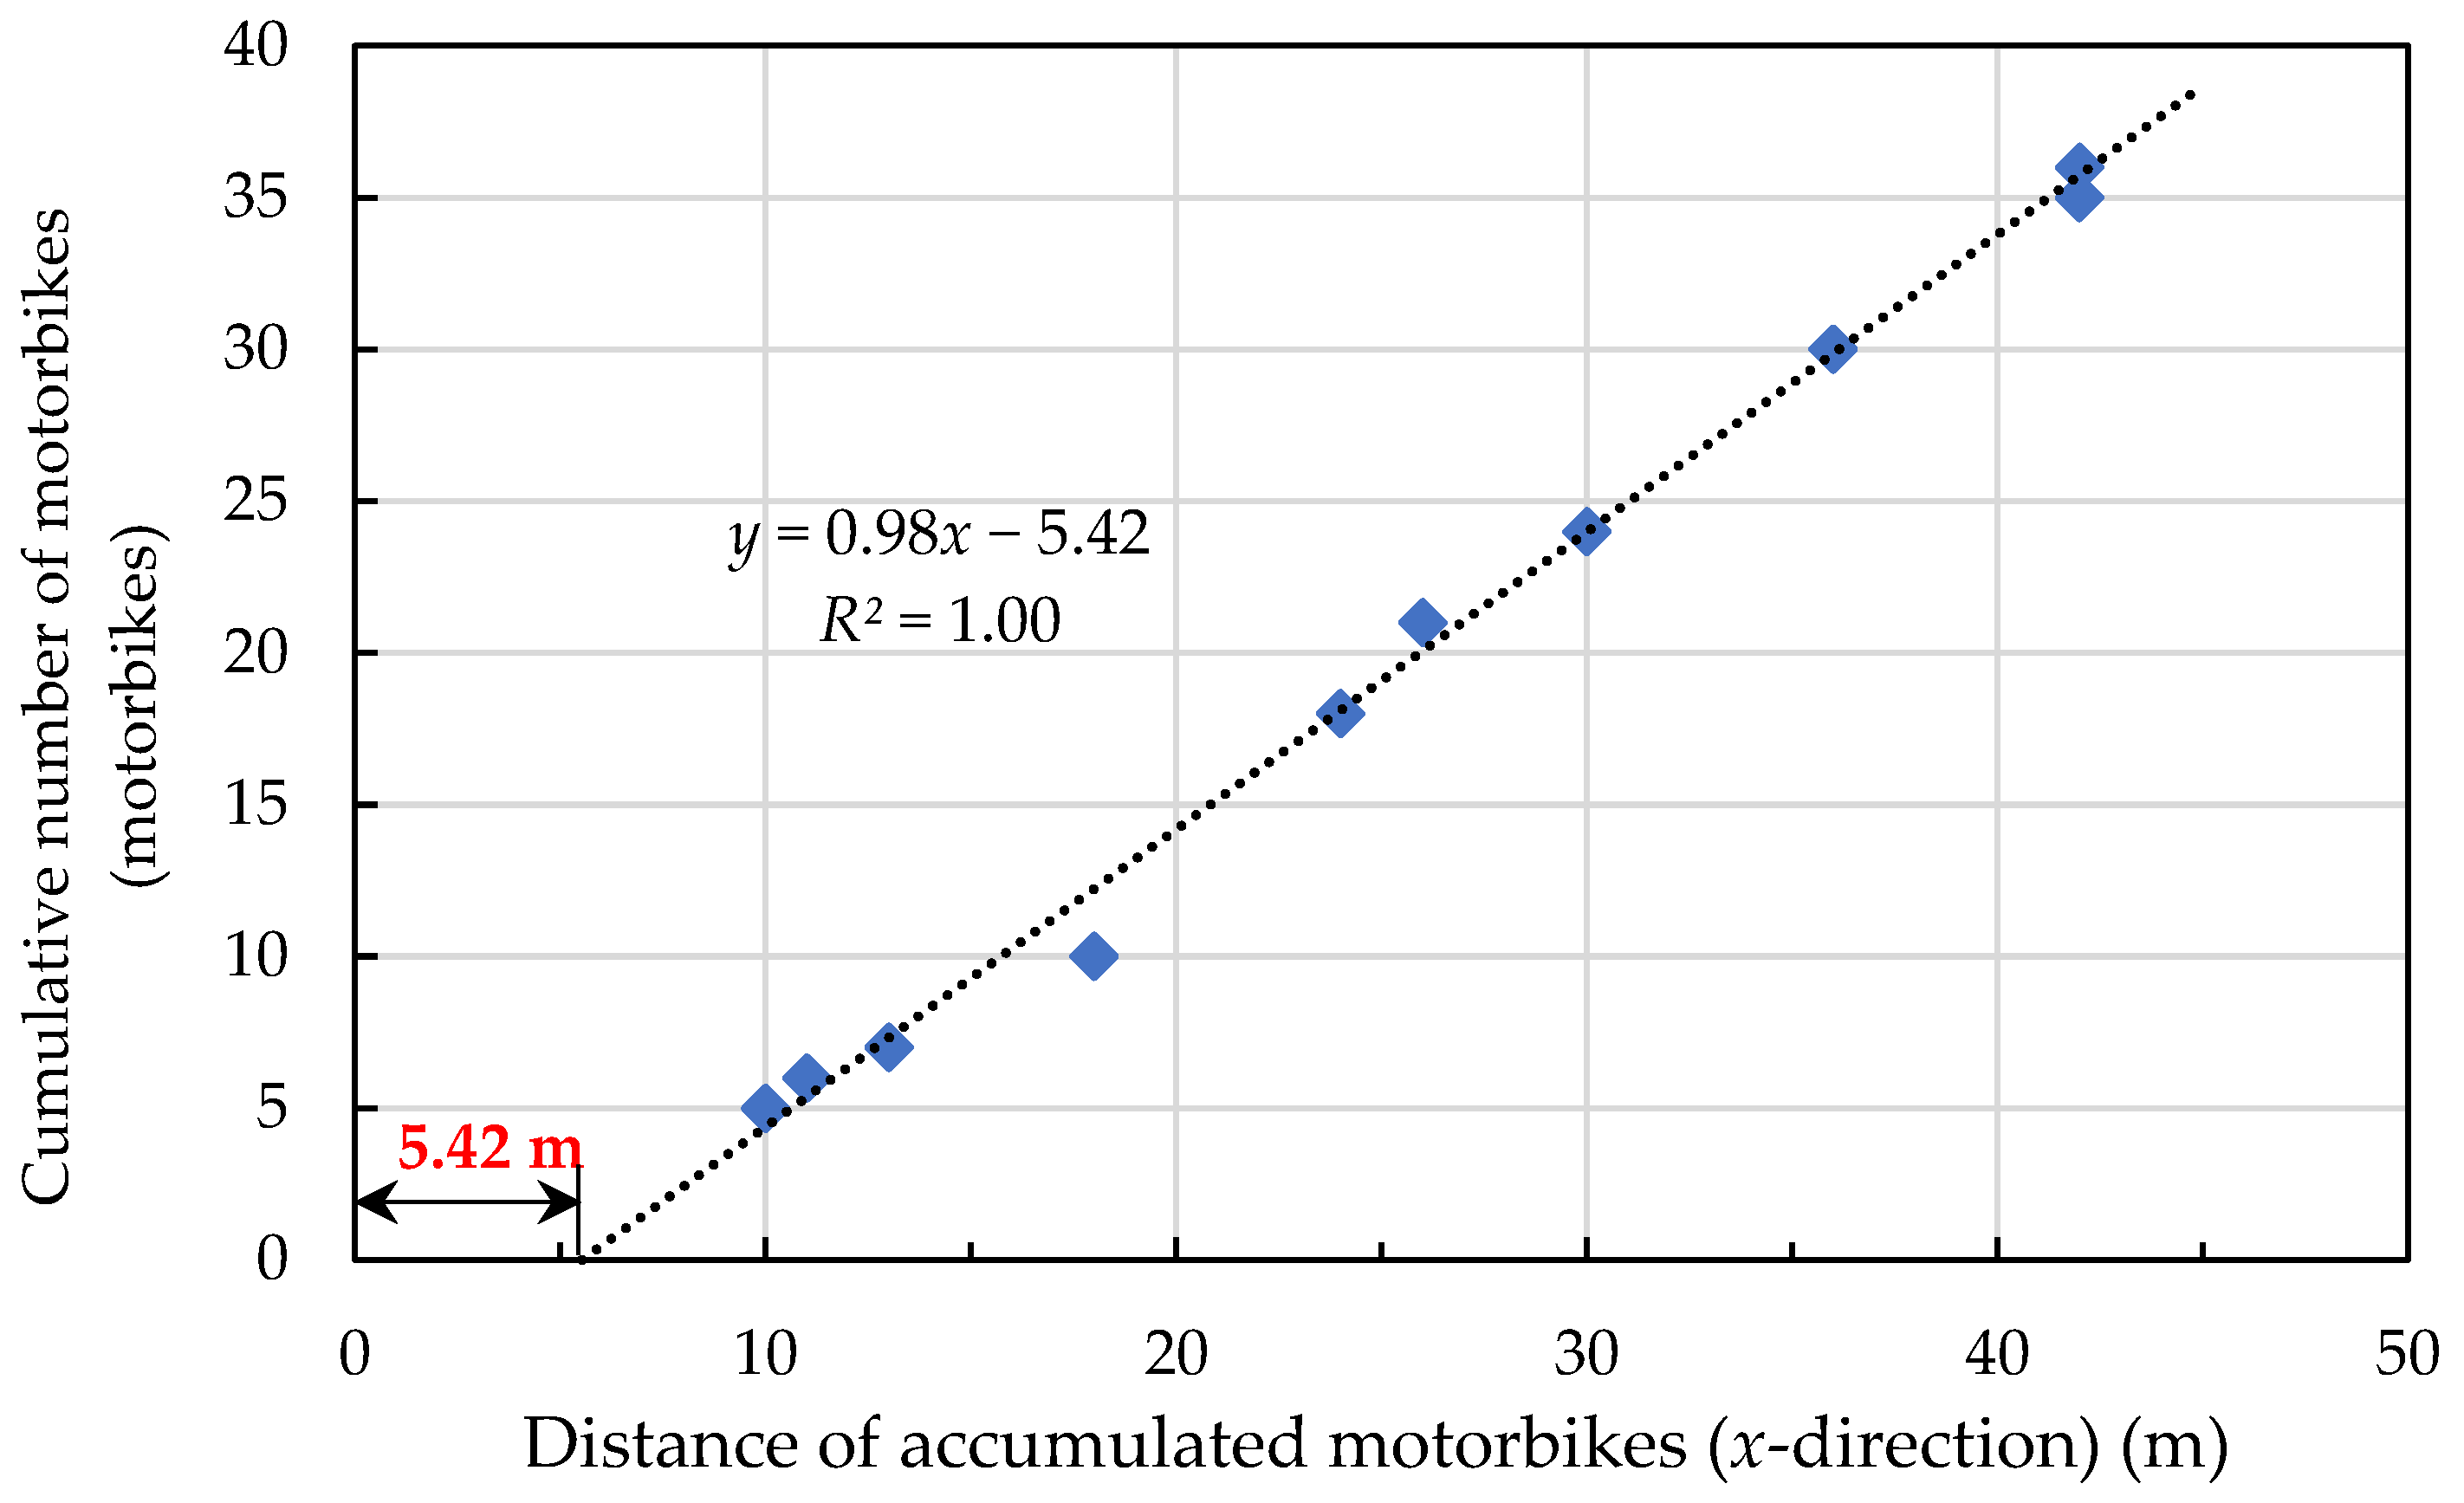
2.3. Motorbike Setup and Density Calculation
2.4. Experimental Subjects and Density Calculation
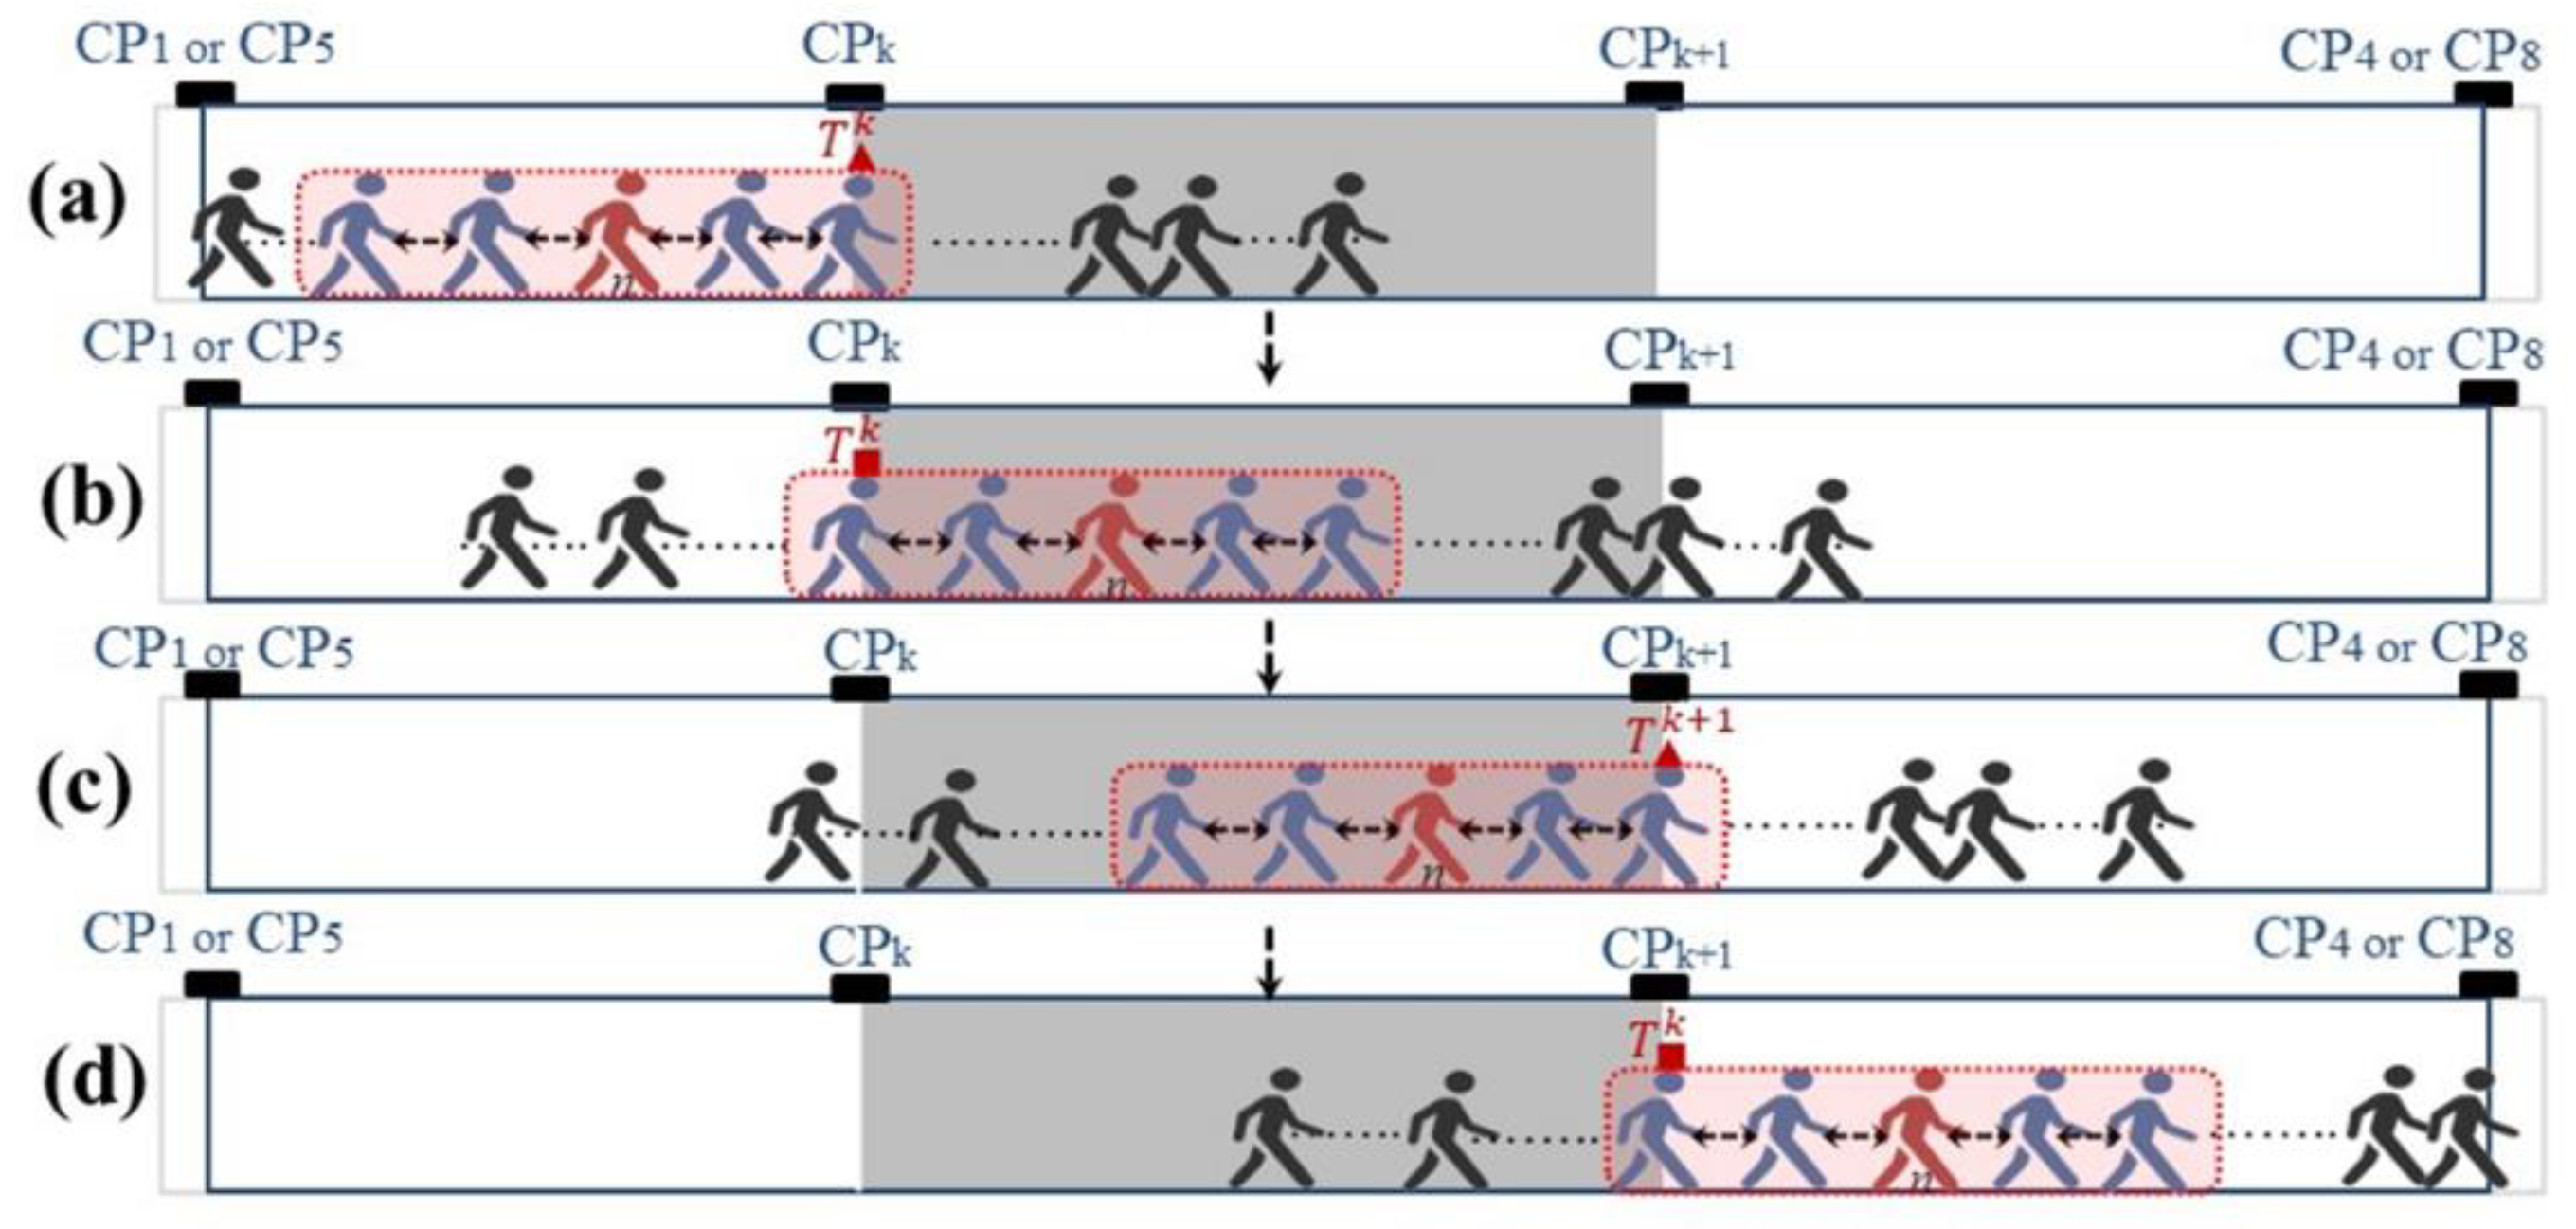
2.5. Calculation of Time Intervals in Specific Sections
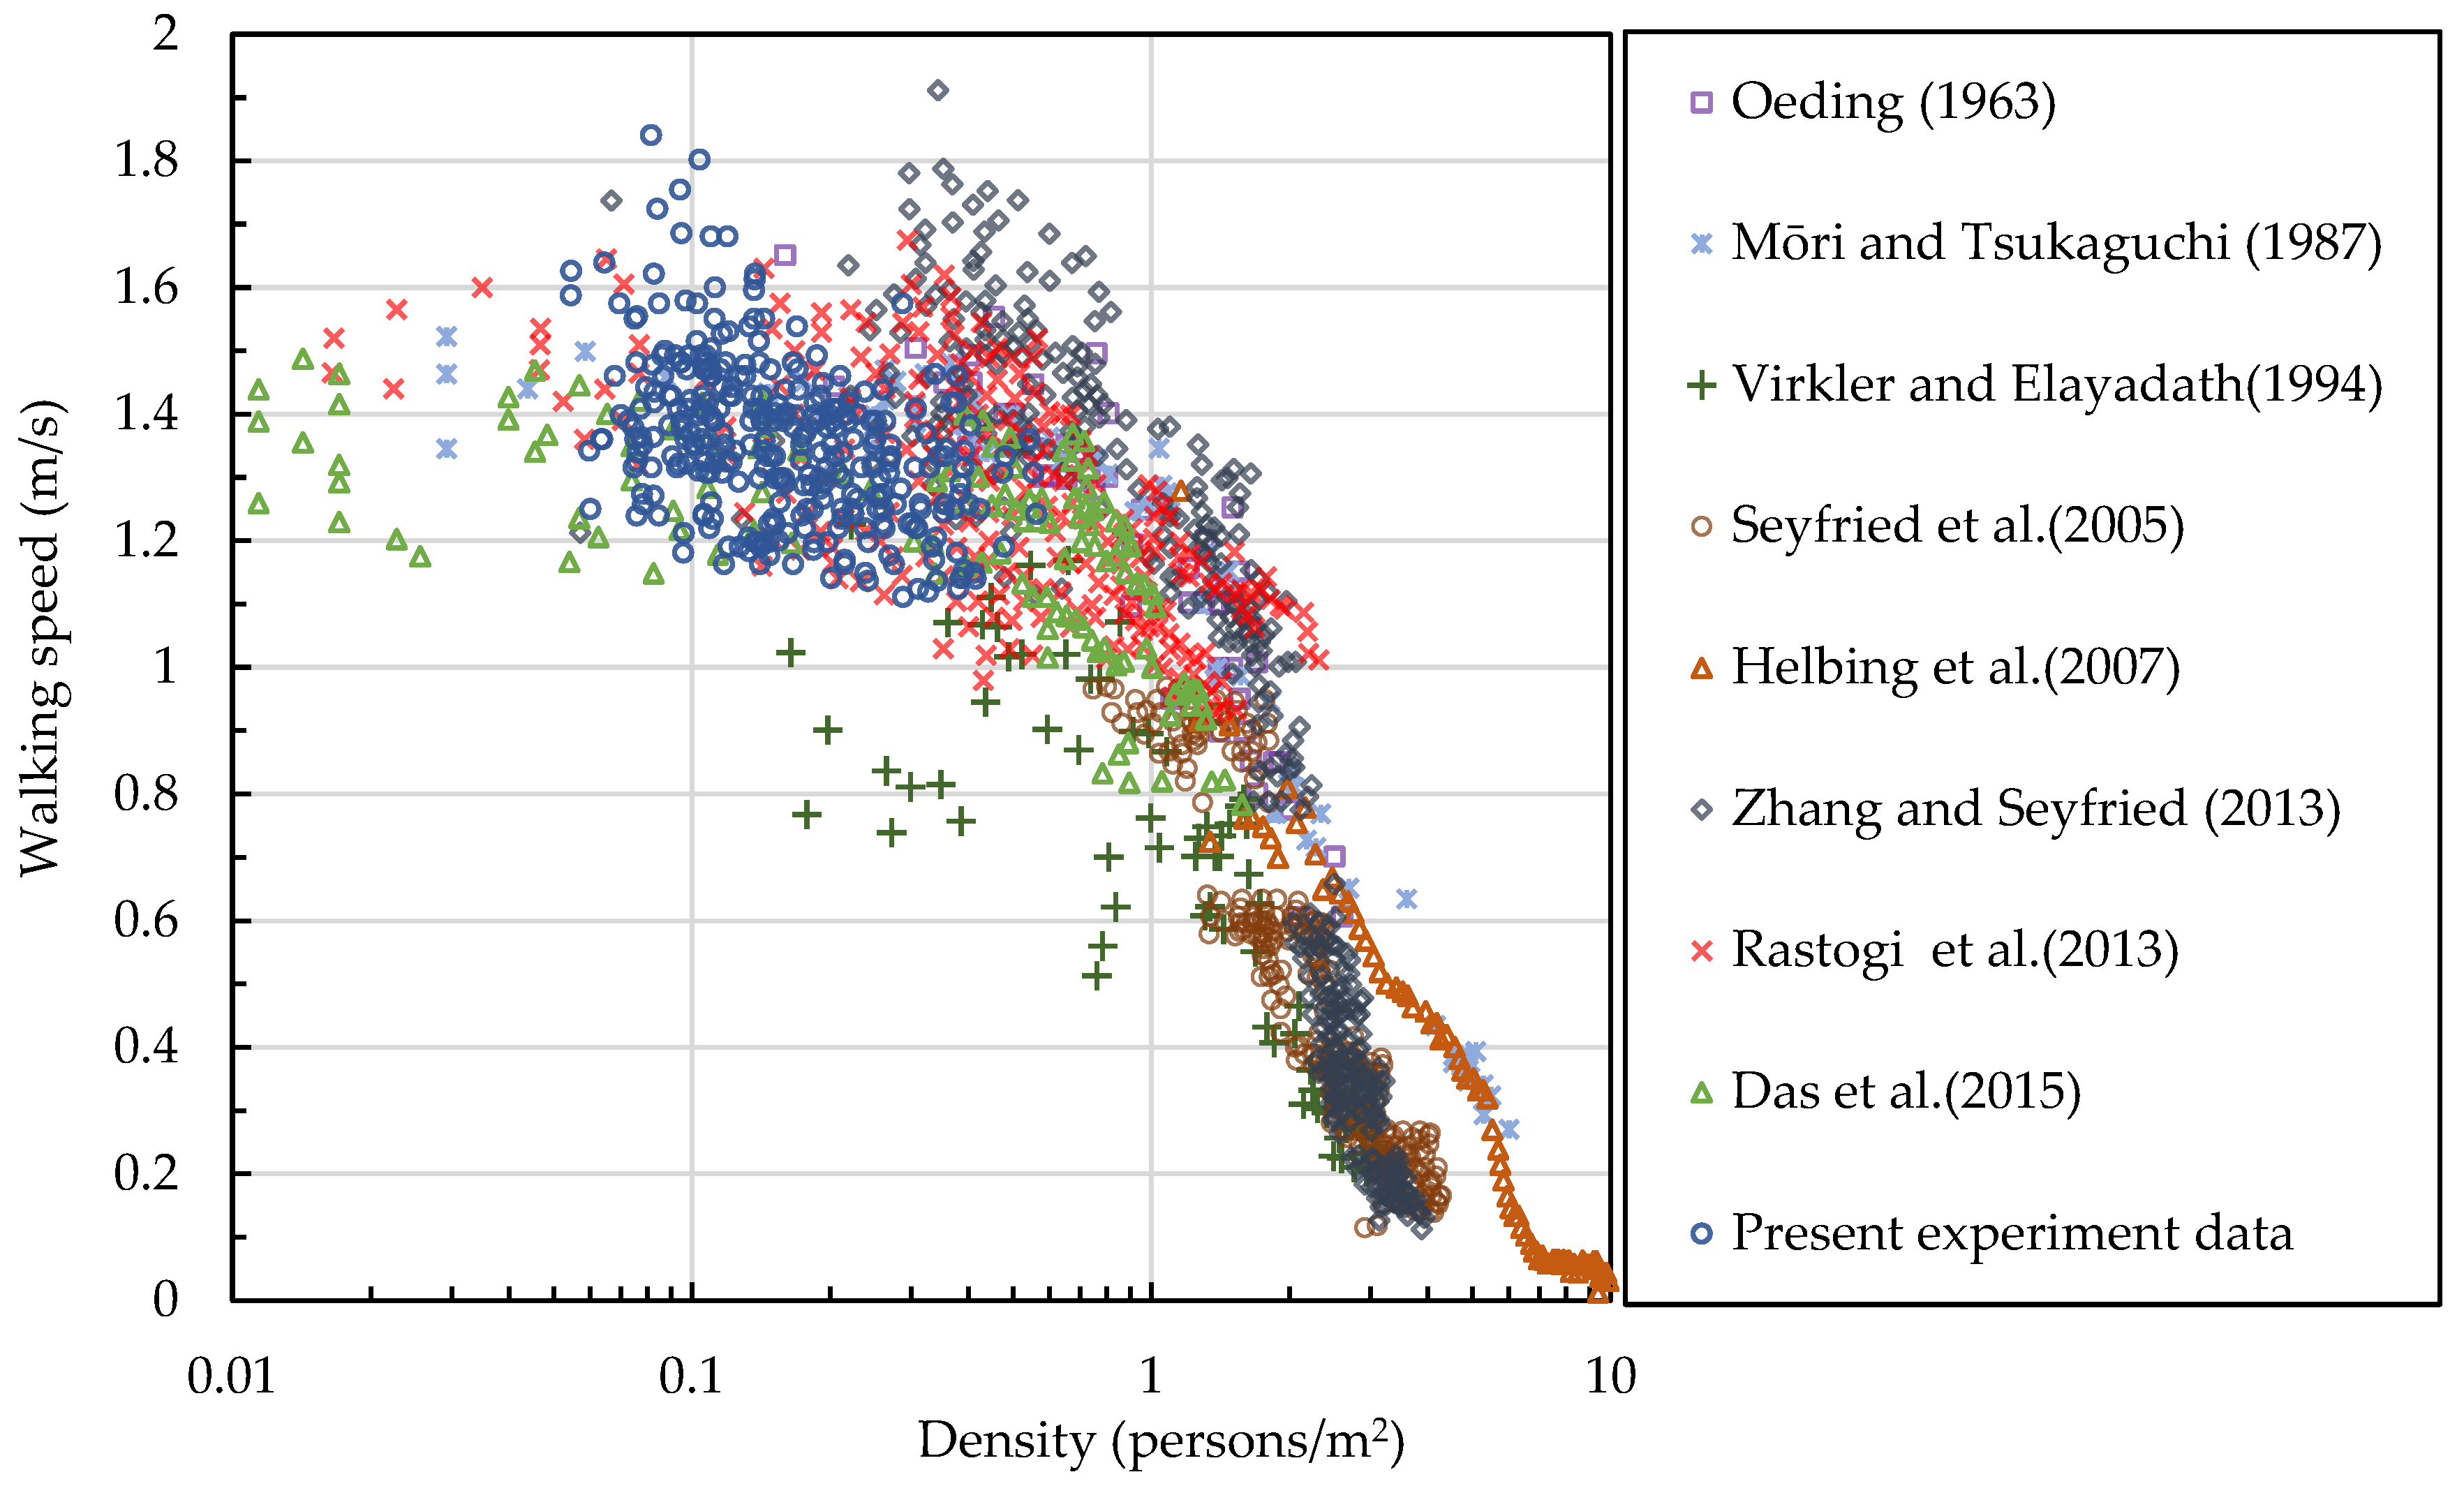
3. Influence of Evacuee Density on Walking Speed
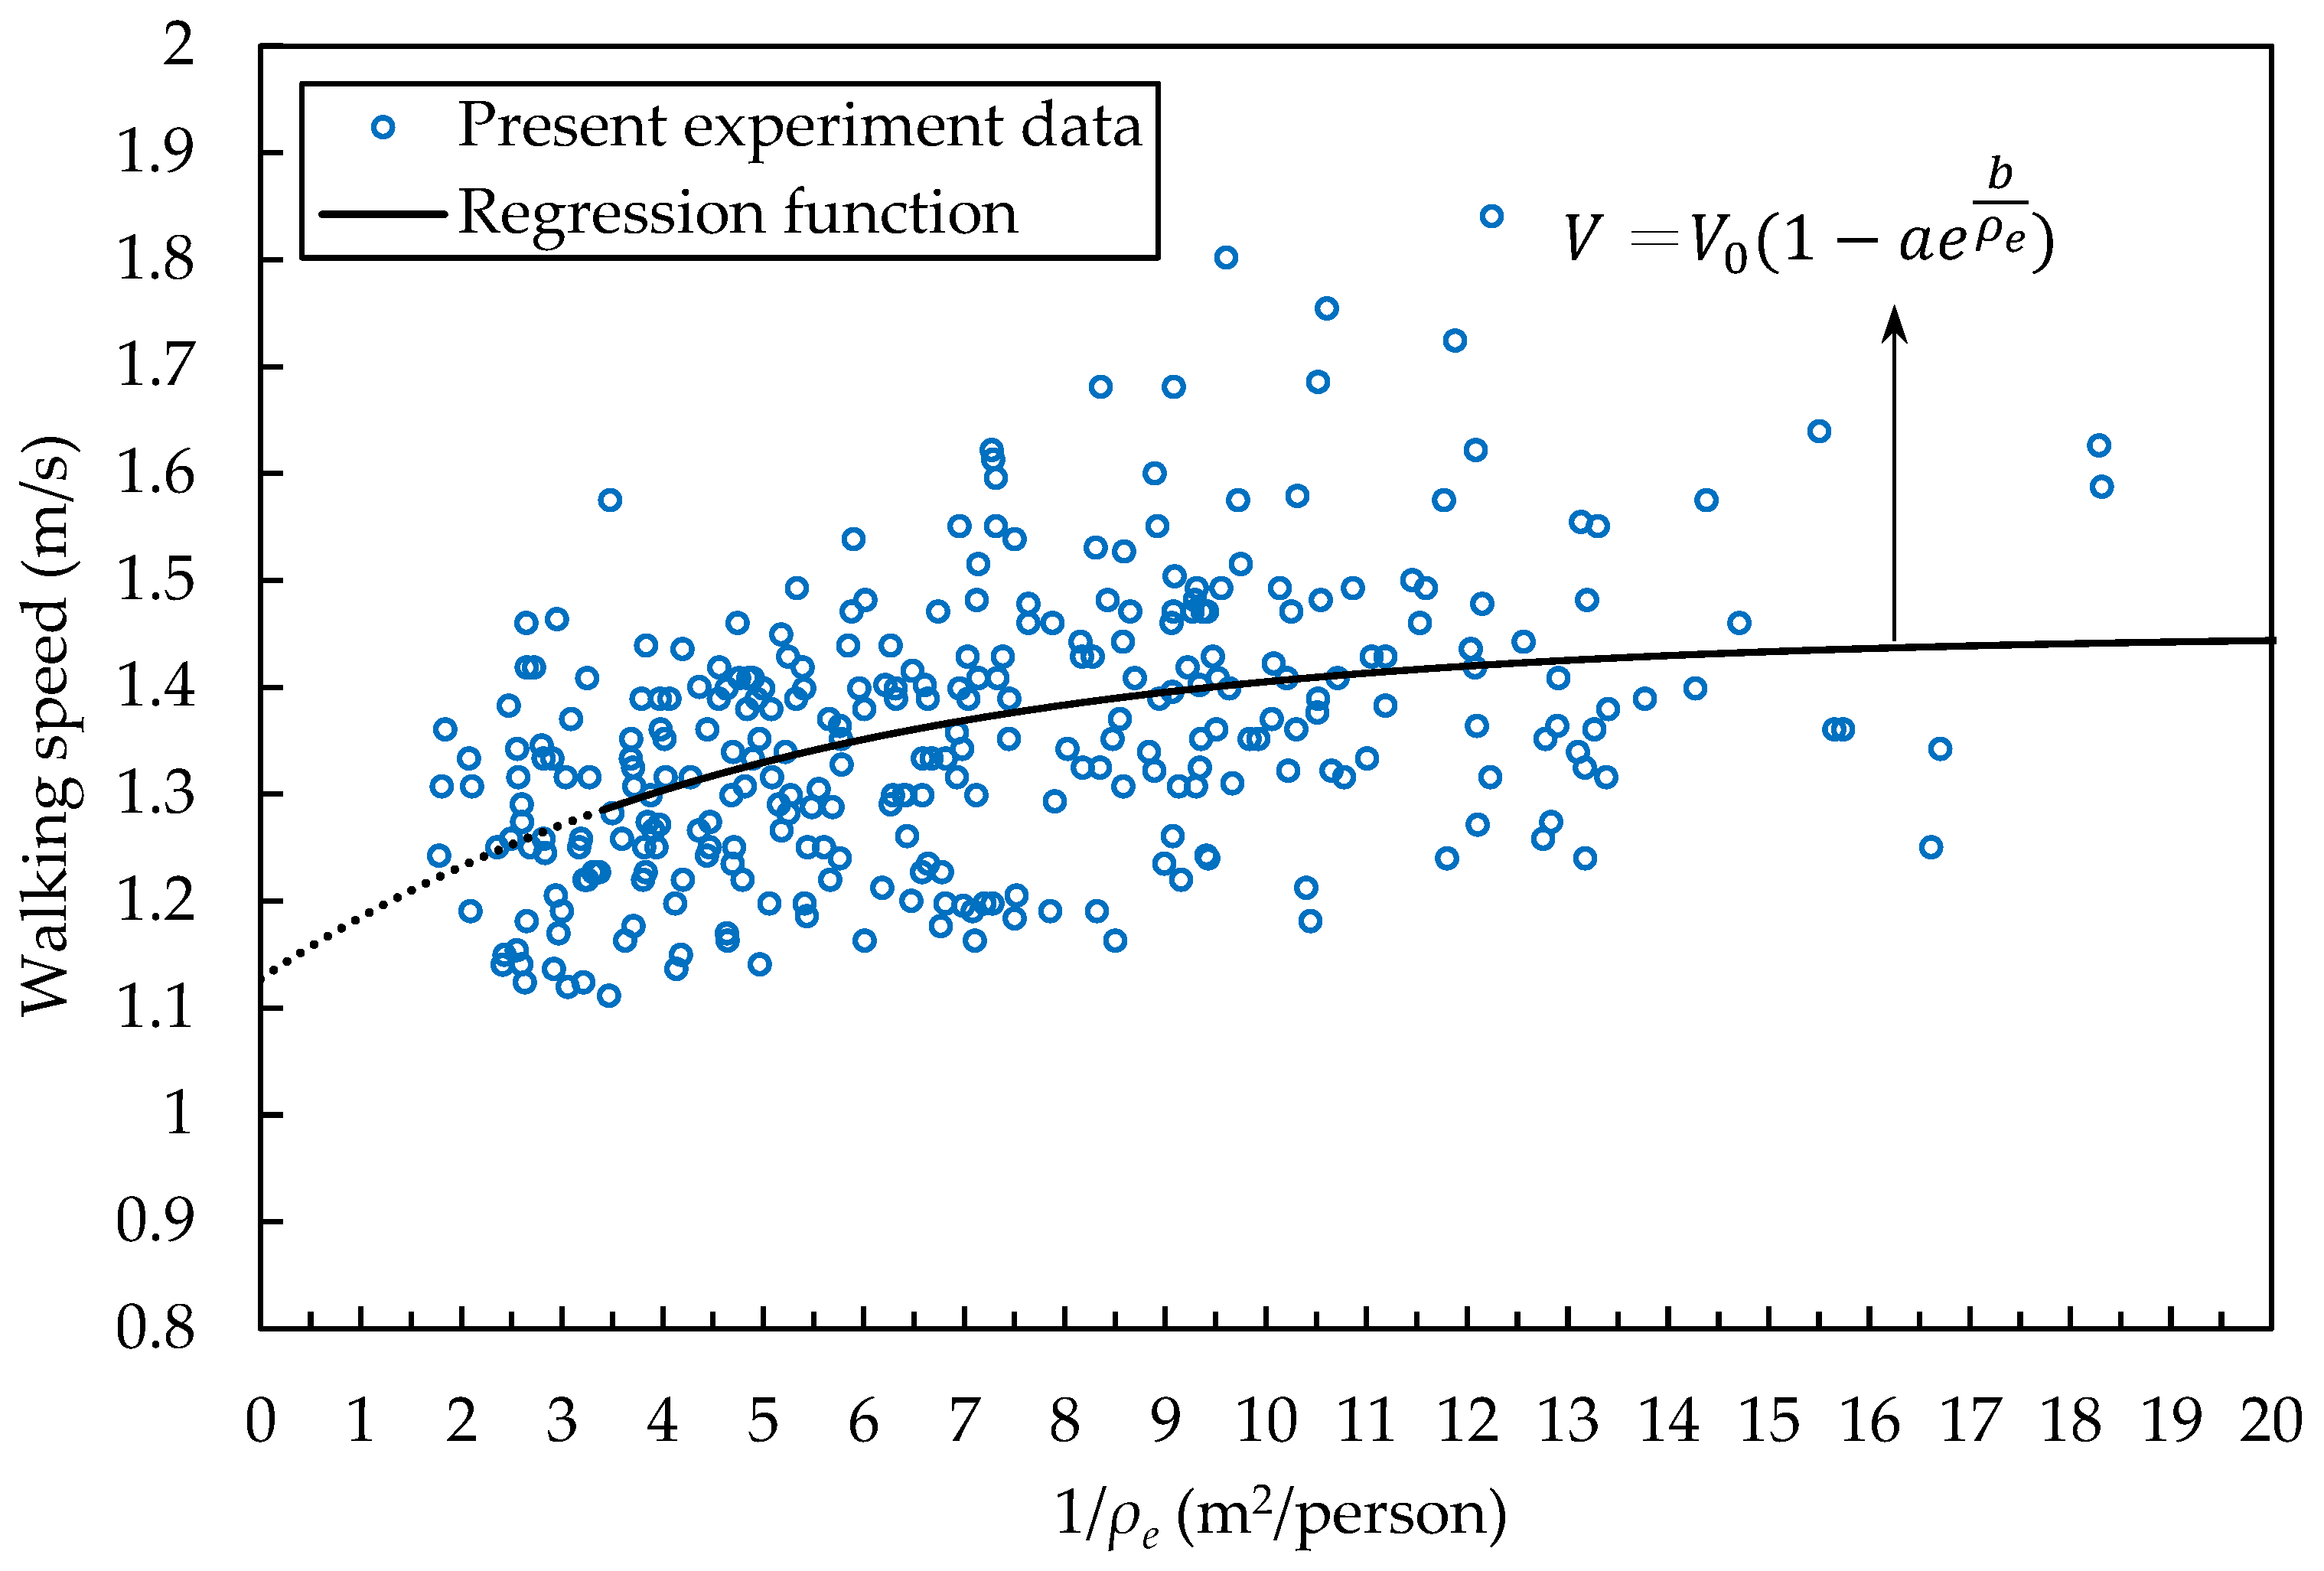
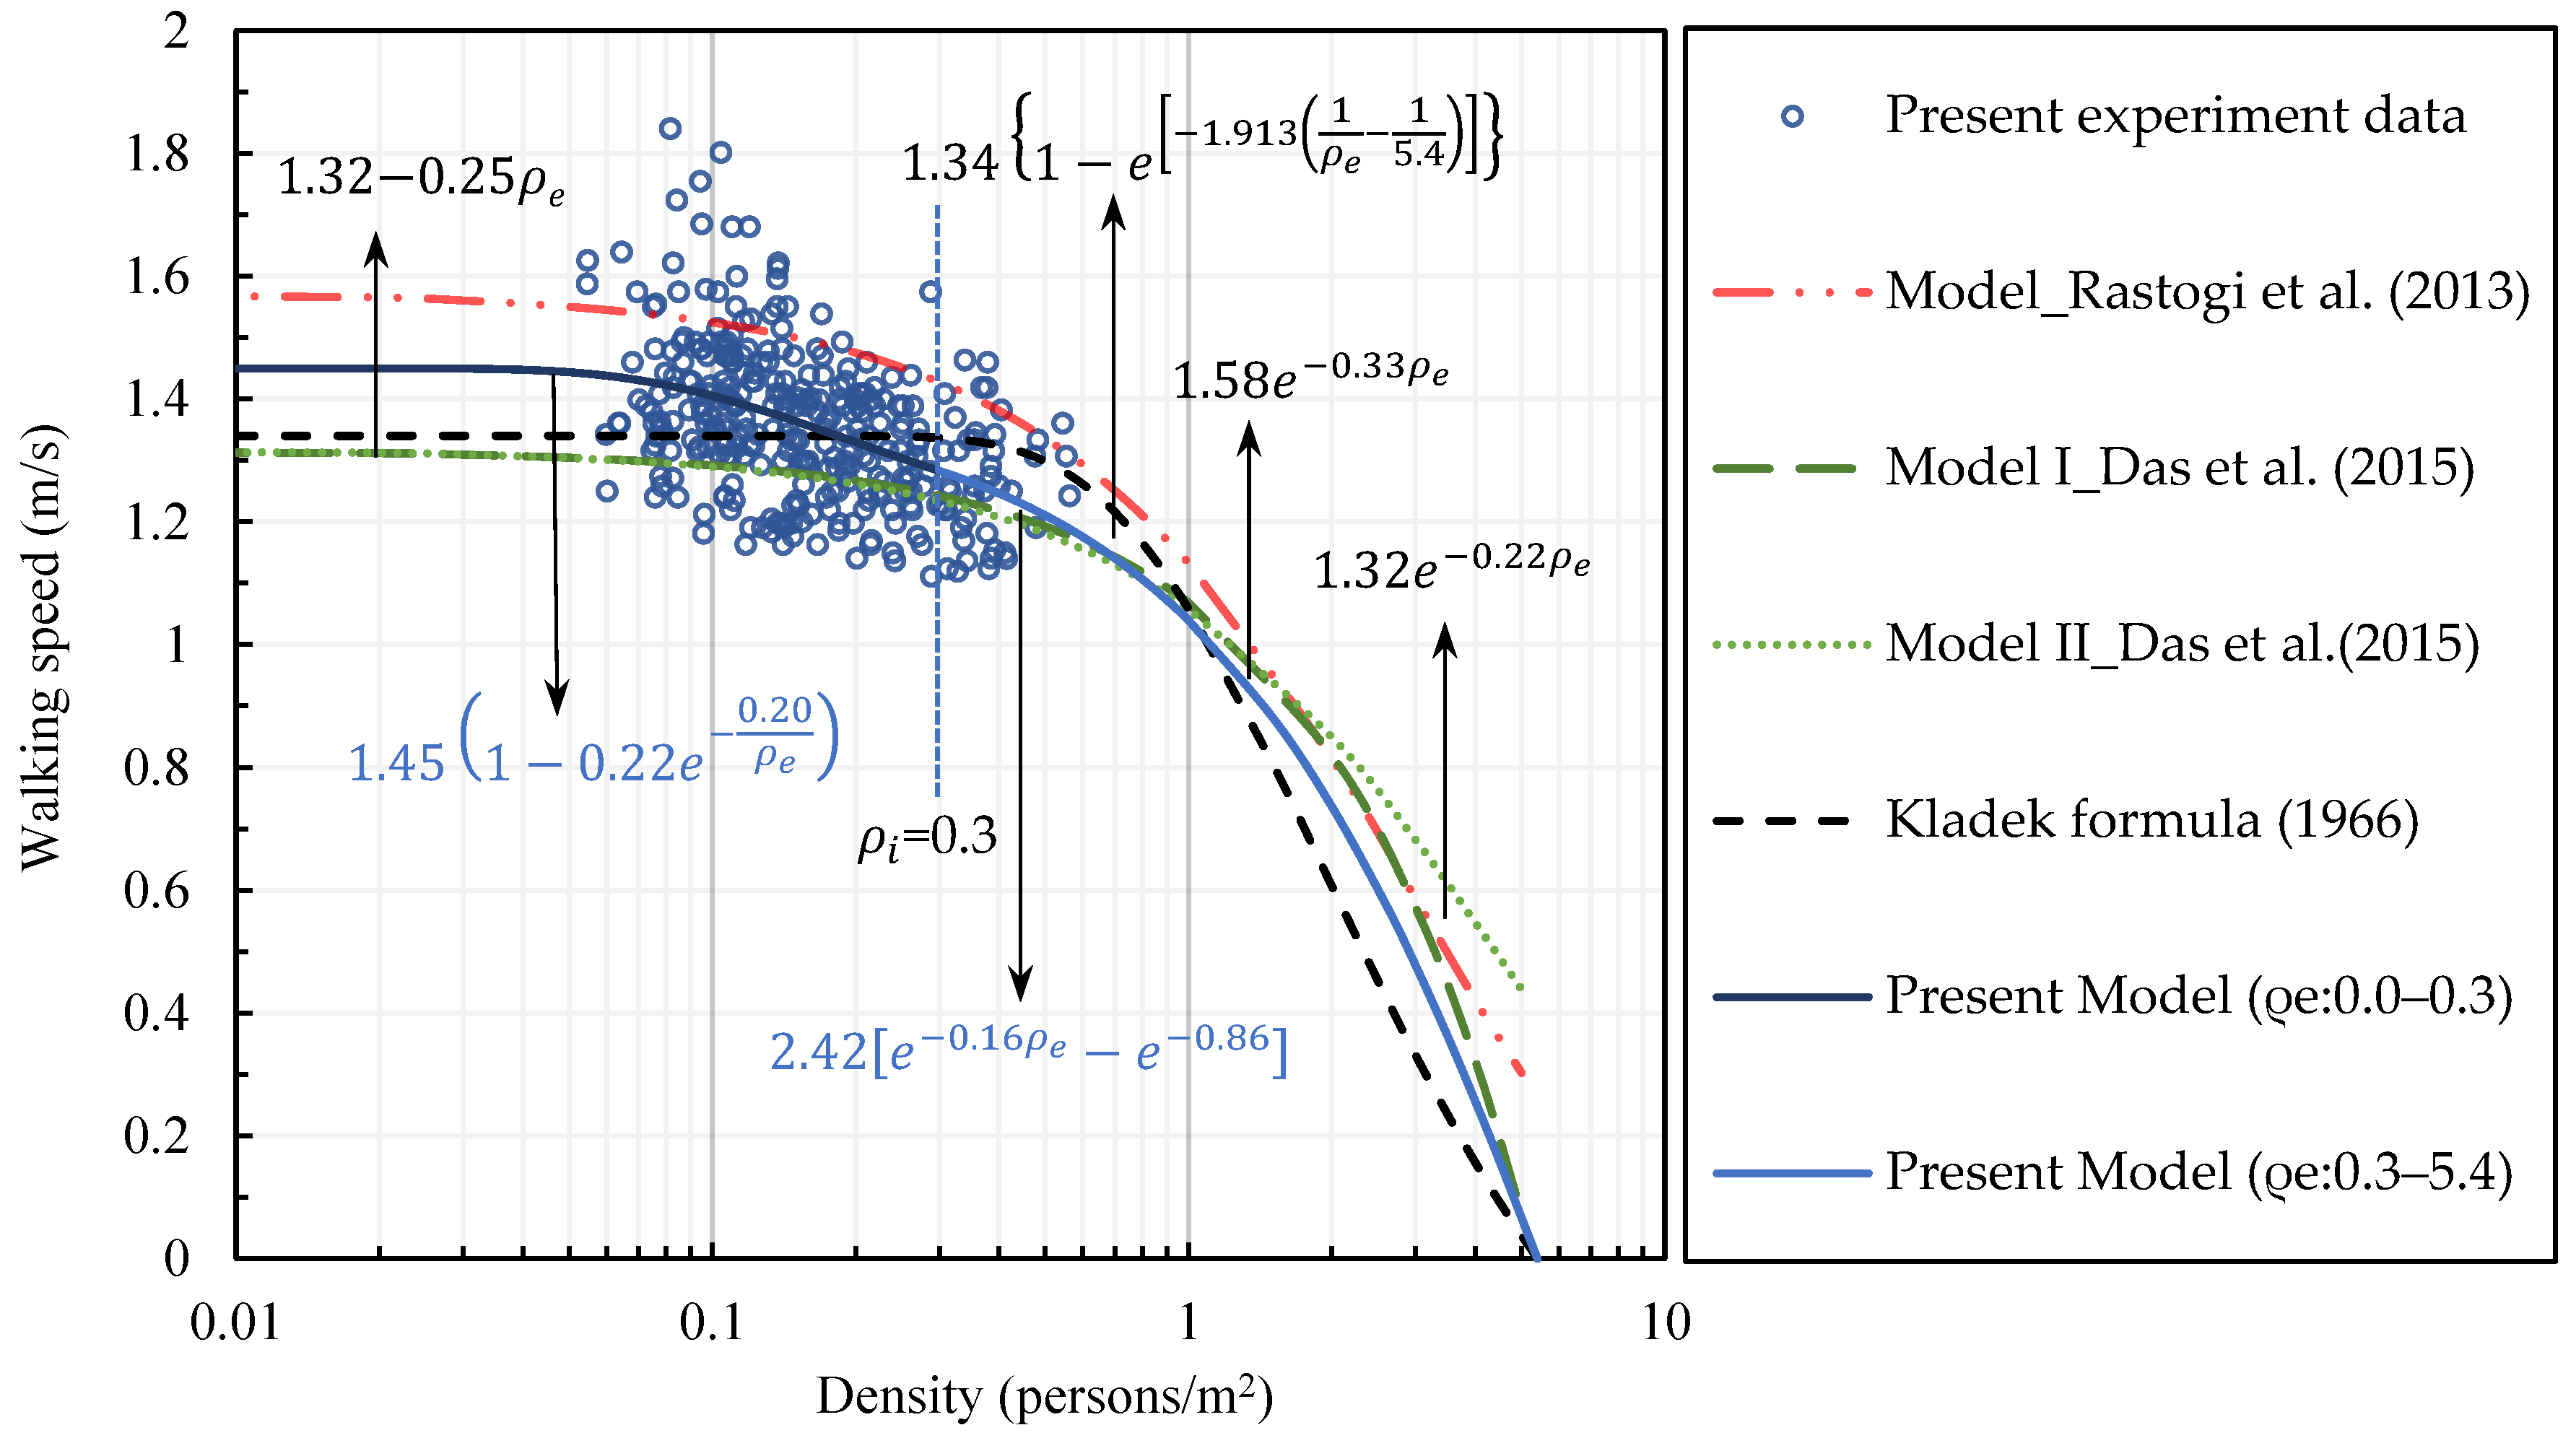
3.1. Walking Speed in the No-Motorbike Section and Modeling
3.2. Two-Regime Models for Walking Speed
- (1) The same walking speed between Equations (5) and (6) in the condition of density .
- (2) The same slope conditions between Equations (5) and (6).
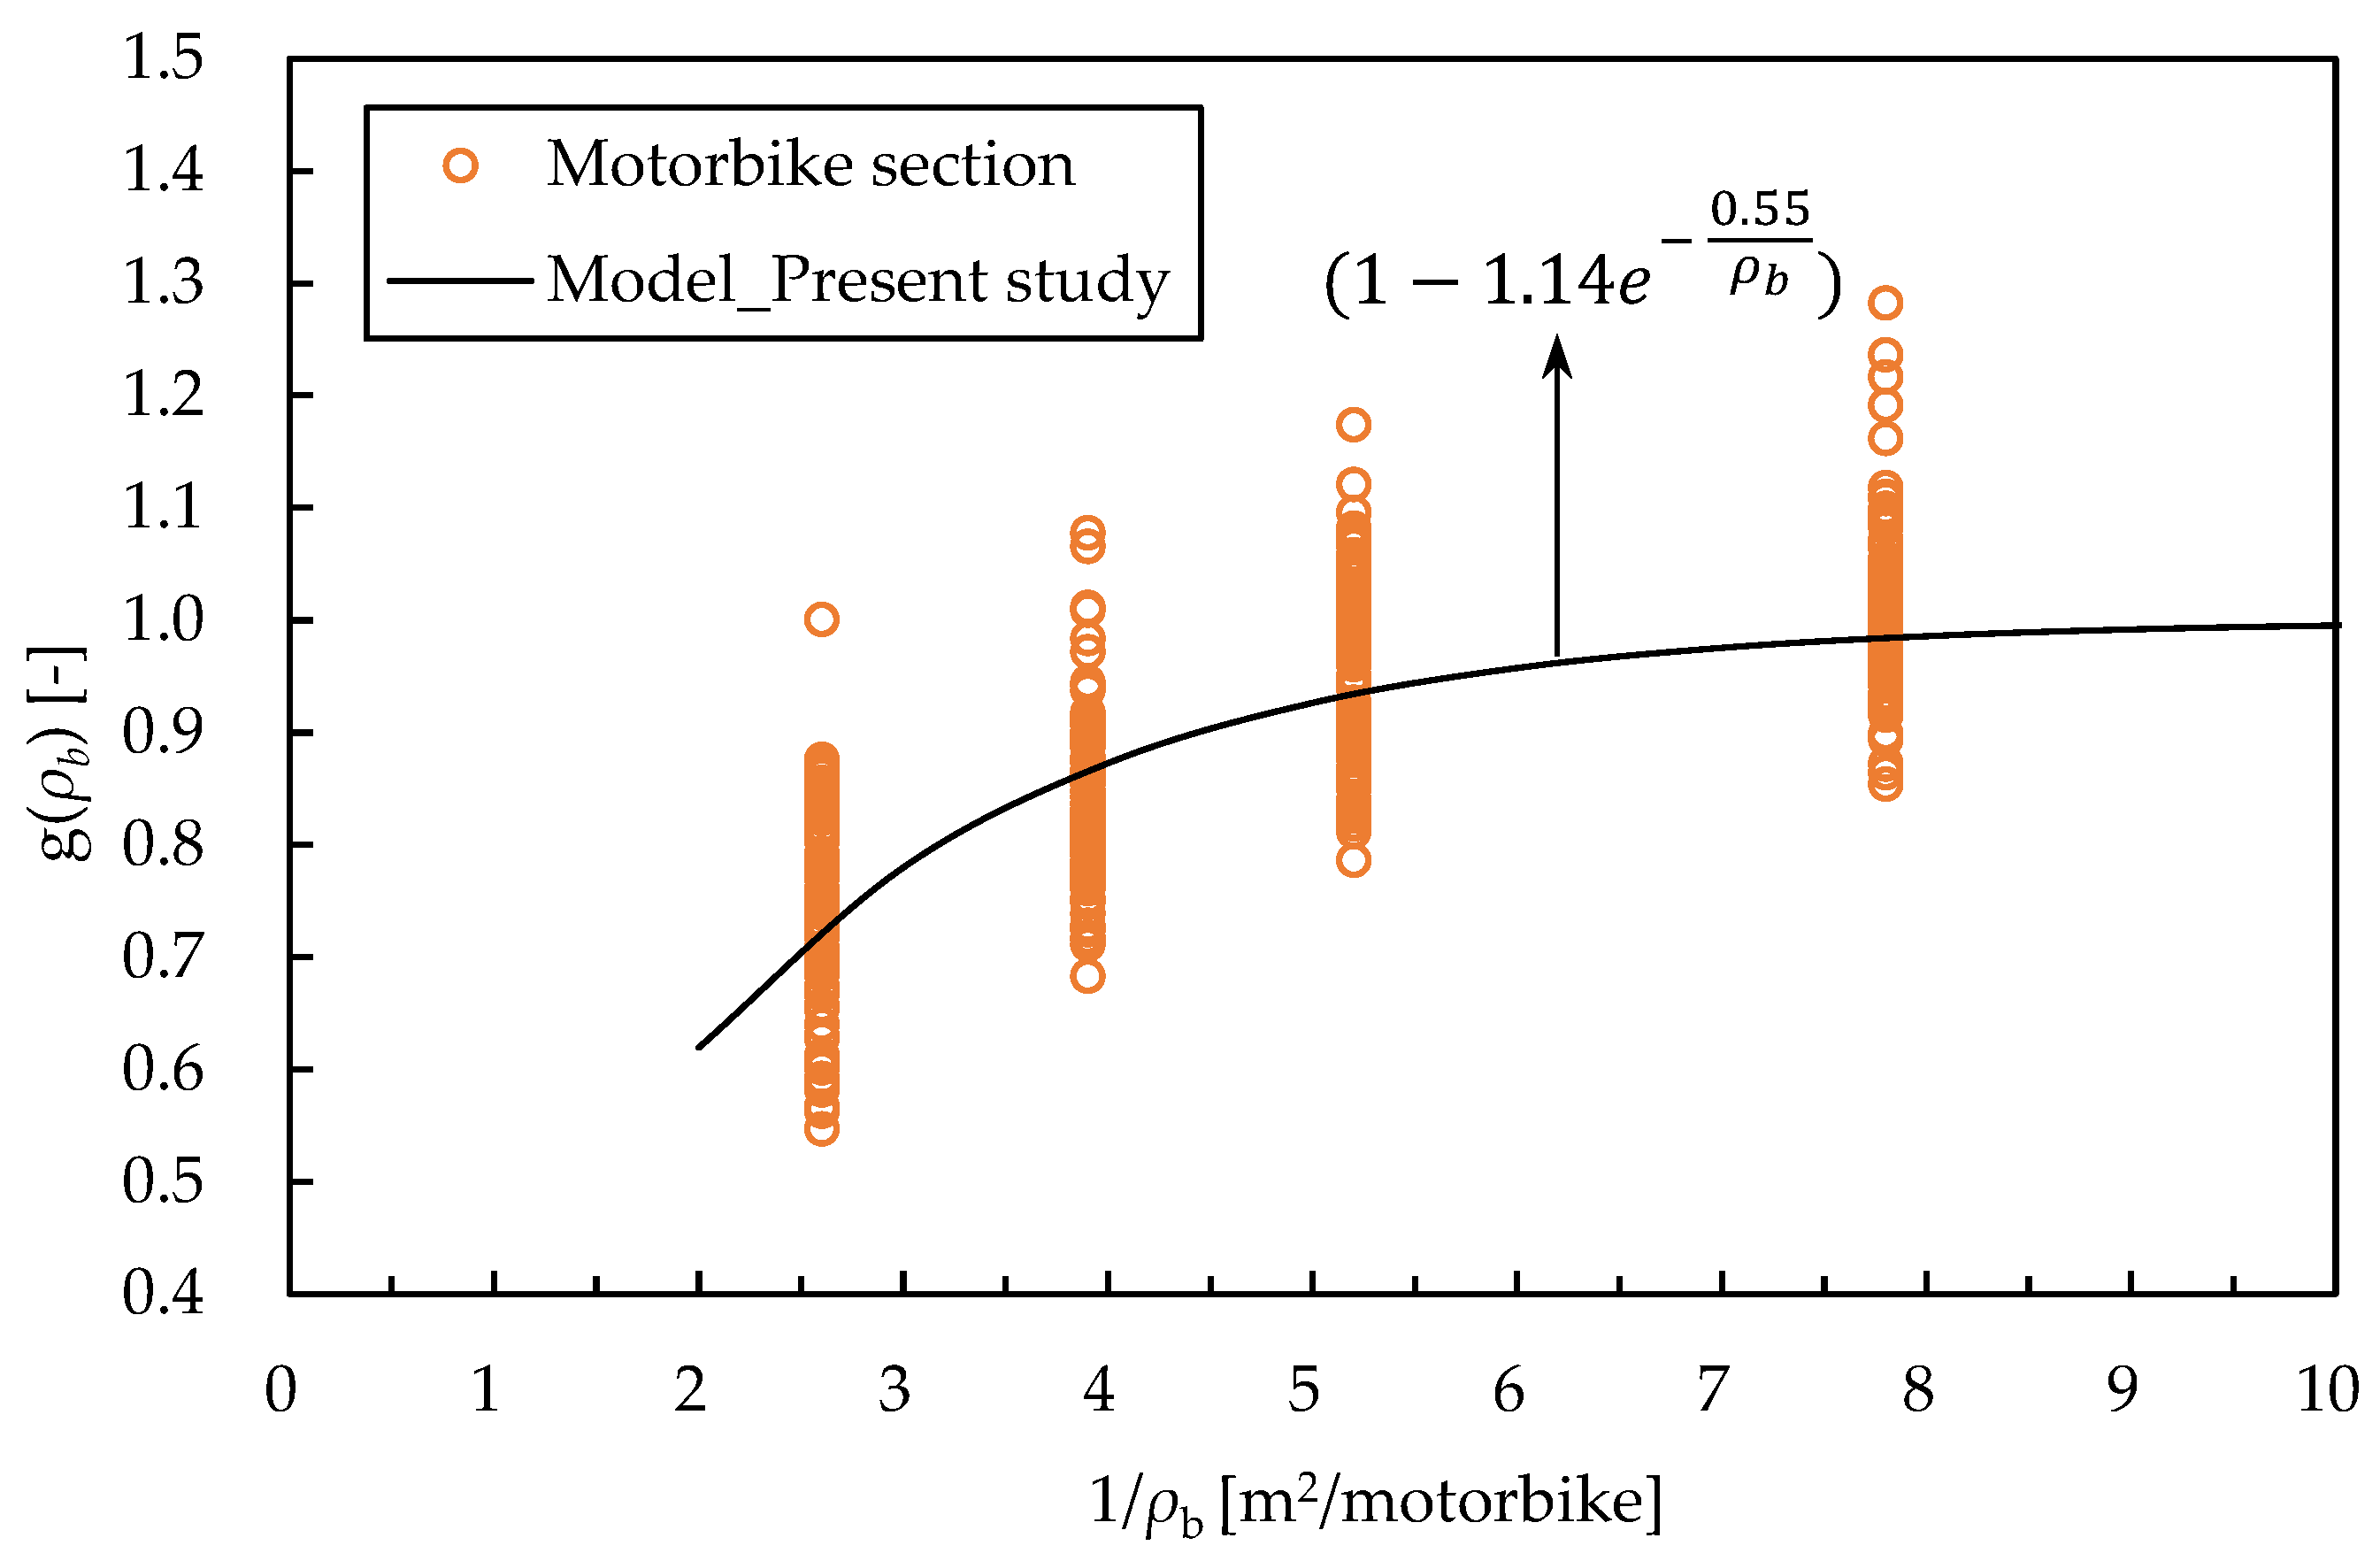
4. Influence of Motorbike Density on Walking Speed
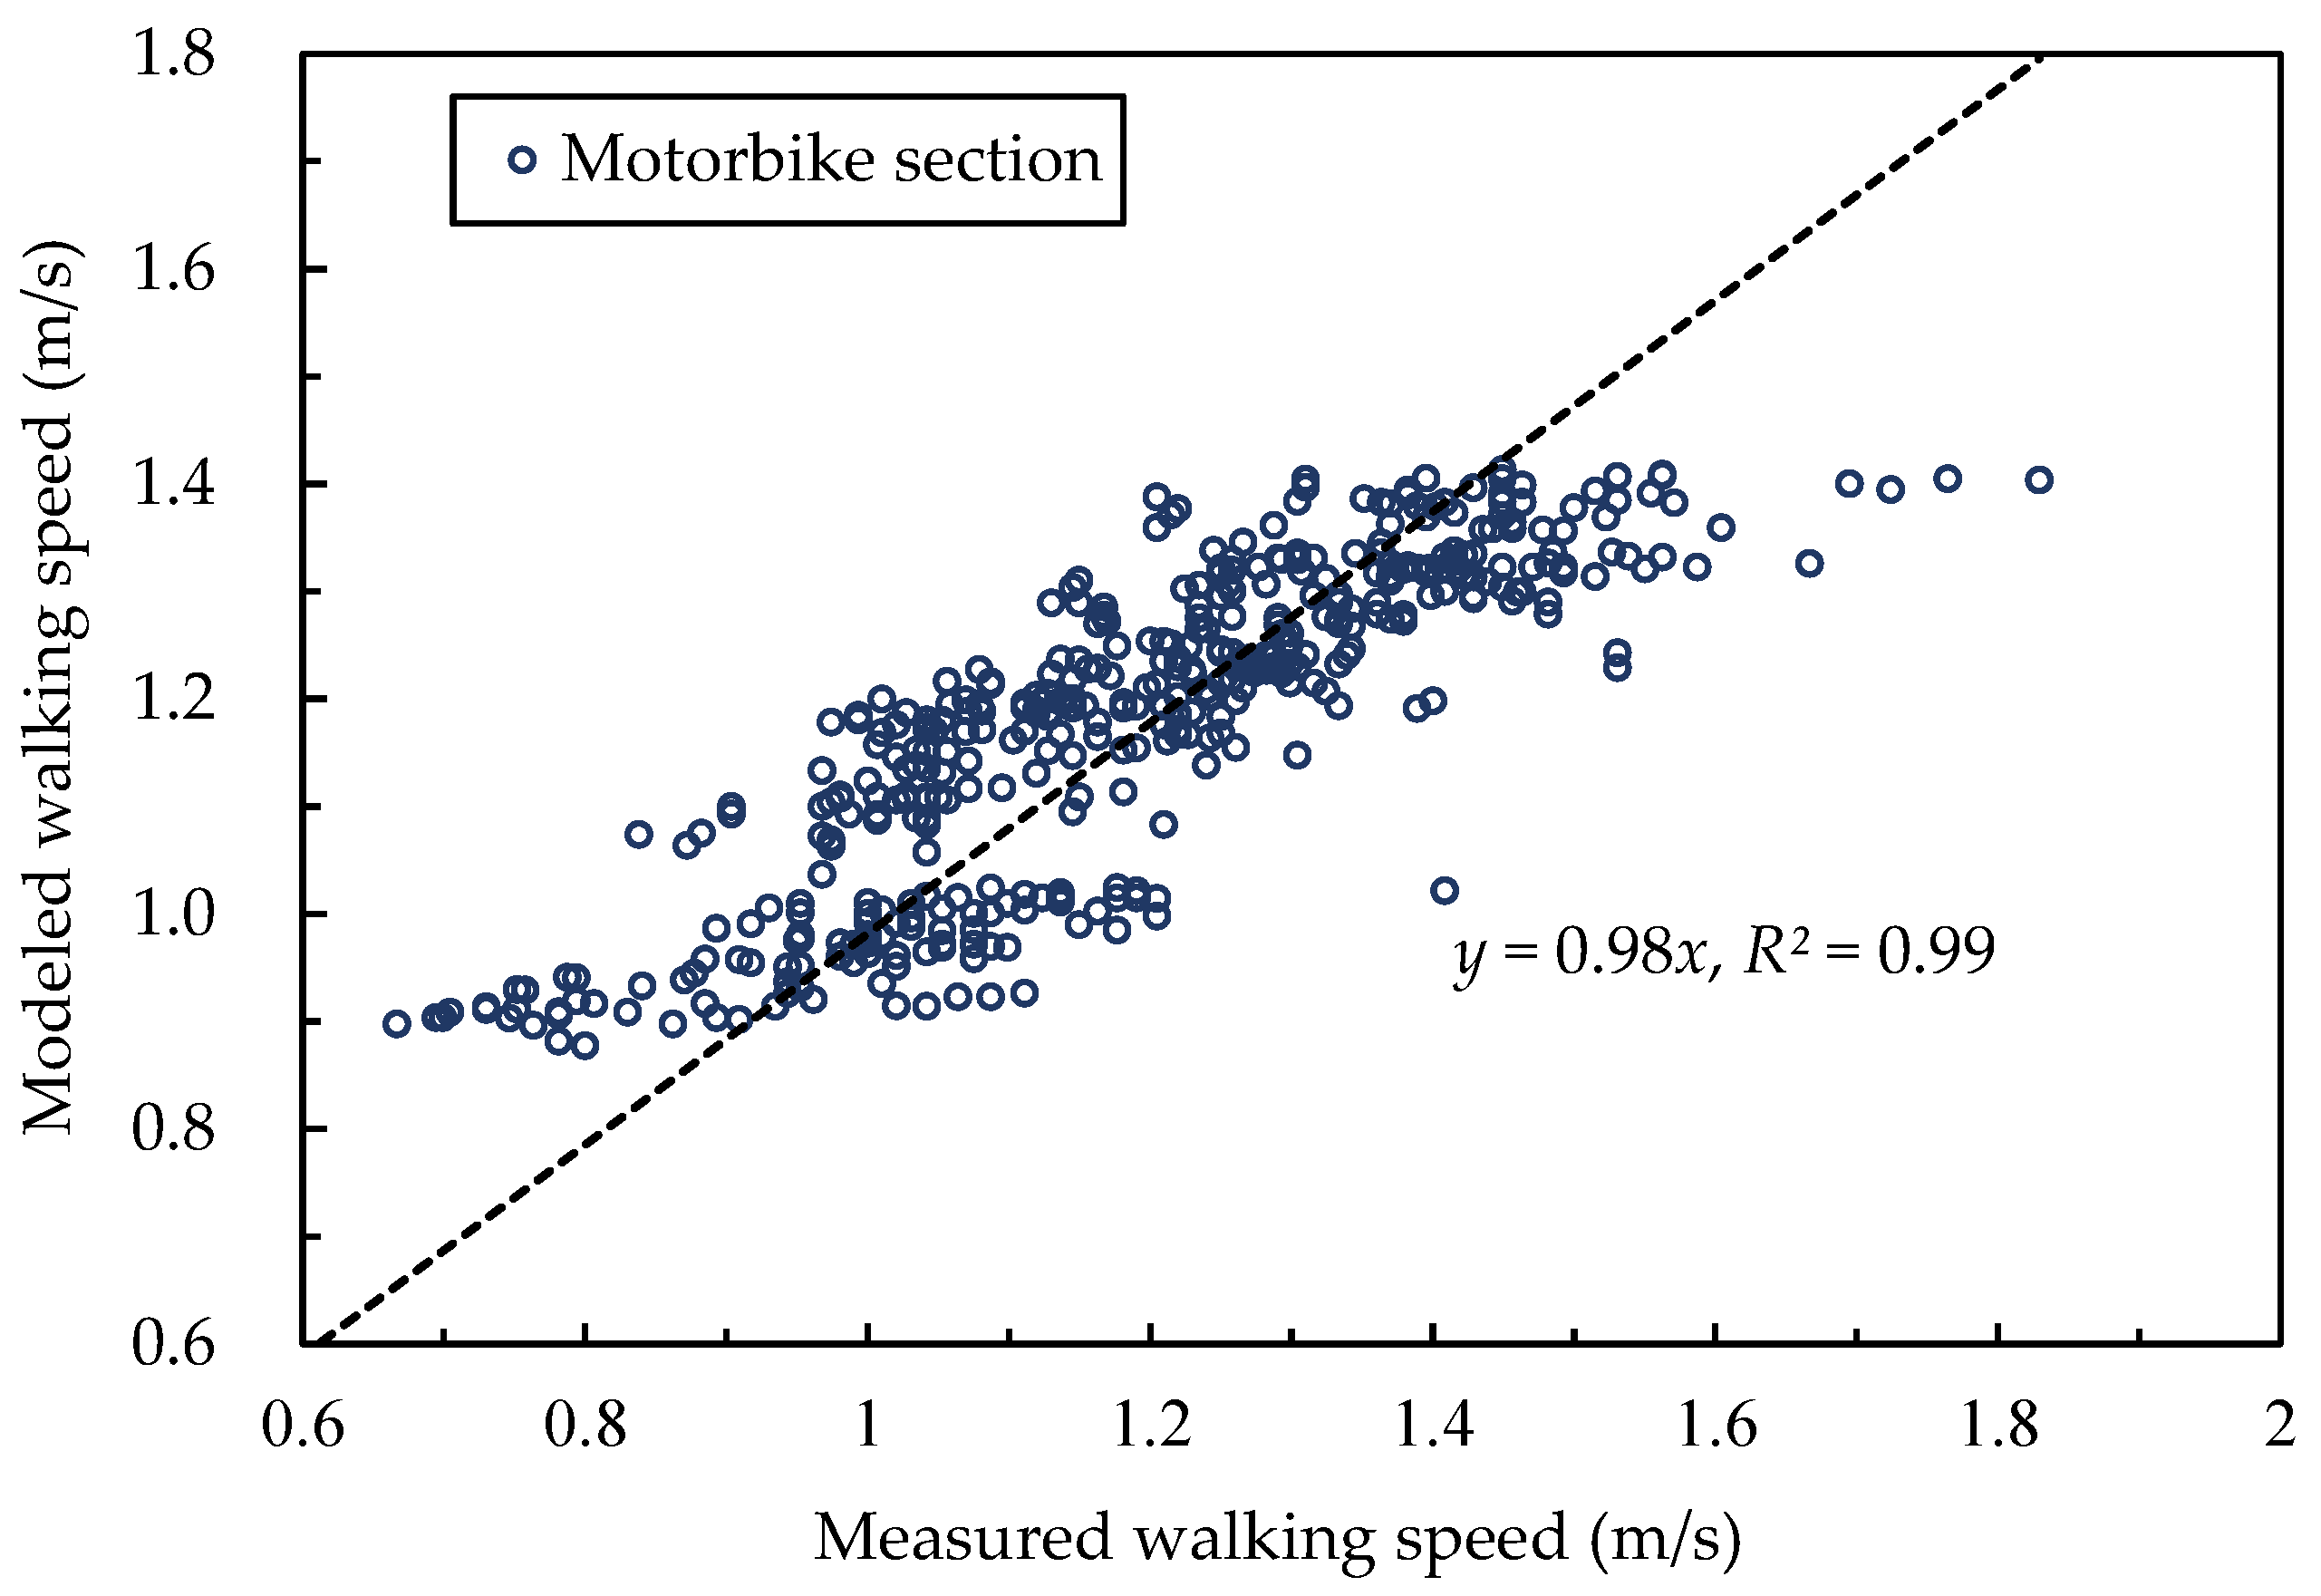
4.1. Walking Speed in the Motorbike Section and Modeling
4.2. Motorbike Lane Evacuation Models and Limitations
5. Conclusions
Author Contributions
Funding
Institutional Review Board Statement
Informed Consent Statement
Data Availability Statement
Acknowledgments
Conflicts of Interest
Nomenclature
| f(ρe) | Function describing the influence of evacuee density on walking speed |
| g(ρb) | Function describing the influence of motorbike density on walking speed |
| ρe | Evacuee density ) (unit: persons/m2) |
| ρb | Motorbike density = N/(wL) (unit: motorbikes/m2) |
| N | Motorbike numbers (unit: motorbikes) |
| w | Motorbike lane width (unit: m) |
| Individual time interval in a specific section of the lane (unit: s) | |
| ΔT | The starting interval time (1, 2, or 3 s) |
| The timepoint when the n-th subject passes checkpoint k (unit: s) | |
| T | The measured time in a specific section of the lane (unit: s) |
| L | The measured section length in the motorbike lane (unit: m) |
| V | Walking speed = L/T (unit: m/s) |
| V0 | Walking speed not affected by the evacuee density and motorbike density |
References
- Duffé, P.; Marec, M. Task Force for Technical Investigation of the 24 March 1999 Fire in the Mont Blanc Vehicular Tunnel; Minister of the Interior-Ministry of Equipment, Transportation and Housing: France, 1999. [Google Scholar]
- Pucher, K.; Pucher, R. Fire in the Tauern tunnel. In Proceedings of the International Tunnel Fire and Safety Conference, The Netherlands; 1999; pp. 2–3. [Google Scholar]
- Beard, A.; Carvel, R.; Carvel, R.; Marlair, G. 1. A history of fire incidents in tunnels. In The Handbook of Tunnel Fire Safety; Thomas Telford Publishing: London, UK, 2005; pp. 1–41. [Google Scholar] [CrossRef]
- Leitner, A. The fire catastrophe in the Tauern Tunnel: Experience and conclusions for the Austrian guidelines. Tunn. Undergr. Space Technol. 2001, 16, 217–223. [Google Scholar] [CrossRef]
- Turner, S.S. Gotthard tunnel fire. New Civ. Eng. 2001, 1, 5–7. [Google Scholar]
- Hsu, W.S.; Huang, Y.H.; Shen, T.S.; Cheng, C.Y.; Chen, T.Y. Analysis of the Hsuehshan Tunnel Fire in Taiwan. Tunn. Undergr. Space Technol. 2017, 69, 108–115. [Google Scholar] [CrossRef]
- Seike, M.; Kawabata, N.; Hasegawa, M. Study about assessment of fire safety in a road tunnel by evacuee’s behavior based on smoke behavior by 3-D CFD analysis. In Proceedings of the Advanced Research Workshop: Evacuation and Human Behavior in Emergency Situations, Santander, Spain, October 2011; pp. 111–124. [Google Scholar]
- Seike, M.; Kawabata, N.; Hasegawa, M. Quantitative assessment method for road tunnel fire safety: Development of an evacuation simulation method using CFD-derived smoke behavior. Saf. Sci. 2017, 94, 116–127. [Google Scholar] [CrossRef]
- Seike, M.; Kawabata, N.; Hasegawa, M. Experiments of evacuation speed in smoke-filled tunnel. Tunn. Undergr. Space Technol. 2016, 53, 61–67. [Google Scholar] [CrossRef]
- Frantzich, H.; Nilsson, D. Utrymning Genom Tät Rök: Beteende Och Förflyttning; Lund University: Lund, Sweden, 2003. [Google Scholar]
- Frantzich, H.; Nilsson, D. Evacuation experiments in a smoke filled tunnel. In Proceedings of the 3rd International Symposium on Human Behaviour in Fire, Belfast, UK, 1–3 September 2004; pp. 229–238. [Google Scholar]
- Fridolf, K.; Ronchi, E.; Nilsson, D.; Frantzich, H. Movement speed and exit choice in smoke-filled rail tunnels. Fire Saf. J. 2013, 59, 8–21. [Google Scholar] [CrossRef]
- Fridolf, K.; Andrée, K.; Nilsson, D.; Frantzich, H. The impact of smoke on walking speed. Fire Mater. 2014, 38, 744–759. [Google Scholar] [CrossRef]
- Fridolf, K.; Ronchi, E.; Nilsson, D.; Frantzich, H. The relationship between obstructed and unobstructed walking speed: Results from an evacuation experiment in a smoke filled tunnel. Int. Symp. Hum. Behav. Fire 2015, 2015, 537–548. [Google Scholar]
- Seike, M.; Kawabata, N.; Hasegawa, M. Evacuation speed in full-scale darkened tunnel filled with smoke. Fire Saf. J. 2017, 91, 901–907. [Google Scholar] [CrossRef]
- Seike, M.; Kawabata, N.; Hasegawa, M. Walking speed in completely darkened full-scale tunnel experiments. Tunn. Undergr. Space Technol. 2020, 106, 103621. [Google Scholar] [CrossRef]
- Seike, M.; Lu, Y.-C.; Kawabata, N.; Hasegawa, M. Emergency evacuation speed distributions in smoke-filled tunnels. Tunn. Undergr. Space Technol. 2021, 112, 103934. [Google Scholar] [CrossRef]
- Seike, M.; Kawabata, N.; Hasegawa, M.; Tsuji, C.; Higashida, H.; Yuhi, T. Experimental attempt on walking behavior and stress assessment in a completely darkened tunnel. Infrastructures 2021, 6, 75. [Google Scholar] [CrossRef]
- Nilsson, D.; Johansson, M.; Frantzich, H. Evacuation experiment in a road tunnel: A study of human behaviour and technical installations. Fire Saf. J. 2009, 44, 458–468. [Google Scholar] [CrossRef]
- Ronchi, E.; Fridolf, K.; Frantzich, H.; Nilsson, D.; Walter, A.L.; Modig, H. A tunnel evacuation experiment on movement speed and exit choice in smoke. Fire Saf. J. 2018, 97, 126–136. [Google Scholar] [CrossRef]
- Ronchi, E.; Nilsson, D.; Gwynne, S.M.V. Modelling the impact of emergency exit signs in tunnels. Fire Technol. 2012, 48, 961–988. [Google Scholar] [CrossRef]
- Ronchi, E.; Nilsson, D.; Kojić, S.; Eriksson, J.; Lovreglio, R.; Modig, H.; Walter, A.L. A virtual reality experiment on flashing lights at emergency exit portals for road tunnel evacuation. Fire Technol. 2016, 52, 623–647. [Google Scholar] [CrossRef]
- Ministry of Transportation and Communications (MOTC). Ministry of Transportation and Communications (MOTC)-Traffic Statistics Monthly; Ministry of Transportation and Communications (MOTC): Taipei, Taiwan, 2021. Available online: https://www.motc.gov.tw/ch/home.jsp?id=578&parentpath=0%2C6&mcustomize=statistics301.jsp (accessed on 25 December 2021).
- Hsu, T.-P.; Sadullah, E.A.F.M.; Dao, I.N.X. A Comparison Study on Motorcycle Traffic Development in Some Asian Countries—Case of Taiwan, Malaysia and Vietnam; The Eastern Asia Society for Transportation Studies (EASTS): Tokyo, Japan, 2003. [Google Scholar]
- DiNenno, P.J. SFPE Handbook of Fire Protection Engineering, 3rd ed.; National Fire Protection Association: Quincy, MA, USA, 2002. [Google Scholar]
- Pauls, J. Calculating Evacuation Times for Tall Buildings. Fire Saf. J. 1987, 12, 213–236. [Google Scholar] [CrossRef]
- Rastogi, R.; Ilango, T.; Chandra, S. Pedestrian Flow Characteristics for Different Pedestrian Facilities and Situations. In European Transport\Trasporti Europei; ISTIEE, Institute for the Study of Transport within the European Economic Integration: Trieste, Italy, 2013; pp. 1–5. [Google Scholar]
- Oeding, D. Traffic loads and dimensions of walkways and other pedestrian circulation facilities. Strassenbau Strassenverk. 1963, 22, 160–163. [Google Scholar]
- Das, P.; Parida, M.; Katiyar, V.K. Analysis of interrelationship between pedestrian flow parameters using artificial neural network. J. Med. Biol. Eng. 2015, 35, 298–309. [Google Scholar] [CrossRef] [Green Version]
- Virkler, M.R.; Elayadath, S. Pedestrian speed-flow-density relationships. Transp. Res. Rec. 1994, 1438, 51–58. [Google Scholar]
- Seyfried, A.; Steffen, B.; Klingsch, W.; Boltes, M. The fundamental diagram of pedestrian movement revisited. J. Stat. Mech. Theory Exp. 2005, 10, P10002. [Google Scholar] [CrossRef]
- Zhang, J.; Seyfried, A. Empirical characteristics of different types of pedestrian streams. Procedia Eng. 2013, 62, 655–662. [Google Scholar] [CrossRef] [Green Version]
- Mōri, M.; Tsukaguchi, H. A new method for evaluation of level of service in pedestrian facilities. Transp. Res. Part A Gen. 1987, 21, 223–234. [Google Scholar] [CrossRef]
- Helbing, D.; Johansson, A.; Al-Abideen, H.Z. Dynamics of crowd disasters: An empirical study. Phys. Rev. E 2007, 75, 046109. [Google Scholar] [CrossRef] [Green Version]
- Greenshields, B.D. A study in highway capacity. In Highway Research Board Proceedings; National Research Council (USA), Highway Research Board: Washington, DC, USA, 1935; pp. 448–477. [Google Scholar]
- Greenberg, H. An analysis of traffic flow. Oper. Res. 1959, 7, 79–85. [Google Scholar] [CrossRef]
- Greenshields, B.D.; George, H.P.; Guerin, N.S.; Palmer, M.R.; Underwood, R.T. Quality and Theory of Traffic Flow—A Symposium; Bureau Highway Traffic, Yale University: New Haven, CT, USA, 1961. [Google Scholar]
- Kladek, H. Über die Geschwindigkeitscharakteristik auf Stadtstra_Enabschnitten. Ph.D. Thesis, Hochschule für Verkehrswesen, Friedrich List Dresden, Dresden, Germany, 1966. [Google Scholar]
- Drake, J.; Schofer, J.; May, A. A Statistical Analysis of Speed-Density Hypotheses; Highway Research Board: Washington, DC, USA, 1965. [Google Scholar]
- Bruno, L.; Venuti, F. The pedestrian speed-density relation: Modelling and application. In Proceedings of the Footbridge, Porto, Portugal, 2–4 July 2008. [Google Scholar]
- Thompson, P.; Nilsson, D.; Boyce, K.; Molloy, M.; McGrath, D. Exploring the biomechanics of walking and crowd “flow”. Fire Mater. 2020, 44, 879–893. [Google Scholar] [CrossRef]
- Yamashita, N. Study on Evacuees’ Behavior during Tunnel Fire by Evacuation Experiment. Master’s Thesis, Graduate School of Natural Sciences, Kanazawa University, Kanazawa, Japan, 2018. [Google Scholar]
- Buchmueller, S.; Weidmann, U. Parameters of Pedestrians, Pedestrian Traffic and Walking Facilities; IVT-Report Nr. 132; Institut for Transport Planning and Systems (IVT): Zurich, Switzerland; Swiss Federal Institute of Technology Zurich (ETHZ): Zurich, Switzerland, 2006; p. 20. [Google Scholar]
- Japan Association for Fire Science and Technology (Ed.) Fire Handbook, 3rd ed.; Kyoritsu Publishing Co., Ltd.: Tokyo, Japan, 1997. [Google Scholar]
- Murosaki, Y. Architectural Disaster Prevention and Safety (Modern Architecture); Kajima Institute Publishing: Tokyo, Japan, 1993. [Google Scholar]
- Seike, M.; Kawabata, N.; Hasegawa, M. Assessment method for road tunnel fire safety by evacuation simulation in smoke’s behavior from CFD analysis. J. Jpn. Soc. Civ. Eng. Ser. F2 (Undergr. Space Res.) 2014, 70, 1–12. [Google Scholar] [CrossRef] [Green Version]
- Architectural Institute of Japan (Ed.) Collection of Architectural Design Materials [Human]; Maruzen Publishing: Tokyo, Japan, 2003. [Google Scholar]
- Mori, M.; Tsukaguchi, H. Pedestrian movements on footways. Proc. Jpn. Soc. Civ. Eng. 1977, 1977, 99–108. [Google Scholar] [CrossRef]
- Daamen, W.; Hoogendoorn, S.P. Free speed distributions—Based on empirical data in different traffic conditions. In Pedestrian and Evacuation Dynamics; Waldau, N., Gattermann, P., Knoflacher, H., Schreckenberg, M., Eds.; Springer: Berlin/Heidelberg, Germany, 2005; pp. 13–25. [Google Scholar]
- Weidmann, U. Transporttechnik der Fussgänger Transporttechnische Eigenschaften des Fussgängerverkehrs, Literaturauswertung; IVT-Report Nr. 90; Institut for Transport Planning and Systems (IVT): Zurich, Switzerland; Swiss Federal Institute of Technology Zurich (ETHZ): Zurich, Switzerland, 1993. [Google Scholar] [CrossRef]


| Tunnel Name | Cross-Section | Tunnel Length | Country | Independent Lane for Motorbikes | Motorbike Height (from the Ground) | Motorbike Traffic Flow | Four-Wheeled Vehicle Traffic Flow |
|---|---|---|---|---|---|---|---|
| Qiao-Zhong Road Tunnel |  | 295 m | China | Yes | 0 | – | – |
| Saigon River Tunnel |  | 1490 m | Vietnam | Yes | 0 | – | – |
| Zi-Qiang Tunnel | 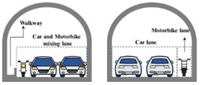 | 820 m | Taiwan | Yes | 0 | 602/h 1 | 187/h 1 |
| Da-Hu Tunnel | 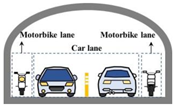 | 519 m | Taiwan | Yes | 0 | – | - |
| Kang-Le Tunnel |  | 586 m | Taiwan | Yes | 0 | - | - |
| Xin-Hai Tunnel | 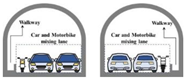 | 490 m | Taiwan | No | 0 | 1515/h 1 | 139/h 1 |
| Cross-Harbor Tunnel | 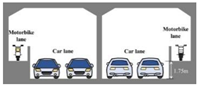 | 1670 m | Taiwan | Yes | 1.75 m | 1160/h | 1270/h |
| Item | Oeding (1963) [28] | Mōri and Tsukaguchi (1987) [33] | Virkler and Elayadath (1994) [30] | Seyfried et al. (2005) [31] | Helbing et al. (2007) [34] | Zhang and Seyfried (2013) [32] | Das et al. (2015) [29] | Rastogi et al. (2013) [27] | Present Study |
|---|---|---|---|---|---|---|---|---|---|
| Scenario | Uncontrolled walking (commuters) | Uncontrolled walking (commuters) | Uncontrolled walking (after watching a football game) | Controlled normal walking | The scene of the Muslim pilgrimage | Controlled normal walking | Uncontrolled walking | Uncontrolled walking | Evacuation assumption (assumed commuters) |
| The direction of the human flow | Bidirectional | Bidirectional | Unidirectional | Unidirectional | Unidirectional | Both unidirectional and bidirectional | Bidirectional | Bidirectional | Unidirectional |
| Density range (persons/m2) | 0.16–2.61 | 0.11–6.07 | 0.16–3.14 | 0.75–4.29 | 1.16–9.90 | 0.06–3.93 | 0.01–1.58 | 0.02–2.32 | 0.05–0.56 |
| Methodology | Observational | Observational | Observational | Experimental | Observational | Experimental | Observational | Observational | Experimental |
| The geometry of walking space | Shopping streets, footpaths along company buildings, etc. | Side walkway and underground walkway (length: 20 m; width: 2.2–4.5 m) | A walkway (length: 12 m; width: 8.5, 10, 12, and 13 m in four 3 m sections) | A circular passageway (selecting 2 m of the straight part of the passageway; width: 0.8 m) | A large area (length: 27.7 m; width: 22.5 m) | Straight corridor (width: 1.8, 2.4, and 3.0 m), closed ring, T-junctions, and around a corner | Sidewalks and carriageways around transport terminals (observation section: length: 10 m; width: 2.7 m) | Sidewalk (width: 1.6–4.0 m) | Modeled motorbike lane (length: 50 m; width: 2.6 m) |
| Number of participants | – | – | – | Six cases (subject Nos. 1, 15, 20, 25, 30, and 34) | – | Up to 400 people | 418 (sidewalk) | 674 | 40 |
| Age | – | – | – | – | – | 19.3–30.7 | – | – | 25–61 |
| Assumed Motorbike Lane (Underground Walkway) | Real Motorbike Lane (in Cross-Harbor Tunnel) | |
|---|---|---|
| Geometric | Length 50 m; width 2.6 m | Length 1042 m; width 2.6 m |
| Inclination | 0% | −4.5%, 0%, 4.5% |
| Evacuation scenario |
|
|
| Evacuation direction | Instructed to be in only one direction. | Without instruction, evacuation in both directions is possible. |
| Evacuee density | Controlled by experiment setup. | Variable (depending on situation). |
| Motorbike density | Controlled by experiment setup. | Variable (depending on situation). |
| Cumulative Time (s) | Cumulative Number of Motorbikes | Distance of Accumulated Motorbikes (m) |
|---|---|---|
| 30 | 5 | 10 |
| 60 | 6 | 11 |
| 90 | 7 | 13 |
| 120 | 10 | 18 |
| 150 | 18 | 24 |
| 180 | 21 | 26 |
| 210 | 24 | 30 |
| 240 | 30 | 36 |
| 270 | 35 | 42 |
| 300 | 36 | 42 |
| Time (a.m.) | 7:00–7:10 | 7:10–7:20 | 7:20–7:30 | 7:30–7:40 | 7:40–7:50 | 7:50–8:00 | Total |
|---|---|---|---|---|---|---|---|
| Number of motorbikes | 157 | 214 | 208 | 205 | 211 | 165 | 1160 |
| Number of passengers | 177 | 232 | 219 | 214 | 222 | 174 | 1238 |
| Motorbike flow rate (motorbikes/s) | 0.26 | 0.36 | 0.35 | 0.34 | 0.35 | 0.28 | 0.32 |
| Passenger flow rate (persons/s) | 0.30 | 0.39 | 0.37 | 0.36 | 0.37 | 0.29 | 0.35 |
| Model Name | Function | Definition of Terms |
|---|---|---|
| Greenshields model (1935) [35] | Vf: Free flow speed Vm: Optimal speed k: Observed density kj: Jam density ko: Optimal density (density with maximum flow or capacity) km: Maximum density when speed is zero | |
| Greenberg model (1959) [36] | ||
| Underwood model (1961) [37] | ||
| Kladek model (1966) [38] | ||
| Drake model (1967) [39] |
| Rounds | Instruction of Starting Interval Time (s) | No-Motorbike Section (m) | Motorbike Section (10 Motorbike Setting Length (m)) |
|---|---|---|---|
| 1 | 1 | 10 (front), 30 (rear) | 10 |
| 2 | 15 (front), 20 (rear) | 15 | |
| 3 | 10 (front), 20 (rear) | 20 | |
| 4 | 15 (front), 5 (rear) | 30 | |
| 5 | 2 | 10 (front), 30 (rear) | 10 |
| 6 | 15 (front), 20 (rear) | 15 | |
| 7 | 10 (front), 20 (rear) | 20 | |
| 8 | 15 (front), 5 (rear) | 30 | |
| 9 | 3 | 10 (front), 30 (rear) | 10 |
| 10 | 15 (front), 20 (rear) | 15 | |
| 11 | 10 (front), 20 (rear) | 20 | |
| 12 | 15 (front), 5 (rear) | 30 |
Publisher’s Note: MDPI stays neutral with regard to jurisdictional claims in published maps and institutional affiliations. |
© 2022 by the authors. Licensee MDPI, Basel, Switzerland. This article is an open access article distributed under the terms and conditions of the Creative Commons Attribution (CC BY) license (https://creativecommons.org/licenses/by/4.0/).
Share and Cite
Cheng, C.-C.; Chung, H.-C.; Kawabata, N.; Seike, M.; Hasegawa, M.; Chien, S.-W.; Shen, T.-S. Walking Speed in a Motorbike Lane Considering the Density of Evacuees and Motorbikes. Appl. Sci. 2022, 12, 12580. https://doi.org/10.3390/app122412580
Cheng C-C, Chung H-C, Kawabata N, Seike M, Hasegawa M, Chien S-W, Shen T-S. Walking Speed in a Motorbike Lane Considering the Density of Evacuees and Motorbikes. Applied Sciences. 2022; 12(24):12580. https://doi.org/10.3390/app122412580
Chicago/Turabian StyleCheng, Cheng-Chung, Hung-Chieh Chung, Nobuyoshi Kawabata, Miho Seike, Masato Hasegawa, Shen-Wen Chien, and Tzu-Sheng Shen. 2022. "Walking Speed in a Motorbike Lane Considering the Density of Evacuees and Motorbikes" Applied Sciences 12, no. 24: 12580. https://doi.org/10.3390/app122412580
APA StyleCheng, C.-C., Chung, H.-C., Kawabata, N., Seike, M., Hasegawa, M., Chien, S.-W., & Shen, T.-S. (2022). Walking Speed in a Motorbike Lane Considering the Density of Evacuees and Motorbikes. Applied Sciences, 12(24), 12580. https://doi.org/10.3390/app122412580