Communication

AS-OCT and Ocular Hygrometer as Innovative Tools in Dry Eye Disease Diagnosis

1
Ophthalmology Operative Complex Unit, University Campus Bio-Medico, 00128 Rome, Italy
2
Ophthalmology Unit, ASST Valle Olona, 21052 Busto Arsizio, Italy
3
Breast Unit, University Campus Bio-Medico, 00128 Rome, Italy
4
Microbiology Unit, ASST Valle Olona, 21052 Busto Arsizio, Italy
5
Department of Ophthalmology, VN Desai Municipal Hospital, Mumbai 400055, India
6
Unit of Measurements and Biomedical Instrumentation, Departmental Faculty of Engineering, University Campus Bio-Medico, 00128 Rome, Italy
*
Author to whom correspondence should be addressed.
These authors contributed equally to this work.
Appl. Sci. 2022, 12(3), 1647; https://doi.org/10.3390/app12031647
Submission received: 17 November 2021 / Revised: 21 January 2022 / Accepted: 2 February 2022 / Published: 4 February 2022
(This article belongs to the Special Issue Medical Imaging: Advanced Techniques and Applications)

Abstract

:
Dry eye disease (DED) is one of the conditions that most commonly leads patients to visit an ophthalmologist. Fast and accurate diagnosis relieves patient discomfort and spares them from long-term effects on the ocular surface. Many tests used in the diagnosis of DED may be considered subjective as they rely on an experienced observer for image interpretation, resulting in variations in diagnosis. On one hand, the non-contact nature of the anterior segment optical coherence tomography (AS-OCT) device and its rapid image acquisition enable the measurement of the tear meniscus parameter without reflex tearing. On the other hand, an ocular hygrometer allows a rapid, safe, but also efficient, analysis and is associated with low costs and the repeatability of the procedure.

1. Introduction

Dry eye disease (DED) is one of the most common ophthalmic conditions, affecting millions of people worldwide with a prevalence of between 5% and 50%, based on the diagnostic procedures used and study populations [1,2,3,4,5]. Although symptoms arising from DED have been reported as the most common reason to visit an ophthalmologist, it is considered one of the most underdiagnosed and undertreated syndromes in ophthalmology [2,6].
The definition of a dry eye, according to the Tear Film and Ocular Surface Society Dry Eye Workshop II (TFOS DEWS II), is: “a multifactorial disease of the ocular surface characterized by a loss of homeostasis of the tear film, and accompanied by ocular symptoms, in which tear film instability and hyperosmolarity, ocular surface inflammation and damage, and neurosensory abnormalities play etiologic roles” [1]. DED is classified into two subtypes defined by the underlying mechanism of the disease: aqueous deficiency DED, with inadequate tear production from the lacrimal gland, and evaporative DED, where the function of the meibomian glands is typically compromised [1,7,8]. Dry eye disease is induced by many factors, including age, gender, levels of certain hormones, autoimmune disorders, local environmental conditions, contact lens wear and exposure to some medications [2,9,10,11].
Based on the TFOS DEWS II, there are several factors that lead to the loss of tear film homeostasis with the development of abnormalities affecting the ocular surface [7]. The pathophysiology of DED comes from evaporation-induced tear hyperosmolarity, which leads to the inflammatory damage of the ocular surface and associated ocular symptoms [7,12,13]. The symptoms of DED include eye irritation, photophobia, ocular discomfort and fluctuating vision disturbance [14]; however, chronic ocular pain is the most commonly reported symptom among DED patients [15]. The condition can be painful and may result in lasting damage to the cornea and long-term damage to the corneal nerves through the irritation and inflammation of the ocular surface [8,13]. DED symptoms can significantly impact patients’ work productivity and quality of life and have various effects on different everyday activities, including a delayed reaction time while driving and a decline in sustained reading performance. DED has also been associated with depression and anxiety, especially when the patient is affected by Sjögren syndrome [2,16].
Despite recent technological advances and research targeting DED that have led to new approaches to DED diagnosis, the clinical results collected from all available diagnostic tests often do not correlate with the severity of clinical symptoms reported by the patient. As a result, there is currently no single clinical test that can be considered definitive in the diagnosis of DED [17,18]. Therefore, several tests are typically used in sequence, combining the results obtained with information collected from questionnaires regarding patient symptoms. These tests demand significant resources and are time-consuming. Tests for determining the physical parameters of tears include the tear break-up time (TBUT), the Schirmer’s test, tear osmolarity and tear meniscus height [19]. Other tests used for the diagnosis of DED include ocular surface staining, corneal sensibility, interblink frequency, corneal surface topography, interferometry, aberrometry and imaging techniques, such as meibography, anterior segment optical coherence tomography (AS-OCT) and in vivo confocal microscopy (IVCM).

2. Current Methods of Diagnosis

After the collection of a complete history and details of the symptoms, the visit should start with an in-depth examination with a slit lamp, both with and without eye staining, in order to detect signs of DED. The first important marker of DED that can be measured by slit lamp biomicroscopy is the presence of a low tear film meniscus height. The inspection should continue with the assessment of DED-associated conjunctival hyperaemia, which usually involves the fine horizontal vessels of the exposed bulbar conjunctiva [20]. Furthermore, DED-associated redness can be objectively assessed by investigator grading scales and computer-automated redness grading scales, developed for both diagnostic and follow-up aims [20]. Subsequently, it is crucial to investigate the presence of meibomian gland dysfunction (MGD) by carefully examining the eyelid rim, eyelashes and glandular duct orifices for telangiectasias, collarettes and chalazia [21]. Nevertheless, the operator dependent variability and low repeatability of the various MGD grading scales limit the classification of MGD [17,21]. Lid-parallel conjunctival folds (LIPCOFs) is a promising DED diagnostic sign, although it needs to be evaluated with more objective methods, such as optical coherence tomography (OCT), for its classification [22,23].
Fluorescein sodium staining can be used during slit lamp examinations to highlight defects in the corneal epithelium. The corneal surface is stained wherever there is a break in the epithelial cell-to-cell junctions. Resultant staining may show corneal superficial punctate epithelial erosions in patterns consistent with some of the causes of dry eye disease. For example, erosions identified in the lower third of the cornea could be due to eyelid-related exposure problems, such as infrequent or incomplete blinking or lagophthalmos. However, since corneal epithelial erosions can be related to other causes, fluorescein sodium staining is unable to provide direct evidence of DED, nor can it be considered a truly specific or sensitive test [24,25]. Rose bengal staining is an important tool in evaluating dry eye disease as it occurs in corneal or conjunctival areas that are devoid of membrane-associated mucins, but its clinical use is limited by its toxic effects on the corneal epithelium and by its poor sensitivity and specificity [26]. Moreover, rose bengal staining can occur in asymptomatic patients and there is no clearly defined relationship between ocular surface damage that is specific to dry eye disease and the patient’s symptoms [27]. Lissamine green dye has a similar staining pattern to rose bengal but, unlike the latter, the former is better tolerated as it does not determine epithelial corneal toxicity [28,29].
There are many grading systems for assessing ocular surface staining, including the Oxford Scheme, the van Bijsterveld system and the National Eye Institute/Industry Workshop guidelines [30,31]. However, there is no common consensus among researchers and there are no published scientific papers showing that one grading system is superior to the others.
For measuring tear production, the Schirmer test is still one of the most commonly used procedures. The Schirmer test type I is performed without instilling anesthetic drops and it measures total tear secretion, including both reflex and basal tears. One edge of the Schirmer strip is placed inside the lower conjunctival sac and, after 5 min, the length of wetting on the strip is recorded in millimeters. The result of the test is considered normal when the value obtained is greater than 10 mm [32]. However, a false negative result was found in patients who performed the Schirmer test type I with their eyes closed because the stimulation of the lid margin and eyelashes can increase the tear turnover rate. The Schirmer test type II, which uses topical anesthesia, only measures basal tear production by applying the same strips. The Schirmer test is more reproducible in advanced cases of DED. Although the Schirmer test is one of the most widely used tools in diagnosing DED, the protracted nature of the test, the irritating and invasive sensations experienced by the patients and its unreliable and largely irreproducible features may lead to a high risk of underdiagnosis [17,33].
TBUT is one of the most common tests for measuring tear film stability. TBUT is evaluated during a slit lamp examination with blue light and after fluorescein staining. TBUT measures the amount of time it takes for the first break in the tear film to appear after a blink while the patient refrains from blinking. The test result is suggestive of dry eye disease when it is less than 10 s [34]. Once the instability of the tear film has been confirmed, the physician has the task of further investigating the causes and looking for the presence of superficial irregularities or diseases of the eyelid margin. Although this test is cheap, quick to perform and uses readily available supplies, it is inaccurate, operator dependent and not reproducible [17,21,35,36].
The tear film osmolarity reflects the balance between tear production, evaporation, drainage and absorption [37]. The measurement of these variables can identify the cause of DED due to the associated derangement in the normal physiological parameters [38]. For a more accurate diagnosis, it is necessary to evaluate the average tear film osmolarity as a single osmolarity reading could be normal even in patients with DED [38]. Moreover, the variability of tear film osmolarity has been shown to correlate directly with DED severity [39]. An osmolarity value greater than 308 mOsm/L is generally indicative of dry eye disease [39]. However, this technological investigation methodology is costly and time-consuming and, at the same time, is unable to accurately differentiate between dry eye disease patients and controls.
Another way to assess dryness is by analyzing tear protein patterns. Quantitatively, dry eye disease patients typically have a lower protein content than healthy controls [40]. Qualitatively, however, tear samples from dry eye disease patients contain fewer protective proteins and more proinflammatory markers, such as matrix metalloproteinase 9, interleukin-1Ra and interleukin-8 [41]. In addition, elevated cytokine levels of interleukin-17, interleukin-6 and tumor necrosis factor-alpha have been found in patients with both dry eye disease and Sjögren syndrome compared to patients with dry eye disease without Sjögren syndrome and controls [42]. Furthermore, dry eye disease biomarkers can also be analyzed on conjunctival cell samples, which are obtained quickly and painlessly by impression cytology. However, further studies are needed to elucidate its sensitivity and specificity in the differential diagnosis of various diseases involving the ocular surface. The study of biomarkers may lead to developments in drugs that can help to treat dry eye disease. However, although promising, its use is limited in current clinical practice due to high costs and the absence of insurance reimbursement.
Non-contact infrared meibography, based on transillumination with infrared photography, provides the two-dimensional shape of the meibomian glands (MGs) [43]. Healthy meibum is showed as a bright area due to its autofluorescence while dark areas in the MGs indicate an altered meibum condition, which is determined as MG dropout [43,44]. In order to evaluate MG dropout, the MGF Workshop recommend the Gestalt grading scale and the meiboscale among the various grading scales proposed [43]. Continuous grading scales have also recently been developed using semiautomated software, which in an automatic way of estimating the ratio of the MG loss area to the total eyelid area [45]. Both the severity of MGD and the percentage of MG dropout showed a positive correlation with the TBUT, dry eye disease symptom score and corneal stain score [44,45]. MG dropout measured using infrared meibography has proven to be useful for differential diagnosis between MGD and aqueous deficiency DED [46]. However, infrared meibography cannot provide three-dimensional images of the deeper structures, thereby reducing its reliability [47]. Therefore, the MG dropout assessed by this technology should be carefully interpreted and additional information that is acquired with other imaging techniques may be required in order to properly diagnosis and manage MGD [47].
Tear interferometry is a non-invasive diagnostic method that, through the visualization of the light reflection at the lipid–aqueous interface of the tear film, allows for the investigation of the tear lipid layer [47,48]. Interferometry enables the objective assessment of tear film features, such as lipid layer thickness, tear meniscus height (TMH), break-up characteristics, changes in tear film thickness and wetting patterns with sequential blinking [49]. It has been shown that the grading of the lipid layer interference pattern has a significant correlation with the corneal staining score and TBUT, while the interferometric TMH has correlation with the Schirmer’s score [48]. In addition, a difference in the interferometric patterns among aqueous-deficient DED, MGD and healthy patients has been described, suggesting that interferometry can be helpful for the differential diagnosis of subtypes of DED.

3. Anterior Segment Optical Coherence Tomography

AS-OCT produces cross-sectional images of the anterior structures of the eye by low-coherence interferometry [50]. It allows for the precise measurement of certain parameters of the tear meniscus, such as the tear meniscus area (TMA) and the tear meniscus height (TMH), without the interference reflex tearing thanks to the rapidity of the image acquisition and its non-contact nature [51]. TMH acquired by time domain OCT (TD-OCT) has been shown to correlate well with the Schirmer test, corneal staining scores and strip meniscometry [52]. Subsequently, the introduction of spectral domain OCT (SD-OCT) allowed for the improvement of the sensitivity and specificity of the diagnostic biomarkers of DED, TMH and TMA, compared to those achieved with TD-OCT [53]. One study reported that the diagnostic accuracy of SD-OCT was the highest for Sjögren syndrome and acceptable for non-Sjögren aqueous-deficient DED, but the lowest efficiency was found for the diagnosis of evaporative DED [54,55]. Finally, the advent of swept source OCT (SS-OCT) has made it possible to measure the tear meniscus volume (TMV) in addition to the TMH and TMA, thanks to its ability to acquire three-dimensional images as well as the greater imaging depth and enhanced scanning speed [56]. Moreover, these parameters, TMH, TMV and TMA, measured with SS-OCT showed a correlation with the Schirmer test, TBUT and the corneal staining score [57]. AS-OCT can capture the tear lake in a single moment in time, but as there may be changes in TMV throughout the day, the acquired value of a single measurement has questionable significance [58]. Therefore, it may be necessary to perform serial OCT measurements to establish an average tear film thickness and tear lake volume. In cases of evaporative DED, AS-OCT can aid in the diagnosis of MGD due to the introduction of a 3D imaging method for the MGs [59,60]. However, OCT is expensive, time-consuming and often not reimbursed by insurance. In addition, further studies in larger populations need to be performed to assess the specificity and the sensitivity of this technology in the diagnosis of DED.

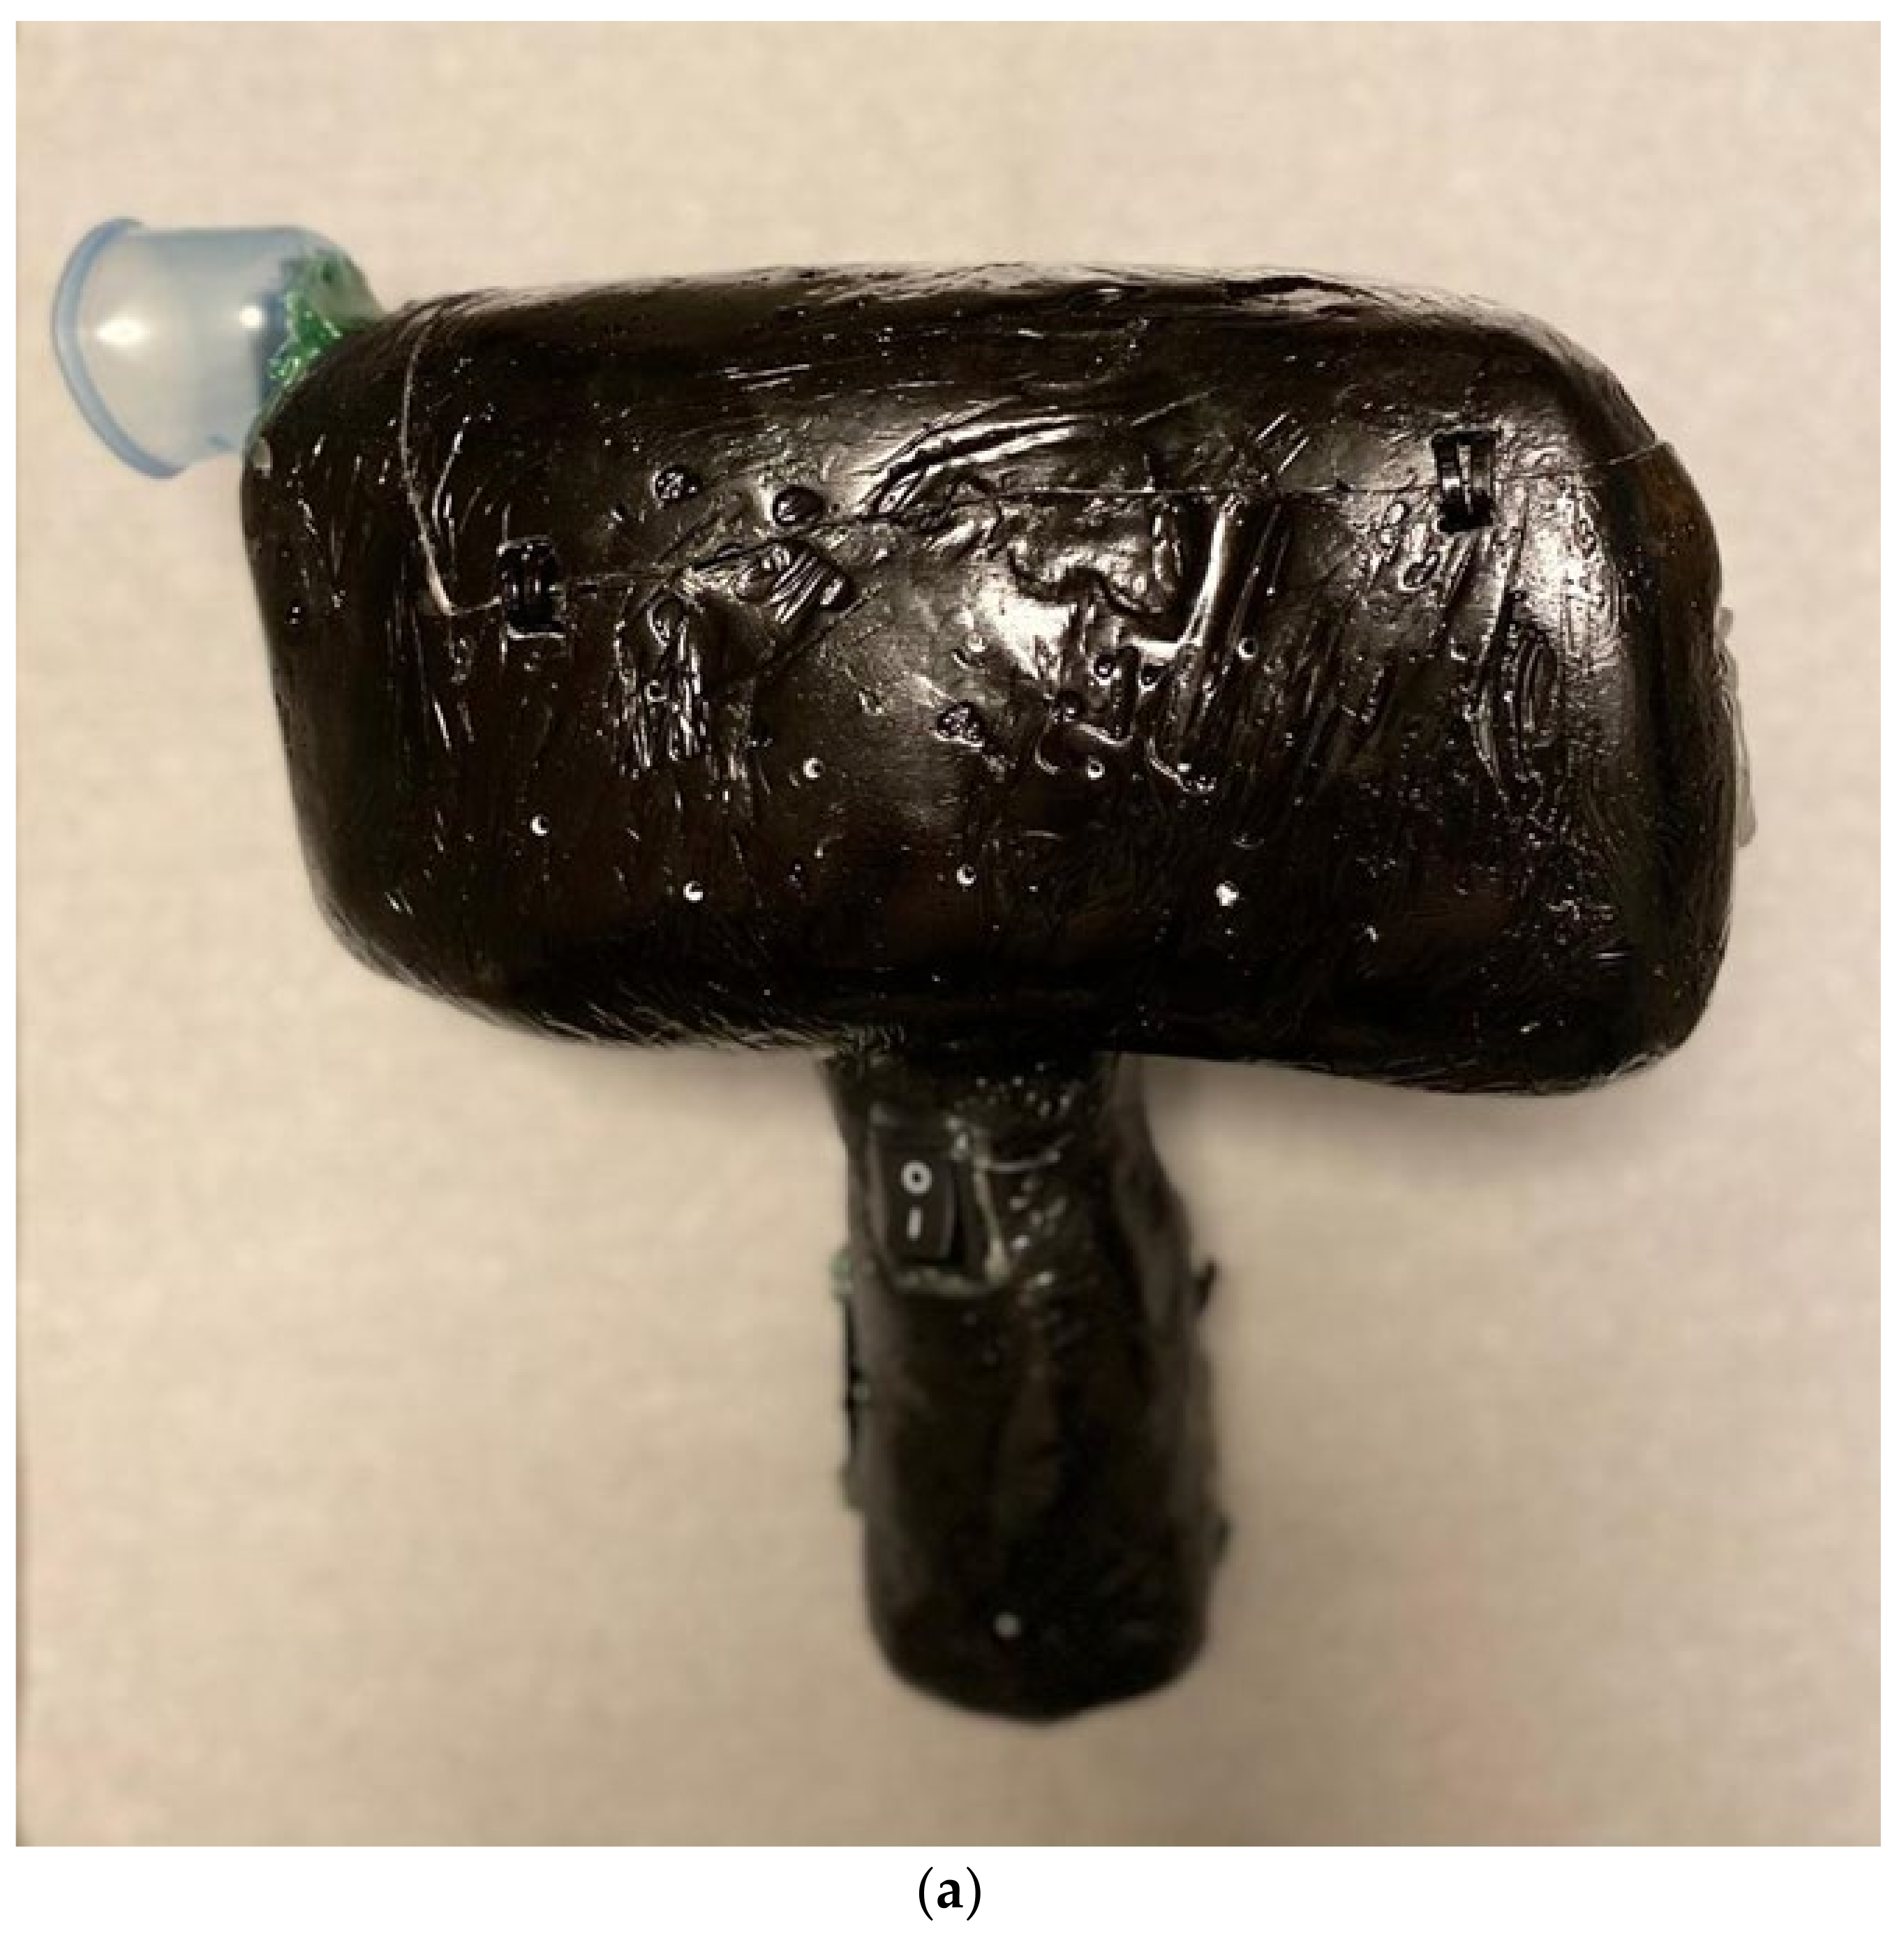
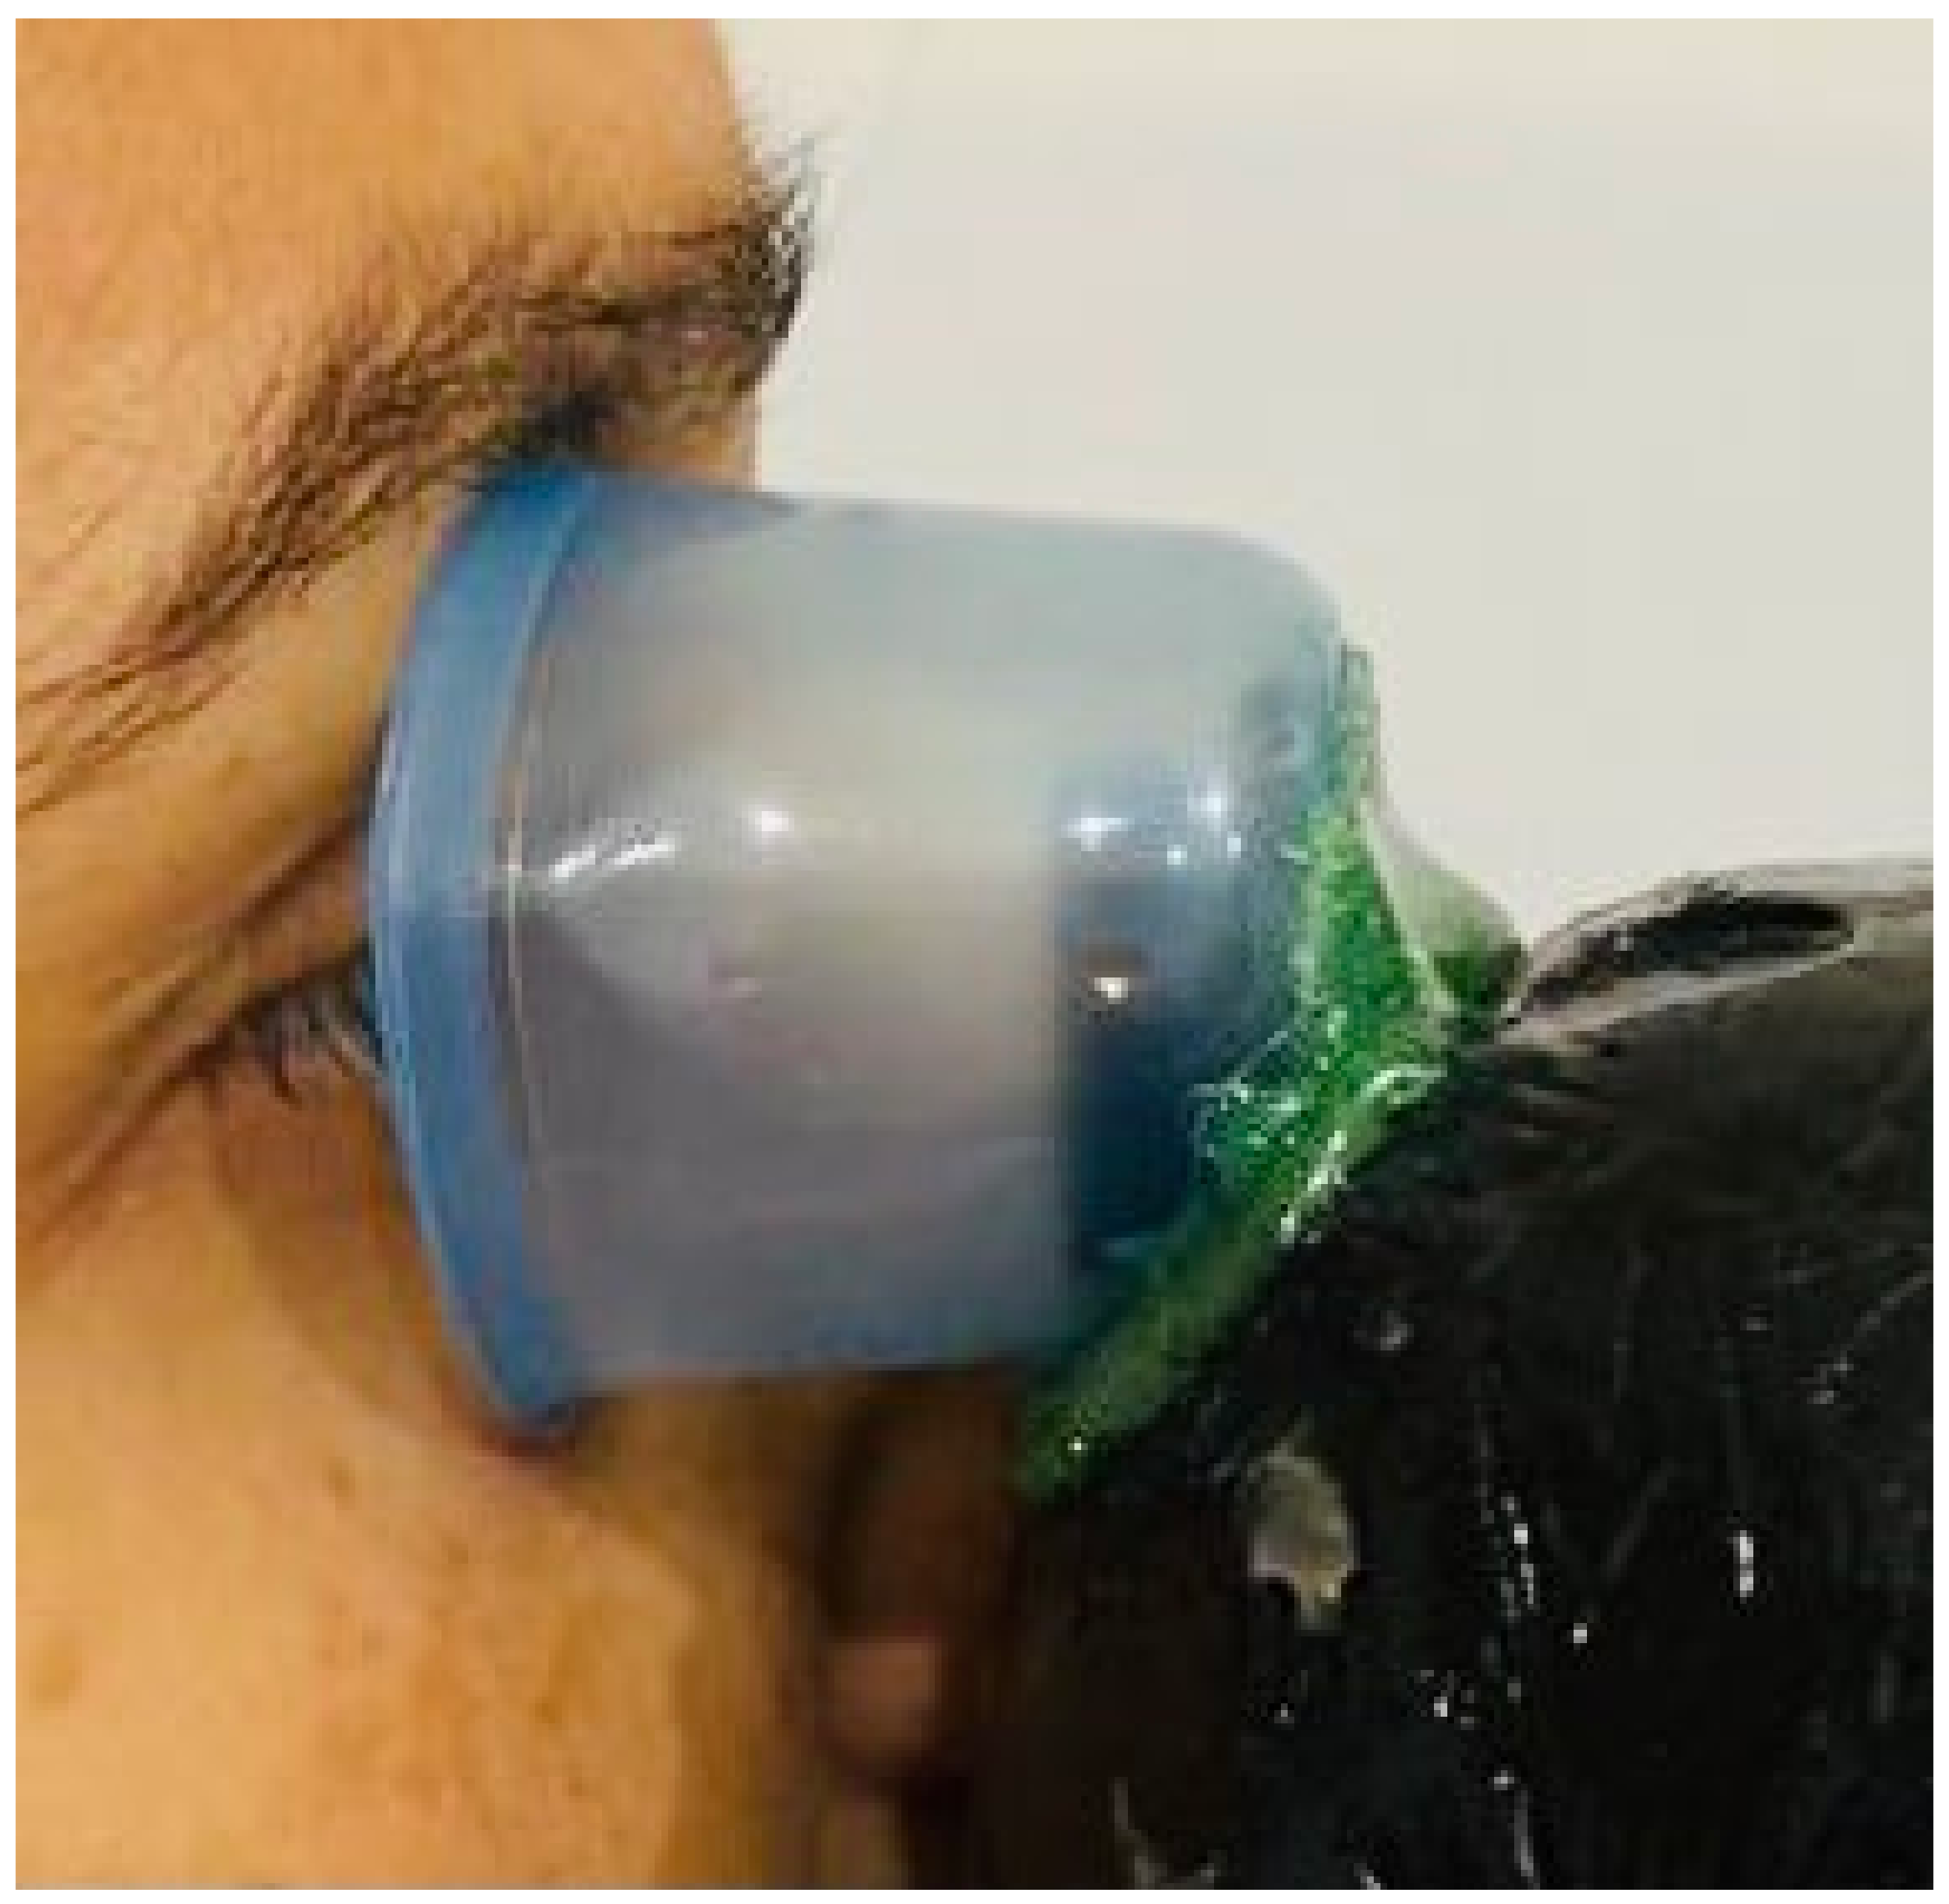
4. Innovative Device
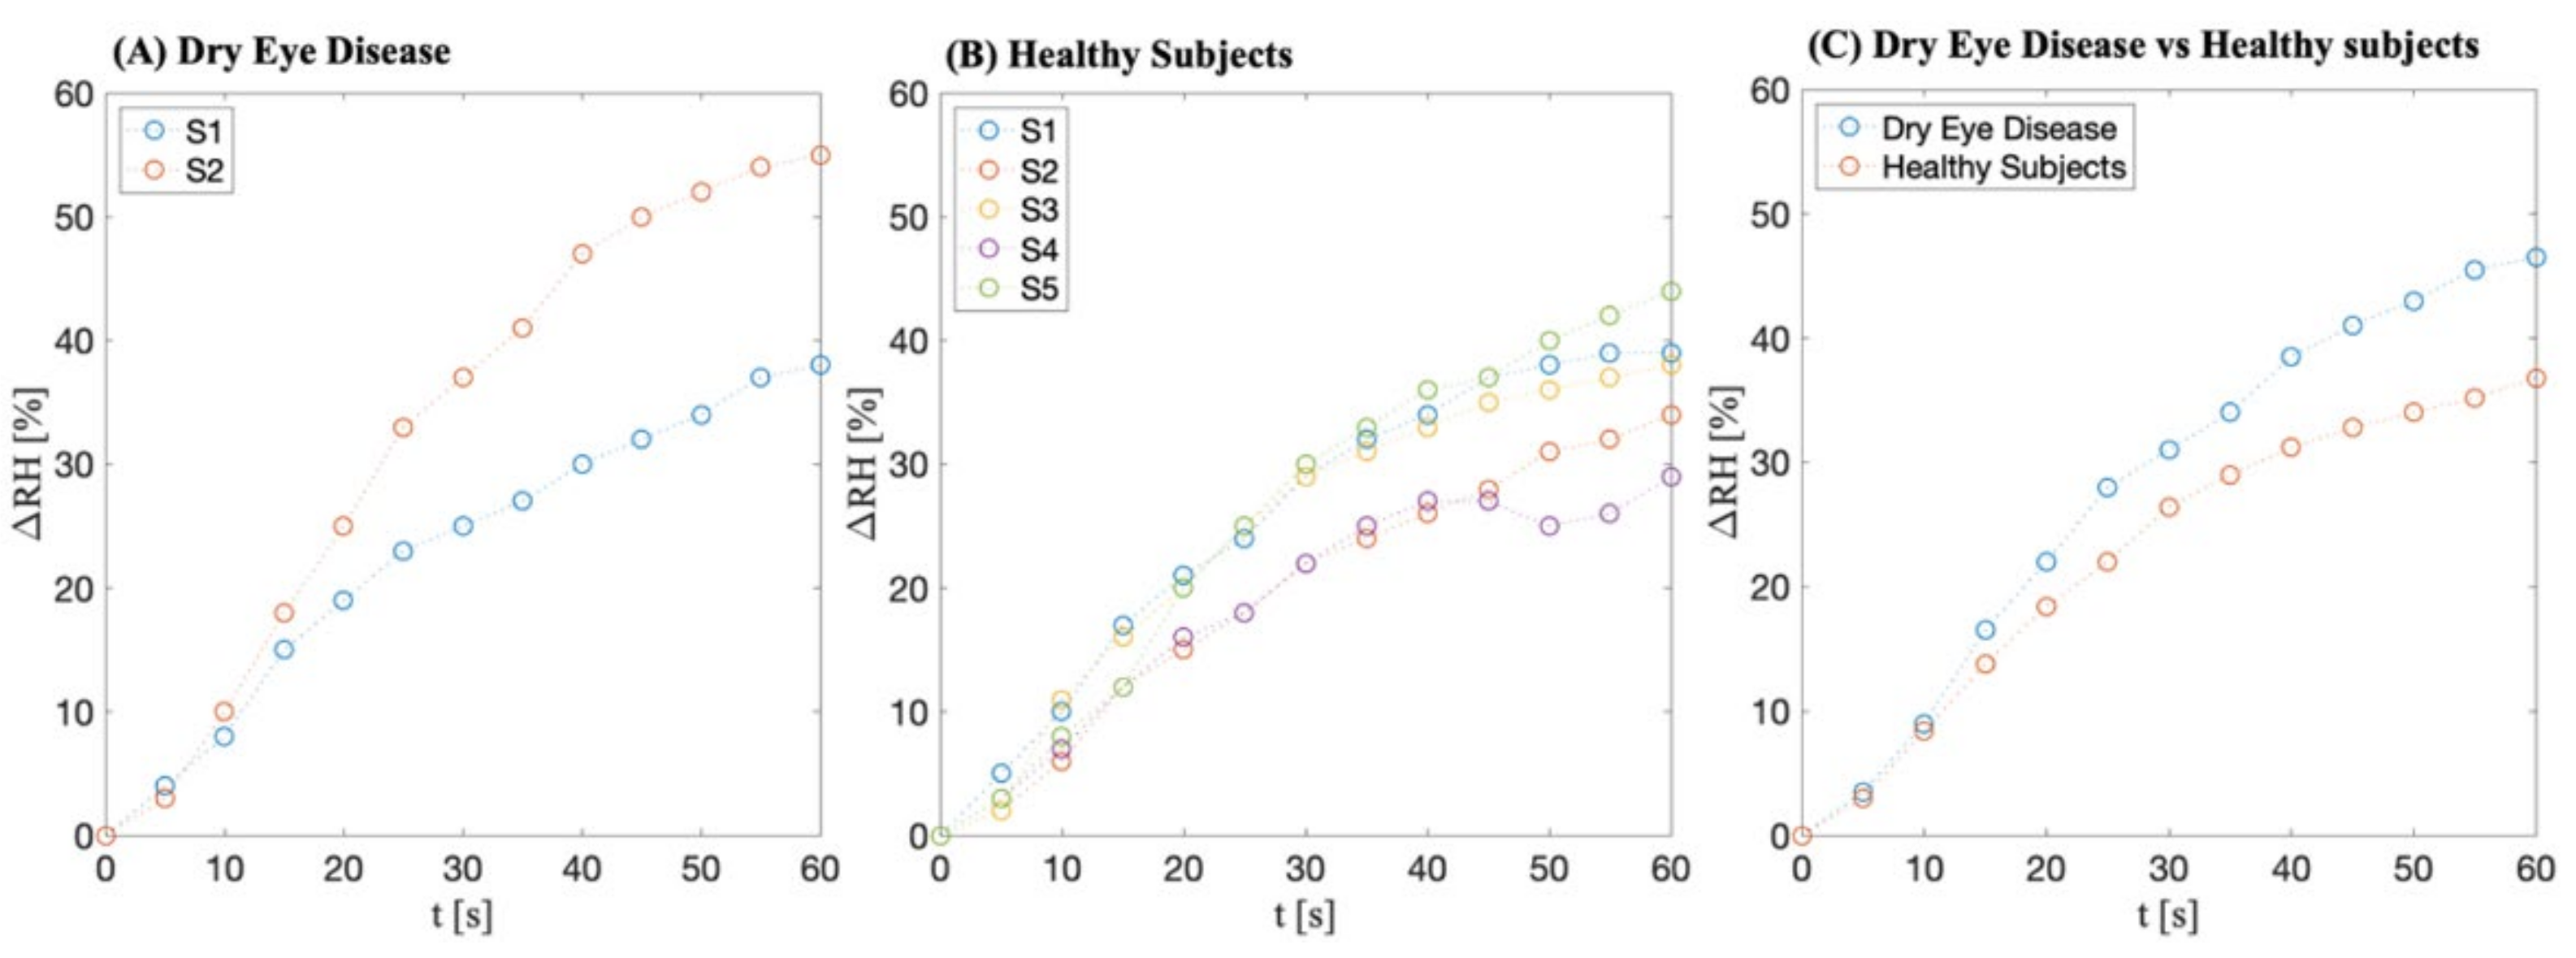
Nowadays, clinicians are still missing a single, non-invasive and fast test to easily diagnose DED in its alternative forms. Several innovative devices have been developed to reach this unmet need in the DED field. In particular, several studies have focused on the development of ocular hygrometers, such as DEvice© (AI, Rome, Italy), which allow the assessment of the DED diagnosis as well as its alternative subtype, evaporative or hypo-secretive, by a single measurement. DEvice© is a low-cost prototype (Figure 1a,b) able to rapidly detect the entity of production, the clearance and the stability, as well as the severity of the evaporation of the tear film, and then drives the subsequent treatment by the use of easy algorithms. This diagnostic tool is also effective in the local nebulization of drugs, leading to an alternative future therapeutic use of the instrument.
The two units are directly connected in a complete diagnostic–therapeutic tool for the management of the ocular surface but are also designed and built to be used independently. When focusing on the balance between the liquid and gaseous state of the tear film, quantifying the latter by the level of humidity and its variations in a closed environment would provide specific indices for each form of imbalance and, therefore, for each form of dry eye disease. Then, the diagnostic part of the device acts by evaluating the evaporation of the tear film from the ocular surface by means of measurements made at a variable rate, which can be adjusted by the operator. The instrument is based on the measurement of the relative humidity (RH) variation in a closed microenvironment around the ocular surface (Figure 2). RH can be expressed as RH = ρω/ρs × 100%, where ρω is the water vapor density and ρs is the saturated water vapor density. Therefore, the advantage of using a sensor that can distinguish the RH differences between those affected by the various forms of dry eye disease/ocular surface pathologies and the normal population through its measurements is evident. The sensor measures the RH value at a given temperature and is placed inside a cup that is to be placed in front of the ocular surface, which is placed by the operator on the orbital margins. This cup and the overall ocular surface system constitute the closed environment in which the measurements are performed. From the data obtained, the progression curves of RH, corrected for temperature, can be constructed. Furthermore, the instrument allows the defining of the time t0 and time t1 at which to evaluate the RH value and to measure the time necessary to reach a given RH value. This constitutes a new frontier in the diagnostic analysis of dry eye disease and in the future, other functions and indices may be defined according to its particularly high versatility and its non-contact/invasive measurement. The non-contact system eliminates the bias generated by the direct interaction with the ocular surface of our actual tests. The measurements obtained constitute “basal” values that are integrated with measurements taken as a result of various types of stimuli, such as puffs of air, temperature changes in the microenvironment around the ocular surface, light stimuli, etc. Furthermore, in designing this diagnostic unit, the importance of the patient’s subjective value of discomfort was taken into account. Therefore, Device© allows the quantifying of the RH value at which the discomfort linked to the pathology of the ocular surface is significantly attenuated, disappears or increases at a given temperature through dedicated tests and structural elements. Finally, the device also allows a certain amount of tear evaporation to be collected through a non-contact sampling mechanism. Therefore, the analysis of the composition of the sample obtained by spectrometry or rapid tests can confer further specificity and the diagnostic sensitivity of the instrument.

Preliminary Data

In a small observational pilot study, we tested the device on volunteers to assess the variation in relative humidity (ΔRH) by evaluating the curvature shape, the rapidity of changes in relative humidity and the final relative humidity after 1 min. Subjects were randomly recruited and the procedure was performed in the same setting, consecutively, asking patients to avoid any blinking for the assessment period.
Eight volunteers were recruited and signed informed consent; two of them had a previous clinical diagnosis of dry eye disease and were grouped together, while the other healthy subjects were considered controls. Clinical changes were measured, notably a faster curve rise and higher relative humidity values were seen for the DED patients than for the healthy subjects (Figure 3).
However, these preliminary data should be confirmed by a further randomized controlled pilot clinical trial, which may also take into consideration the different types of dry eye disease and use stricter exclusion and inclusion criteria.

5. Discussion

The ocular surface system [13] is a complex morphofunctional unit made of different tissues, such as conjunctiva, cornea, lids and lacrimal glands, and also a complex network of nerves [61,62], hormones [11], immune cells [63] and metabolites [64] that interplay mainly in the tear film [12,65], which acts as the blood flow in the other tissues. Therefore, the status of the tear film is a reflection on the ocular surface system function. Tear film analysis may be considered as a local prognostic, diagnostic and therapeutic test to assess the healthy or diseased condition of the ocular surface system and is particularly studied in the most prevalent of ocular surface diseases, such as dry eye disease [66].
Different diagnostic tests are suitable for DED diagnosis; however, their sensitivity and specificity vary significantly according to patient-specific characteristics, disease severity and other factors [14,47]. Despite the large prevalence of DED among the population, there is no gold standard diagnostic approach to diagnose DED. Routine clinical exams poorly correlate with patient symptoms and are subject to observer bias [14,17]. Several assessments exist to evaluate the quality and quantity of ocular surface and tear dysfunctions; however, the set of assessments that are capable of diagnosing DED with acceptable specificity and sensitivity remains unknown [17,47]. AS-OCT is an innovative tool which allows for the specific evaluation and measurement of the quality and quantity of the tear film, but it is time-consuming, costly and requires a long learning curve since it is quite a complex procedure. The DEvice©, which quantifies the gaseous state of the tear film as the humidity variations in a closed environment, could provide specific indices for each form of imbalance and, therefore, for each form of dry eye disease. A similar technology is already used in the dermatological field for the measurement of transepidermal water loss [67]. In fact, various dermatological diseases in which the skin barrier is altered are associated with an increased loss of transepidermal water. The latter can be measured indirectly, by calculating the change in the density of water vapor at the skin surface over time compared to the atmospheric humidity, using an open-chamber device, an unventilated-chamber device or a condenser-chamber device. These devices are influenced differently by the surrounding environment [68,69]. The ocular hygrometer is an attempt to evaluate the quality and quantity of the tear film in a non-physiological context. It was developed as a sort of tear change in an artificial system. In fact, we could notice different relative humidity curves in DED patients versus the controls in our pilot study. The environmental airflow [70] would definitively affect the homeostatic equilibrium of a non-healthy tear film, but this would be subsequently related to a different relative humidity curve assessed in the device’s artificial chambers. Finally, blinking, incomplete blinking and tear clearance may affect the device’s measurements; therefore, further studies are required on a larger cohort of patients in order to confirm the innovative and promising early results and to improve the features of the DEvice©.
Ocular hygrometers, such as DEvice©, represent the future scope of ocular surface diagnostic research by mixing low costs with the efficiency, accuracy, rapidity and safety (no contact) of the measurement of tear films.

Author Contributions

Conceptualization, D.G., T.M., E.S. and A.D.Z.; methodology, E.S. and A.D.Z.; software, A.C. and E.S.; validation, all; formal analysis, all; investigation, all; resources, all; data curation, all; writing—original draft preparation, D.G., T.M., S.C., A.G. and C.F.; writing—review and editing, D.G., T.M., S.Y., R.S., E.S., M.C. and A.D.Z.; visualization, all; supervision, M.C. and A.D.Z.; project administration, E.S. and A.D.Z. All authors have read and agreed to the published version of the manuscript.

Funding

This research received no external funding.

Institutional Review Board Statement

Not applicable.

Informed Consent Statement

Not applicable.

Data Availability Statement

The data presented in this study are available on request from the corresponding author.

Conflicts of Interest

The authors declare no conflict of interest.

References

  1. Craig, J.P.; Nichols, K.K.; Akpek, E.K.; Caffery, B.; Dua, H.S.; Joo, C.K.; Liu, Z.; Nelson, J.D.; Nichols, J.J.; Tsubota, K.; et al. TFOS DEWS II Definition and Classification Report. Ocul. Surf. 2017, 15, 276–283. [Google Scholar] [CrossRef] [PubMed]
  2. Stapleton, F.; Alves, M.; Bunya, V.Y.; Jalbert, I.; Lekhanont, K.; Malet, F.; Na, K.-S.; Schaumberg, D.; Uchino, M.; Vehof, J.; et al. TFOS DEWS II Epidemiology Report. Ocul. Surf. 2017, 15, 334–365. [Google Scholar] [CrossRef]
  3. Dana, R.; Bradley, J.L.; Guerin, A.; Pivneva, I.; Stillman, I.Ö.; Evans, A.M.; Schaumberg, D.A. Estimated Prevalence and Incidence of Dry Eye Disease Based on Coding Analysis of a Large, All-age United States Health Care System. Am. J. Ophthalmol. 2019, 202, 47–54. [Google Scholar] [CrossRef] [PubMed] [Green Version]
  4. Paulsen, A.J.; Cruickshanks, K.J.; Fischer, M.E.; Huang, G.-H.; Klein, B.E.K.; Klein, R.; Dalton, D.S. Dry eye in the beaver dam offspring study: Prevalence, risk factors, and health-related quality of life. Am. J. Ophthalmol. 2014, 157, 799–806. [Google Scholar] [CrossRef] [PubMed] [Green Version]
  5. Farrand, K.F.; Fridman, M.; Stillman, I.Ö.; Schaumberg, D.A. Prevalence of Diagnosed Dry Eye Disease in the United States Among Adults Aged 18 Years and Older. Am. J. Ophthalmol. 2017, 182, 90–98. [Google Scholar] [CrossRef] [Green Version]
  6. Geerling, G.; Tauber, J.; Baudouin, C.; Goto, E.; Matsumoto, Y.; O’Brien, T.; Rolando, M.; Tsubota, K.; Nichols, K.K. The International Workshop on Meibomian Gland Dysfunction: Report of the Subcommittee on Management and Treatment of Meibomian Gland Dysfunction. Investig. Ophthalmol. Vis. Sci. 2011, 52, 2050–2064. [Google Scholar] [CrossRef] [Green Version]
  7. Bron, A.J.; de Paiva, C.S.; Chauhan, S.K.; Bonini, S.; Gabison, E.E.; Jain, S.; Knop, E.; Markoulli, M.; Ogawa, Y.; Perez, V.; et al. TFOS DEWS II pathophysiology report. Ocul. Surf. 2017, 15, 438–510. [Google Scholar] [CrossRef]
  8. Willcox, M.D.P.; Argüeso, P.; Georgiev, G.A.; Holopainen, J.M.; Laurie, G.W.; Millar, T.J.; Papas, E.B.; Rolland, J.P.; Schmidt, T.A.; Stahl, U.; et al. TFOS DEWS II Tear Film Report. Ocul. Surf. 2017, 15, 366–403. [Google Scholar] [CrossRef] [Green Version]
  9. Sullivan, D.A.; Rocha, E.M.; Aragona, P.; Clayton, J.A.; Ding, J.; Golebiowski, B.; Hampel, U.; McDermott, A.M.; Schaumberg, D.A.; Srinivasan, S.; et al. TFOS DEWS II Sex, Gender, and Hormones Report. Ocul. Surf. 2017, 15, 284–333. [Google Scholar] [CrossRef]
  10. Antonini, M.; Gaudenzi, D.; Spelta, S.; Sborgia, G.; Poddi, M.; Micera, A.; Sgrulletta, R.; Coassin, M.; Di Zazzo, A. Ocular Surface Failure in Urban Syndrome. J. Clin. Med. 2021, 10, 3048. [Google Scholar] [CrossRef]
  11. Grasso, A.; Di Zazzo, A.; Giannaccare, G.; Sung, J.; Inomata, T.; Shih, K.C.; Micera, A.; Gaudenzi, D.; Spelta, S.; Romeo, M.A.; et al. Sex Hormones Related Ocular Dryness in Breast Cancer Women. J. Clin. Med. 2021, 10, 2620. [Google Scholar] [CrossRef] [PubMed]
  12. Micera, A.; Di Zazzo, A.; Esposito, G.; Longo, R.; Foulsham, W.; Sacco, R.; Sgrulletta, R.; Bonini, S. Age-related changes to human tear composition. Investig. Ophthalmol. Vis. Sci. 2018, 59, 2024–2031. [Google Scholar] [CrossRef] [PubMed] [Green Version]
  13. Di Zazzo, A.; Micera, A.; Coassin, M.; Varacalli, G.; Foulsham, W.; De Piano, M.; Bonini, S. Inflammaging at ocular surface: Clinical and biomolecular analyses in healthy volunteers. Investig. Ophthalmol. Vis. Sci. 2019, 60, 1769–1775. [Google Scholar] [CrossRef] [PubMed] [Green Version]
  14. Wolffsohn, J.S.; Arita, R.; Chalmers, R.; Djalilian, A.; Dogru, M.; Dumbleton, K.; Gupta, P.K.; Karpecki, P.; Lazreg, S.; Pult, H.; et al. TFOS DEWS II Diagnostic Methodology report. Ocul. Surf. 2017, 15, 539–574. [Google Scholar] [CrossRef]
  15. Nichols, J.J.; Ziegler, C.; Mitchell, G.L.; Nichols, K.K. Self-reported dry eye disease across refractive modalities. Investig. Ophthalmol. Vis. Sci. 2005, 46, 1911–1914. [Google Scholar] [CrossRef] [Green Version]
  16. Karakus, S.; Mathews, P.M.; Agrawal, D.; Henrich, C.; Ramulu, P.Y.; Akpek, E.K. Impact of Dry Eye on Prolonged Reading. Optom. Vis. Sci. 2018, 95, 1105–1113. [Google Scholar] [CrossRef]
  17. Nichols, K.K.; Mitchell, G.L.; Zadnik, K. The repeatability of clinical measurements of dry eye. Cornea 2004, 23, 272–285. [Google Scholar] [CrossRef]
  18. Nichols, K.K.; Nichols, J.J.; Mitchell, G.L. The lack of association between signs and symptoms in patients with dry eye disease. Cornea 2004, 23, 762–770. [Google Scholar] [CrossRef]
  19. Sullivan, B.D.; Whitmer, D.; Nichols, K.K.; Tomlinson, A.; Foulks, G.N.; Geerling, G.; Pepose, J.S.; Kosheleff, V.; Porreco, A.; Lemp, M.A. An objective approach to dry eye disease severity. Investig. Ophthalmol. Vis. Sci. 2010, 51, 6125–6130. [Google Scholar] [CrossRef] [Green Version]
  20. Rodriguez, J.D.; Johnston, P.R.; Ousler, G.W.; Smith, L.M.; Abelson, M.B. Automated grading system for evaluation of ocular redness associated with dry eye. Clin. Ophthalmol. 2013, 7, 1197–1204. [Google Scholar] [CrossRef] [Green Version]
  21. Zeev, M.S.B.; Miller, D.D.; Latkany, R. Diagnosis of dry eye disease and emerging technologies. Clin. Ophthalmol. 2014, 8, 581–590. [Google Scholar] [CrossRef] [PubMed] [Green Version]
  22. Veres, A.; Tapasztó, B.; Kosina-Hagyó, K.; Somfai, G.M.; Németh, J. Imaging lid-parallel conjunctival folds with OCT and comparing its grading with the slit lamp classification in dry eye patients and normal subjects. Investig. Ophthalmol. Vis. Sci. 2011, 52, 2945–2951. [Google Scholar] [CrossRef] [PubMed] [Green Version]
  23. Németh, J.; Fodor, E.; Lang, Z.; Kosina-Hagyó, K.; Berta, A.; Komár, T.; Petricek, I.; Higazy, M.; Prost, M.; Grupcheva, C.; et al. Lid-parallel conjunctival folds (LIPCOF) and dry eye: A multicentre study. Br. J. Ophthalmol. 2012, 96, 1380–1385. [Google Scholar] [CrossRef] [Green Version]
  24. Yoon, K.C.; Im, S.K.; Kim, H.G.; You, I.C. Usefulness of double vital staining with 1% fluorescein and 1% lissamine green in patients with dry eye syndrome. Cornea 2011, 30, 972–976. [Google Scholar] [CrossRef]
  25. Savini, G.; Barboni, P.; Zanini, M. The incidence and risk factors for developing dry eye after myopic LASIK. Am. J. Ophthalmol. 2006, 142, 355–356. [Google Scholar] [CrossRef] [PubMed]
  26. Kim, J.; Foulks, G.N. Evaluation of the effect of lissamine green and rose bengal on human corneal epithelial cells. Cornea 1999, 18, 328–332. [Google Scholar] [CrossRef]
  27. Schein, O.D.; Tielsch, J.M.; Munoz, B.; Bandeen-Roche, K.; West, S. Relation between signs and symptoms of dry eye in the elderly. A population-based perspective. Ophthalmology 1997, 104, 1395–1401. [Google Scholar] [CrossRef]
  28. Machado, L.M.; Castro, R.S.; Fontes, B.M. Staining patterns in dry eye syndrome: Rose bengal versus lissamine green. Cornea 2009, 28, 732–734. [Google Scholar] [CrossRef]
  29. Hamrah, P.; Alipour, F.; Jiang, S.; Sohn, J.H.; Foulks, G.N. Optimizing evaluation of Lissamine Green parameters for ocular surface staining. Eye 2011, 25, 1429–1434. [Google Scholar] [CrossRef]
  30. Lemp, M.A. Report of the National Eye Institute/Industry workshop on Clinical Trials in Dry Eyes. CLAO J. 1995, 21, 221–232. [Google Scholar]
  31. Bron, A.J.; Evans, V.E.; Smith, J.A. Grading of corneal and conjunctival staining in the context of other dry eye tests. Cornea 2003, 22, 640–650. [Google Scholar] [CrossRef] [PubMed]
  32. Li, N.; Deng, X.G.; He, M.F. Comparison of the Schirmer I test with and without topical anesthesia for diagnosing dry eye. Int. J. Ophthalmol. 2012, 5, 478–481. [Google Scholar] [CrossRef] [PubMed]
  33. Kashkouli, M.B.; Pakdel, F.; Amani, A.; Asefi, M.; Aghai, G.H.; Falavarjani, K.G. A modified Schirmer test in dry eye and normal subjects: Open versus closed eye and 1-minute versus 5-minute tests. Cornea 2010, 29, 384–387. [Google Scholar] [CrossRef] [PubMed]
  34. Ozulken, K.; Aksoy Aydemir, G.; Tekin, K.; Mumcuoğlu, T. Correlation of Non-invasive Tear Break-Up Time with Tear Osmolarity and Other Invasive Tear Function Tests. Semin. Ophthalmol. 2020, 35, 78–85. [Google Scholar] [CrossRef]
  35. Effect of Tear Film Break-Up on Higher Order Aberrations of the Anterior Cornea in Normal, Dry, and Post-LASIK Eyes—PubMed. Available online: https://pubmed.ncbi.nlm.nih.gov/16209455 (accessed on 30 December 2021).
  36. Vanley, G.T.; Leopold, I.H.; Gregg, T.H. Interpretation of tear film breakup. Arch. Ophthalmol. 1977, 95, 445–448. [Google Scholar] [CrossRef] [PubMed]
  37. Szalai, E.; Berta, A.; Szekanecz, Z.; Szûcs, G.; Módis, L. Evaluation of tear osmolarity in non-Sjögren and Sjögren syndrome dry eye patients with the TearLab system. Cornea 2012, 31, 867–871. [Google Scholar] [CrossRef]
  38. Tomlinson, A.; McCann, L.C.; Pearce, E.I. Comparison of human tear film osmolarity measured by electrical impedance and freezing point depression techniques. Cornea 2010, 29, 1036–1041. [Google Scholar] [CrossRef]
  39. Tomlinson, A.; Khanal, S.; Ramaesh, K.; Diaper, C.; McFadyen, A. Tear film osmolarity: Determination of a referent for dry eye diagnosis. Investig. Ophthalmol. Vis. Sci. 2006, 47, 4309–4315. [Google Scholar] [CrossRef] [Green Version]
  40. Versura, P.; Bavelloni, A.; Grillini, M.; Fresina, M.; Campos, E.C. Diagnostic performance of a tear protein panel in early dry eye. Mol. Vis. 2013, 19, 1247. [Google Scholar]
  41. Ohashi, Y.; Ishida, R.; Kojima, T.; Goto, E.; Matsumoto, Y.; Watanabe, K.; Ishida, N.; Nakata, K.; Takeuchi, T.; Tsubota, K. Abnormal protein profiles in tears with dry eye syndrome. Am. J. Ophthalmol. 2003, 136, 291–299. [Google Scholar] [CrossRef]
  42. Lee, S.Y.; Han, S.J.; Nam, S.M.; Yoon, S.C.; Ahn, J.M.; Kim, T.I.; Kim, E.K.; Seo, K.Y. Analysis of tear cytokines and clinical correlations in Sjögren syndrome dry eye patients and non-Sjögren syndrome dry eye patients. Am. J. Ophthalmol. 2013, 156, 247–253. [Google Scholar] [CrossRef] [PubMed]
  43. Arita, R.; Itoh, K.; Inoue, K.; Amano, S. Noncontact infrared meibography to document age-related changes of the meibomian glands in a normal population. Ophthalmology 2008, 115, 911–915. [Google Scholar] [CrossRef] [PubMed]
  44. Nichols, J.J.; Berntsen, D.A.; Mitchell, G.L.; Nichols, K.K. An assessment of grading scales for meibography images. Cornea 2005, 24, 382–388. [Google Scholar] [CrossRef] [PubMed]
  45. Arita, R.; Morishige, N.; Shirakawa, R.; Sato, Y.; Amano, S. Effects of Eyelid Warming Devices on Tear Film Parameters in Normal Subjects and Patients with Meibomian Gland Dysfunction. Ocul. Surf. 2015, 13, 321–330. [Google Scholar] [CrossRef] [Green Version]
  46. Gulmez Sevim, D.; Gumus, K.; Unlu, M. Reliable, Noncontact Imaging Tool for the Evaluation of Meibomian Gland Function: Sirius Meibography. Eye Contact Lens 2020, 46 (Suppl. S2), S135–S140. [Google Scholar] [CrossRef]
  47. Chan, T.C.Y.; Wan, K.H.; Shih, K.C.; Jhanji, V. Advances in dry eye imaging: The present and beyond. Br. J. Ophthalmol. 2018, 102, 295–301. [Google Scholar] [CrossRef]
  48. Arita, R.; Morishige, N.; Fujii, T.; Fukuoka, S.; Chung, J.L.; Seo, K.Y.; Itoh, K. Tear Interferometric Patterns Reflect Clinical Tear Dynamics in Dry Eye Patients. Investig. Ophthalmol. Vis. Sci. 2016, 57, 3928–3934. [Google Scholar] [CrossRef] [Green Version]
  49. Finis, D.; Pischel, N.; Schrader, S.; Geerling, G. Evaluation of lipid layer thickness measurement of the tear film as a diagnostic tool for Meibomian gland dysfunction. Cornea 2013, 32, 1549–1553. [Google Scholar] [CrossRef]
  50. Huang, D.; Swanson, E.A.; Lin, C.P.; Schuman, J.S.; Stinson, W.G.; Chang, W.; Hee, M.R.; Flotte, T.; Gregory, K.; Puliafito, C.A.; et al. Optical Coherence Tomography. Science 1991, 254, 1178–1181. [Google Scholar] [CrossRef] [Green Version]
  51. Ramos, J.L.B.; Li, Y.; Huang, D. Clinical and research applications of anterior segment optical coherence tomography—A review. Clin. Experiment. Ophthalmol. 2009, 37, 81–89. [Google Scholar] [CrossRef] [Green Version]
  52. Ibrahim, O.M.A.; Dogru, M.; Takano, Y.; Satake, Y.; Wakamatsu, T.H.; Fukagawa, K.; Tsubota, K.; Fujishima, H. Application of visante optical coherence tomography tear meniscus height measurement in the diagnosis of dry eye disease. Ophthalmology 2010, 117, 1923–1929. [Google Scholar] [CrossRef] [PubMed]
  53. Chan, H.H.; Zhao, Y.; Tun, T.A.; Tong, L. Repeatability of tear meniscus evaluation using spectral-domain Cirrus® HD-OCT and time-domain Visante® OCT. Cont. Lens Anterior Eye 2015, 38, 368–372. [Google Scholar] [CrossRef] [PubMed]
  54. Qiu, X.; Gong, L.; Lu, Y.; Jin, H.; Robitaille, M. The diagnostic significance of Fourier-domain optical coherence tomography in Sjögren syndrome, aqueous tear deficiency and lipid tear deficiency patients. Acta Ophthalmol. 2012, 90, e359–e366. [Google Scholar] [CrossRef] [PubMed]
  55. Szegedi, S.; Scheschy, U.; Schmidl, D.; Aranha Dos Santos, V.; Stegmann, H.; Adzhemian, N.; Fondi, K.; Bata, A.M.; Werkmeister, R.M.; Couderc, C.; et al. Effect of Single Instillation of Two Hyaluronic Acid-Based Topical Lubricants on Tear Film Thickness in Patients with Dry Eye Syndrome. J. Ocul. Pharmacol. Ther. 2018, 34, 605–611. [Google Scholar] [CrossRef] [PubMed]
  56. Fukuda, R.; Usui, T.; Miyai, T.; Yamagami, S.; Amano, S. Tear meniscus evaluation by anterior segment swept-source optical coherence tomography. Am. J. Ophthalmol. 2013, 155, 620–624. [Google Scholar] [CrossRef] [PubMed]
  57. Akiyama, R.; Usui, T.; Yamagami, S. Diagnosis of Dry Eye by Tear Meniscus Measurements Using Anterior Segment Swept Source Optical Coherence Tomography. Cornea 2015, 34 (Suppl. S1), S115–S120. [Google Scholar] [CrossRef]
  58. Villani, E.; Arita, R. Imaging of meibomian glands: From bench to bedside and back. Eye 2019, 33, 695–697. [Google Scholar] [CrossRef]
  59. Baudouin, C.; Messmer, E.M.; Aragona, P.; Geerling, G.; Akova, Y.A.; Benítez-Del-Castillo, J.; Boboridis, K.G.; Merayo-Lloves, J.; Rolando, M.; Labetoulle, M. Revisiting the vicious circle of dry eye disease: A focus on the pathophysiology of meibomian gland dysfunction. Br. J. Ophthalmol. 2016, 100, 300–306. [Google Scholar] [CrossRef]
  60. Hwang, H.S.; Shin, J.G.; Lee, B.H.; Eom, T.J.; Joo, C.K. In Vivo 3D Meibography of the Human Eyelid Using Real Time Imaging Fourier-Domain OCT. PLoS ONE 2013, 8, e67143. [Google Scholar] [CrossRef] [Green Version]
  61. Di Zazzo, A.; Coassin, M.; Varacalli, G.; Galvagno, E.; De Vincentis, A.; Bonini, S. Neurotrophic keratopathy: Pros and cons of current treatments. Ocul. Surf. 2019, 17, 619–623. [Google Scholar] [CrossRef]
  62. Sabatino, F.; Di Zazzo, A.; De Simone, L.; Bonini, S. The Intriguing Role of Neuropeptides at the Ocular Surface. Ocul. Surf. 2017, 15, 2–14. [Google Scholar] [CrossRef] [PubMed]
  63. Di Zazzo, A.; Gaudenzi, D.; Yin, J.; Coassin, M.; Fernandes, M.; Dana, R.; Bonini, S. Corneal angiogenic privilege and its failure. Exp. Eye Res. 2021, 204, 108457. [Google Scholar] [CrossRef] [PubMed]
  64. Di Zazzo, A.; Yang, W.; Coassin, M.; Micera, A.; Antonini, M.; Piccinni, F.; De Piano, M.; Kohler, I.; Harms, A.C.; Hankemeier, T.; et al. Signaling lipids as diagnostic biomarkers for ocular surface cicatrizing conjunctivitis. J. Mol. Med. 2020, 98, 751–760. [Google Scholar] [CrossRef] [PubMed] [Green Version]
  65. Di Zazzo, A.; Micera, A.; De Piano, M.; Cortes, M.; Bonini, S. Tears and ocular surface disorders: Usefulness of biomarkers. J. Cell. Physiol. 2019, 234, 9982–9993. [Google Scholar] [CrossRef] [PubMed]
  66. Barabino, S.; Aragona, P.; di Zazzo, A.; Rolando, M.; Berchicci, L.; Bonini, S.; Calabria, G.; Cantera, E.; Gambaro, S.; Leonardi, A.; et al. Updated definition and classification of dry eye disease: Renewed proposals using the nominal group and Delphi techniques. Eur. J. Ophthalmol. 2021, 31, 42–48. [Google Scholar] [CrossRef]
  67. Alexander, H.; Brown, S.; Danby, S.; Flohr, C. Research Techniques Made Simple: Transepidermal Water Loss Measurement as a Research Tool. J. Investig. Dermatol. 2018, 138, 2295–2300.e1. [Google Scholar] [CrossRef] [Green Version]
  68. Farahmand, S.; Tien, L.; Hui, X.; Maibach, H.I. Measuring transepidermal water loss: A comparative in vivo study of condenser-chamber, unventilated-chamber and open-chamber systems. Skin Res. Technol. 2009, 15, 392–398. [Google Scholar] [CrossRef]
  69. Imhof, R.E.; De Jesus, M.E.P.; Xiao, P.; Ciortea, L.I.; Berg, E.P. Closed-chamber transepidermal water loss measurement: Microclimate, calibration and performance. Int. J. Cosmet. Sci. 2009, 31, 97–118. [Google Scholar] [CrossRef]
  70. Calonge, M.; Labetoulle, M.; Messmer, E.M.; Shah, S.; Akova, Y.A.; Boboridis, K.G.; Merayo-Lloves, J.; Aragona, P.; Benítez-Del-Castillo, J.; Geerling, G.; et al. Controlled Adverse Environment Chambers in Dry Eye Research. Curr. Eye Res. 2018, 43, 445–450. [Google Scholar] [CrossRef]
Figure 1. (a) DEvice© ocular hygrometer. (b) A schematic design of the diagnostic tool system. The figure shows a side and rear view of the schematic representation of a mono sensor diagnostic prototype with: an eyepiece cup (10); the sensor (20) placed inside it; a processing board (30) equipped with processor (31), memory (34) and wireless connection device (32); the optional connection cable (33); a digital screen (40) with buttons (41); and a rechargeable power supply battery (50) placed in the handle.
Applsci 12 01647 g001aApplsci 12 01647 g001b
Figure 2. The DEvice© ocular hygrometer cup probe.
Applsci 12 01647 g002
Figure 3. (A) The RH increase in time considering the whole trial for patients with dry eye disease; (B) the RH increase in time considering the whole trial for healthy subjects; (C) the mean values of RH increase in time: patients with dry eye disease vs. healthy subjects.
Applsci 12 01647 g003
Publisher’s Note: MDPI stays neutral with regard to jurisdictional claims in published maps and institutional affiliations.

