Article

Comparative Analysis of Fermentation Conditions on the Increase of Biomass and Morphology of Milk Kefir Grains

by
Sandra V. Avila-Reyes
1,*,
Cruz E. Márquez-Morales
2,
Germán R. Moreno-León
2,3,
Antonio Ruperto Jiménez-Aparicio
3,
Martha L. Arenas-Ocampo
3,
Javier Solorza-Feria
3,
Evangelina García-Armenta
4 and
Julieta C. Villalobos-Espinosa
2,*
1
CONACyT-Instituto Politécnico Nacional-CEPROBI, Carrera Yautepec-Jojutla, Km.6 calle CEPROBI No.8, Colonia San Isidro, Yautepec C.P. 62730, Morelos, Mexico
2
Tecnológico Nacional de Mexico/Campus ITS Teziutlán, Ingeniería en Industrias Alimentarias, Fracción I y II Aire Libre S/N, Teziutlán C.P. 73960, Puebla, Mexico
3
Instituto Politécnico Nacional-CEPROBI, Carrera Yautepec-Jojutla, Km.6 calle CEPROBI No.8, Colonia San Isidro, Yautepec C.P. 62730, Morelos, Mexico
4
Facultad de Ciencias Químico Biológicas, Universidad Autónoma de Sinaloa, Ciudad Universitaria, Culiacán C.P. 80013, Sinaloa, Mexico
*
Authors to whom correspondence should be addressed.
Appl. Sci. 2022, 12(5), 2459; https://doi.org/10.3390/app12052459
Submission received: 9 February 2022 / Revised: 20 February 2022 / Accepted: 23 February 2022 / Published: 26 February 2022
(This article belongs to the Special Issue New Trends in the Structure Characterization of Food)

Abstract

:
Kefir grains represent a symbiotic association group of yeasts, lactic acid bacteria and acetic acid bacteria within an exopolysaccharide and protein matrix known as kefiran. The mechanism of growth of a biomass of kefir after successive fermentations and optimal conditions is not well understood yet. Biomass growth kinetics were determined to evaluate the effects of temperatures (10 °C to 40 °C) and different substrates, such as monosaccharides (fructose, galactose, glucose), disaccharides (lactose, saccharose) and polysaccharides (Agave angustifolia fructans) at 2%, in reconstituted nonfat milk powder at 10% (w/v) and inoculated with 2% of milk kefir grain (105 CFU/g), after determining the pH kinetics. The best conditions of temperature and substrates were 20 °C and fructans and galactose. An increase in cells, grain sizes and a change in the morphology of the granules with the best substrates were observed using environmental scanning electron microscopy, confocal laser scanning microscopy and Image Digital Analysis (IDA). Kefir grains with agave fructans as their carbon source showed the higher fractal dimension (2.380), related to a greater co-aggregation ability of LAB and yeasts, and increase the formation of exopolysaccharides and the size of the kefir grains, which opens new application possibilities for the use of branched fructans as a substrate for the fermentation of milk kefir grains for the enhancement of cellular biomasses and exopolysaccharide production, as well as IDA as a characterization tool.

1. Introduction

Throughout history, water kefir and milk kefir have been consumed, both of which are produced from gelatinous particles called kefir granules. Both have different physical, chemical and microbiological compositions [1]. Milk kefir is a fermented dairy product from the Caucasus, Tibet and Mongolia consumed for its biological activity and functional properties as an antimicrobial, antibacterial, anti-inflammatory, immunomodulating, antioxidant, antihypertensive and hypocholesterolemic, among others [2,3,4,5,6], which are associated with its microbiological and physicochemical composition, as well as its possible application in the food industry or materials, such as gelling, texturizing, rheology or packaging [2], which are also associated with its microbiological and physicochemical composition. It is produced by the action of lactic acid bacteria, acetic acid bacteria and yeasts, which are embedded in a rubbery matrix known as kefir grain, composed of insoluble proteins and polysaccharides, which live symbiotically [6,7,8]. The biomass of kefir grains slowly increases after successive fermentations, while the bacteria/yeast ratio is steady maintained in the matrix [9].
These symbiotic relations between microorganisms are responsible for production of the flavor of the kefir product [10,11]. Yeast strains in kefir grains also play a crucial role in fermentation and in forming the flavor and aroma in the final product. Thus, identification studies of yeast strains from kefir grains have been carried out. Kluyveromyces maxianus, Torulaspora delbrueckii, Saccharomyces cerevisiae. During the fermentation of sugars, valuable products such as exopolysaccharides (kefiran), organic acids (acetic acid, lactic acid) and volatile substances (ethyl acetate, acetaldehyde) are generated, in addition to the production of alcohol that gives flavor and increases the aroma of the final product, helping to improve the organoleptic properties [2,11,12].
Several substrates have been used for fermentation of the kefir grains, such as monosaccharides (glucose, galactose, fructose) and disaccharides (lactose, saccharose). However, there are few studies that report the application of polysaccharides (starch) [13,14,15,16] or fructans (inulin) [8] as a substrate for the growth of the biomass of milk kefir grains.
Fructans are present in various plants as reserve carbohydrates, but the fructans, such as inulins extracted from chicory roots (Cichorium intybus L.), are the ones that are mainly marketed throughout the world. Inulin has linear chains with fructose β (2-1) bonds with a degree of polymerization (DP) between 3–10 [17,18,19]. In recent years in Mexico, there has been an increasing research interest in agave fructans (FUC), which are extracted mainly from Agave tequilana Weber for commercialization [20,21]. However, there are other species such as Agave angustifolia Haw from which FUC are also extracted. FUC have a different structure compared to chicory inulin, since in addition to having linear chains, they also have branches, forming a heterogeneous mixture of branched fructose polymers. The polymers of FUC have fructosil units in β (2-1) and β (2-6) branched DP bonds between 3–30 [22,23] with intermediate or terminal glucose units [20,24]. In recent years, there has also been a growing interest in using FUC as a functional food ingredient for its technological or nutraceutical properties [17]. However, it has not been studied as a substrate for fermentation cultures. For the biomass production to be optimal, the kinetic parameters of the fermentation must be adequately controlled.
Substrates and temperature are two of the main parameters used to increase the biomass during growth kinetics in fermentation with kefir granules; so, they are important for choosing the best fermentation conditions [25]. In the fermentation process of substrates, mainly simple sugars by the kefir granules, an interaction is generated between different microorganisms present in the culture. The symbiosis between yeasts and BAL maintains a balance, where the yeasts through the fermentation of substrates provide nutrients to the BAL and the latter provide metabolites that serve as an energy source for the yeasts. At the same time, an exopolysaccharide is generated that helps in the auto aggregation and increase of the granule [26,27].
Image digital analysis (IDA) is an auxiliary tool that allows the statistical analysis of morphological changes and surfaces [28,29]. These changes can be associated with the growth conditions of the kefir granules and relate to populations of microorganisms within the same granule, allowing control of the growth of the total biomass and the production of exopolysaccharides. Image texture analysis has emerged for the purpose of measuring quantitative microstructural changes of food from images [30]. Texture is an attribute represented by the spatial arrangement in the levels of gray pixels of an object or region of interest of an image, which quantifies some visual characteristics within the image such as the roughness of objects [31,32] and describes properties such as regularity of homogeneity [33]. Many methods for analyzing texture have been developed and the two most used are the grayscale co-occurrence matrix algorithm (GLCM) and the shifting differential box-counting method (SDBC).
The objective of this study was to perform growth kinetics during milk kefir fermentation to determine the best fermentation conditions using monosaccharides, disaccharides and polysaccharides at different temperatures to determine their influence on the microbial content and morphological changes of kefir granules under environmental scanning electron microscopy (ESEM), confocal laser scanning microscopy (CLSM) and IDA.

2. Materials and Methods

2.1. Material

Kefir grains were obtained from Teziutlán, Mexico. Nonfat milk powder fortified (Svelty®, Nestlé, Vevey, Switzerland) as a control substrate (CON), fructose (FRU) (USP, 08431, Fermont, Monterrey, Mexico), galactose (GAL) (G0750, Sigma-Aldrich, St. Louis, MO, USA), glucose (GLU) (27740, Golden Bell, Querétaro, Mexico), lactose (LAC) (1.07657.1000, Millipore, Burlington, MA, USA), saccharose (SAC) (FX27360, Golden Bell) and agave fructans (FUC) (from Agave angustifolia Haw obtained through a patented process [34]) were used for this study.

2.2. Fermentation Process

In order to determine the biomass growth kinetics of the kefir grains and make the selection of the best substrates, fermentations were carried out for the treatment variables using nonfat milk powder reconstituted as the test bed (10% w/w total solids) and used as control [8]. For the treatments, it was fortified with different substrates at 12% w/w total solids: FRU, GAL, GLU, LAC, SAC or FUC [35]. For each treatment, it was in a volume of 100 mL, in 250 mL flasks to have enough aeration space, and was inoculated with 2% kefir granules to initiate the propagation for the following temperatures of 10, 15, 20, 25, 30, 35 and 40 °C. An incubator in static mode was used for temperatures of 25, 30, 35 and 40 °C (LAB-LINE, Model R3525, Melrose, IL, USA). The fermentation was performed under ambient atmospheric conditions in all cases, until 24 h, in static mode. The initial pH value of the fermentation substrate was 6.8 and was monitored during the process at the time 0, 2, 4, 6 and 24 h using an OHAUS pH meter (Starter pen, ST10, Ohaus Corp., Parsippany, NJ, USA). All experiments were performed in triplicate. Kefir grains need frequent fermentations for their sustainability. The change of milk was carried out every 24 h, and the biomass was recorded weekly.

2.3. Kefir Grain Biomass Determination

The kefir grains’ biomass concentration was carried out by gravimetric analysis [36]. Kefir grains were separated from fermented milk by filtering using plastic sieves sanitized with 70% ethanol and dried. Kefir grains were rinsed with sterile distilled water and then left to dry on sterilized paper towels to remove excess of water at room temperature. Finally, the kefir grains were weighed using an analytical balance and afterward returned to the new milk. For each propagation medium, this procedure was repeated every 24 h for 7 days. The increase in grain biomass was calculated for each treatment using Equation (1).
I n c r e a s e   i n   b i o m a s s   ( % ) = W 2 W 1 W 1   ×   100
where W1 = kefir grains’ initial weight and W2 = weight of the kefir grains after the 24 h of fermentation. All experiments were performed in triplicate.

2.4. Microbiological Analysis

Microbiological analyses were carried out [8]. Bacteria of the genus Lactobacilli and Lactic streptococci were counts by plate on de Man, Rogosa and Sharpe (MRS) medium (110661, Merck, Darmstadt, Germany) and M17 medium (7262702, BD DifcoTM, Rutherford, NJ, USA), respectively (both at 37 °C for 48 h). Yeasts were grown on potato dextrose agar (PDA) (211900, BD Bioxón, Rutherford, NJ, USA) (at 25 °C for 5 d).

2.5. Microstructure Analysis

The microstructure of kefir grains treated with FUC, GAL and the control was observed by environmental scanning electron microscopy (Carl Zeiss, model EVO LS10, Jena, Germany). The granules were placed on conductive carbon tape and images of the surface were captured at a water vapor gauge pressure of 30 Pa and at an acceleration voltage of 15 kV. All images were stored in TIFF format with a resolution of 2048 × 1536 pixels.

2.6. Confocal Laser Scanning Microscopy

Confocal scanning laser microscopy (CSLM) was performed using an LSM 800 microscope (Carl Zeiss, Oberkochen, Germany) on the analysis of fat, proteins and sugars of kefir grains control and treatments (FUC and GAL). Samples were observed in 3D using Carl Zeiss ZEN 2.6 Blue edition software (Jena, Germany). The prepared samples were mounted on glass slides, stained with Nile Red, Calcofluor White and Rhodamine B and observed under the CLSM at laser wavelengths of 495 nm (green), 614 nm (red), 353 nm (blue) and 558 nm (yellow). The images were taken with a 20×/0.5 Objective Plan-Neofluar at a resolution of 1024 × 1024 pixels.

2.7. Image Digital Analysis

The images captured with the ESEM were processed using the ImageJ v.1.50d software (National Institutes of Health, Bethesda, MD, USA), and the fractal analysis was conducted using the box-counting method with the plugin FracLac Box-Counting. A generalization of the box counting method was used to evaluate the fractal dimension of the images (FDt). In this work, the shifting differential box-counting method (SDBC) was used [37]. The size of the cropping was the same for all the images evaluated at 500× magnification.

2.8. Image Texture Analysis

Texture parameters can be extracted from ESEM images (e.g., angular second moment (ASM), contrast, correlation, inverse difference moment (IDM) and entropy) using the GLCM and surface plot tools of ImageJ v.1.50d software (National Institutes of Health, Bethesda, MD, USA). These parameters are related to characteristics such as homogeneity, contrast and the presence of organized structures within the image.
The GLCM is based on the idea that an image can be analyzed through the number of pixels or squares that form it in horizontal direction Nx and vertical direction Ny, in the matrix element Pδ (i,j), with intensity values i and j at a particular displacement distance δ from along a given direction θ [38]. Furthermore, each of these pixels has a gray tone value that is quantified up to Ng levels (diagonally). Therefore, considering the above, an image can be represented as a function, which assigns different shades of gray for each pixel or set of pixels, and from this information the texture of an image can be characterized [31,39,40].
The GLCM calculates up to 14 different descriptors. In this study, the following four were considered:
(a)
Energy measures uniformity textural image and is an opposite parameter to entropy. The energy parameter is also known as uniformity, energy uniformity and angular second moment (ASM).
A S M = i = 0 G 1   j = 0 G 1   { P ( i , j ) } 2
(b)
Contrast is a measure of local variations in grayscale value pixels of an image. Contrast is also known as variance or inertia.
C O N T R A S T = n = 0 G 1   n 2 { i = 1 G   j = 1 G   P ( i , j ) } ,   | i j | = n
(c)
Inverse difference moment (IDM), also known as homogeneity parameter, which is a measure similar to energy; it also represents the homogeneity of the local image.
I D M = i = 0 G 1   j = 0 G 1   1 1 + ( i + j ) 2   P ( i , j )
(d)
Entropy measures the disorder or randomness of images, can be used to characterize the texture of the image and is indicative of complexity within the image. Therefore, complex images will have high values of entropy.
E N T R O P Y = i = 0 G 1   j = 0 G 1   P ( i , j ) * l o g ( P ( i , j ) )

2.9. Statistical Analysis

Statistical analysis was performed using one-way analysis of variance (ANOVA) to assess response variables. The descriptive statistics software IBM SPSS statistics 26 (IBM Corporation, Armonk, NY, USA) was used. All experiments were performed in triplicate, and the results were expressed as mean ± standard deviation (SD). Significant differences between means were compared using post hoc of Tukey methodology (p < 0.05). MATLAB (MathWorks, Inc., Natick, MA, USA) was used to perform the Duncan’s multiple range test (p < 0.01) to evaluate the differences between the samples in the texture image analysis.

3. Results and Discussions

3.1. Fermentation Process Measurement

When the kefir grains encounter a nutrient-rich medium such as milk, the microorganisms that make them up begin to consume the nutrient to perform their vital functions. Their first task is always to reproduce and increase their biomass. One of the most important factors to control the growth of milk kefir grains is the pH. The fermentation produces a wide variety of organic acids such as acetic acid, lactic acid and malic acid, among others [41]. Acetic acid is derived from carbohydrate metabolism, but a proportion is originated during fermentation because of yeast metabolism, which has been derived from an incomplete tricarboxylic acid cycle. The production of these acids is directly related to the pH of the fermentation medium of the kefir grains. The balance involves various aspects of cell physiology and adaptation to different environmental factors [42]. To check the influence of temperature on the acidification medium, the pH values were followed along the kinetics, starting from an initial pH of the medium of 6.8 and considering an optimum of 4.5 to stop fermentation (Figure 1).
As a consequence of the production of organic acids, pH values progressively decrease in all substrates, especially due to the production of lactic acid generated because of the growth of LAB [6,14]. By increasing cell density, microorganisms must survive the byproducts of their own metabolism, such as the generation of organic acids, induced acidification and inhibition of fermentation ability, when cell density is exceeded and the amount of substrate decreases, there is cell lysis in the same medium.
A mathematical model based on a fraction conversion model [43,44] to describe the effect of temperature and fermentation time on the kinetic parameters of the pH change by kefir grains population was used with modifications for the present work, where the behavior of the pH medium vs. time was modeled to a mathematical model proposed by Kaptan et al. [43] in order to select the best conditions to increase the biomass (temperature and substrate).
To fit the mathematical model, the pH 4.5 was considered as the pH to stop the fermentation ( pH f = 4.5 ); the selection of the pH was due to the pH of fermented milk kefir grains being between 4.2 and 4.6 [45,46]. A low pH of the substrate can slow the growth of kefir grains, and it can reduce the viability of microorganisms, but it is also related to the conservation and sensorial properties of the final product. Wang et al. (2012) [47] mentioned that co-cultured kefir LAB and yeast are carried out faster and better in a pH close to 4.2 than at a pH of 6.2.
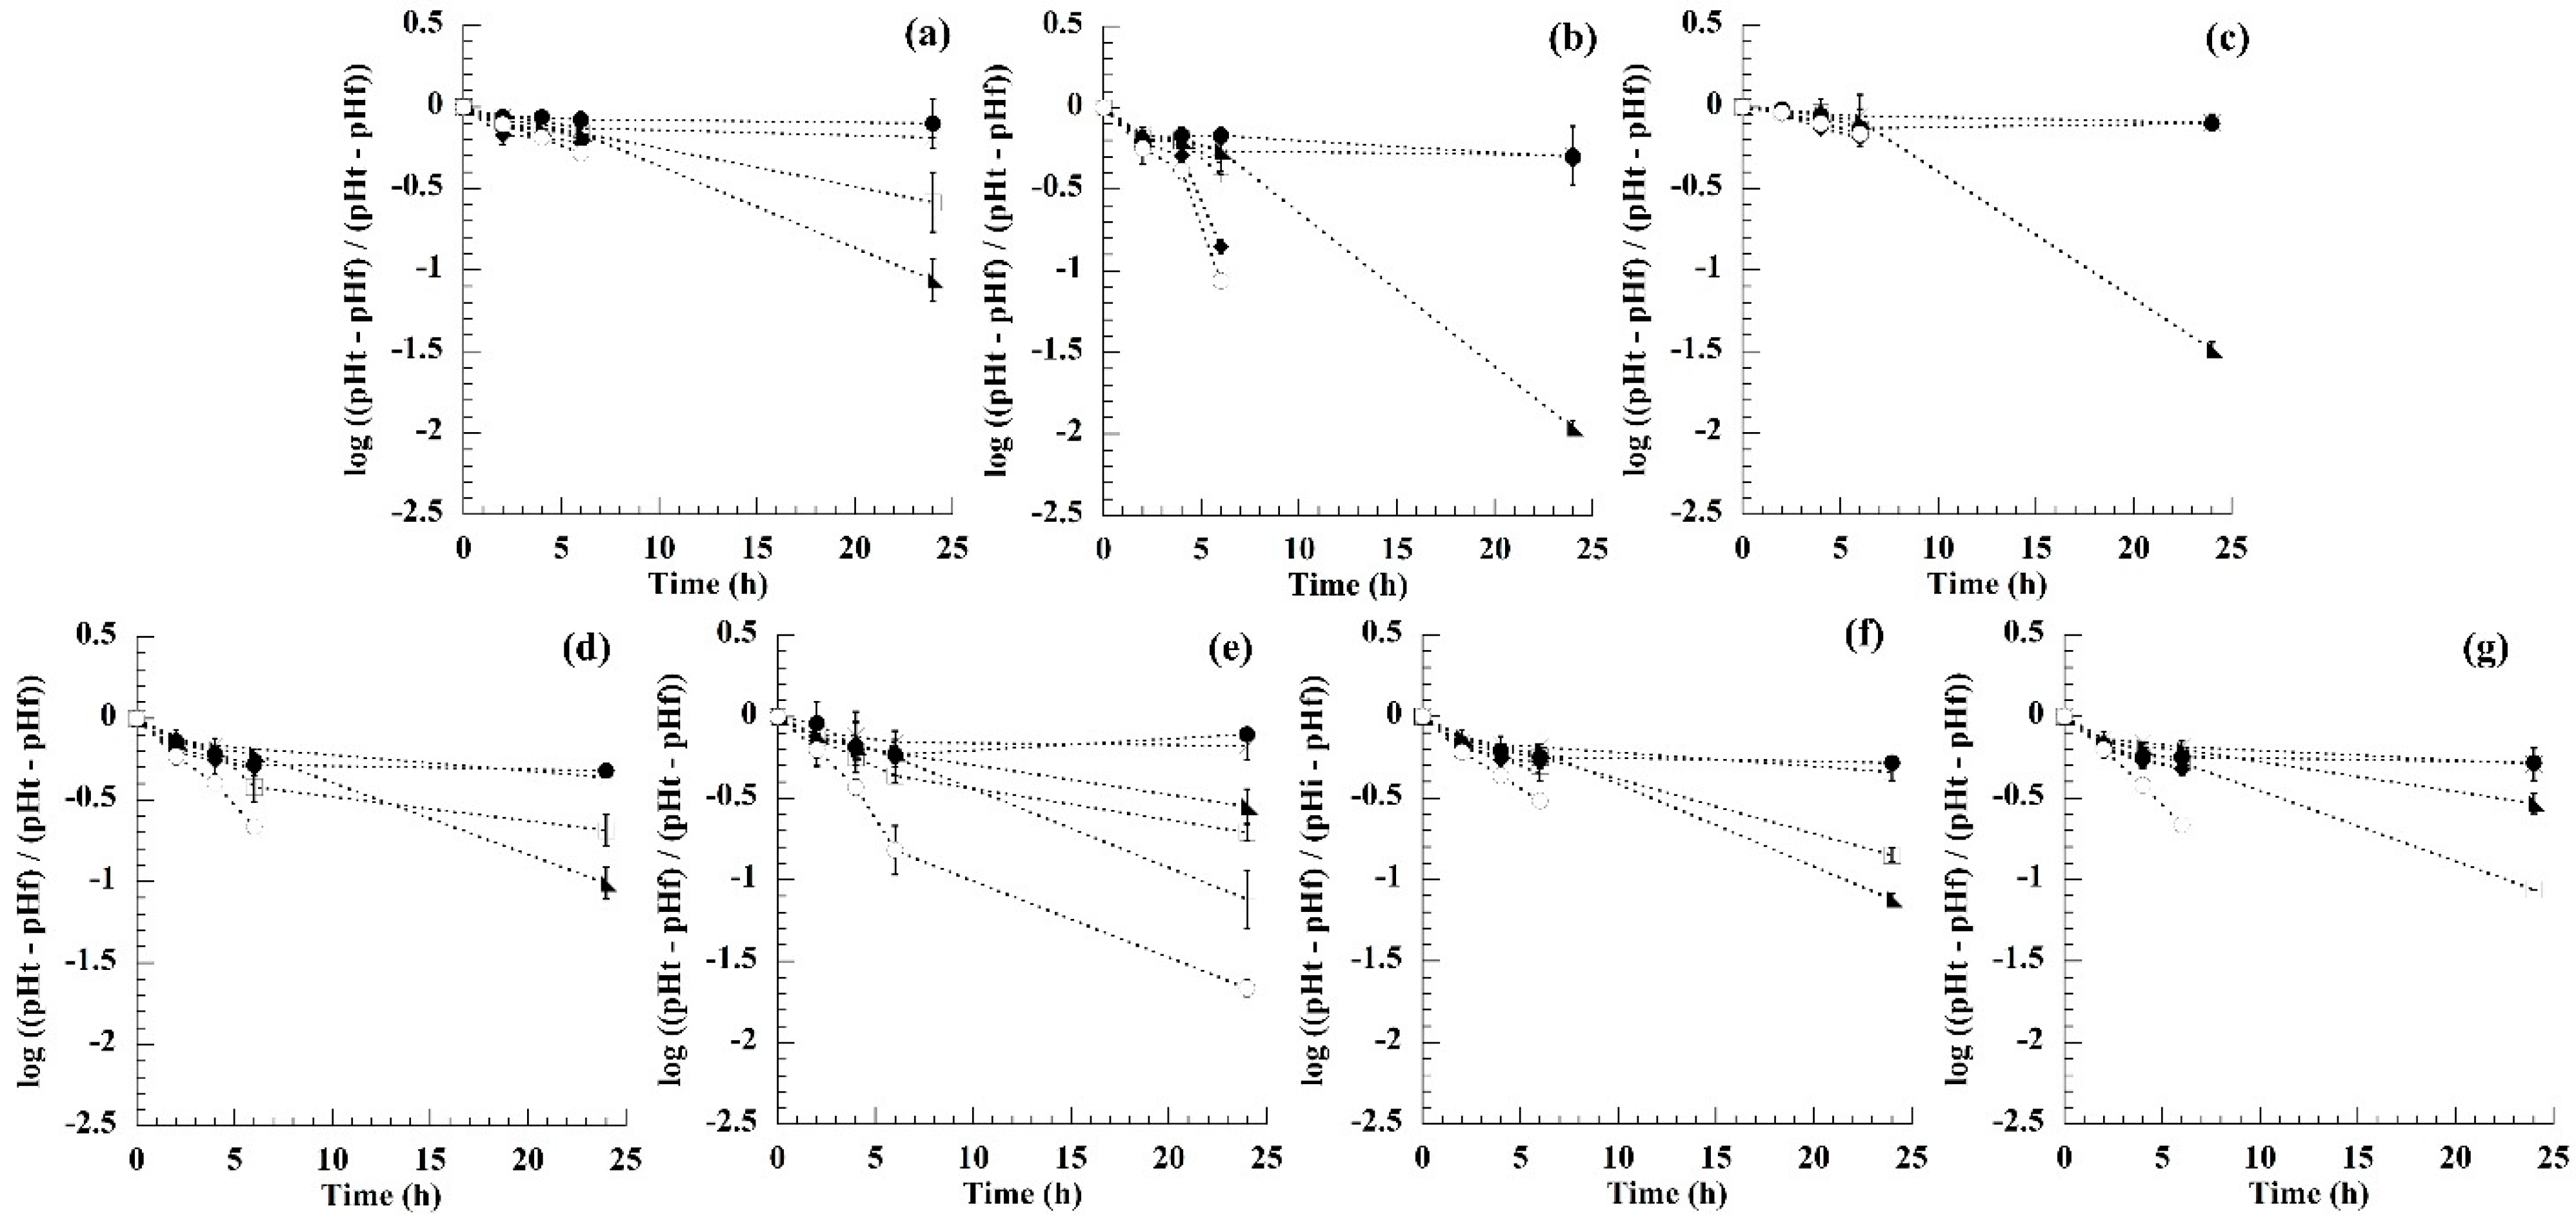
During kefir fermentation, the pH change was recorded in 0 (initial), 2, 4, 6 and 24 h intervals. Before inoculation with kefir grains, the average milk pH was 6.8 by fitting the behavior of the medium to the model (Figure 2), and the R2 was adjusted (Table 1) using the Equation (1).
Having new substrates is a continuous challenge, and in order to produce and obtain fermentation subproducts around milk kefir grains such as fermented beverages or byproducts of biotechnological interest such as exopolysaccharides, temperatures of 30 °C would be considered a better option for a continuous flow reactor, so that operation times can be reduced to 14–16 h with the use of FUC to obtain this metabolite, but not for cell growth, where a higher concentration was observed with GAL, which involves a constant change of substrate and medium to avoid cell lysis due to a fast decrease in pH. Variation on kefir microbiota by using different substrates has been demonstrated. Therefore, monitoring to maintain the characteristics of the culture in view of what is to be obtained (biomass or secondary metabolites) is crucial if industrializing its production and maintaining a sustainable culture are desired [48].
It was observed that temperatures above 25 °C did not fit the semi-logarithmic equation at 24 h of fermentation; therefore, it was concluded that after 24 h of fermentation the medium was below the established pH (4.5). Thus, the fermentation temperatures of 30, 35 and 40 °C were discarded as temperatures for the fermentation of kefir grains in a time of 24 h, where the lowest pH was reached in all samples (3.50–4.25 pH). High temperatures (30–40 °C) accelerate the metabolism of LAB’s, generating a medium with an acidic pH in a shorter fermentation time; hence, such an acidic medium can decrease the functional activity of LAB and therefore the increase in biomass is reduced.
At low temperatures (10–15 °C), which also presented a non-linear behavior, the low temperature could reduce the activity of LAB and consequently carry out a slow fermentation process, which is reflected in the low production of acid in the medium (pH 6.2) and therefore in the slow growth of a kefir biomass. Since it is essential that the LAB carry out fermentation to increase their biomass and in the same way to obtain simple sugars (galactose and glucose) through the degradation of lactose, these simple sugars could be assimilated and metabolized by the yeasts present in the medium and stimulate each other’s growth [49], which will be reflected in the increase in the biomass of the conglomerate (LAB and yeast). The results showed that at 20 °C they were able to correlate to the linear behavior.
Consequently, as a result, the experimental data obtained showed that the optimum temperature for fermentation was 20 °C for all examined media. The results indicate that the kefir grains have the potential to proliferate in the milk during fermentation at the selected temperature of 20 °C and 2% of kefir grains for GLU, SAC, FUC and GAL; moreover, the best substrates fitted to the model were R2, which was equal to 0.994, 0.991, 0.983 and 0.965, respectively (Table 1).

3.2. Biomass Increase

The increase of kefir grains (growth curve) is essential for optimization, control and monitoring of the process parameters on the kefir grains to achieve the maximum production to obtain the polysaccharide kefiran [50]. Farnworth and Mainville [45] mentioned that some of the factors that affect the chemical, microbiological and sensorial properties of kefir grains are the starting material, process and final product variables.
The starting material variables are made up of origin of milk, level of fat and origin of the inoculum, among others. In the present work, after having defined the fermentation conditions in Section 3.1 (2% of kefir grains at 20 °C), the kinetics of kefir grain biomass growth were investigated using different substrates (FUC, SAC, GAL, GLU and CON), with especial interest in the fructans as a new substrate of carbon source proposal to improve the biomass production of milk kefir grains (Figure 3). During the increase in kefir biomass, it could be observed that the kefir grains present a different behavior depending on the substrate used. It has been mentioned that the reproductive capacity of grains is significantly influenced by growing conditions [50].
The results showed that kefir grains that fermented in the control substrate (CON) presented the least increase in biomass due to the low viability of carbon sources (80% on the seventh day). Conversely, substrates that were enriched with different carbon source such as fructans, sucrose, galactose and glucose showed a greater increase, where the increment from lowest to highest was as follows, SAC < GLU < GAL < FUC, with an increase of 125, 140, 190 and 220%, respectively; these results are related to the fermentation process and the role that microorganisms develop in said fermentation. The highest biomass increase was observed with grains that grow in fructans (FUC). This behavior showed a positive effect on the biomass production of the proposal substrate. The ANOVA showed significant differences across samples (p < 0.05), with a p = 0.001 and F = 4.840. On the other hand, post hoc tests were used to evaluate the comparisons of kefir biomass growth. The post hoc tests showed significant differences across samples where fructans showed significant differences between the control (p = 0.005) and sucrose (p = 0.006). However, they did not show significant differences between glucose (p = 0.150) and galactose (p = 0.835).
The modification in the morphology of the kefir grains is related to the type of microorganisms present in the kefir grains. Since this will depend on the fermentation conditions (temperature, pH, concentration) and substrate used, some microorganisms will be favored to remain in the conglomerate and others to form part of the substrate. In an environment of high cell density with relatively low nutrients and high acid concentrations, the observed morphological change would be a natural response for cells to adapt and survive [51]. What would be directly reflected in the application of kefir grains in the industry is in its application as probiotics. On the other hand, the organization that the organisms have during the fermentation process would allow the sub-products obtained from the conglomerate to have certain characteristics such as exopolysaccharides (EPS), in which their composition and structure are significantly influenced by microorganisms present in the conglomerate [52,53]. The growth conditions affect the technological (emulsifier, film formation) and the probiotic properties. Bengoa et al. [54] reported that Lactobacillus paracasei strains showed changes in EPS production and morphology due to the growth conditions used, which were reflected in an increase in EPS production when fermented at low temperatures (20 °C).
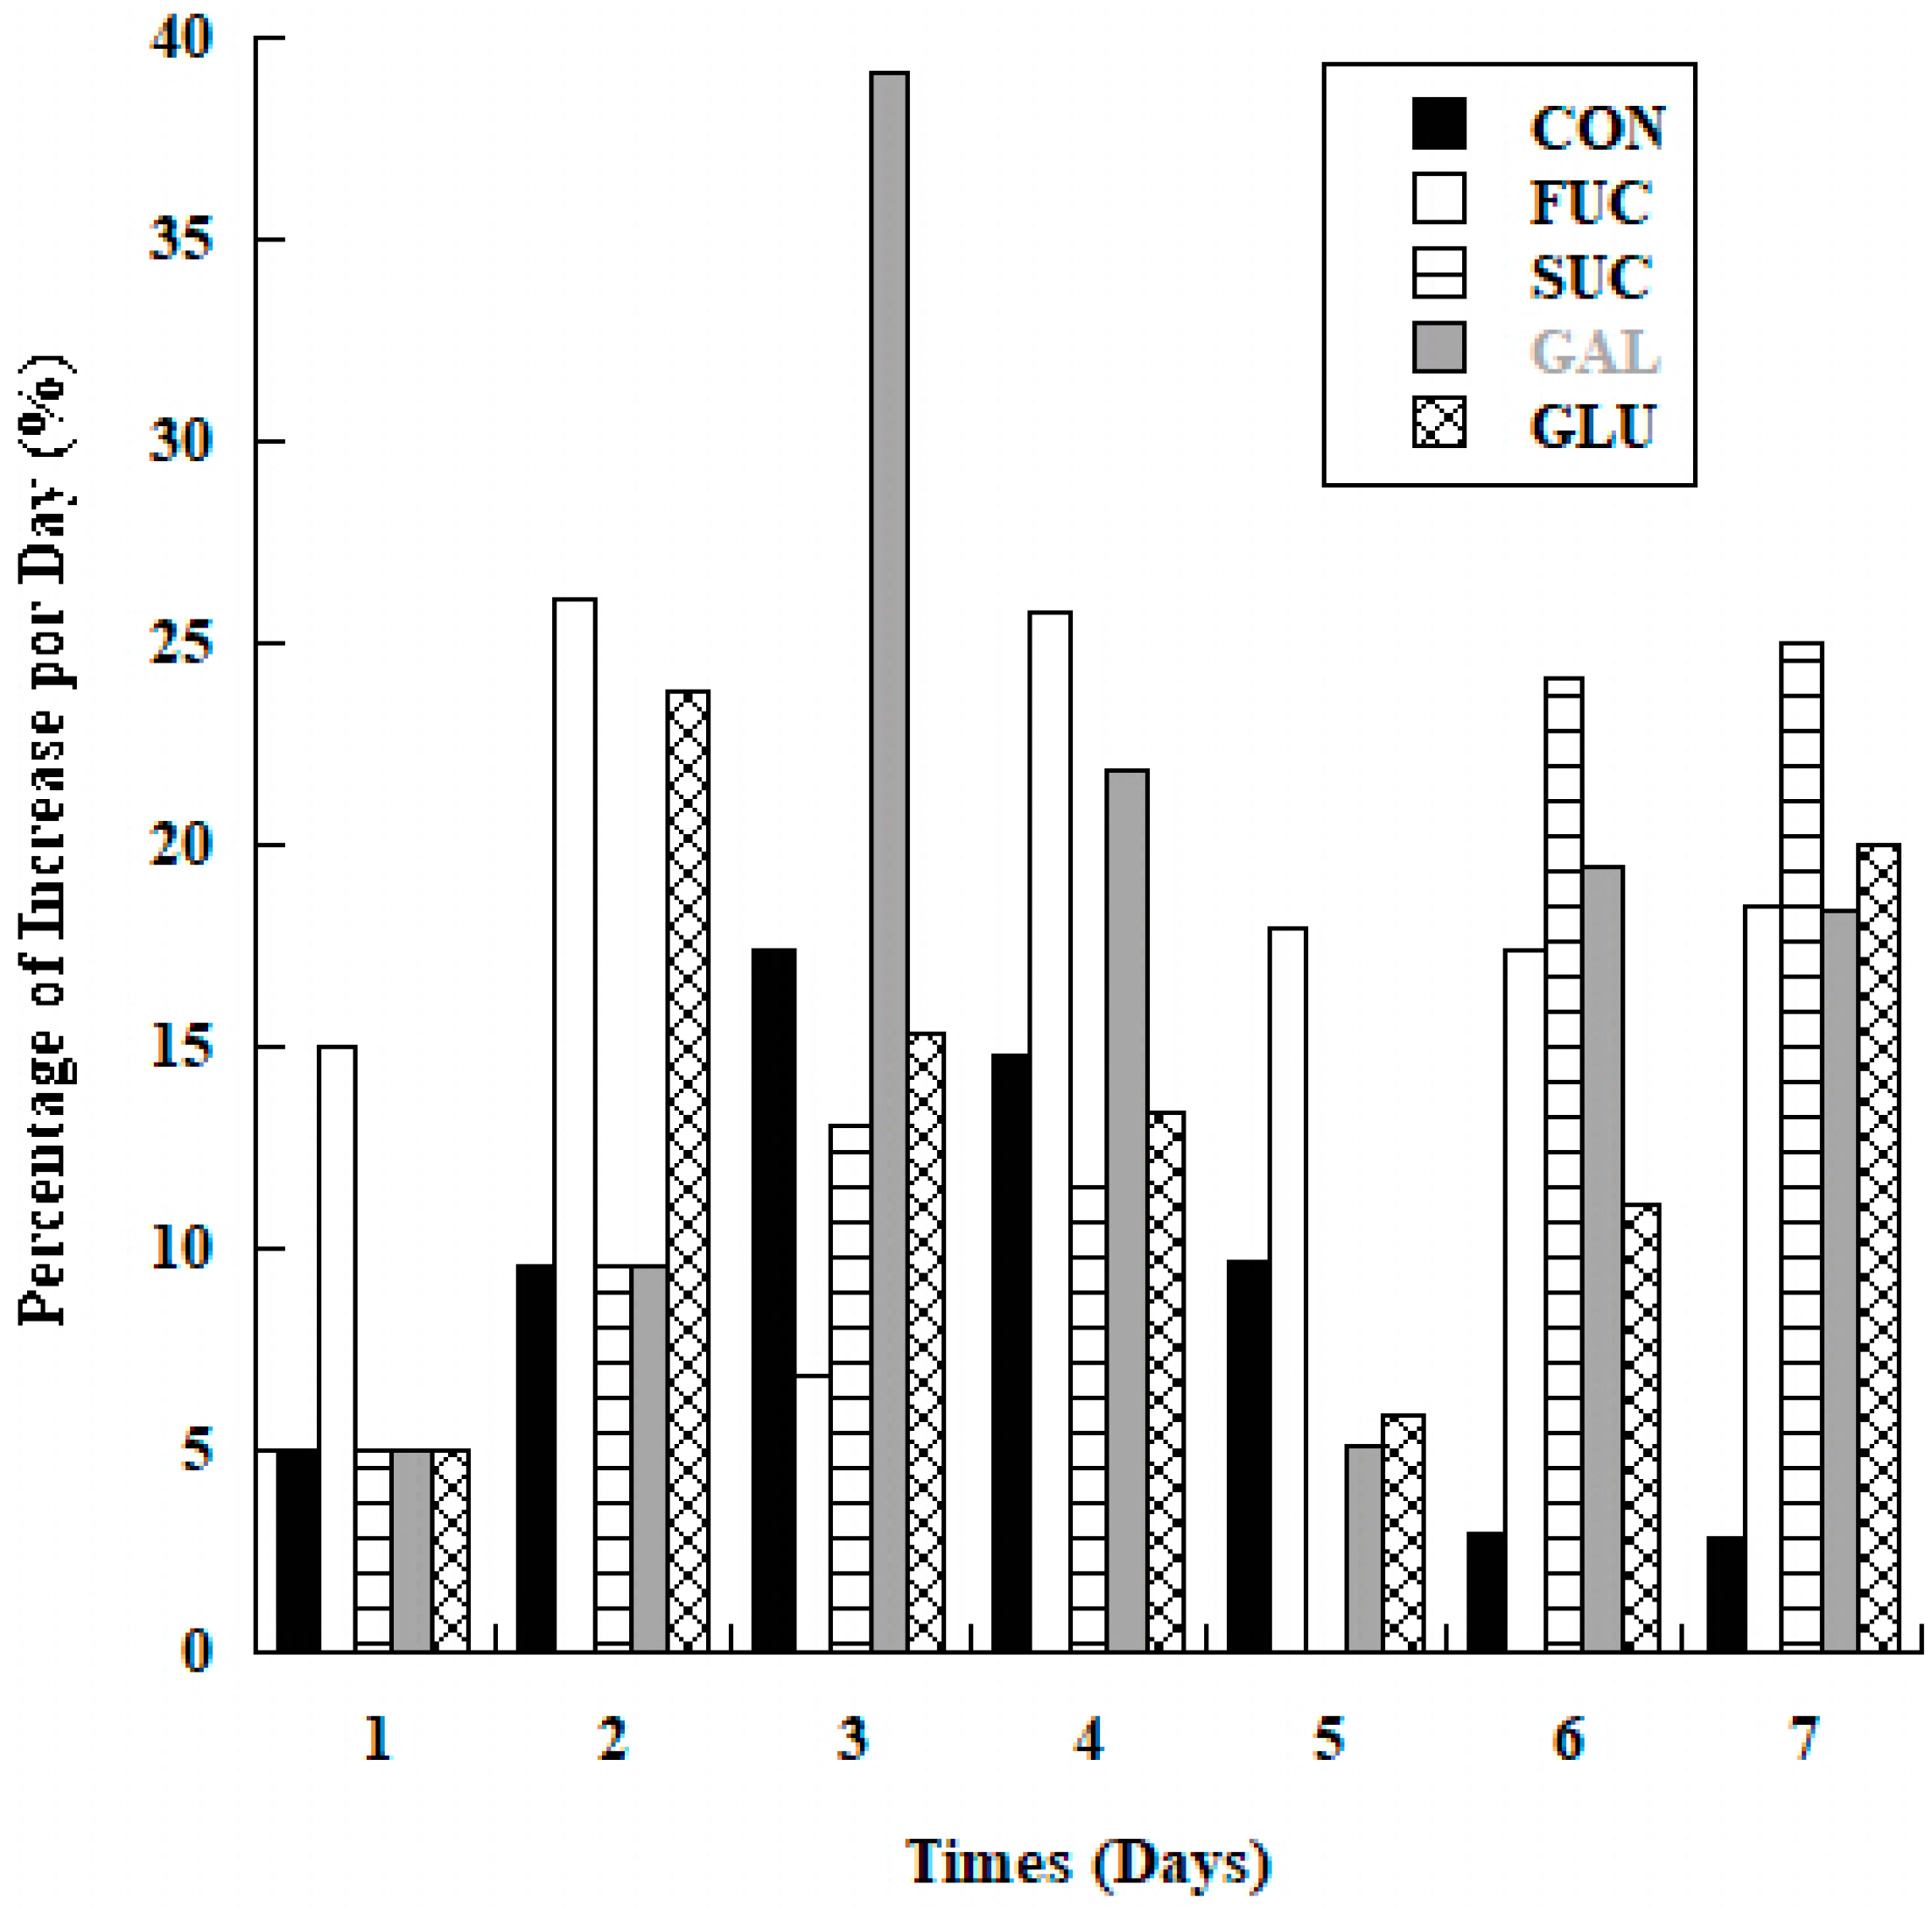
The optimization in the production of kefiran is given by the best carbon source for cell growth. Gao and Li [55] reported that fructose, glucose and sucrose give greater biomass production in a fermentation time of 24 h. In the first 24 h, the kefir grains showed a 5% increase of the biomass in the medium with GAL, SAC, GLU and the CON; on the other hand, the FUC showed a 15% increase after 24 h of fermentation (Figure 4). The breakdown of glucose into lactic acid is due to the ability of the bacteria present in kefir [39].
The growth and survival in each environmental niche depend on the ability of each genus and strain of microorganism to detect and respond to stress conditions, as this causes water to be expelled from the cell and result in an increase in the concentration of ions and metabolites and decreased cellular activity [56]. The fructans have been used in the colon as a specific substrate for bacteria of the genus Lactobacillus, Bifidobacterial and Enterococcus, which has allowed and increased said bacteria, managing to displace those that present toxic effects such as bacteria of the genus Escherichia and Clostridium. Moreover, the decrease in pH in the fermentation process enables the bacteria to generate short chain of carboxylic acids such as acetic and lactic acids [22,57]. Wang and Nobel [58] reported that the bacteria of genus Bifidobacteria prefer fructans as fermentative substrates over the glucose; this effect also happens in the lactic acid bacteria.
The synergy between the elements in the case of glucose and fructose, as well as the liner structure of fructans, could explain the affinity of the kefir grain conglomerates for the fructans, which is reflected in this case in an increase of biomass. All the substrates show an increase in biomass every 24 h; however, between 48–72 h of fermentation, the increase presents an inflection point where the increase is not so great, and after that inflection point the kefir grains again show an increase in the biomass of the grains (Figure 4). This behavior is due to the fact that during kefir fermentation it is obtained by a double fermentation: acid by bacteria and alcoholic by yeast.
During the first hours of fermentation, selective bacteria consume the free amino acids found in milk. As the fermentation slows down and the kefir enters the maturation stage, the proteolytic activity of other microorganisms, such as yeast and acetic acid bacteria, cause more peptides and free amino acids to form as in other fermented products [45].

3.3. Texture Image Analysis

This is example one of an equation: kefir grains increase their weight with subcultures in milk, generating an increase in the biomass of microorganisms together with an increase in the amount of matrix where it is composed of proteins and polysaccharides [55]. The microstructure of the surface images was examined with an environmental scanning electron microscope (ESEM). In this work, the texture parameters such as angular second moment (ASM), contrast, inverse difference moment (IDM) and entropy of ESEM images (Figure 5) were evaluated using the gray-level co-occurrence matrix algorithm (GLCM) using the ImageJ v.1.50d software.
The shifting differential box-counting method (SDBC) was used to evaluate the fractal dimension of texture [37]. Hernández-Carrión et al. [59] proposed that rougher or more irregular surfaces in the Lamuyo red pepper micrographs (LRP) have higher texture fractal dimension (FD) values and correlate with the structural damage on the LRP. The higher the FD values, the more structural damage and therefore the more irregular surface. Valenzuela-Lagarda et al. [60] reported that the interaction between protein and starch in extrusion-expanded snacks causes significant morphometric changes, which is directly reflected in the FD results (2.665–2.739). In the statistical analysis of the images about the FD parameter, two groups were obtained by the Duncan test, one formed by GAL and CON samples and the other one by FUC (p < 0.05). The kefir grains with fructans as a carbon source showed the higher FD (2.380), which is related to a greater co-aggregation present in the kefir grains. The carbon source had significantly affected the co-aggregation ability of the mixed kefir LAB and yeast combinations. The increase of microorganisms, on the other hand, allows for the formation of a matrix of polysaccharides know as a kefiran, which allows for the generation of larger network and therefore the increase in size of the kefir grains. The arrangement between all the components of the conglomerates that form the milk kefir grains gives it a surface characteristic that is directly dependent on the substrate used for the fermentation. This formation of the polysaccharide matrix allows the union of the conglomerate, which is reflected in a higher roughness that generates a complex system. Matos et al. [61] reported that fractal analyses (FD = 2.310–2.430) confirmed that higher roughness is related with the increase in complexity of patterns existing in the nanotexture of the biofilms generated by kefir grains. On the other hand, Ordóñez et al. [62] mentioned that in the biofilms formed by kefir grains, the high roughness is related with the sugar concentration and indicated that the increase of the coalescence in the polysaccharide matrix is related with the increase in the sugar concentration. Further related to that is the living organism in the kefir grains, which has its emulsifying system capable of changing the surface properties that make it a more complex system in the biofilms.
Matos et al. [63] reported that the fractal parameters confirmed that higher concentrations of fruit extract induced a superior topographic irregularity. Otherwise, they were in relation to the texture parameters such as angular second moment, contrast, correlation, inverse difference moment and entropy of ESEM images (Table 2). The entropy is indicative of the complexity of the image, which can be used as a textural parameter to numerically describe microstructural changes [60]. The statistical analysis of the results for entropy revealed a difference that was statistically significant (p < 0.05) between the three samples studied (CON, FUC and GAL). It can be observed that the micrographs that had lower entropy were GAL followed by CON and FUC (p < 0.05).
Barrera et al. [64] indicate that the higher the entropy values, the more complex the analyzed image. Oliveira et al. [65] reported that the roughness of the biofilms increased with increasing kefir concentrations, and the AFM images confirmed that the roughness of the biofilm surface is correlated with the concentration of kefir grains. The highest entropy value was reported by the fructans, which is related to the treatment that presented a greater increase in the milk kefir grains (Section 3.2). Conversely, the lower entropy was found in the images of the GAL that could be related to the greater homogeneity of their structures [40,66]. These results could be related to the ASM, where two groups were found, one that includes the CON and FUC and the other one conformed by GAL.
The ASM is inversely correlated to the entropy of the image. Yang et al. [66] reported that higher angular second moment values indicate more uniformity in the image. The GAL presented the higher value for this parameter, which represents a greater homogeneity of the surface, which can be seen in Figure 5. When analyzing the contrast, the statistical analysis of the results showed a significant different (p < 0.05) between all the treatments used (CON < GAL < FUC); a high contrast value indicates a high level of local variation [40,67]. The results showed that fructans presented the high value for the contrast parameter, which indicated that the use of FRU generates a more heterogeneous and therefore more complex surface than the other substrates presented (CON and GAL). Regarding the textural feature of the inverse different moment (IDM), the result showed a statistically significant interaction (p < 0.05) between the carbon source where the FUC showed the lowest value of IDM. The lowest IDM values could be associated with heterogenous images [64].

3.4. Confocal Laser Scanning Microscopy

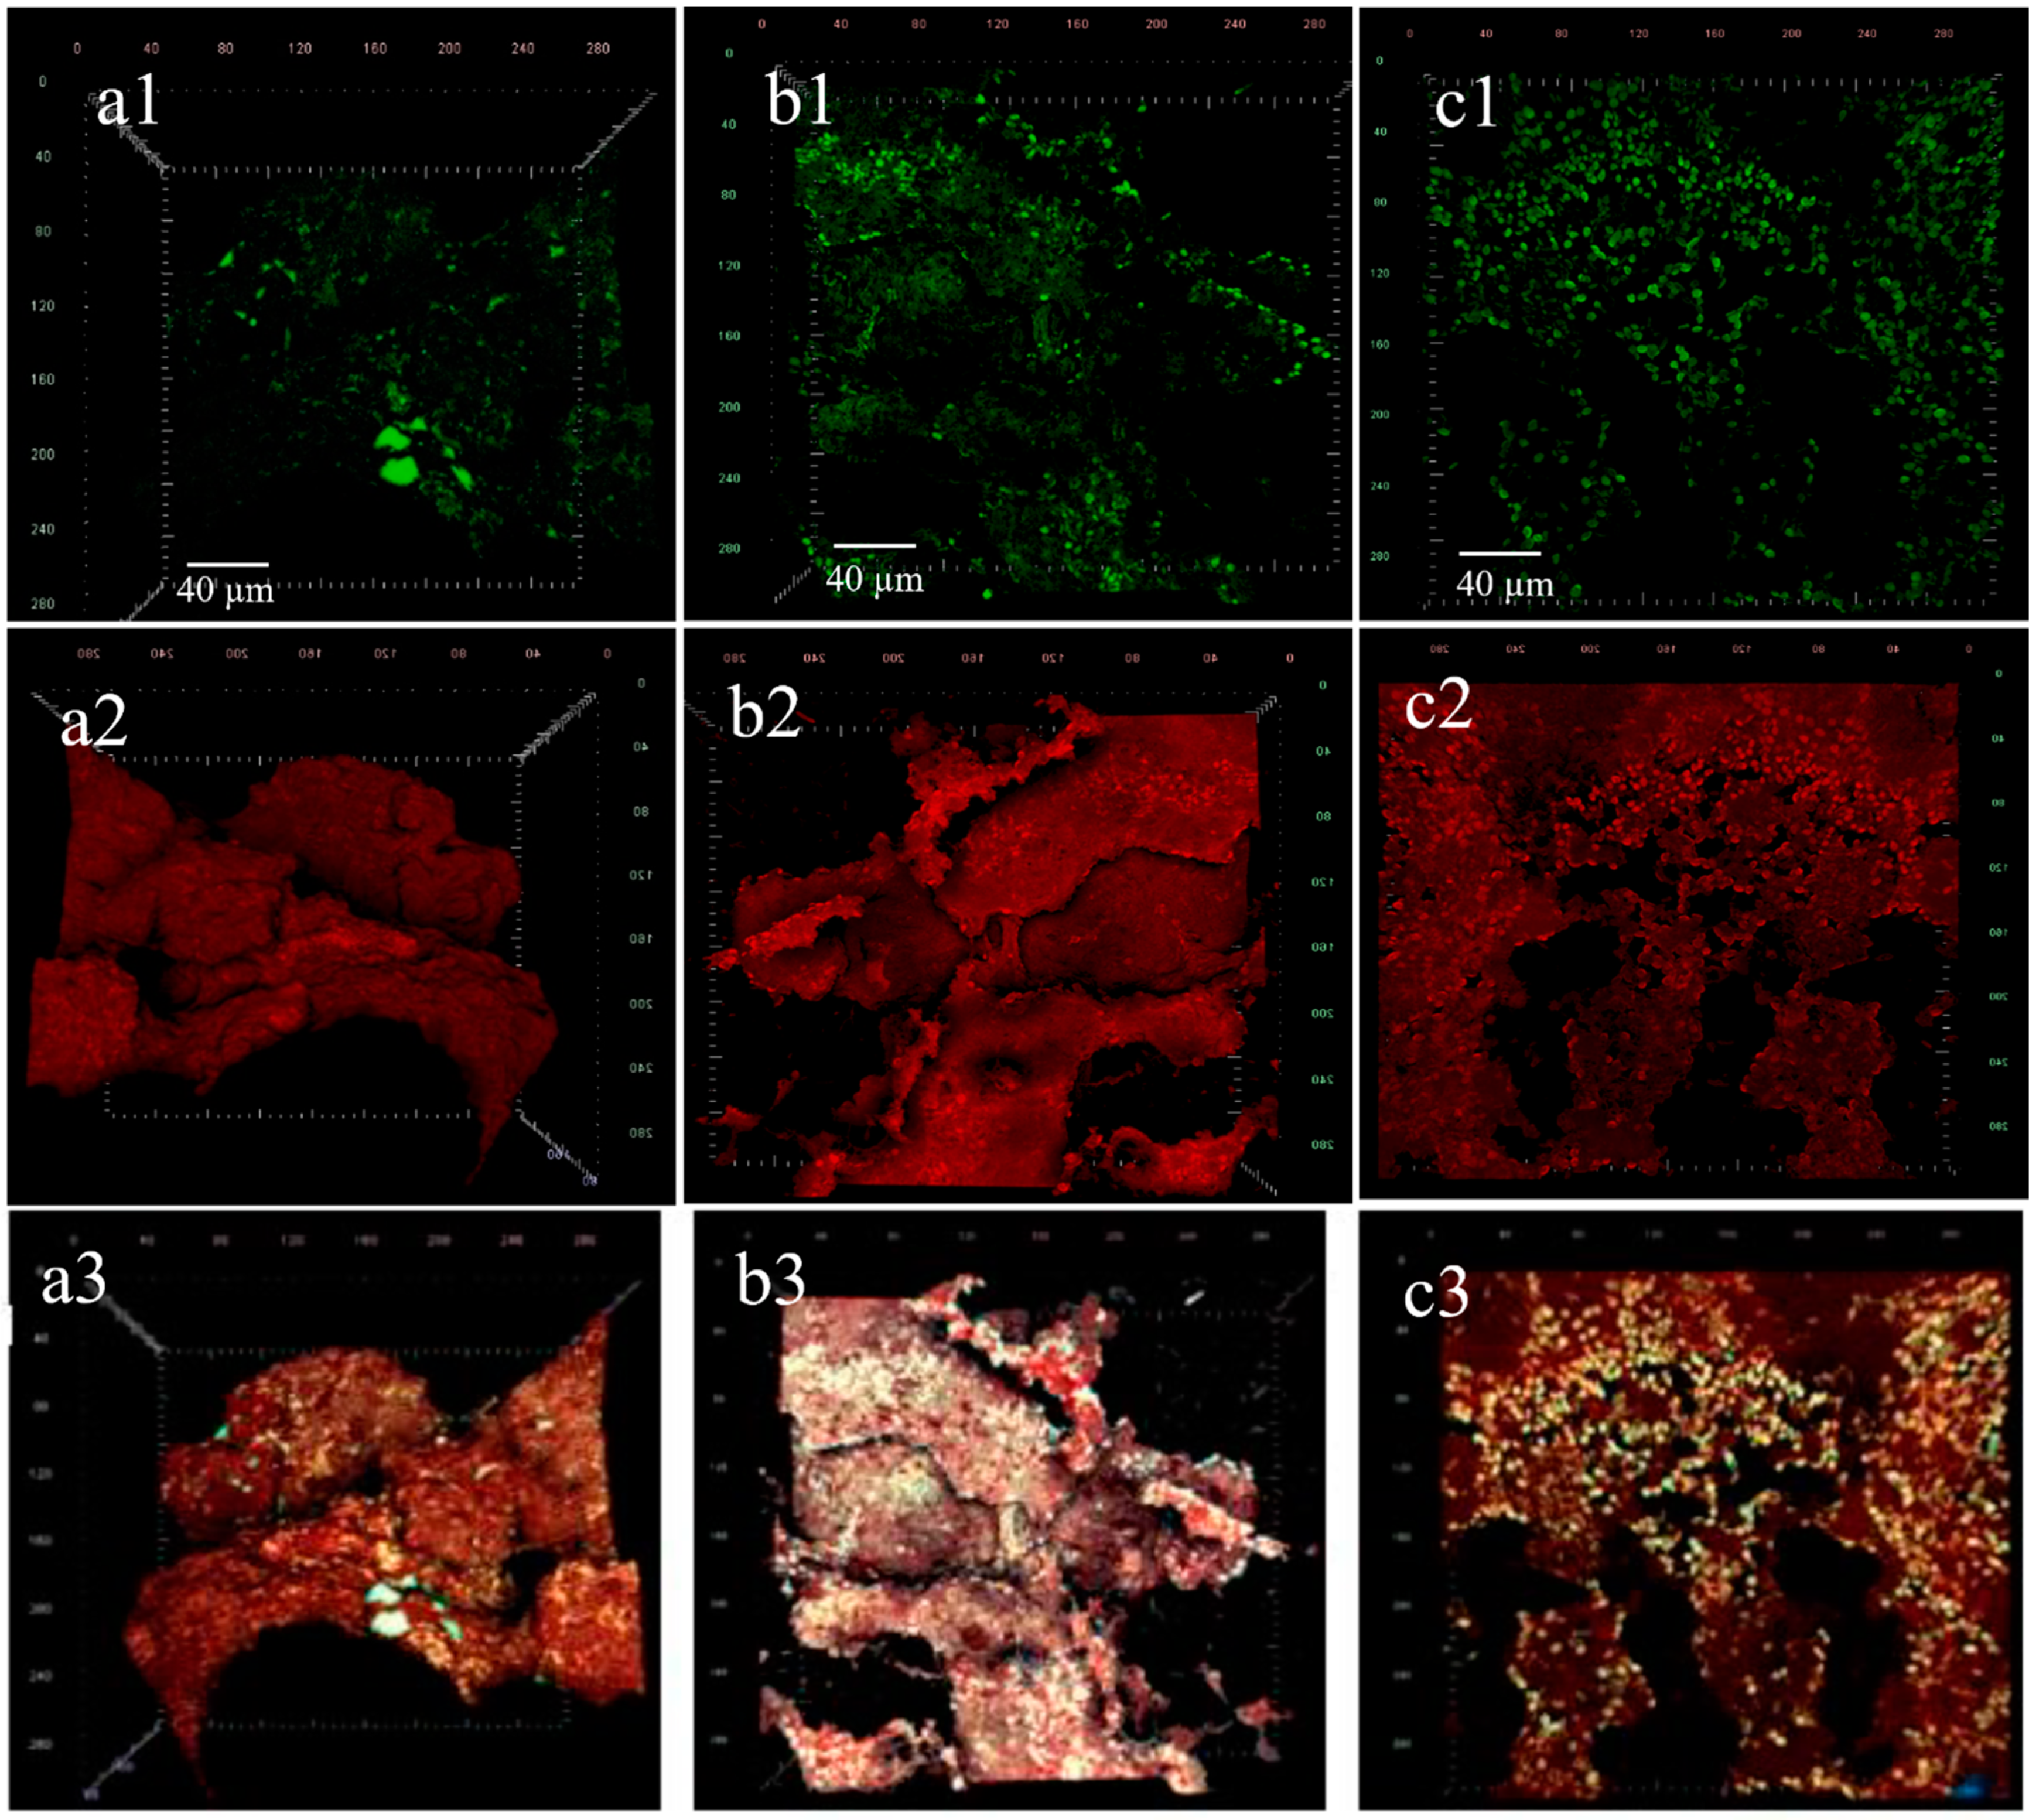
The 3D image representation of a kefir grain is presented in Figure 6, in which a kefir grain can be seen in control medium (Figure 6a) and granules in media enriched with FUC (Figure 6b) and GAL (Figure 6c). The kefir grains obtained from the treatments with the best biomass increase results were stained with Nile red (red color in the images), rhodamine B (green color) and calcofluor white (white color in the merged image) to observe the distribution of the microorganisms present in the granule.
The presence of yeasts was observed in the periphery of the granule, the quantity of microorganisms in GAL being more abundant. The FUC, however, promoted a greater number of exopolysaccharides, the same factor that was reflected in the amount of final biomass in the treatments (Figure 6b).
Higher viability levels have been reported for yeasts, highlighting the importance of the initial kefir culture [26,41], as well as the variation of environmental factors such as temperature. Alves et al. [68] reported a stimulation in the growth of yeasts with inulin, which are linear fructans and offer a high availability of their carbohydrates. Agave fructans, on the other hand, are branched fructans [22,24]. It has also been reported that, in kefir grains, yeasts have the greatest diversity of species, in which they predominate mainly Saccharomyces, Hanseniaspora, Pichia and Lachancea [69,70], indicating that their metabolism comes mainly from carbon sources produced during the fermentation process. As for the bacteria species identified, there was a more significant predominance of lactic acid bacteria (LAB).

4. Conclusions

By fitting the behavior of the medium (R2 adjusted >0.85) to the model using the equation log (pHt–pHinf/pHi–pHinf), it was possible to determine the best conditions for the fermentation of milk kefir grains from Puebla, Mexico. The results indicated that the best conditions were at 20 °C and 2% of kefir grains (w/v) after 24 h. With respect to the biomass increase, after 7 days of fermentation, the fructans presented the highest increase as having a raise of 220%, 30% above the galactose (the second highest), which indicates that the fructans are a good carbon source. The fractal dimension and the texture image parameters showed that the carbon source causes significant morphometric changes in the milk surface kefir grains. In the results, the fructans presented the more heterogeneous image surface that was correlational with a complex matrix, which is related to a more compound network of microorganisms, polysaccharides and proteins, allowing for a greater increase in milk kefir grains. That led to the proposal that the fructans are an unconventional carbon source to carry out the fermentation of milk kefir grains, which opens the new application possibilities and enhancement of the cellular biomass that functionalize exopolysaccharide production for use in food or material industries.

Author Contributions

S.V.A.-R.: conceptualization, investigation and writing—review and editing; C.E.M.-M.: methodology and investigation; G.R.M.-L.: resources and methodology: A.R.J.-A.: conceptualization, project administration and funding acquisition; M.L.A.-O.: methodology; J.S.-F.: methodology; E.G.-A.: conceptualization and review and editing; J.C.V.-E.: conceptualization, writing—review and editing and funding acquisition. All authors have read and agreed to the published version of the manuscript.

Funding

This research has been supported by Tecnológico Nacional de Mexico (TecNM) (project number: 8708.20-PD) and Instituto Politécnico Nacional (project number: SIP20196656).

Institutional Review Board Statement

Not applicable.

Informed Consent Statement

Not applicable.

Data Availability Statement

Not applicable.

Acknowledgments

The authors are grateful for the support of the Tecnológico Nacional de Mexico (TecNM) and Instituto Politécnico Nacional through collaboration of Centro de Desarrollo de Productos Bióticos (CEPROBI-IPN). The authors are thankful for the financial support and scholarship program to carry out the investigation with kefir grains experiments. The authors thank the support of the Electron Microscopy Laboratory of CEPROBI-IPN and MSc. Daniel Tapia Maruri.

Conflicts of Interest

The authors declare no conflict of interest.

References

  1. Zeynep, B.; Guzel, S.; Gokırmakl, C.; Greene, A.K. A comparison of milk kefir and water kefir: Physical, chemical, microbiological and functional properties. Trends Food Sci. Technol. 2021, 113, 42–53. [Google Scholar] [CrossRef]
  2. Grønnevik, H.; Falstad, M.; Narvhus, J.A. Microbiological and chemical properties of Norwegian kefir during storage. Int. Dairy J. 2011, 21, 601–606. [Google Scholar] [CrossRef]
  3. Nielsen, B.; Gürakan, G.C.; Ünlü, G. Kefir: A multifaceted fermented dairy product. Probiotics Antimicrob. Proteins 2014, 6, 123–135. [Google Scholar] [CrossRef]
  4. Rosa, D.D.; Dias, M.M.; Grzeskowiak, Å.M.; Reis, S.A.; Conceição, L.L.; Carmo, G.P. Milk kefir: Nutritional, microbiological and health benefits. Nutr. Res. Rev. 2017, 30, 82. [Google Scholar] [CrossRef] [PubMed]
  5. Yilmaz, B.; Sharma, H.; Melekoglu, E.; Ozogul, F. Recent developments in dairy kefir-derived lactic acid bacteria and their health benefits. Food Biosci. 2022, 46, 101592. [Google Scholar] [CrossRef]
  6. Garrote, G.L.; Abraham, A.G.; De Antoni, G.L. Microbial Interactions in Kefir: A natural probiotic drink. Biotech. Lac. Acid. Bact. Novel. Appl. 2010, 327. [Google Scholar] [CrossRef]
  7. Guzel-Seydim, Z.E.Y.; Wyffels, J.T.; Seydim, A.C.; Greene, A.K. Turkish kefir and kefir grains: Microbial enumeration and electron microscopic observation. Int. J. Dairy Technol. 2005, 58, 25–29. [Google Scholar] [CrossRef]
  8. Yamin, H.; Elmali, M.; Karadagoglu, G.; Cetinkaya, A. Observations of kefir grains and their structure from different geographical regions: Turkey and Germany. Ataturk Univ. Vet Bil. Derg. 2006, 1, 11–15. [Google Scholar]
  9. Guzel-Seydim, Z.; Kok-Tas, T.; Ertekin-Filiz, B.; Seydim, A.C. Effect of different growth conditions on biomass increase in kefir grains. Int. J. Dairy Sci. 2011, 94, 1239–1242. [Google Scholar] [CrossRef] [PubMed]
  10. Gul, O.; Mortas, M.; Atalar, I.; Dervisoglu, M.; Kahyaoglu, T. Manufacture and characterization of kefir made from cow and buffalo milk, using kefir grain and starter culture. Int. J. Dairy Sci. 2015, 98, 1517–1525. [Google Scholar] [CrossRef] [PubMed] [Green Version]
  11. Atalar, I. Functional kefir production from high pressure homogenized hazelnut milk. LWT-Food Sci. Technol. 2019, 107, 256–263. [Google Scholar] [CrossRef]
  12. Karim, A.; Aider, M. Comprehensive utilisation of electro-activated whey-based media in cell growth, metabolite production and aroma compounds synthesis using a starter culture originated from kefir grain. Int. Dairy J. 2022, 126, 105276. [Google Scholar] [CrossRef]
  13. Harta, O.; Iconomopoulou, M.; Bekatorou, A.; Nigam, P.; Kontominas, M.; Koutinas, A.A. Effect of various carbohydrate substrates on the production of kefir grains for use as a novel baking starter. Food Chem. 2004, 88, 237–242. [Google Scholar] [CrossRef]
  14. Zajšek, K.; Goršek, A.; Kolar, M. Cultivating conditions effects on kefiran production by the mixed culture of lactic acid bacteria imbedded within kefir grains. Food Chem. 2013, 139, 970–977. [Google Scholar] [CrossRef]
  15. Apar, D.K.; Demirhan, E.; Özel, B.; Özbek, B. Kefir grain biomass production: Influence of different culturing conditions and examination of growth kinetic models. J. Food Process Eng. 2017, 40, e12332. [Google Scholar] [CrossRef]
  16. Costa, G.M.; Paula, M.M.; Barão, C.E.; Klososki, S.J.; Bonafé, E.G.; Visentainer, J.V.; Pimentel, T.C. Yoghurt added with Lactobacillus casei and sweetened with natural sweeteners and/or prebiotics: Implications on quality parameters and probiotic survival. Int. Dairy J. 2019, 97, 139–148. [Google Scholar] [CrossRef]
  17. López, M.G.; Urías-Silvas, J.E. Agave fructans as prebiotics. Recent Adv. Fruct. Res. 2007, 37, 1–14. [Google Scholar]
  18. Dan, A.; Ghosh, S.; Moulik, S.P. Physicochemical studies on the biopolymer inulin: A critical evaluation of its self-aggregation, aggregate-morphology, interaction with water, and thermal stability. Biopolymers 2009, 91, 687–699. [Google Scholar] [CrossRef]
  19. Meyer, D.; Bayarri, S.; Tárrega, A.; Costell, E. Inulin as texture modifier in dairy products. Food Hydrocoll. 2011, 25, 1881–1890. [Google Scholar] [CrossRef]
  20. Mancilla-Margalli, N.A.; López, M.G. Water-soluble carbohydrates and fructan structure patterns from Agave and Dasylirion species. J. Agric. Food Chem. 2006, 54, 7832–7839. [Google Scholar] [CrossRef] [PubMed]
  21. Crispín-Isidro, G.; Lobato-Calleros, C.; Espinosa-Andrews, H.; Alvarez-Ramirez, J.; Vernon-Carter, E.J. Effect of inulin and agave fructans addition on the rheological, microstructural and sensory properties of reduced-fat stirred yogurt. LWT-Food Sci. Technol. 2015, 62, 438–444. [Google Scholar] [CrossRef]
  22. Chacón-Villalobos, A. Nutritional facts concerning goat milk (Capra hircus) and its variations during the agroindustrial process. Agron. Mesoamericana 2005, 16, 239–252. [Google Scholar]
  23. Arrizon, J.; Hernández-Moedano, A.; Oner, E.T.; González-Avila, M. In Vitro Prebiotic Activity of Fructans with Different Fructosly Linkage for Symbiotics Elaboration. Int. J. Probiotics Prebiotics 2014, 9, 69–76. [Google Scholar]
  24. Lopez, M.G.; Mancilla-Margalli, N.A.; Mendoza-Diaz, G. Molecular structures of fructans from Agave tequilana Weber var. azul. J. Agric. Food Chem. 2003, 51, 7835–7840. [Google Scholar] [CrossRef] [PubMed]
  25. Márquez-Aguirre, A.L.; Camacho-Ruiz, R.M.; Arriaga-Alba, M.; Padilla-Camberos, E.; Kirchmayr, M.R.; Blasco, J.L.; González-Avila, M. Effects of Agave tequilana fructans with different degree of polymerization profiles on the body weight, blood lipids and count of fecal Lactobacilli/Bifidobacteria in obese mice. Food Funct. 2013, 4, 1237–1244. [Google Scholar] [CrossRef] [PubMed]
  26. Chen, Z.; Liu, T.; Ye, T.; Yang, X.; Xue, Y.; Shen, Y.; Zhang, Q.; Zheng, X. Effect of lactic acid bacteria and yeast on the structure and fermentation properties of Tibetan kefir grains. Int. Dairy J. 2021, 114, 104943. [Google Scholar] [CrossRef]
  27. Dong, J.; Liu, B.; Jiang, T.; Liu, Y.; Chen, L. The biofilm hypothesis: The formation mechanism of Tibetan kefir grains. Int. J. Dairy Technol. 2017, 71, 44–50. [Google Scholar] [CrossRef]
  28. Almeida, A.P.; Pinto, E.P.; Pinheiro, P.G.; Da, H.D.; Matos, R.S. Distribution of microorganisms on surface of Kefir biofilms associated with Açaí extract. Sci. Amaz. 2019, 8, 10–18. [Google Scholar]
  29. Ferraro, M.A.N.; Pinto, E.P.; Matos, R.S. Study of the superficial distribution of microorganisms in kefir biofilms prepared with Cupuaçu juice. J. Bioenergy Food Sci. 2020, 7, 2732019. [Google Scholar] [CrossRef]
  30. Quevedo, R.; Mendoza, F.; Aguilera, J.M.; Chanona, J.; Gutiérrez-López, G. Determination of senescent spotting in banana (Musa cavendish) using fractal texture Fourier image. J. Food Process Eng. 2008, 84, 509–515. [Google Scholar] [CrossRef]
  31. Haralick, R.M.; Shanmugam, K.; Dinstein, I.H. Textural features for image classification. IEEE Trans. Syst. Man. Cybern. Syst. 1973, 6, 610–621. [Google Scholar] [CrossRef] [Green Version]
  32. Du, C.J.; Sun, D.W. Recent developments in the applications of image processing techniques for food quality evaluation. Trends Food Sci. Technol. 2004, 15, 230–249. [Google Scholar] [CrossRef]
  33. Pedreschi, F.; Mery, D.; Mendoza, F.; Aguilera, J. Classification of potato chips using pattern recognition. J. Food Sci. 2004, 69, E1–E5. [Google Scholar] [CrossRef]
  34. Jiménez-Aparicio, A.R.; Arenas-Ocampo, M.L.; Camacho-Díaz, B.H.; Campos-Mendiola, R.; Martínez-Velarde, R.; Vargas-Solano, S.V.; López-Bonilla, A. Modular System and Process to Obtain Different Agave Fructan Products. Patent No. 380041, 1 December 2015. [Google Scholar]
  35. Barãoa, C.E.; Klososkia, S.J.; Pinheiroa, K.H.; Marcolinoa, V.A.; Juniorb, O.V.; da Cruzc, A.G.; Pimentela, T.C. Growth kinetics of kefir biomass: Influence of the incubation temperature in milk. Chem. Eng. 2019, 75, 499–504. [Google Scholar] [CrossRef]
  36. De Sainz, I.; Redondo-Solano, M.; Solano, G.; Ramírez, L. Effect of different kefir grains on the attributes of kefir produced with milk from Costa Rica. Int. J. Dairy Sci. 2020, 103, 215–219. [Google Scholar] [CrossRef] [PubMed]
  37. Chen, W.S.; Yuan, S.Y.; Hsiao, H.; Hsieh, C.M. Algorithms to estimating fractal dimension of textured images. In Proceedings of the 2001 IEEE International Conference on Acoustics, Speech, and Signal Processing, Salt Lake City, UT, USA, 7–11 May 2001; Volume 3, pp. 1541–1544. [Google Scholar]
  38. Fongaro, L.; Kvaal, K. Surface texture characterization of an Italian pasta by means of univariate and multivariate feature extraction from their texture images. Int. Food Res. J. 2013, 51, 693–705. [Google Scholar] [CrossRef]
  39. Fernandez, L.; Castillero, C.; Aguilera, J.M. An application of image analysis to dehydration of apple discs. J. Food Eng. 2005, 67, 185–193. [Google Scholar] [CrossRef]
  40. Mendoza, F.; Dejmek, P.; Aguilera, J.M. Colour and image texture analysis in classification of commercial potato chips. Int. Food Res. J. 2007, 40, 1146–1154. [Google Scholar] [CrossRef]
  41. Bulat, T.; Topcu, A. Influences of oxidation-reduction potential on kefir: Microbial counts, organic acids, volatile compounds and sensory properties. LWT-Food Sci. Technol. 2021, 144, 111195. [Google Scholar] [CrossRef]
  42. Adamberg, K.; Kask, S.; Laht, T.M.; Paalme, T. The effect of temperature and pH on the growth of lactic acid bacteria: A pH-auxostat study. Int. J. Food Microbiol. 2003, 85, 171–183. [Google Scholar] [CrossRef]
  43. Kaptan, B.; Kayısoglu, S.; Oksuz, O. Mathematical modeling of pH variation as a function of temperature and time in kefir production. A. J. Food Sci. Nutr. Res. 2015, 2, 57. [Google Scholar]
  44. Levenspiel, O. Chemical Reaction Engineering; Wiley Eastern Publication: New Delhi, India, 1974. [Google Scholar]
  45. Farnworth, E.R.; Mainville, I. Kefir: A fermented milk product. In Handbook of Fermented Functional Foods, 2nd ed.; CRC Press: Boca Raton, FL, USA, 2008; pp. 89–127. [Google Scholar]
  46. Pogačić, T.; Šinko, S.; Zamberlin, Š.; Samaržija, D. Microbiota of kefir grains. Mljekarstvo 2013, 63, 3–14. [Google Scholar]
  47. Wang, S.Y.; Chen, K.N.; Lo, Y.M.; Chiang, M.L.; Chen, H.C.; Liu, J.R.; Chen, M.J. Investigation of microorganisms involved in biosynthesis of the kefir grain. Food Microbiol. 2012, 32, 274–285. [Google Scholar] [CrossRef] [PubMed]
  48. Moretti, A.F.; Moure, M.C.; Quiñoy, F.; Esposito, F.; Simonelli, N.; Medrano, M.; León-Peláez, A. Water kefir, a fermented beverage containing probiotic microorganisms: From ancient and artisanal manufacture to industrialized and regulated commercialization. Future Food 2022, 5, 100123. [Google Scholar] [CrossRef]
  49. Lopitz-Otsoa, F.; Rementeria, A.; Elguezabal, N.; Garaizar, J. Kefir: A symbiotic yeasts-bacteria community with alleged healthy capabilities. Rev. Iberoam. Micol. 2006, 23, 67–74. [Google Scholar] [CrossRef]
  50. Pop, C.; Apostu, S.; Salanţă, L.; Rotar, A.M.; Sindic, M.; Mabon, N.; Socaciu, C. Influence of different growth conditions on the kefir grains production used in the kefiran synthesis. Bull. Univ. Agric. Sci. Vet. Med. Cluj-Napoca Food Sci. Technol. Int. 2014, 71, 147–153. [Google Scholar] [CrossRef] [Green Version]
  51. Suwannakham, S.; Yang, S.T. Enhanced propionic acid fermentation by Propionibacterium acidi propionici mutant obtained by adaptation in a fibrous-bed bioreactor. Biotechnol. Bioeng. 2005, 91, 325–337. [Google Scholar] [CrossRef]
  52. Xu, R.; Ma, S.; Wang, Y.; Liu, L.; Li, P. Screening, identification and statistic optimization of a novel exopolysaccharide producing Lactobacillus paracasei HCT. Afr. J. Microbiol. Res. 2010, 4, 783–795. [Google Scholar]
  53. Pingitore, E.V.; Pessione, A.; Fontana, C.; Mazzoli, R.; Pessione, E. Comparative proteomic analyses for elucidating metabolic changes during EPS production under different fermentation temperatures by Lactobacillus plantarum Q823. Int. J. Food Microbiol. 2016, 238, 96–102. [Google Scholar] [CrossRef] [PubMed]
  54. Bengoa, A.A.; Llamas, M.G.; Iraporda, C.; Dueñas, M.T.; Abraham, A.G.; Garrote, G.L. Impact of growth temperature on exopolysaccharide production and probiotic properties of Lactobacillus paracasei strains isolated from kefir grains. Food Microbiol. 2018, 69, 212–218. [Google Scholar] [CrossRef]
  55. Gao, X.; Li, B. Chemical and microbiological characteristics of kefir grains and their fermented dairy products: A review. Cogent Food Agric. 2016, 2, 1272152. [Google Scholar] [CrossRef]
  56. Avila-Reyes, S.V.; Camacho-Díaz, B.H.; Acosta-García, M.C.; Jiménez-Aparicio, A.R.; Hernández-Sánchez, H. Effect of salt and sugar osmotic stress on the viability and morphology of Saccharomyces boulardii. Int. J. Environ. Agric. Biotechnol. 2016, 1, 593–602. [Google Scholar] [CrossRef]
  57. Olagnero, G.; Abad, A.; Bendersky, S.; Genevois, C.; Granzella, L.; Montonati, M. Alimentos funcionales: Fibra, prebióticos, probióticos y simbióticos. Diaeta 2007, 25, 20–33. [Google Scholar]
  58. Wang, N.; Nobel, P.S. Phloem transport of fructans in the crassulacean acid metabolism species Agave deserti. Plant Physiol. 1998, 116, 709–714. [Google Scholar] [CrossRef] [Green Version]
  59. Hernández-Carrión, M.; Hernando, I.; Sotelo-Díaz, I.; Quintanilla-Carvajal, M.X.; Quiles, A. Use of image analysis to evaluate the effect of high hydrostatic pressure and pasteurization as preservation treatments on the microstructure of red sweet pepper. Innov. Food Sci. Emerg. Technol. 2015, 27, 69–78. [Google Scholar] [CrossRef]
  60. Valenzuela-Lagarda, J.L.; García-Armenta, E.; Pacheco-Aguilar, R.; Gutiérrez-Dorado, R.; Mazorra-Manzano, M.Á.; Lugo-Sánchez, M.E.; Muy-Rangel, M.D. Relationships between morphometrical properties and the texture of an extrusion-expanded snack made from squid mantle (Dosidicus gigas). J. Texture Stud. 2018, 49, 476–484. [Google Scholar] [CrossRef] [PubMed]
  61. Matos, R.S.; Gonçalves, E.; Pinto, E.P.; Lopes, G.A.; Ferreira, N.S.; Resende, C.X. Nanoscale morphology, structure and fractal study of kefir microbial films grown in natura. Polímeros 2020, 30, e2020033. [Google Scholar] [CrossRef]
  62. Ordoñez, J.A.; Rodrigues, M.I.C.; Alvarez, L.F.; Sanz, M.L.G.; Miguillon, G. Componentes dos Alimentos e Processos-Tecnología de Alimento; Editora Artmed: Porto Alegre, Brazil, 2005. [Google Scholar]
  63. Matos, R.S.; Pinheiro, B.S.; Souza, I.S.; de Castro, R.R.P.; Ramos, G.Q.; Pinto, E.P.; da Fonseca Filho, H.D. 3D micromorphology evaluation of kefir microbial films loaded with extract of Amazon rainforest fruit Cupuaçu. Micron 2020, 142, 102996. [Google Scholar] [CrossRef] [PubMed]
  64. Barrera, G.N.; Calderón-Domínguez, G.; Chanona-Pérez, J.; Gutiérrez-López, G.F.; León, A.E.; Ribotta, P.D. Evaluation of the mechanical damage on wheat starch granules by SEM, ESEM, AFM and texture image analysis. Carbohydr. Polym. 2013, 98, 1449–1457. [Google Scholar] [CrossRef]
  65. Oliveira, A.F.D.; Santos, C.B.; Ferreira, A.M.; Bezerra, R.M.; Zamora, R.R.M.; Cruz, R.A.S.; Carvalho, J.C.T. A Viability study for the production of biofilms and in silico predictions of major compounds in kefir. J. Comput. Theor. Nanosci. 2017, 14, 2915–2926. [Google Scholar] [CrossRef]
  66. Yang, X.; Beyenal, H.; Harkin, G.; Lewandowski, Z. Quantifying biofilm structure using image analysis. J. Microbiol. Methods 2000, 39, 109–119. [Google Scholar] [CrossRef] [Green Version]
  67. Park, B.; Chen, Y.R. AE—Automation and emerging technologies: Co-occurrence matrix texture features of multi-spectral images on poultry carcasses. J. Agric. Eng. Res. 2001, 78, 127–139. [Google Scholar] [CrossRef] [Green Version]
  68. Alves, V.; Scapini, T.; Camargo, A.F.; Bonatto, C.; Stefanski, F.S.; de Jesus, E.; Techi-Diniz, L.G.; Canhadas-Bertan, L.; Resende-Maldonado, R.; Treichel, H. Development of fermented beverage with water kefir in water-soluble coconut extract (Cocos nucifera L.) with inulin addition. LWT Food Sci. Technol. 2021, 145, 111364. [Google Scholar] [CrossRef]
  69. Ali, S. Kinetics of invertase production by Saccharomyces cerevisiae in batch culture Pakistan. J. Bot. 2007, 39, 907–912. [Google Scholar]
  70. Costa dos Santos, D.C.; Oliveira-Filho, J.G.; Araujo-Santana, C.; Guimarães-Silva, F.; Pereira-Takeuchi, K.P.; Buranelo-Egea, M. Optimization of soymilk fermentation with kefir and the addition of inulin: Physicochemical, sensory and technological characteristics. LWT Food Sci. Technol. 2019, 104, 30–37. [Google Scholar] [CrossRef]
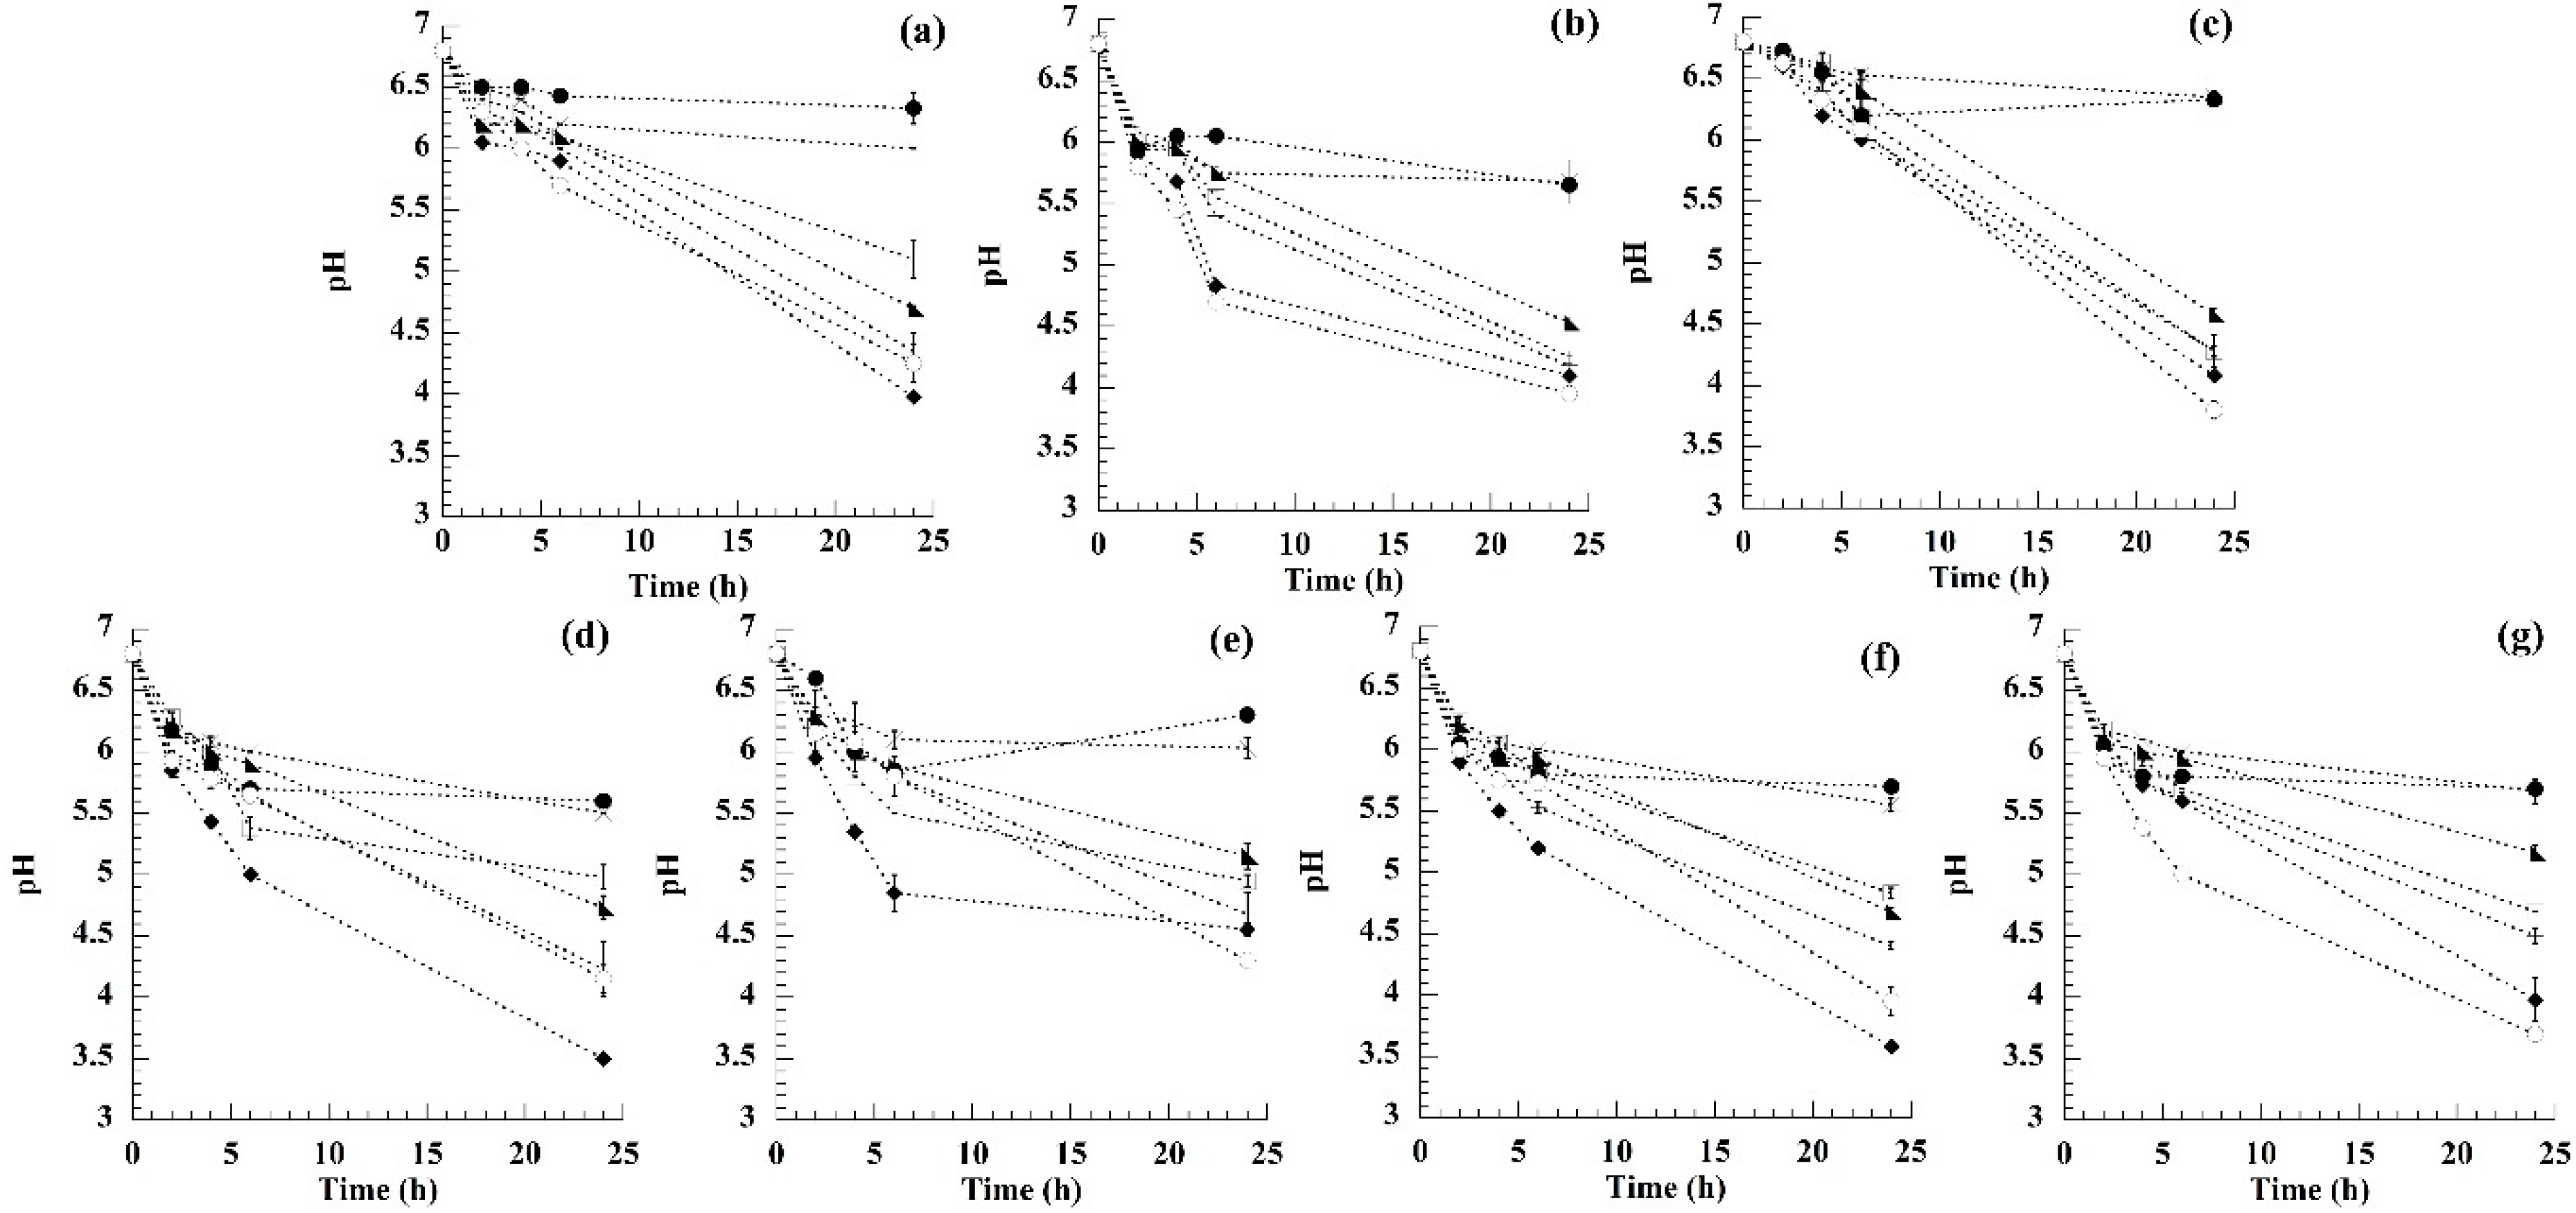
Figure 1. pH kinetics of fermentation of kefir grains’ media for growth: (a) nonfat milk powder (control) and nonfat milk powder with (b) 2% of fructans, (c) 2% of galactose, (d) 2% of glucose, (e) 2% of lactose, (f) 2% of sucrose and (g) 2% of fructose. 10 °C (–●–); 15 °C (–×–); 20 °C (–◣–); 25 °C (–□–); 30 °C (); 35 °C (–♦–); 40 °C (–○–).
Applsci 12 02459 g001
Figure 2. pH change kinetics fitted to log (pHt-pHinf / pHi-pHinf) media for growth: (a) nonfat milk powder (control) and nonfat milk powder with (b) 2% of fructans, (c) 2% of galactose, (d) 2% of glucose, (e) 2% of lactose, (f) 2% of sucrose and (g) 2% of fructose. 10 °C (–●–); 15 °C (–×–); 20 °C (–◣–); 25 °C (–□–); 30 °C (); 35 °C (–♦–); 40 °C (–○–).
Applsci 12 02459 g002
Figure 3. Biomass increment of kefir grains: (–●–) nonfat milk powder (control) and nonfat milk powder with: (–■–) 2% agave fructans, (–∆–) 2% galactose, (–○–) 2% glucose and (–x–) 2% sucrose.
Applsci 12 02459 g003
Figure 4. Biomass increment (%) per day of milk kefir grains. Media for growth of kefir grains included: control (CON; nonfat milk powder) and fructans (FUC); sucrose (SUC); galactose (GAL); glucose (GLU).
Applsci 12 02459 g004
Figure 5. Micrographs obtained by ESEM and 3D surface graphs of the texture of the milk kefir grains, where: (a) control (CON; nonfat milk powder) and treatments with nonfat milk powder fortified with (b) 2% of fructans (FUC) and (c) 2% of galactose (GAL). The scale bar indicates 100 µm.
Applsci 12 02459 g005
Figure 6. Three-dimensional CLSM images of the distribution of lipids (red color) and microorganisms in the milk kefir grain, mainly yeasts (green fluorescence): (a1a3) control (CON; nonfat milk powder) and treatments with nonfat milk powder fortified (b1b3) 2% of fructans (FUC) (b1b3) and 2% of galactose (GAL) (c1c3). Merged images (ac3). The scale bar denotes 40 µm.
Applsci 12 02459 g006
Table 1. Rate of change of pH vs. time during fermentation of milk kefir grains.
SubstrateR2R2R2R2R2R2R2
10 °C15 °C20 °C25 °C30 °C35 °C40 °C
Control0.5650.7680.9830.997***
Fructans0.6090.5040.983****
Galactose0.3580.8270.965****
Fructose0.3980.7290.9380.998***
Glucose0.5430.8520.9940.866***
Lactose0.0360.4940.9580.9190.995*0.937
Sucrose0.4660.7840.9910.996***
* Means that the fermentation medium was below the established pH of 4.5.
Table 2. Effect of the source carbon on the texture parameter of ESEM image.
SubstrateASMContrastIDMEntropyFD
Fructans2.838 × 10−4 ± 9.590 × 10⁻⁵ a336.929 ± 38.089 c1.019 × 10−1 ± 0.006 a8.541 ± 0.185 c2.380 ± 0.021 b
Galactose5.590 × 10−4 ± 1.723 × 10⁻⁴ b146.634 ± 9.143 b1.437 × 10−1 ± 0.003 b7.900 ± 0.264 a2.304 ± 0.029 a
Control3.577 × 10−4 ± 7.606 × 10⁻⁵ a81.942 ± 13.482 a1.520 × 10−1 ± 0.008 c8.279 ± 0.214 b2.327 ± 0.032 a
Duncan’s multiple range test; average ± SD; n = 3. Values with different letters in the same column showed significant difference (p < 0.01). ASM = angular second moment; IDM = inverse difference moment; FD = fractal dimension.
Publisher’s Note: MDPI stays neutral with regard to jurisdictional claims in published maps and institutional affiliations.