1. Introduction
Until the Industrial Revolution, timber was one of the main materials used in construction. However, with the popularization of new materials such as steel and reinforced concrete, timber’s use began to decline due to the limited size of the timber elements, which hindered their use in large-scale constructions.
At the end of the 20th century, that limitation of wood as a building material would disappear with the emergence of what is known as glulam (i.e., glued laminated timber). This new material allows for large-span structures and provides great freedom of design. Glulam is created by bonding together layers of timber with a moisture-resistant adhesive, which makes it stronger and more stable than traditional timber. As a result, glulam has become a popular choice for architects and engineers in the construction of large buildings and structures [
1].
Today, timber is seen as a key material for the sustainable future of construction, both for its technical and environmental qualities. Among its outstanding technical qualities, it is worth noting that timber is one of the building materials with the lowest weight-to-strength ratio. It has great insulating properties; a high degree of safety in case of fire due to the surface carbonization that is produced under the action of fire; and acts as an insulator, is easy to assemble, and has great aesthetic appeal, making it a popular choice for architects and builders [
1]. Regarding its environmental qualities, timber is a renewable resource; it is one of the materials used in construction that requires less energy and emits less carbon dioxide in its manufacturing process [
2,
3], since, to obtain it, continuous reforestation with growing trees is necessary, which guarantees the continuity of carbon dioxide sequestration and thus contributes to reducing the greenhouse effect [
4]. In addition to its advantageous characteristics, timber is of great agro-industrial interest, as it is still used today as a structural element in cellars and other agricultural constructions inspired by traditional agricultural constructions. Nevertheless, a deeper understanding of timber structure optimization could promote its use in a wider range of projects and applications.
The optimization of structures involves finding the most cost-effective structural design by minimizing the amount of material required that, at the same time, meets the predefined criteria, such as strength, stability, and displacements within the structural design and safety standards. Although research on structural optimization dates back to the 1970s [
5,
6,
7], only in the last two decades has there been significant progress in its development [
8,
9,
10,
11,
12], largely due to the implementation of artificial intelligence techniques such as genetic algorithms. However, most of the research focuses on steel [
13,
14,
15,
16] and concrete [
17,
18,
19,
20] structures, with timber structures [
21,
22,
23] largely ignored by the scientific community.
Nonetheless, there are some references studying the optimization of timber trusses using the mixed integer non-linear programming method [
24,
25], prior to the development of the current Eurocode 5 [
26,
27], which establishes the design rules for timber structures. In order to improve on the earlier attempts at optimization, Villar-García et al. [
28] addressed the two-dimensional optimization of timber trusses by programming genetic algorithms according to the Eurocode 5 [
26,
27] requirements. Later on, the authors extended the previous investigation; the optimization was carried out on a three-dimensional roof structure composed of glulam trusses with purlins arranged accordingly [
29]. Both papers were based on cost optimization, taking into account the high manpower required for triangulated structures as well as different geometric configurations. Moreover, the investigation in [
29] also considered the influence of the laminate thickness on the optimization, as a discrete approach was followed, i.e., the optimization of the cross-section was limited by the characteristics of the commercially available glulam timber boards.
The specific literature on glulam beams includes three studies worth citing. Mayencourt and Mueller [
30] analyzed the geometry of glulam beams with different section heights and widths under point loading at the center of the beam. The authors ponder the importance of considering the variable geometry of the beam to utilize all the timber in a prismatic volume, where the offcuts can serve as new beams with variable sections. However, the impact of laminate thickness, load values (such as snow or wind) within those specified in the current building standards, and the interaction between purlin spacing and beam loading are not within the scope of this paper.
Jelušič [
31] evaluated glulam beams on a cost basis using non-linear programming methods under more realistic scenarios in terms of beams, but set generic load values of 1 and 2 kN/m
2 and considered four spans ranging from 10 to 25 m. As in the previous research work, the author did not address the interaction between purlin and beam spacing that provides the three-dimensional perspective of the investigation, the effect of the laminate thickness on the height of the element, or the use loads established by the building standards.
Similar limitations could be noticed in Baranski et al. [
32], who addressed the optimization of different geometries of beams, as well as different qualities of glulam (i.e., GL22h, GL24h, GL26h, GL28h, GL30h and GL32h), by means of an Excel optimization module. For each beam typology, the authors proposed some general optimization rules under some assumptions regarding the slope, applied loads and purlin spacing. Note that, under the proposed design rules, the same dimensions of beams are considered valid for GL22h to GL32h glulam timber grades, and no statistical justification exists for this dimensioning approach.
Therefore, the aim of this investigation is to provide a different insight into the three-dimensional optimization of roof structures comprised of GL32h glulam regular double-tapered beams and purlins and subjected to realistic loads conforming to Eurocode 5 [
26,
27]. To achieve this objective, three specific research stages were concatenated. Initially, a numerical calculation program able to verify the structural performance of the different timber roofs was developed. Then, an optimization tool specifically tailored to the numerical calculation program was implemented to analyze the different geometries and identify the most cost-effective one through genetic algorithms. Finally, through the statistical analysis of the obtained results, some predictive equations are suggested as optimized design rules for both the dimensions of the structural elements and their arrangement within the structure.
2. Materials and Methods
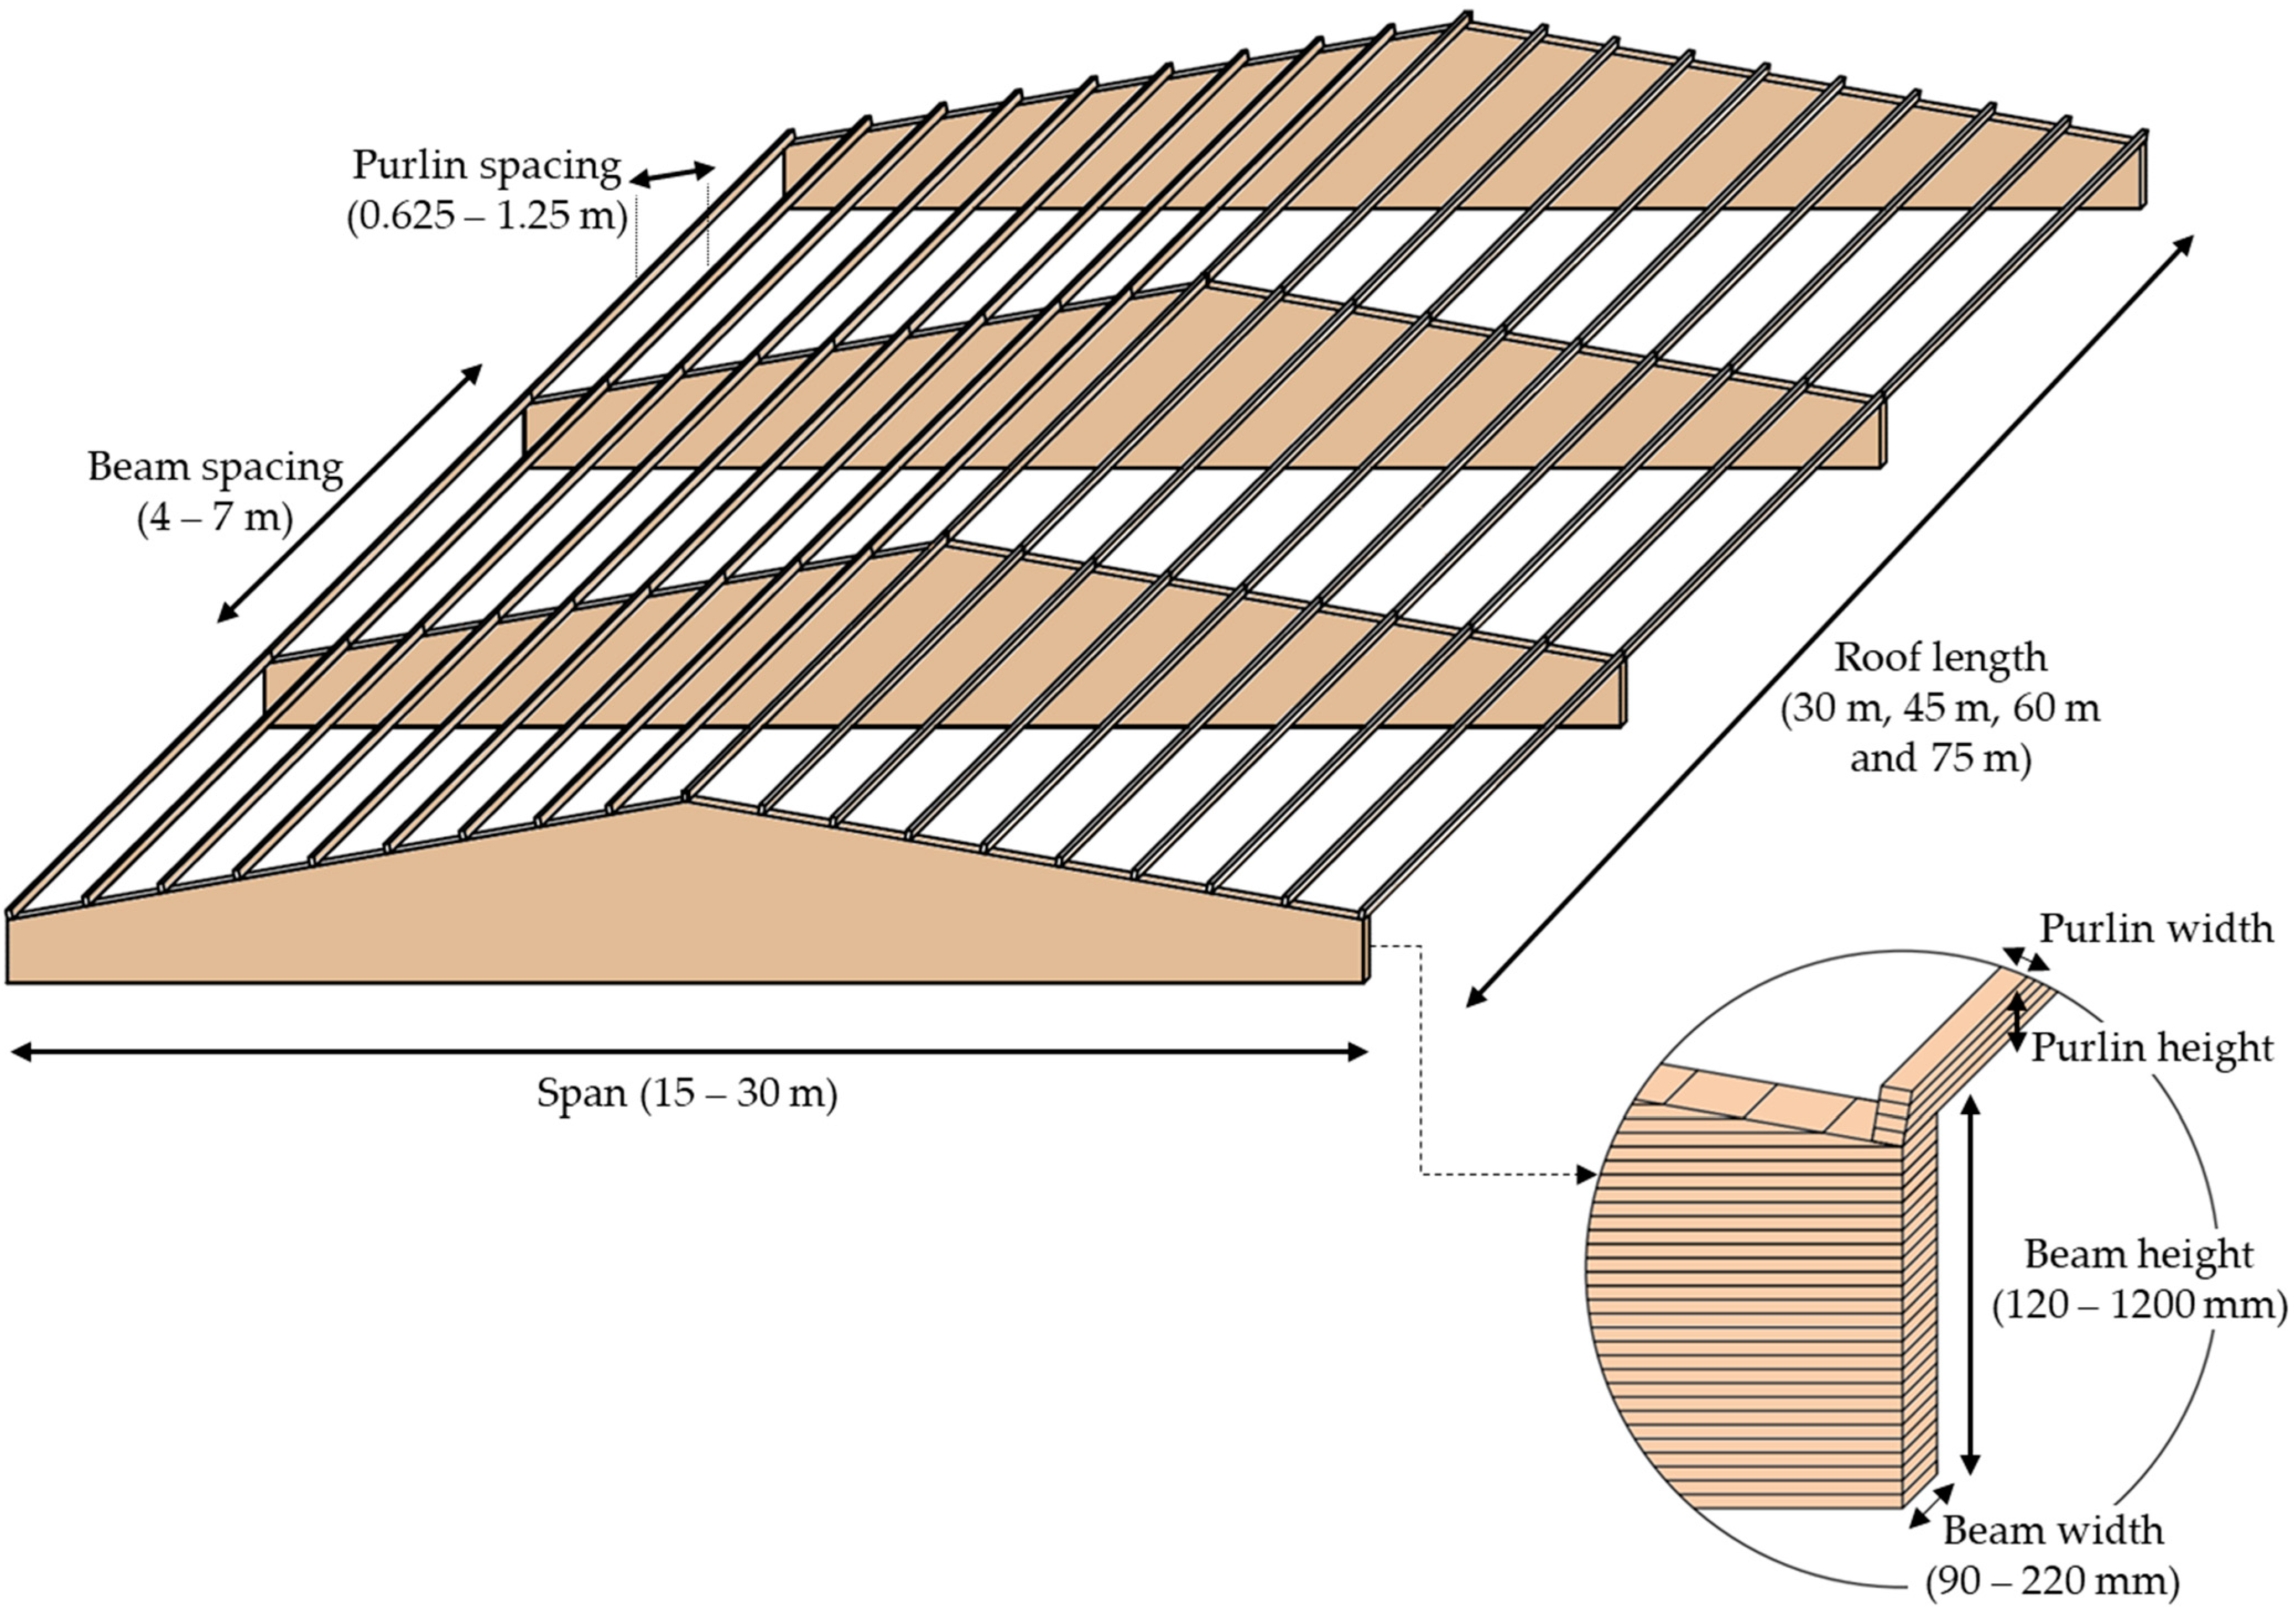
Since large open spaces and long spans are often required, regular double-tapered beams are frequently employed in agro-forestry constructions. In addition, their use also entails a lower construction time, as their characteristic shape, without intermediate joints, enables them to be executed as a single construction element. Therefore, a roof timber structure composed of regular double-tapered beams and purlins is proposed as an alternative to be optimized in this research (
Figure 1). The material of both the beams and purlins is glulam GL32h, whose characteristic strength and stiffness are established in the EN 14080 standard [
33]. Moreover, a 3D approach is followed; thus, the optimization is not limited to the cross-sections of the structural elements but extends to their arrangement in the structure (i.e., the separation between beams as well as the separation between purlins are also subjected to optimization).
As illustrated in
Figure 1, different values of beam length (Span) were considered in the optimization, ranging from 15 to 30 m in 1.25 m increments. Conversely, fixed values of 30 m, 45 m, 60 m and 75 m were studied for the length of the roof. Similarly, a fixed value of 10° was selected for the beam inclination angle. This angle was selected as it is the most commonly used value for the type of structure evaluated in this paper.
The height of the beams (Hb) and purlins (Hp) would depend on the number of sheets of timber glued together. As mentioned by Villar et al. [
28], a 40 mm laminate thickness was considered; thus, the height ranges from 120 to 1200 mm, every 40 mm. Likewise, the width of the beams (Wb) and purlins (Wp) would range from 90 to 220 mm in 10 mm increments. The values of the beam spacing (Sb), which is related to the number of beams (Nb), and the purlin spacing (Sp) are also variables, which allows for the determination of the optimal values under a cost-optimization goal. Nevertheless, the range of variation was limited to 4–7 m for the separation between the beams and 0.625–1.25 m for the separation between purlins.
The optimization process for the timber structure also considered the various types of actions to which it would be subjected. For the permanent surface loads, a dead load of 0.45 kN/m
2, as well as an automatically introduced self-weight load based on the cross-sections of the beams and purlins evaluated during the optimization process, are included. For the variable surface loads, a snow load (Snow) ranging from 0.5 to 2 kN/m
2 is allowed to cover a wide range of geographical situations in Europe. In addition, a wind load is also taken into account, considering a gable roof without openings and a building height of 5, 6, and 7 m, which are typical values for agro-industrial constructions. To determine the wind load value, a basic wind speed of 27 m/s and a terrain category III environment with a roughness length of 0.3 m are contemplated in accordance with Eurocode 1–4 [
34]. The combination of all loads followed the criteria established in Eurocode 1 [
35] to ensure the structural integrity of the timber structure under the worst-case scenario. It is worth noting that a service class 1, a modification factor (k
mod) of 0.9 and a partial safety factor for the glulam material of 1.25 were assumed in this research.
2.1. Structural Calculation
A numerical calculation program parameterized in MATLAB R2022a (Natick, MA, USA) was developed to calculate roof structures consisting of glulam beams and purlins.
Figure 2 shows the structural design model for the optimization of the roof structure studied in this investigation. As illustrated, the gable roof comprises regular double-tapered beams and bi-supported purlins without bracing against lateral buckling.
For every variation in the dimensions and arrangement of the structural elements, the developed program aims to verify the structural safety of the roof structure according to Eurocode 5 [
26,
27]. This standard ensures the strength, stability and stiffness of the structure by means of two concepts:
Ultimate limit state (ULS): the limit at which the maximum load-carrying capacity is reached and a further increase in the applied load leads to collapse or failure.
Serviceability limit state (SLS): the limit at which the requirements of the functionality, comfort or appearance of the structure are not met.
Therefore, to ensure that the roof structure has adequate structural performance against the actions and influences to which it may be subjected during its construction and intended use, it must be verified that it does not exceed any of the limit states defined above. The verification procedure for a given limit state involves identifying the effect resulting from the most unfavorable load combination applied to the structure, as well as the response of the structure to the corresponding limit situation. Then, by means of the ULS and SLS verifications described in the following sections, it shall be ensured that the structural response is not less than the effect of the applied.
2.1.1. Verification of the Ultimate Limit States
The verification of the ULS assesses the strength of the cross-sections of the structural elements. For this purpose, Eurocode 5 [
26] establishes the following requirements:
Beam verification for shear strength (I
v): the most unfavorable cross-sections are those corresponding to the supports, as the maximum shear forces act on minimum surfaces. Equation (1) shall be satisfied.
where τ
d is the design shear stress (kN/mm
2) and f
v,d is the design shear strength parallel to the grain (kN/mm
2).
For a rectangular cross-section, the value of design shear stress is calculated by Equation (2).
where
is the maximum shear force (kN),
h is the height of the cross-section (mm) and b
ef is the effective width of the beam (i.e., the product of the cross-section width and a coefficient that reduces that value, taking into account the possibility of drying cracks, which in the case of glued laminated timber has a value of 0.67).
Beam verification for bending strength (I
m): as an element with variable cross-section, one of the edges will be parallel to the direction of the fibers (i.e., parallel edge), and the other forms a certain angle relative to the grain (i.e., tapered edge). Therefore, this verification should be independently assessed for the parallel edge (I
m,0) and tapered edge (I
m,α), according to Equations (3) and (4), respectively.
where
is the maximum stress caused by the design bending moment at the parallel edge (N/mm
2) and
is the design bending strength (N/mm
2).
where
is the maximum stress caused by the design bending moment at the tapered edge (N/mm
2),
is the design bending strength (N/mm
2) and
is the reduction factor considering the redistribution of bending stresses in the cross-section (N/mm
2), which could be determined as indicated in Equation (5) when the tapered edge is subjected to tensile stresses, or Equation (6) when it is subjected to compressive stresses.
where
is the design bending strength (N/mm
2), f
v,d is the design shear strength parallel to the grain (N/mm
2),
is the angle relative to the grain (°),
is the design tensile strength perpendicular to the grain (N/mm
2) and
is the design compression strength perpendicular to the grain (N/mm
2).
It is worth noting that Eurocode 5 [
26] concedes that the stress caused by the design bending moment at each edge (
and
) is equal, as per Equation (7).
where
is the design bending moment (N), b is the width of the cross-section (mm) and h is the height of the cross-section (mm).
Moreover, the lateral–torsional buckling stability condition for the parallel and tapered edges subjected to compressive stresses shall be evaluated by Equations (8) and (9), respectively.
where
is the maximum stress caused by the design bending moment at the parallel edge (N/mm
2),
is the maximum stress caused by the design bending moment at the tapered edge (N/mm
2),
is the design bending strength (N/mm
2) and
is the reduction factor considering the redistribution of bending stresses in the cross-section (N/mm
2),
is consideration of the reduced bending strength due to lateral–torsional buckling calculated by Equation (10).
where
is the relative slenderness ratio for bending calculated, as per Equation (11).
where
is the characteristic bending strength (N/mm
2), and
is the critical bending stress (N/mm
2) defined by Equation (12).
where b is the width of the cross-section (mm); h is the height of the cross-section (mm);
is the effective length of the beam, depending on the support conditions and the load configuration (mm);
is the fifth percentile value of the modulus of elasticity parallel to the grain (N/mm
2); and
is the fifth percentile value of shear modulus parallel to the grain (N/mm
2).
Beam verification in the apex zone (I
t,90): The apex zone of a double-tapered beam refers to the zone of the beam where the two tapered sections meet. For cambered double-tapered beams, this zone is subjected to stresses perpendicular to the grain, and Equation (13) shall be satisfied.
where
is the design tensile stress perpendicular to the grain (N/mm
2),
is the design tensile strength perpendicular to the grain (N/mm
2),
is the factor taking into account the distribution of stresses in an apex zone with a value of 1.7 for pitched cambered beams, and
is the volume factor calculated for glued laminated timber, as per Equation (14).
where
is the reference volume of 0.01 m
3 and
is the stressed volume of the apex zone (m
3).
Purlin verification for combined bending and shear strength: as bi-supported beams, Equations (15) and (16) shall be satisfied.
where
is the design bending stress about the principal y-axis (N/mm
2) calculated according to Equation (17),
is the design bending stress about the principal z-axis (N/mm
2) calculated by Equation (18),
is the design bending strength about the principal y-axis (N/mm
2),
is the design bending strength about the principal z-axis (N/mm
2) and
is the factor considering the re-distribution of bending stresses in a cross-section with a 0.7 value for rectangular sections.
where
is the design bending stress about the principal y-axis (kN·m),
is the design bending stress about the principal z-axis (kN·m),
is the section modulus about axis y (mm
3),
is the section modulus about axis z (mm
3), b is the width of the cross-section (mm) and h is the height of the cross-section (mm).
Finally, Equations (8)–(11) shall be used to verify the stability condition for purlins without bracing against lateral buckling.
2.1.2. Verification of the Serviceability Limit States
The verification of the SLS assesses the deformation occurring at the center of the beam and purlin. For this purpose, Eurocode 5 [
26] establishes the following requirements:
A limit value of l/400 for the instantaneous deflection (winst), due to the instantaneous effect of the permanent load and variable loads calculated for the characteristic combination of actions.
A limit value of l/300 for the final deflection (wfin) corresponding to the quasi-permanent combination of actions.
A limit value of l/225 for the net final deflection (wnetfin) calculated as the final deflection minus the precamber.
2.1.3. Validation of the Model
To validate the model, the data provided by Argüelles-Álvarez et al. [
36] (in examples 6.5 and 8.1) and Borgström and Karlsson [
37] (in example 3.5) were introduced and analyzed in the designed numerical program. The results obtained were then compared to those reported by the respective authors. The comparison, which included both ultimate limit state (ULS) and serviceability limit state (SLS) verifications, showed similar results with no significant differences. Thus, the numerical structural calculation program is deemed valid for use in the optimization of timber structures.
2.2. Optimization by Genetic Algorithms
Structural optimization refers to the process of designing a structure in order to optimize its performance. In the scope of this investigation, the objective lies in the best timber roof structure design with respect to a minimum cost while meeting predefined criteria in the structural design standards for strength, stability and rigidity. In this regard, a model based on genetic algorithms was developed to optimize the design.
Genetic algorithms are based on the principles of genetics and natural selection, allowing a population of potential designs to evolve over multiple generations. The algorithm evaluates each individual design based on its fitness (i.e., the ability to meet the predefined performance criteria). The fittest individuals are selected for reproduction, and their genetic material is recombined to produce offspring. Those designs are then evaluated using the fitness function, and the fittest individuals are selected to form the next generation. Through successive generations, the algorithm converges on a solution that optimizes the design variables while satisfying the constraints.
Figure 3 illustrates the optimization process employed in this research work.
As previous studies [
8,
9,
28,
29] have described structural optimization using genetic algorithms, this section focuses solely on its adaptation to the present research work.
Individuals: They represent the potential solutions to the problem and can be represented as a set of parameters called genes, which together form the chromosomes that encode the values of the design variables. In this case, the individuals are each possible structural solution composed of beams and purlins. The values encoded by the chromosomes are the optimized dimensions of the beams and purlins (Hb, Hp, Wb and Wp), as well as the arrangement of these structural elements (Sp and Sb) in the roof structure. It should be noted that the number of beams (Nb) is also included as a variable in order to take into account the different roof lengths considered in the final part of the study.
Population: The set of individuals to be assessed in one generation. For the roof structure optimization, 600 individuals were considered.
Objective function: The objective function serves as the measure of effectiveness for each individual in the optimization process. In this research, fitness was based on minimizing the weight of the structure and, thus, the cost. However, certain individuals did not meet the constraints of the structural calculation rules. Therefore, a modified objective function was necessary to penalize their lack of compliance. To generate valid individuals, the value of the utilization ratio was limited to the unit to meet the restrictions. Additionally, an element that was oversized would be assigned a coefficient much lower than one. Thus, the penalty assigned a greater weight to those elements that did not meet the constraints or were oversized. However, the penalty was kept as low as possible, i.e., above the limit at which infeasible solutions become optimal. Equation (19) shows the modified objective function employed in the optimization of the roof structure:
where F(x) is the modified objective function (EUR), x is the individual of the study population, j is the number of variables studied, f(x) is the objective function in terms of cost (i.e., computed as the product of the m
3 of timber at a value of 900 EUR/m
3), Pj is the penalization term according to the restrictions imposed on each of the elements, and Gj(x) is the penalty parameter of the imposed restrictions with the same order of magnitude as the objective function and defined according to the maximum utilization ratio noticed in each structural element for j taking values ranging from 1 to 4:
G1(x) is the highest ultimate limit state utilization ratio of the beam:
0 > G1(x) > 1 then, P1(G1(x)) = 300 × 10(1−G1(x));
G1(x) = 1 then P1(G1(x)) = 0;
G1(x) = 0 then P1(G1(x)) = 4000;
G1(x) > 1 then P1(G1(x)) = G1(x) × 40,000.
G2(x) is the highest serviceability limit state utilization ratio of the beam:
0 > G2(x) < 1 then P2(G2(x)) = 180 × 10(1−G2(x));
G2(x) = 1 then P2(G2(x)) = 0;
G2(x) = 0 then P2(G2(x)) = 2400;
G2(x) > 1 then P2(G2(x)) = 12,000 × S(x).
G3(x) is the highest ultimate limit state utilization ratio of the purlin:
0 > G3(x) > 1 then P3(G3(x)) = 172.5 × 10(1−G3(x));
G3(x) = 1 then P3(G3(x)) = 0;
G3(x) = 0 then P3(G3(x)) = 4000;
G3(x) > 1 then P3(G3(x)) = G3(x) × 23,000.
G4(x) is the highest serviceability limit state utilization ratio of the purlin:
0 > G4(x) > 1 then P4(G4(x)) = 172.5 × 10(1−G4(x));
G4(x) = 1 then P4(G4(x)) = 0;
G4(x) = 0 then P4(G4(x)) = 230;
G4(x) > 1 then P4(G4(x)) = G4(x) × 1150.
The values used in the penalty function were obtained through a parametric analysis and are similar to those obtained in other works [
28,
29]. It should be noted that in other works, such as Mayencourt and Mueller [
30], the modified objective function is also based on optimizing the timber volume by using penalty functions that depend on the values of stress and strain utilization ratios. However, as the optimization is focused on an isolated beam, the authors resort to reasonably simple functions based on the criteria of the beam’s compliance or non-compliance. In Jelušič’s work [
31], beams are also optimized by means of a cost-based objective function (i.e., constructed by multiplying the required volume and the glulam price), but without implementing a modified objective function.
- 4.
Reproduction operators: The algorithm utilizes the following operators to generate new individuals to be evaluated in subsequent generations:
Selection: The fittest individuals are selected as the basis for the next generation. The method used in this optimization is roulette selection, which assigns a proportion of a roulette wheel to each individual in the population based on their adjusted score. The individuals are ordered from lowest to highest score based on their modified objective function, and each is assigned a probability of reproduction inversely proportional to that score, giving the fittest individuals a better chance of reproducing.
Crossover: Suitable individuals are crossed to generate better individuals. This approach allows for traits (i.e., information) to be transmitted among the most suitable candidates. In this paper, a two-point crossover was used in order to select two positions on the parents’ chromosome and force the sections to be exchanged.
Elitism: This is employed to accelerate the optimization process. The fittest individuals from the population are kept in the new population using the modified objective function as a criterion.
Mutation: Promotes a degree of alteration of the chromosomes of some individuals to provide certain variability in the population. This operator allows the population to continue to evolve in the search for a global minimum when it has started to stagnate around a local minimum.
A sensitivity analysis was conducted to determine the adequate reproduction operator in this research. The optimal percentages for elitism, crossover and mutation are 10%, 80% and 1%, respectively. These values are consistent with those found in other studies [
28,
29]. Although the maximum number of generations was set at 150, the optimization was terminated when convergence was reached, which was defined as 20 generations without improvement.
2.3. Statistical Analysis
Three qualitative variables (Hp, Wp and Sb) and eight quantitative variables (Span, Roof length, Snow, Cost, Hb, Wb, Nb and Sp) were considered in this study, and the following statistical analyses were carried out:
Descriptive analyses of purlin height, purlin width and beam spacing.
Multiple linear regression analysis to examine the relationship between three quantitative variables and develop a reliable equation for making predictions regarding the dimensions of the structural elements or their arrangement in the roof structure. The variables considered are:
- ○
Independent variables Span and Snow and dependent variable Cost;
- ○
Independent variables Span and Snow and dependent variable Sp.
Multiple ANCOVA to assess the influence of a factor on the relationship between three quantitative variables and, thus, the multiple linear regression equation employed in the predictions. The variables considered are:
- ○
Hp factor, independent variables Span and Snow and dependent variable Hb;
- ○
Hp factor, independent variables Span and Snow and dependent variable Wb;
- ○
Snow range factor, independent variables Roof length and Snow, and dependent variable Nb.
In order to carry out the statistical analysis, some of the aforementioned variables had to be transformed to correct their asymmetric distribution and, thus, obtain a normal distribution:
Cost: the value of this variable was raised to the power of 0.32;
Hb: the value of this variable was raised to the power of 0.28;
Wb: the value of this variable was raised to the power of 0.2;
Sp: the snow load was divided by Sp and the result was raised to the power of 0.2.
3. Results and Discussion
A preliminary analysis was conducted to assess the load combinations on the structure. It was found that the sum of permanent, snow and wind pressure loads was the most unfavorable combination. Moreover, it was noticed that the snow load had a significant impact on the results. Thus, to capture a wider range, it was studied from 0.5 to 2.0 kN/m2, with increments of 0.1 kN/m2. Conversely, it was observed that the wind pressure load did not vary with the height of the beams, as the results showed no significant differences. Therefore, a fixed value of 0.07 kN/m2 was set for the wind pressure load.
The following sections provide the detailed results of the statistical analysis conducted on the optimal individuals arising from the structural calculation and the optimization by genetic algorithms. It is worth noting that the roof length showed no correlation with the height (R2 = 0.050) or the width (R2 = −0.080) of the beams, nor with the height and width of the purlins (R2 = 0.000) or the spacing between them (R2 = −0.067). Therefore, a total of 208 optimal individuals was considered by combining 13 possible values for span and 16 possible values for snow load at a fixed roof length of 45 m to propose some equations that predict the dimensions of beams and purlins, as well as the purlin arrangement in the roof structure, based on known values of the span and the geographical location of the construction site (i.e., the specific snow load to be contemplated). Furthermore, the roof length was considered at 30 m, 45 m, 60 m and 75 m for the assessment of the optimal number of beams, depending on the specific snow load.
3.1. Relationship between the Cost of the Structure, Snow Load and Span
The correlation coefficient R has a value of one, which indicates a perfect linear dependence between the variables (
Table 1). This finding supports reliable predictions through the proposed multiple regression model of the optimal cost of the roof based on the values of Span and Snow. The coefficient of determination R
2 = 0.999 further suggests that 99.9% of the variability in optimal cost can be explained by the variability in Span and Snow. In addition, when its value is almost 1, it indicates that there is an almost perfect linear fit between the three variables.
Table 2 shows the values of the linear correlation and determination coefficients, the test value, and the
p-value that corroborate the good linear fit between the three variables. The data did not differ significantly from the normal distribution (Shapiro–Wilk 0.994,
p > 0.05). The slope of the plane is significantly different from 0, since the values of the
t-test for Snow, Span, and the combination of Snow and Span are −12.4 (
p < 0.001), 98.2 (
p < 0.001), 48.8 (
p < 0.001), respectively.
From the coefficients of the multiple regression shown in
Table 2, the Equation (20) is proposed to predict the cost of the timber roof structure:
where: Cost is the structure investment (EUR), Snow is the applicable snow load (kN/m
2) and Span is the full dimension of the regular double-tapered beam (m).
Figure 4 displays the resulting plane of the multiple regression for the Snow, Span, and Cost variables. The increasing slope of the plane suggests that an increase in the snow load and span results in a corresponding increase in the cost of the structure. This observation is expected since as the snow load and span increase, the size of the structural elements also increases, thereby increasing the total mass of timber used.
In this regard, to determine the volume of the glulam employed in the roof structure instead of calculating the cost at a price of 900 EUR/m
3, Equation (21) should be considered:
where Volume is the amount of glued laminated timber (m
3), Snow is the applicable snow load (kN/m
2) and Span is the full dimension of the regular double-tapered beam (m).
The equations reveal that when the span of the roof is held constant, an increase of 0.1 kN/m2 in snow load results in a 2.6% to 4.4% increase in the optimal cost or volume for the 15 m and 30 m spans, respectively. Additionally, when the snow load is held constant, a 1 m increase in roof span leads to a 9.5% to 11.6% increase in optimal cost or volume for snow loads of 0.5 kN/m2 and 2 kN/m2, respectively.
Upon comparing the cost curves, it is evident that, similar to Jelušič [
31], raising the cost to the exponent of 0.32 results in a linearized outcome. Moreover, in order to allow for comparison, the developed model was adapted to the 14 m span regular double-tapered GL24h beam studied by Baranski et al. [
32]. Similar optimization values (Hb = 640 mm) were obtained, with the exception of the beam width, which was found to be 150 mm rather than 200 mm. The authors [
32] established that during the optimization process, the maximum beam height could be 10 times its width. However, the results produced by the genetic algorithms in the present study also meet this criterion. Therefore, the optimal beam width for that particular configuration could be reduced by 25%.
3.2. Relationship between the Purlin Height, Beam Height, Snow Load and Span
The ANCOVA model presented in
Table 3 indicates that the variables Span and Snow, as well as the factor Hp, independently have a significant effect on the variable Hb (
p < 0.05). Furthermore, the factor Hp in combination with the variable Span (F (1.202) =10.7,
p < 0.05), and the variable Snow with the variable Span (F (1.202) =14.4,
p < 0.05), were found to significantly affect the variable Hb. These results demonstrate that the relationship between the variables is a model with interaction. It is worth noting that the data did not exhibit heteroscedasticity, and there were no significant deviations from the normal distribution (Levene’s test: 6.58 × 10
−4,
p > 0.05; Shapiro–Wilk test: 0.994,
p > 0.05).
Table 4 presents the estimates of the effects of Snow, Span and Hp on Hb. Snow and Span are the independent variables, and their relationship with Hb determines the slope of the plane. In this case, the coefficients of Snow (1.0755 mm·m
2/kN), Span (0.0946 mm/m for Hp = 160 mm and 0.0703 mm/m for Hp = 200 mm) and their product (−0.0304 mm·m/kN) determine the slope of the plane. The positive values of the higher coefficients indicate that as the snow load and span increase, the height of the beam also increases.
Figure 5 displays the multiple regression plot of Snow, Span and Hb as a function of Hp. The figure provides evidence that the model of the relationship between the variables is a model with interaction.
To determine the optimal value of Hb based on Snow, Span and Hp values, multiple regression planes were constructed using Equation (22).
where Hp is the height of the purlin (mm), Hb is the height of the beam (mm), Snow is the applicable snow load (kN/m
2), Span is the full dimension of the regular double-tapered beam (m) and ε = ±0.0161.
The equations indicate that as the span of the beam increases by 1.2 m (for Hp = 160 mm) or 1.5 m (for Hp = 200 mm), and the snow load increases by 0.2 kN/m2, the beam height increases by 40 mm, which is equivalent to the addition of one timber laminate to its composition.
3.3. Relationship between the Purlin Height, Beam Width, Snow Load and Span
Table 5 shows the ANCOVA results, which indicate that the variable Snow and the Hp factor, independently, have a significant effect on the variable Wb (
p < 0.05). Additionally, the combined effects of the Hp factor and Snow variable (F (1.202) = 12.498,
p < 0.05), Snow and Span (F (1.202) = 1013.022,
p < 0.05), as well as the Hp factor with the Span and Snow variables (F (1.202) = 115.553,
p < 0.05), significantly affect variable Wb. This suggests that the relationship between the variables is that of a model with interaction. There was no heteroscedasticity or significant deviation from the normal distribution (Levene’s test,
p > 0.05 and Shapiro–Wilk test,
p > 0.05).
Table 6 displays the estimates of Snow, Span and Hp effects on Wb. Snow and Span are independent variables, and their relationship with Wb determines the slope of the plane. The Snow coefficient (−0.121 mm·m
2/kN for Hp = 160 mm and −0.182 mm·m
2/kN for Hp = 200 mm) and the coefficient of the product of Span and Snow (0.008 mm·m/kN for Hp = 160 mm and 0.013 mm·m/kN for Hp = 200 mm) determine the plane’s slope in this case.
Figure 6 displays the multiple regression plot of Snow, Span and Wb as a function of Hp. The figure provides evidence that the model of the relationship between the variables is a model with interaction.
To determine the optimal value of Wb based on the Snow, Span and Hp values, multiple regression planes were constructed using Equation (23).
where Hp is the height of the purlin (mm), Wb is the width of the beam (mm) with a minimum value of 90 mm, Snow is the applicable snow load (kN/m
2) and Span is the full dimension of the regular double-tapered beam (m).
An analysis of the data suggests that when the purlin height is 160 mm, the optimal beam width is roughly 90 mm, except for spans between 26 and 30 m, where it increases to 100–110 mm. On the other hand, when the purlin height is 200 mm, the optimal beam width is 90–100 mm for 15–20 m spans, 110–120 mm for 20–25 m spans and 130–160 mm for 25–30 m spans.
3.4. Purlin Height Depending on the Snow Load Intervals
Table 7 and
Figure 7 present the number of data points for each value of purlin height as a function of two snow load ranges. When the snow load falls between 0.5 and 1.4 kN/m
2, the optimal purlin height is 160 mm. Conversely, when the snow load is between 1.4 and 2.0 kN/m
2, the optimal purlin height is 200 mm. These findings align with those of Villar-García et al. [
29], as it is observed that the purlin height is based on a minimum height of 160 mm, which is equivalent to four timber sheets of 40 mm.
3.5. Purlin Width
Based on the models, the width of the purlins does not vary with increasing span and snow load. The optimum value is found at a minimum of 90 mm. It has been proven that the optimal width of the purlins only increases when the snow loads are very high, but these are cases that do not conform to reality. The optimum value for the width of the purlins is in line with the one reported by Villar-Garcia et al. [
29].
3.6. Relationship between the Purlin Height and Spacing, Snow Load and Span
The relationship between Snow, Span and Sp has only been studied for Hp = 160 mm, since when purlin height is 200 mm the separation between them reaches the maximum allowed (1.25 m) and does not vary as a function of the snow load or the span. As the correlation coefficient R has a value of 0.986, it indicates a strong linear dependence between Sp, Snow and Span (
Table 8). Therefore, the proposed multiple linear regression model can be used to make reliable predictions of purlin spacing for given values of the snow load and span. The coefficient of determination R
2 = 0.972 indicates that 97.2% of the variability in the optimal cost can be explained by the variability in Snow and Span, since a value approaching unity indicates a good linear fit between the three variables.
Table 9 shows the values of the linear correlation coefficients and coefficients of determination, the test value and the
p-value that confirm the strong linear fit between the three variables. The data did not deviate significantly from the normal distribution (Shapiro–Wilk 0.981,
p > 0.05). Furthermore, the slope of the plane is significantly different from zero, as indicated by the
t-test for Snow and Span, which are 62.219 (
p < 0.001) and 4.209 (
p < 0.001), respectively.
Figure 8 displays the multiple linear regression of the relationship between the purlin spacing, snow load and span for roof structures comprising purlins with a 160 mm height.
Based on the coefficients of the multiple regression shown in
Table 9, Equation (24) is proposed to determine the purlin spacing depending on the specific height of the structural element:
where Hp is the height of the purlin (mm), Sp is the purlin spacing (m), Snow is the applicable snow load (kN/m
2) and Span is the full dimension of the regular double-tapered beam (m).
To the authors’ best knowledge, only one previous investigation [
29] has considered the purlins in the optimization of a timber roof structure. This limited body of research highlights the relevance of the present investigation but significantly limits the discussion of the findings obtained in this research work. For purlins with a height of 160 mm, a value between 1.0 and 1.25 m is generally observed as optimal. Conversely, for purlins with a height of 200 mm, the optimum spacing is 1.25 m. These findings align with those reported by Villar-García et al. [
29], who reported the optimal purlin spacing at the maximum allowable spacing.
3.7. Number of Beams Depending on the Roof Length and Snow Load Intervals
For an analysis at a fixed roof length of 45 m,
Table 10 shows the data count for each value of beam spacing as a function of snow load intervals, which is also illustrated in
Figure 9.
Since the beam spacing is constrained by the length of the roof, the variable was considered in order to assess the optimal number of beams, which was studied for 30 m, 45 m, 60 m and 75 m roof length values. The ANCOVA model presented in
Table 11 indicates that, independently, the variable Roof length as well as the factor Snow range have a significant effect on Nb (
p < 0.05). Moreover, the factor Snow range in combination with the variables Roof length and Snow (F (1.59) =37.876,
p < 0.05) was also found to significantly affect the variable Nb. These results demonstrate that the relationship between the variables is a model with interaction. It is worth noting that the data did not exhibit heteroscedasticity, and there were no significant deviations from the normal distribution (Levene’s test: 0.212,
p > 0.05; Shapiro–Wilk test: 0.992,
p > 0.05).
The optimum beam separation ranges from 4.1 m to 5.6 m for the different snow load ranges. It is observed that, as the snow load increases, beam spacing decreases, with the exception of the interval [1.4, 1.6], in which the separation increases up to 4.5 m. As studied in
Section 3.4, the purlin height increases from 160 to 200 mm at snow loads of 1.4 kN/m
2, which allows for a greater beam separation up to snow loads of 1.6 kN/m
2. In 81.3% of cases, beam separation is either 4.1 or 4.5 m, similar values to those usually used in practice as well as those obtained in the truss optimization in [
29].
Table 12 presents the estimates of the effects of Roof length, Snow range and Snow on Nb. The relationship of Roof length and Snow with Nb determines the slope of the plane.
To determine the optimal value of Nb based on Roof length, Snow range and Snow, multiple regression planes were constructed using Equation (25).
where Snow range is the load interval considered (kN/m
2), Nb is the number of beams, Roof length is the full dimension of the structure (m) and Snow is the applicable snow load (kN/m
2).


 ,
, 


