Article

Local Thickness Optimization of Functionally Graded Lattice Structures in Compression

Faculty of Science, Technology and Medicine, University of Luxembourg, L-1359 Luxembourg, Luxembourg
*
Author to whom correspondence should be addressed.
Appl. Sci. 2023, 13(23), 12969; https://doi.org/10.3390/app132312969
Submission received: 23 October 2023 / Revised: 23 November 2023 / Accepted: 4 December 2023 / Published: 4 December 2023
(This article belongs to the Special Issue Structural Optimization Methods and Applications)

Abstract

:
This paper presents a new method for optimizing the thickness distribution of a functionally graded lattice structure. It links the thickness of discrete lattice regions via mathematical functions, reducing the required number of optimization variables while being applicable to highly nonlinear models and arbitrary optimization goals. This study demonstrates the method’s functionality by altering the local thickness of a lattice structure in compression, optimizing the structure’s specific energy absorption at constant weight. The simulation results suggest significant improvement potential for the investigated Simple Cubic lattice, but less so for the Isotruss variant. The energy absorption levels of the physical test results closely agree with the simulations; however, great care must be taken to accurately capture material and geometry deviations stemming from the manufacturing process. The proposed method can be applied to other lattice structures or goals and could be useful in a wide range of applications where the optimization of lightweight and high-performance structures is required.

1. Introduction

1.1. Functionally Graded Lattice Structures

The constant need for greater sustainability in production environments and the minimisation of resource usage has forced researchers and manufacturers to explore new design approaches. One of the resulting concepts is structures containing locally varying properties of their structure, for instance, their material composition [1]. These so-called functionally graded materials (FGMs) are designed such that their thermal, structural, vibrational, or other functions can be controlled or optimized. Common applications of FGMs are found in thermal insulation tasks involving metal–ceramic composite materials [2], for example, to improve the heat insulation of bolted joints [3]. A subcategory of FGMs is functionally graded lattice structures (FGLSs), which are macroscopic cellular structures containing a locally varying porosity gradient as a function of external factors such as stress or temperature. Their concept stems from structures that can commonly be found in nature [4], where the available material is intended to be optimally distributed, minimizing resource usage. The use of and research on FGLSs has been greatly accelerated by additive manufacturing (AM) since it readily allows for the production of such intricate designs.
Cellular structures are characterized by the porous composition of cells enclosed by edges or walls, and their exterior dimensions can cover relatively large spans while being lightweight at the same time. Naturally occurring cellular structures have evolved to fulfil various functions such as filtering, insulation, fluid transportation, load-carrying, weight reduction, and other tasks that are equally relevant for numerous engineering applications. They can be composed of vastly different materials and are found on several length scales, such as corals, honeycombs, sponges, cork, wood, and cancellous bone. In industrial settings, artificial cellular structures find use as filters, thermal or sound insulators, lightweight load-bearing elements, or protective liners for a wide variety of tasks.
Cellular structures are categorized according to their three-dimensional composition, regularity, and unit cell type. Planar cellular structures are generally referred to as honeycombs even if they do not contain the characteristic hexagonal pattern known from beehives. Three-dimensional structures characterized by a stochastic distribution of cell walls and sizes composed of open or closed polyhedra are categorized as foams. On the other hand, non-stochastic (i.e., regular, repeating) three-dimensional structures are classified as lattices. The smallest repeating entity of a lattice is the unit cell, which can be composed of struts or surfaces. Strut-based (also called graph-based) unit cells are categorized into bending-dominated and stretching-dominated types depending on their connectivity state at the corner nodes. Surface-based unit cells are divided into three-dimensional honeycombs and triply periodic minimal surface (TPMS) cells. TPMS lattices possess the useful property of dividing the occupied space into two separate volumes, rendering them especially suited for use as heat exchangers.
Lattice structures behave much like expanded foam materials under compressive loads. Their performance during the compressive phase is strongly influenced by the relative density, ρ r e l = ρ / ρ s , where ρ is the apparent density of the cellular structure as determined by its external volume and total mass, and ρ s is the density of the base material. A structure’s porosity is, therefore, defined as 1 ρ r e l . Structures with a relative density of less than 30% are considered to be cellular, whereas they are considered to behave more like solids with isolated pores above this threshold [5]. In compression, foams exhibit an initially linear elastic regime wherein the response is governed by cell wall bending or stretching, depending on the cell morphology. The initial part of the stress–strain curve is the linear elastic phase; its derivative is defined as the apparent Young’s modulus, E . It is followed by a long collapse plateau at nearly constant (in the case of elastic–plastic materials) or slowly rising (in the case of elastomeric materials) stress until full densification is reached. Elastic–brittle materials cause a sharp stress decrease after the linear regime; the plateau is characterized by stress fluctuations caused by the successive brittle failure of the cells. Ductile materials show a smoother transition after the linear elastic regime with few or no fluctuations in the plateau phase. Both brittle and ductile material types may show successive layer collapses during the plateau phase, which is recognizable by its large, low-frequency force fluctuations. The long progression of the plateau phase permits large kinetic energy absorption potential that renders foams and lattice structures well suited for use as protection devices for sensitive electronics, wearable padding for sports purposes, etc. Lastly, densification is reached at the end of the plateau regime when opposing cell walls come into contact. The compressive response is then governed by the properties of the base material.
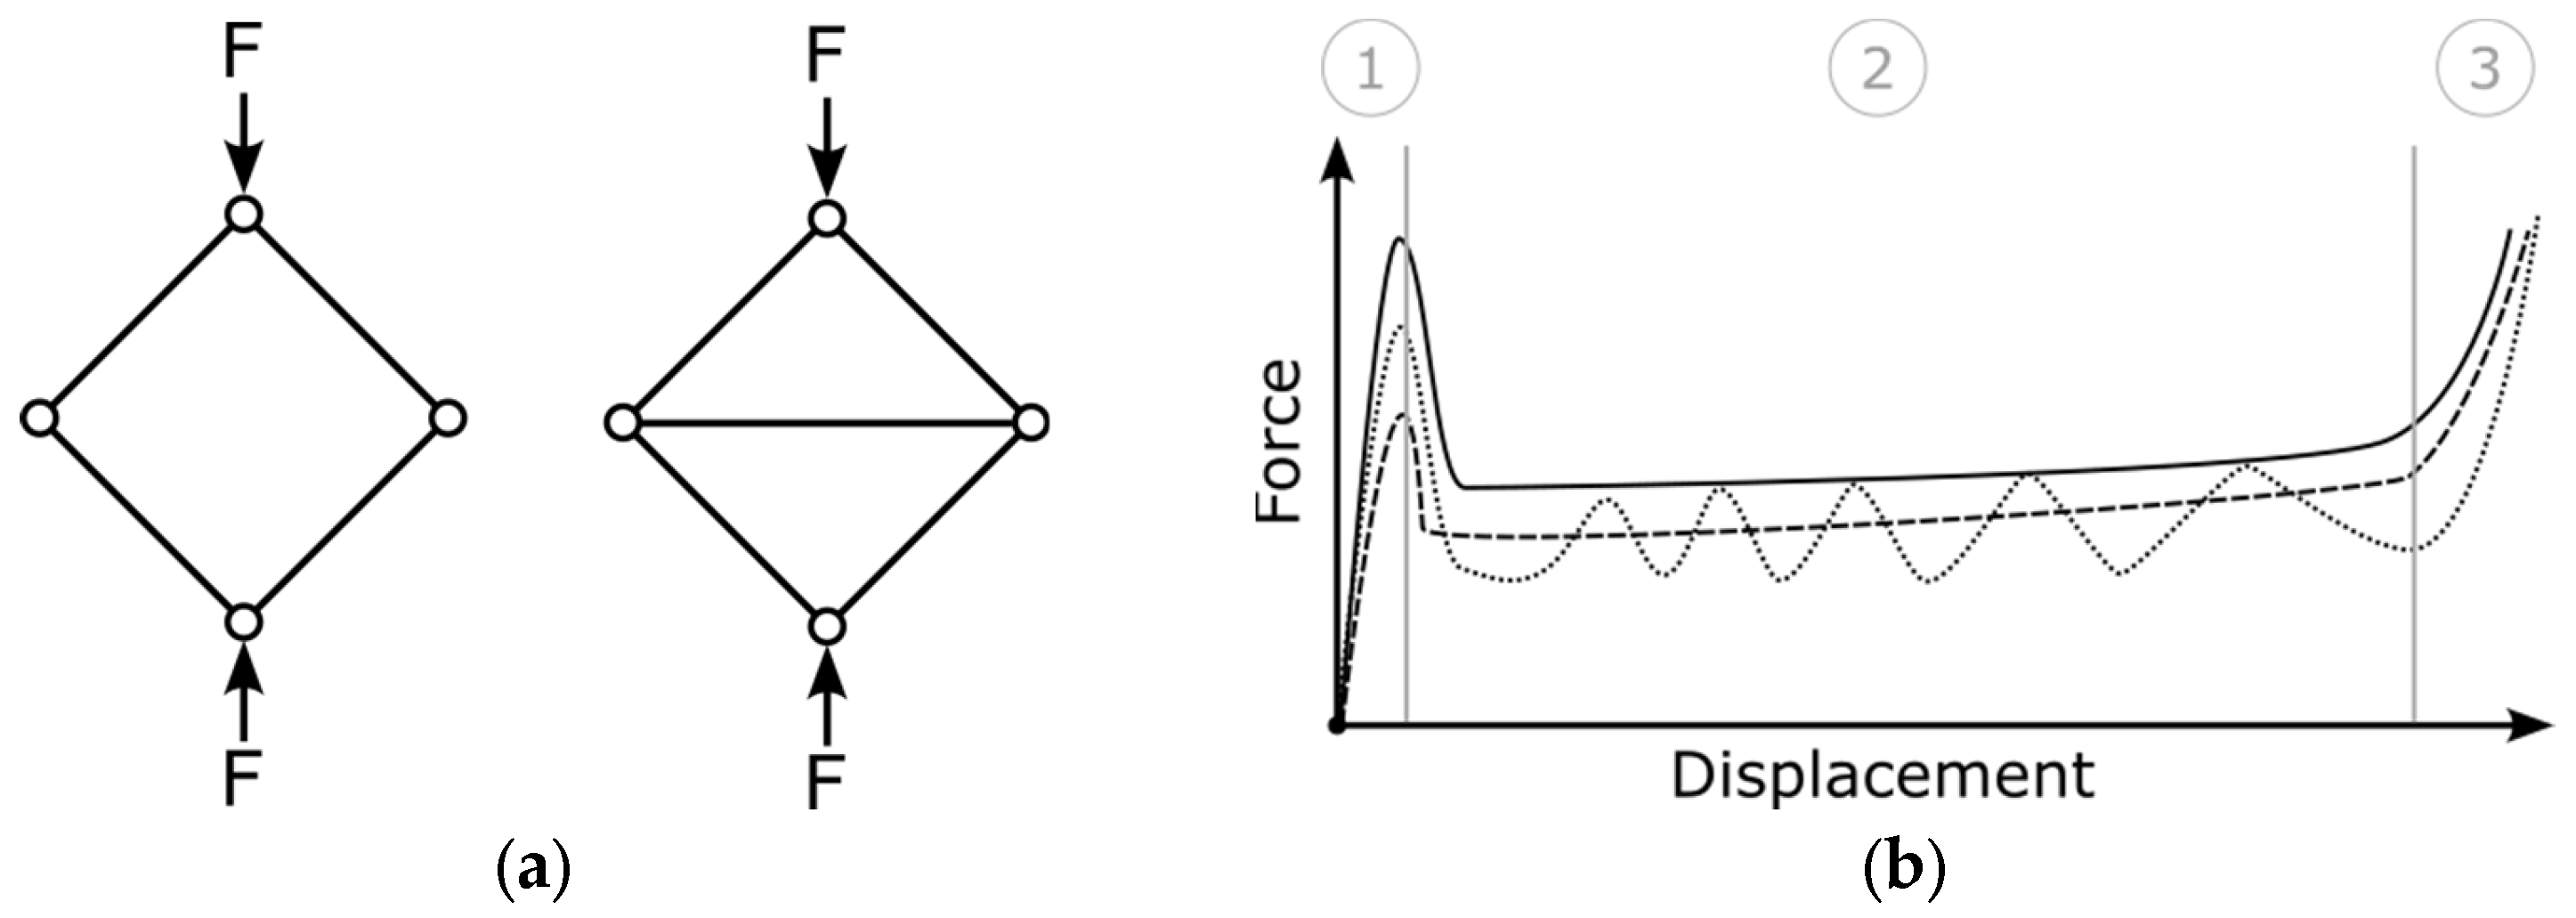
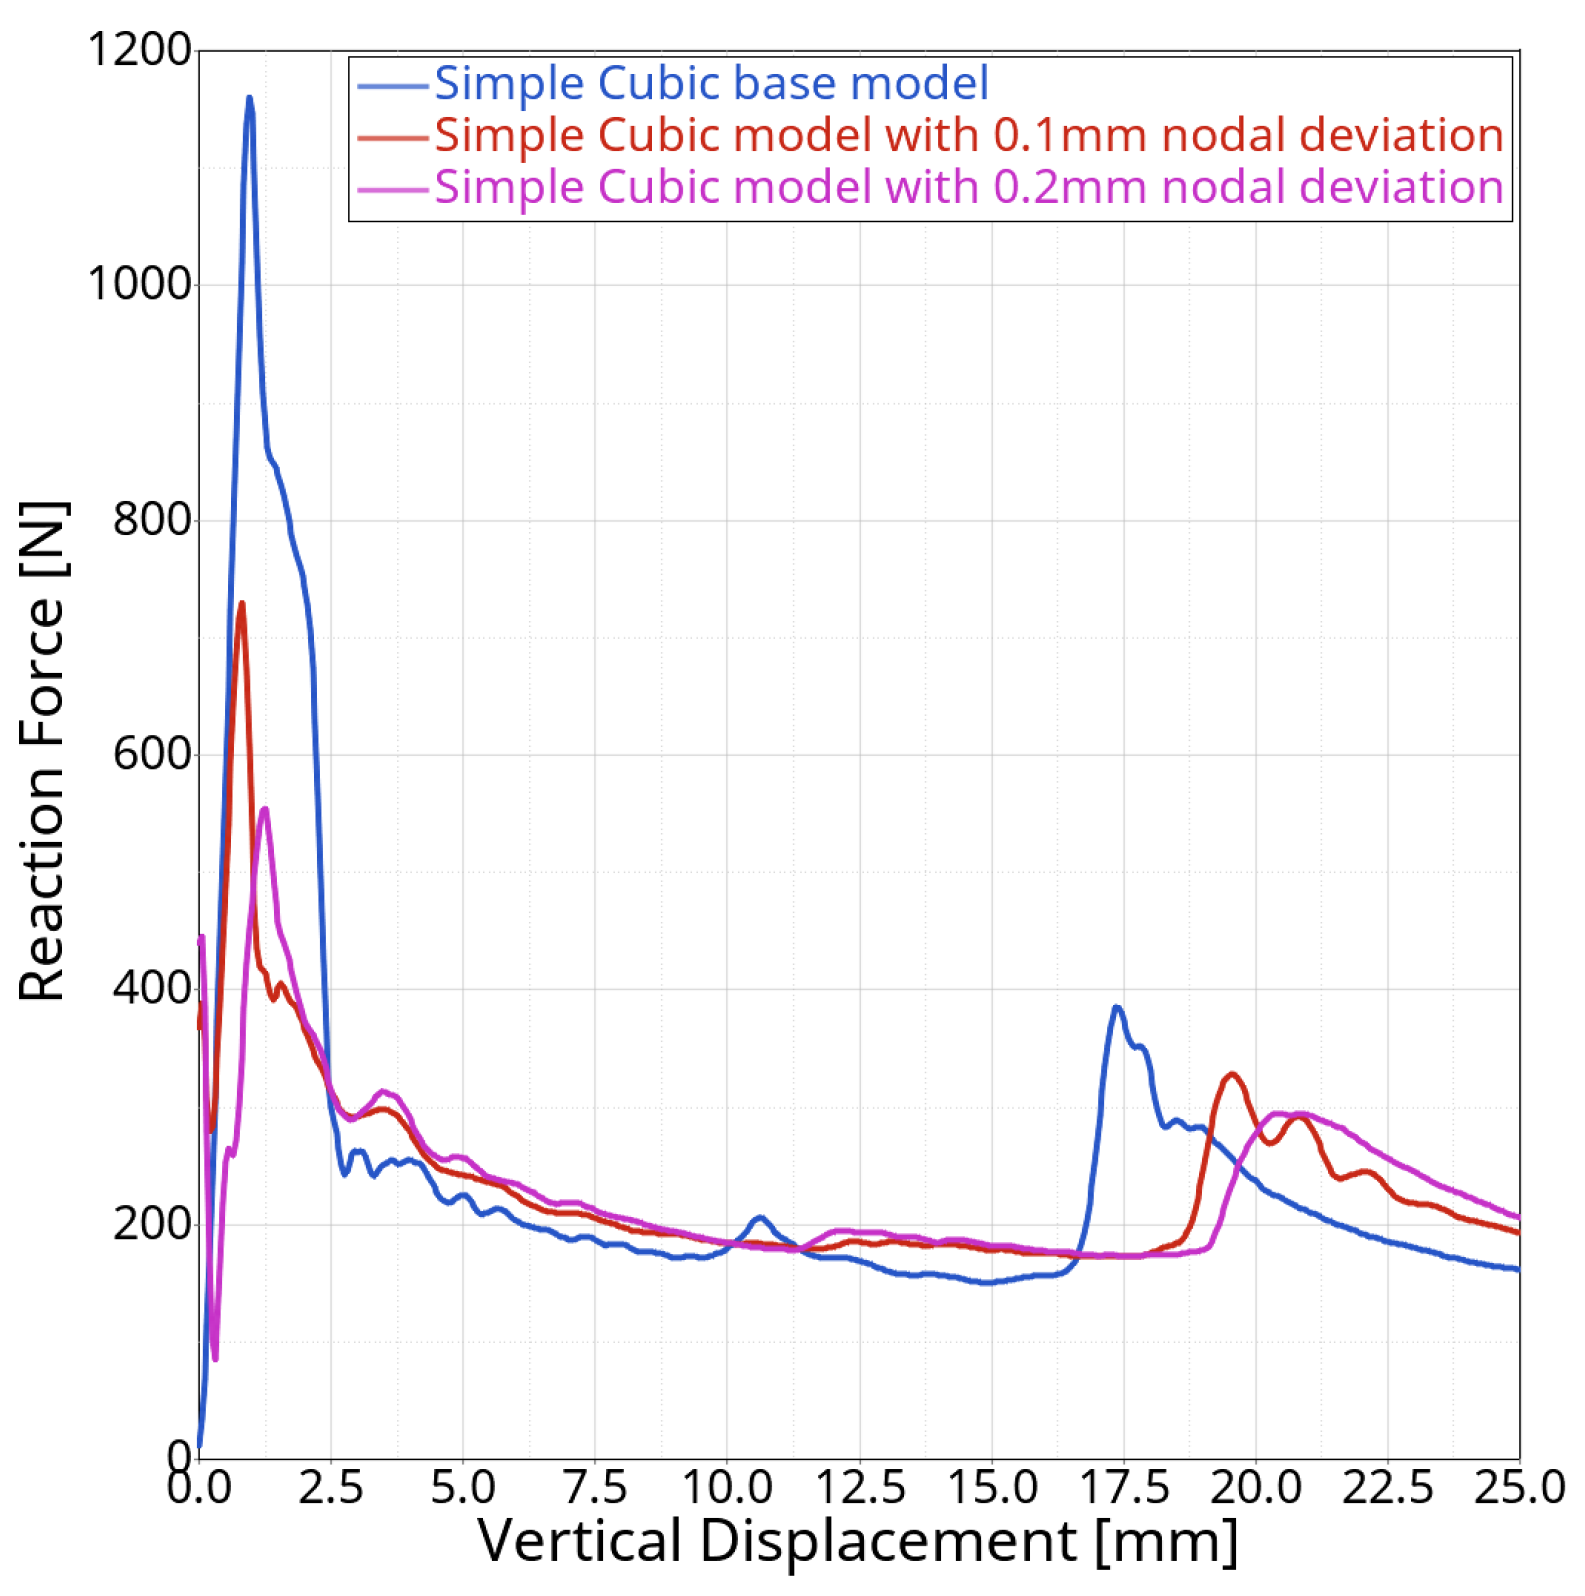
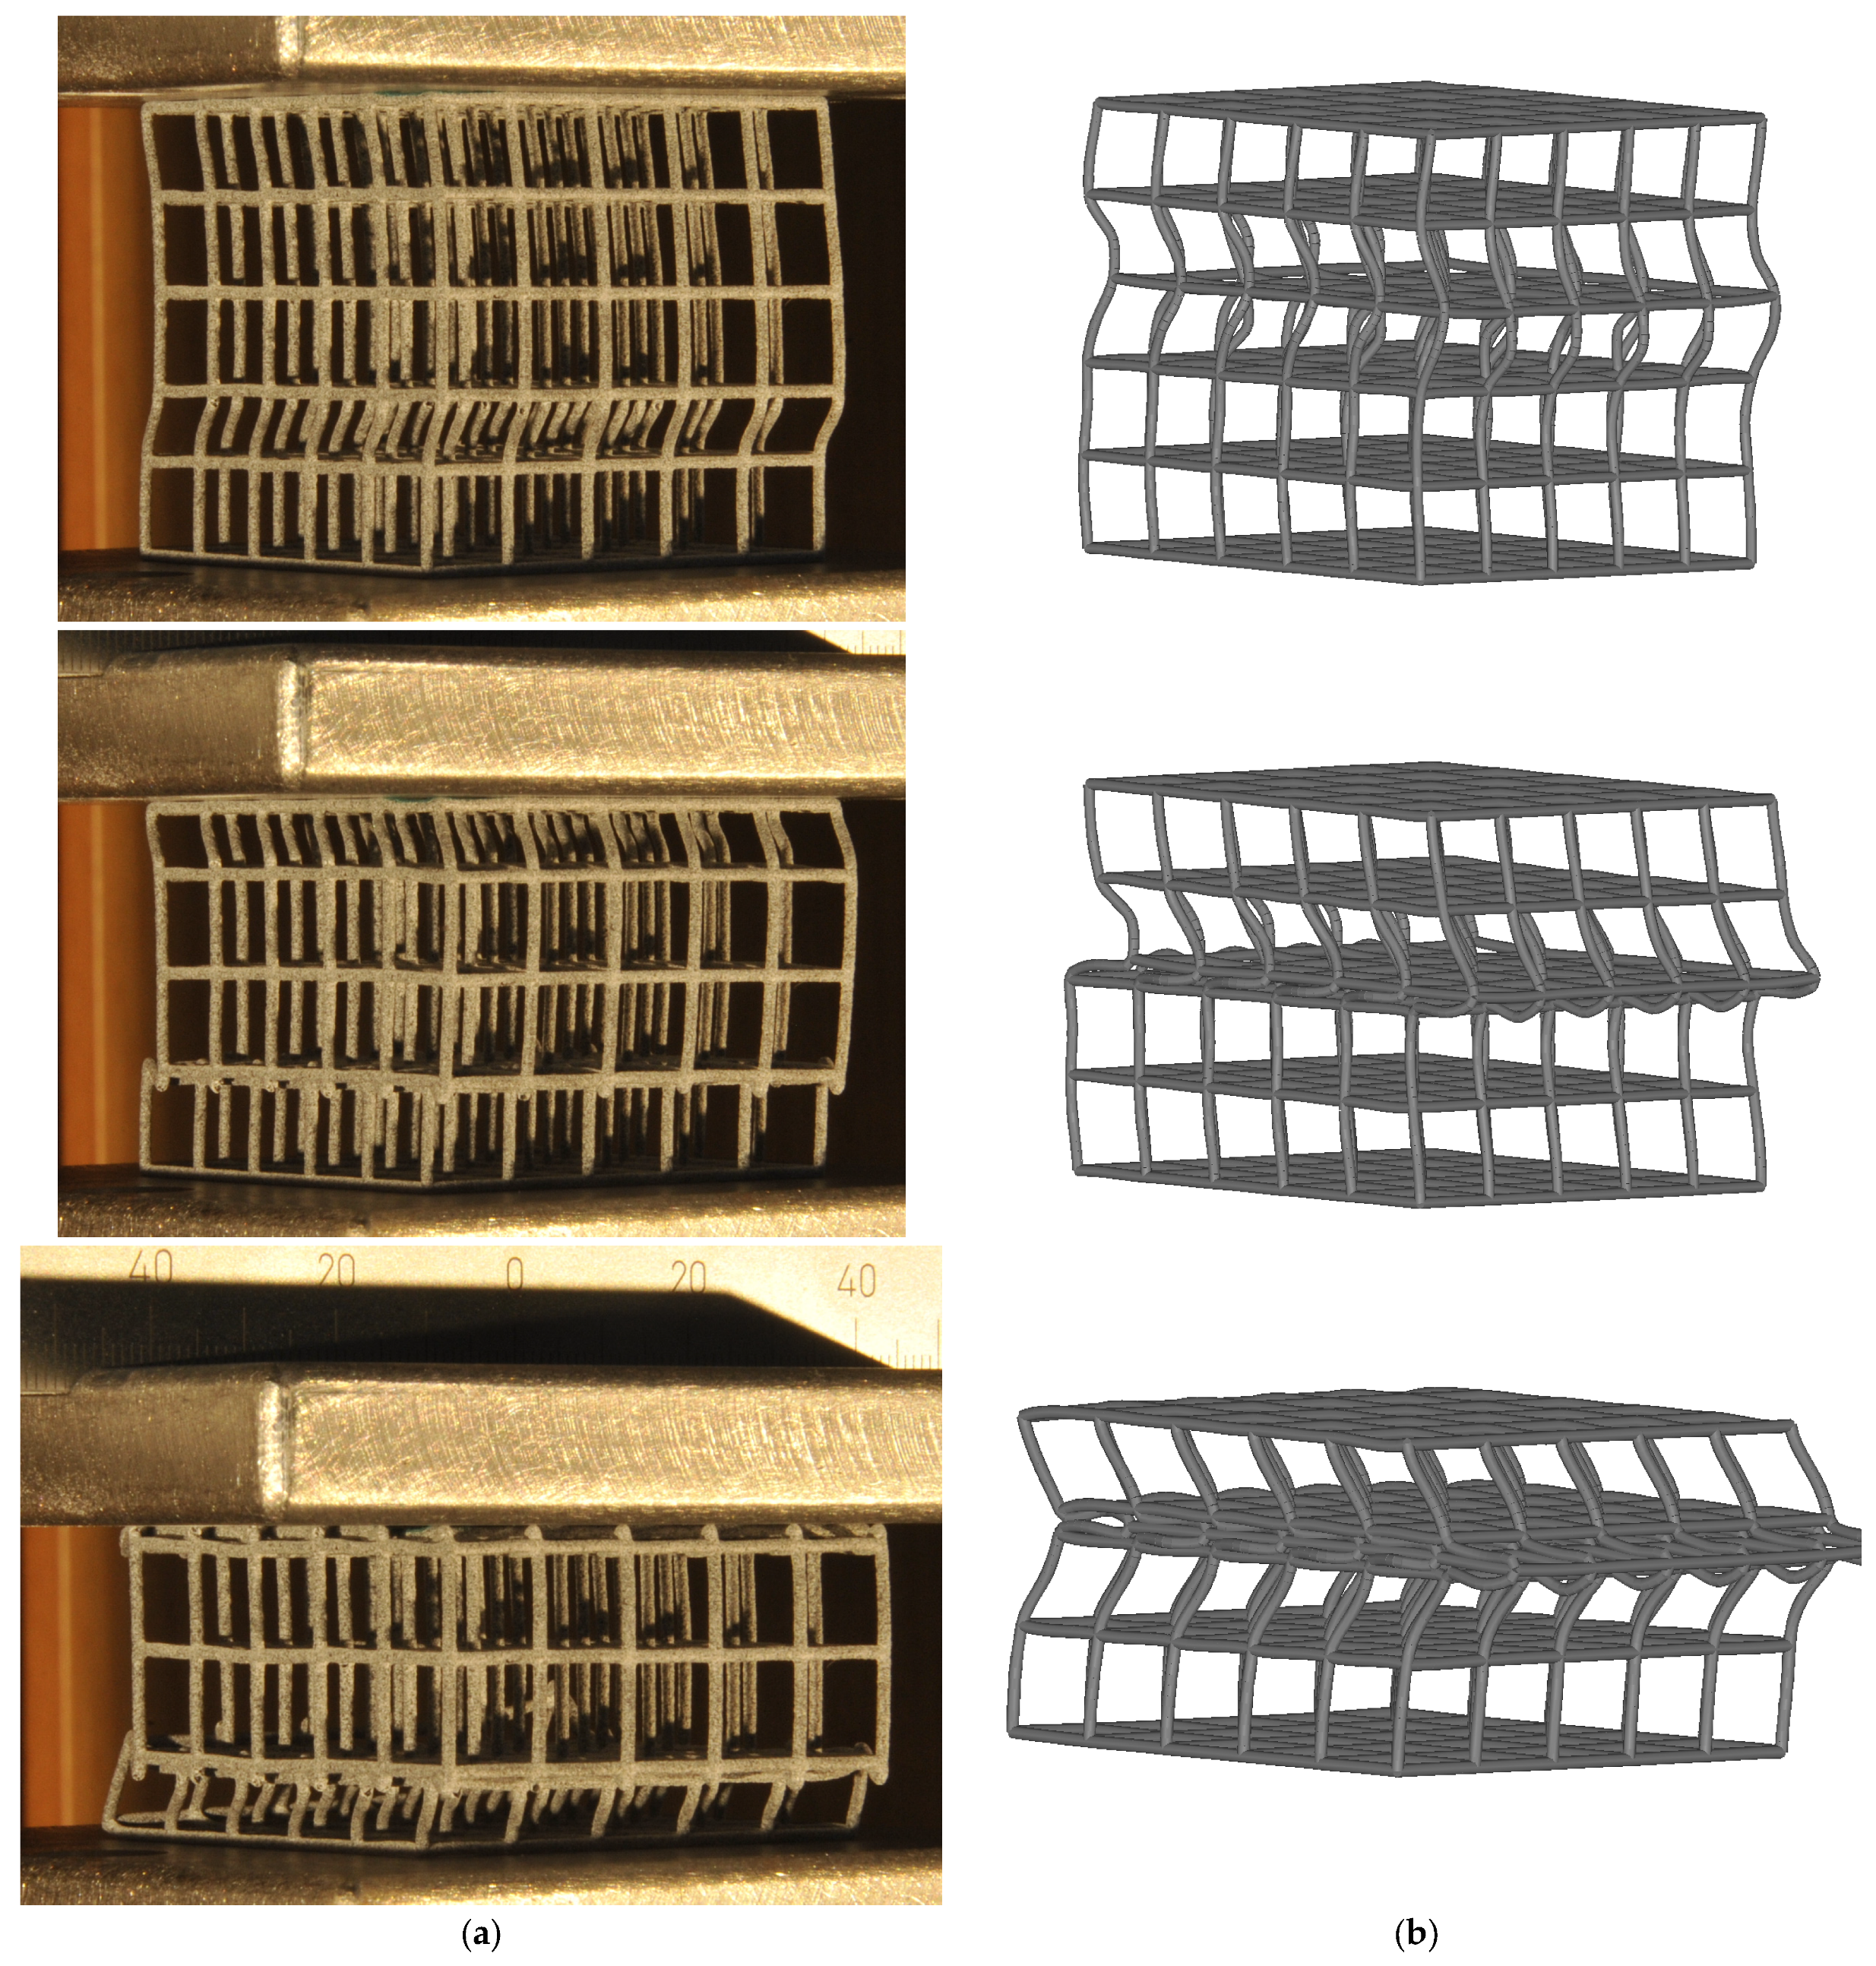
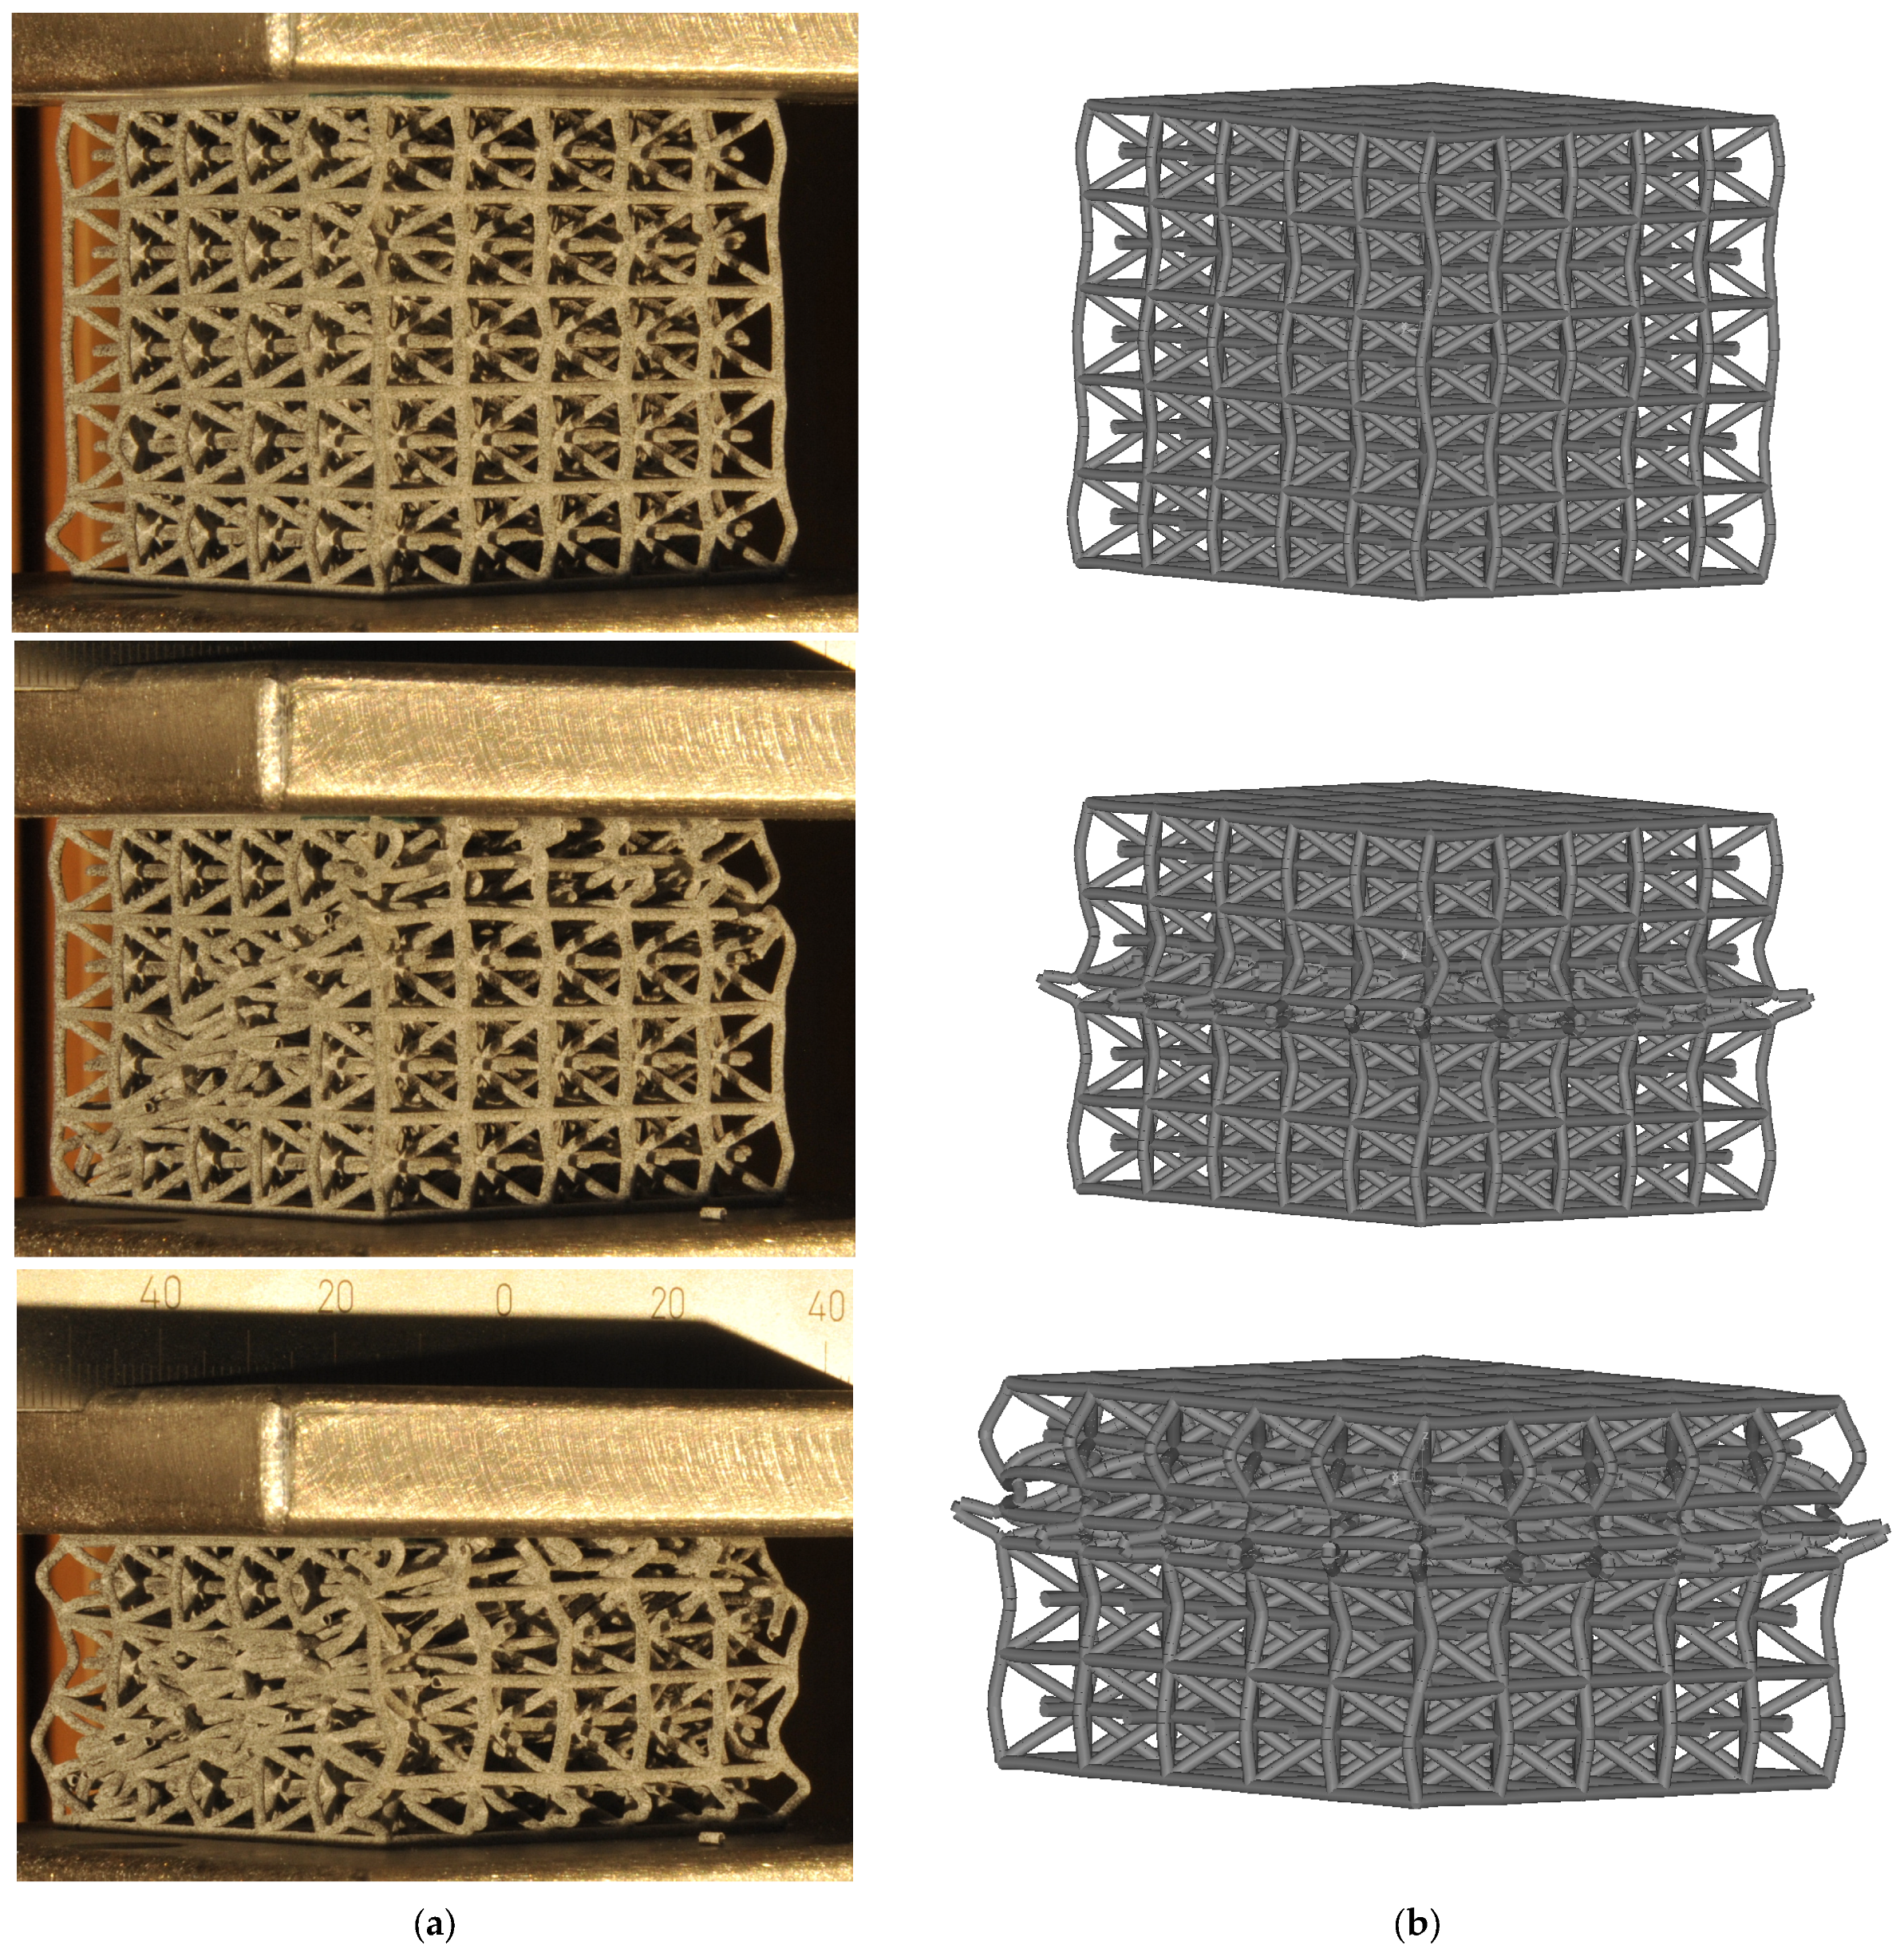
Lattice structures share the described characteristics with foamed materials; however, the lattice’s unit cell category can further influence their compressive response in different manners. Bending-dominated unit cell types (see 
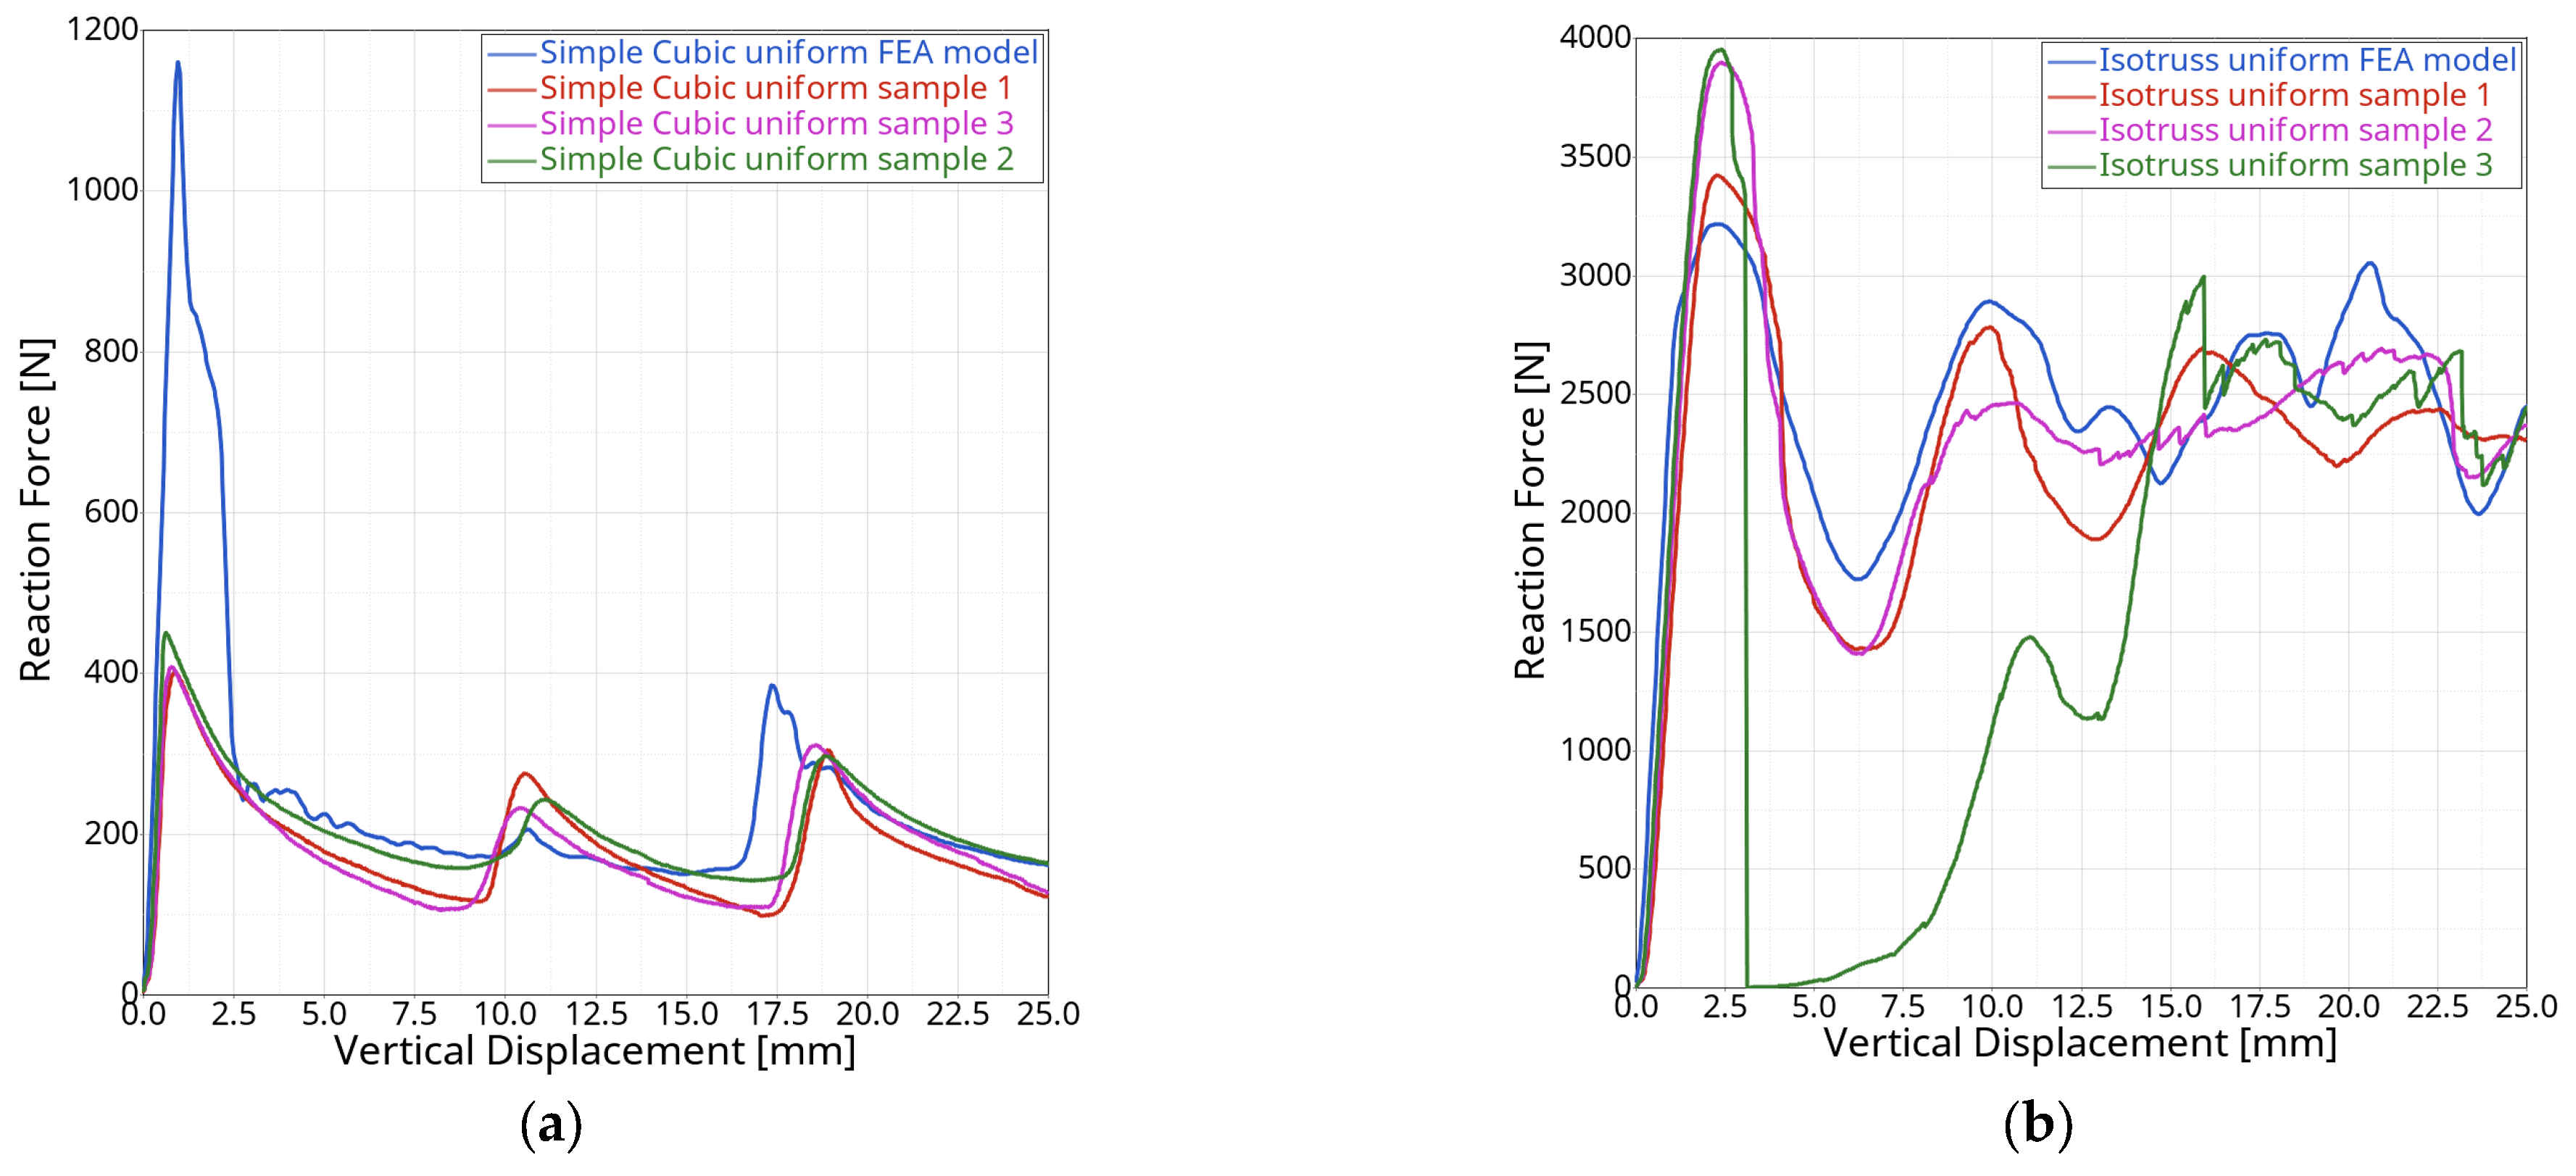
Figure 1a) collapse early on because of the formation of compliant plastic hinges, causing a relatively smooth transition to the plateau regime (Figure 1b). On the other hand, stretching-dominated types yield later and more abruptly because of rupturing or buckling struts, causing a higher force peak at the end of the linear elastic regime and a sharp drop to the plateau regime stress level. The lattice categories are further subdivided into many different cell types such as the Simple Cubic (SC) cell, Face-Centred Cubic, Body-Centred Cubic, Fluorite, Diamond, Kelvin, Re-entrant, Weaire–Phelan, and combinations or alterations thereof. Although the unit cell type evidently influences the structural response of a lattice, its impact is noticeably smaller compared with the choice of base material, relative density, and unit cell category.
Lattice structures can be readily adapted to improve their performance or to specifically tailor them as needed. Such modifications can include strut thickness optimizations [6], bidirectional cell size grading [7], unit cells designed via topology optimization [8], combinations of differing unit cell sizes in honeycombs [9], unit cell type and orientation changes mimicking crystal grain structures [10], corner node movements allowing lattice struts to follow principal stresses [11], combining unit cell types [12], related methods such as using topology optimization with certain constraints to achieve fine lattice-like structures [13], and many others.

1.2. Functionally Graded Lattice Structures Incorporating a Thickness Gradient under Compressive Loads

An easily controlled grading variable is the thickness of strut-based lattices while the cell type and size are kept constant. Several publications have considered the thickness-grading styles of lattices in quasi-static or dynamic compressive load cases and noted potential performance improvements compared with uniform lattices of the same relative density. Niknam et al. [14] studied six different lattice types at 50% porosity made of Formlabs Elastic 50 A resin in quasi-static compression, comparing them with four linearly varying thickness distributions along a single axis. The lattices were loaded along or perpendicular to the gradient direction to assess potential differences. They concluded that the uniform lattices were mostly capable of higher stress levels and absorbing more energy than the graded lattices at low compression strains; however, this trend was reversed at higher compressive strain levels. Furthermore, applying a gradient perpendicular to the loading direction appeared to outperform a parallel gradient in most of the model configurations. The performance of lattices under compressive loads is commonly assessed via specific energy absorption (SEA), a measurement dividing the absorbed compressive energy by the structure’s mass.
Ajdari et al. [15] investigated a two-dimensional hexagonal aluminium honeycomb at 5% relative density under dynamic compression. At low speeds, the uniform configuration showed the largest energy absorption and the graded variants the lowest. During high-velocity compression, differences in behaviour start to occur at different compression stages. Up to 25% compression, a positive gradient with more mass located near the moving plate shows significantly increased energy absorption compared with the inverted gradient, while the uniform distribution’s absorption level is nearly the average of the graded lattices’ performance. At approximately 55% compression, all graded lattices have reached comparable energy absorption levels only to diverge again at higher compression levels. Between 60 and 80% compression, lattices with a negative gradient (less mass near the moving plate) show the greatest energy absorption capabilities. The same study also considered a honeycomb Voronoi lattice structure in the same load case, and similar findings were reported.
Maskery et al. [16] studied two cuboid lattice structures at a relative density of 19% made of polyamide 12 produced with a Selective Laser Sintering (SLS) machine. A constant gradient was applied to BCC and BCCz lattices (which are BCC unit cells with additional vertical struts) along the compression direction. In quasi-static compression, the uniform lattice structures exhibit long, flat plastic plateaus, whereas the graded structures show pronounced sequential layer collapses. Both types of graded structures outperformed the uniform counterparts vastly with 80% (BCC) and 114% (BCCz) higher specific energy absorption.
In a similar study by Maskery et al. [17], a BCC lattice structure made of Al-Si10-Mg produced via Selective Laser Melting (SLM) with heat treatment was tested under quasi-static compression. A relative density of 22% was set for both the uniform lattice and a linearly changing thickness distribution. The graded lattice showed a slight increase in SEA of approximately 10%. A uniform, non-heat-treated specimen failed because of shear band formation and large-scale diagonal failure in the early compression stages with 10% strain. This was accompanied by the near-total loss of load-bearing capacity until the densification stage began.
Choy et al. [18] studied two lattice structures produced with SLM using grade 23 Ti-6Al-4V in quasi-static compression. The lattices included an identical linear thickness change along the compression direction and were designed with high average relative densities of 29% for the cubic lattice and 48% for the hexagonal honeycomb lattice. The reported specific energy absorption of up to 50% strain was 40% lower for the cubic lattice and 10% higher for the hexagonal lattice. Upon rotating the lattice geometries by 90 degrees, with the thickness gradient applied to the compression direction, the graded cubic and hexagonal lattices showed increased absorption capabilities of 68% and 19% compared with the uniform lattices, respectively.
A study by Tao et al. [19] considered a TPMS lattice made of 304 L stainless steel produced with Selective Laser Melting. Five different continuous, linear thickness changes oriented along the compression direction were examined. The relative density was kept constant at approx. 56% for all specimens. The experimental verification of two thickness gradient choices showed nearly identical load–displacement curves and did not allow for a clear ordering of their specific energy absorption capabilities.
Bai et al. [20] compared a BCC lattice with uniform and nonlinearly changing thickness. Additionally, a variant with non-uniform unit cell height was considered. The specimens had an average relative density of approx. 18%, were manufactured via SLS using PA2200, and were compressed in a quasi-static manner. In a strain range of up to 55%, both the uniform lattice and the one with non-uniform cell height showed an almost linear increase in specific energy absorption, with the latter being slightly higher. The thickness-graded lattice exhibited far lower SEA during most of the compression procedure, but its SEA curve grew approx. cubically and reached a performance level almost equal to the uniform and size-graded variants at their respective final strain values.

1.3. Motivation, Aim, and Scope

Upon reviewing the studies summarized in the previous section, it becomes evident that graded lattices possess greater energy absorption potential than uniform structures with identical weights. The achievable performance improvements reported by the considered studies differ strongly because of the various combinations of grading styles, lattice types, compression speeds, materials, relative densities, and levels of compressive strain. Seemingly no study has investigated a method of finding an ideal thickness gradient through optimization for the considered load case, lattice type, and material choice. Only manually specified gradients that closely adhered to linearly changing thicknesses have been investigated. Therefore, this investigation aims to expand on previous studies and to find an optimal thickness distribution for the chosen lattice structure in a compressive load case, potentially enhancing a multitude of applications.
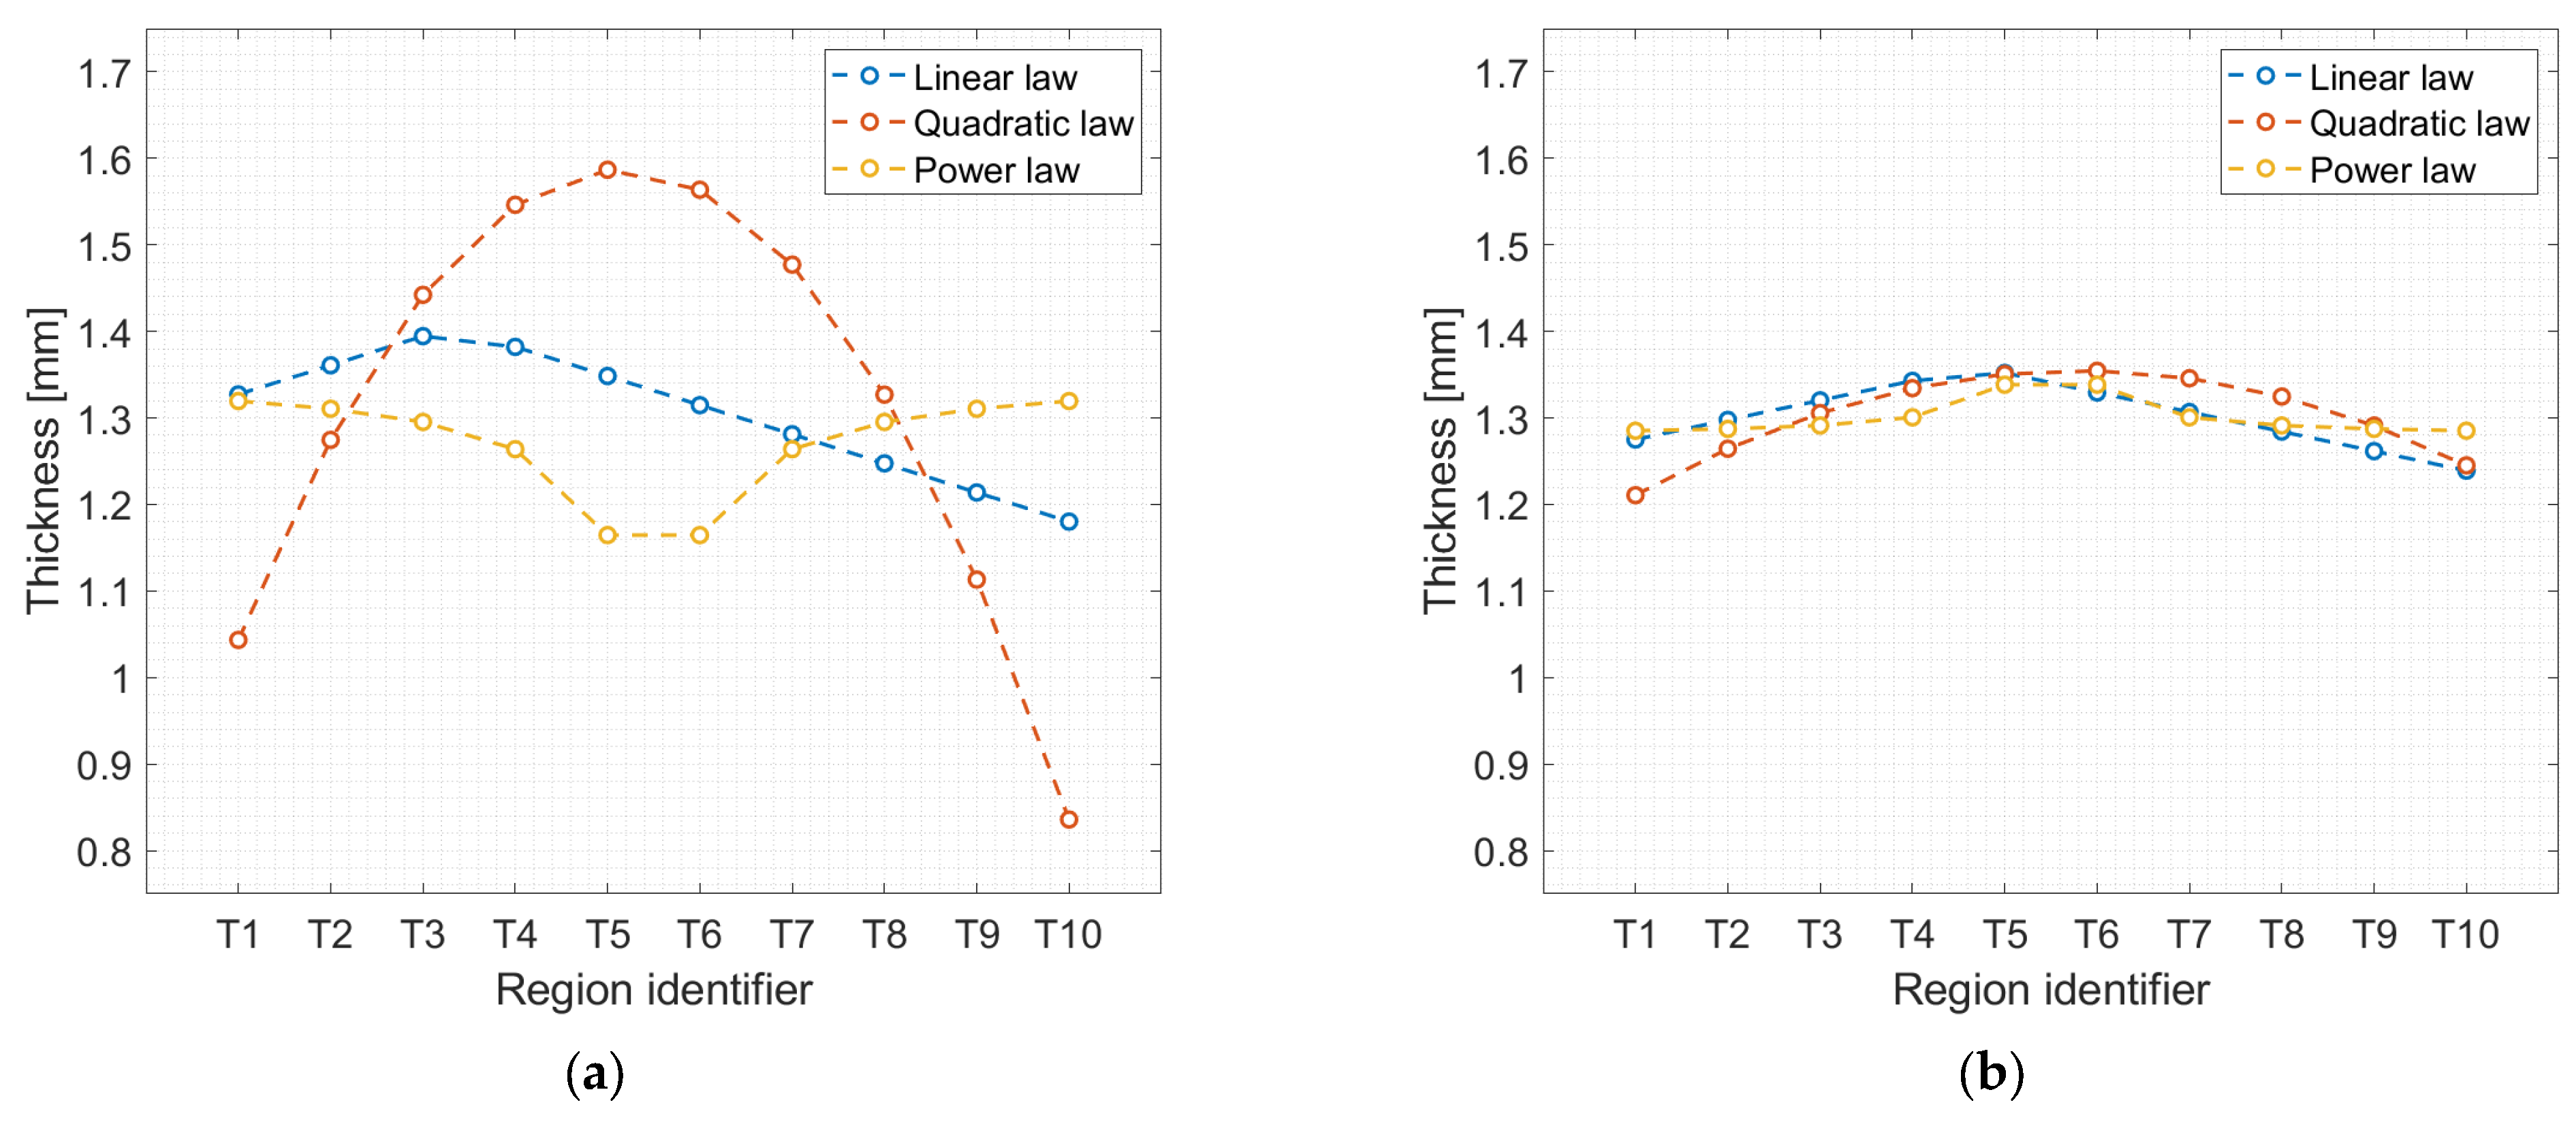
To render the proposed optimization procedure compatible with current finite element analysis (FEA) solvers, the model must be separated into discrete regions, each possessing an element thickness property that can be altered separately. However, using every single thickness property as a separate optimization variable would result in unmanageable computation times. The lattice’s thickness distribution is, therefore, governed by a predefined mathematical function to reduce the number of optimization variables and to enable an efficient optimization process with FEA. The method’s utility is not limited to this specific load case or structure. It may be adapted to arbitrary goals and geometries as long as 1D or 2D elements are used for the lattice’s geometrical discretization.
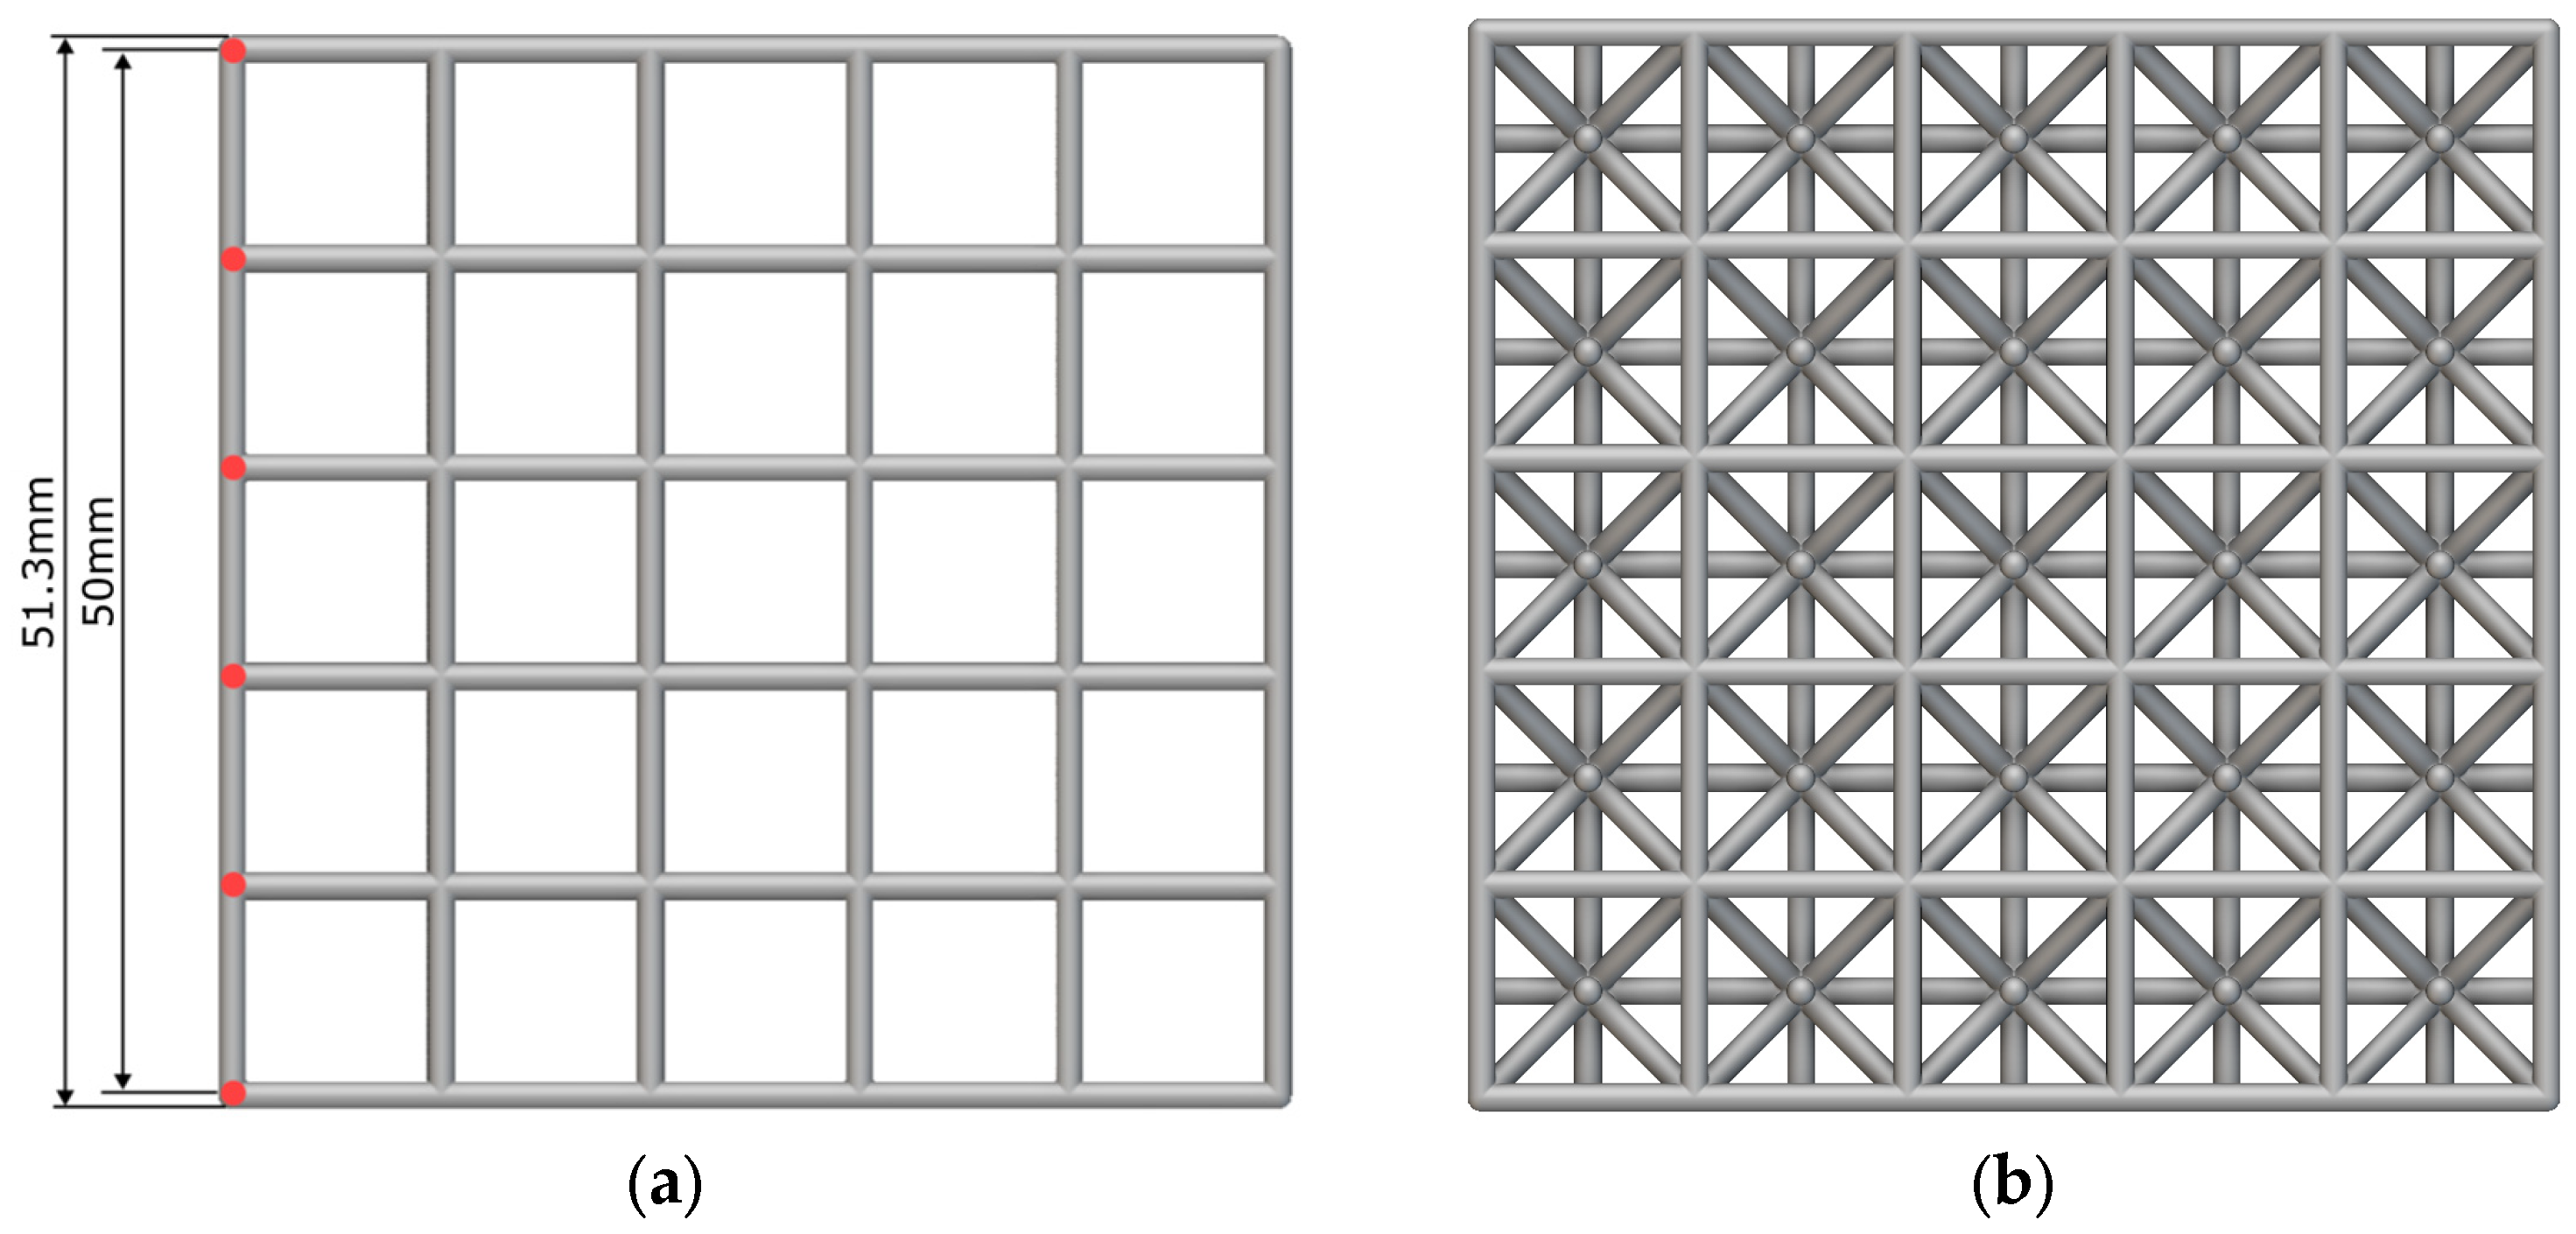
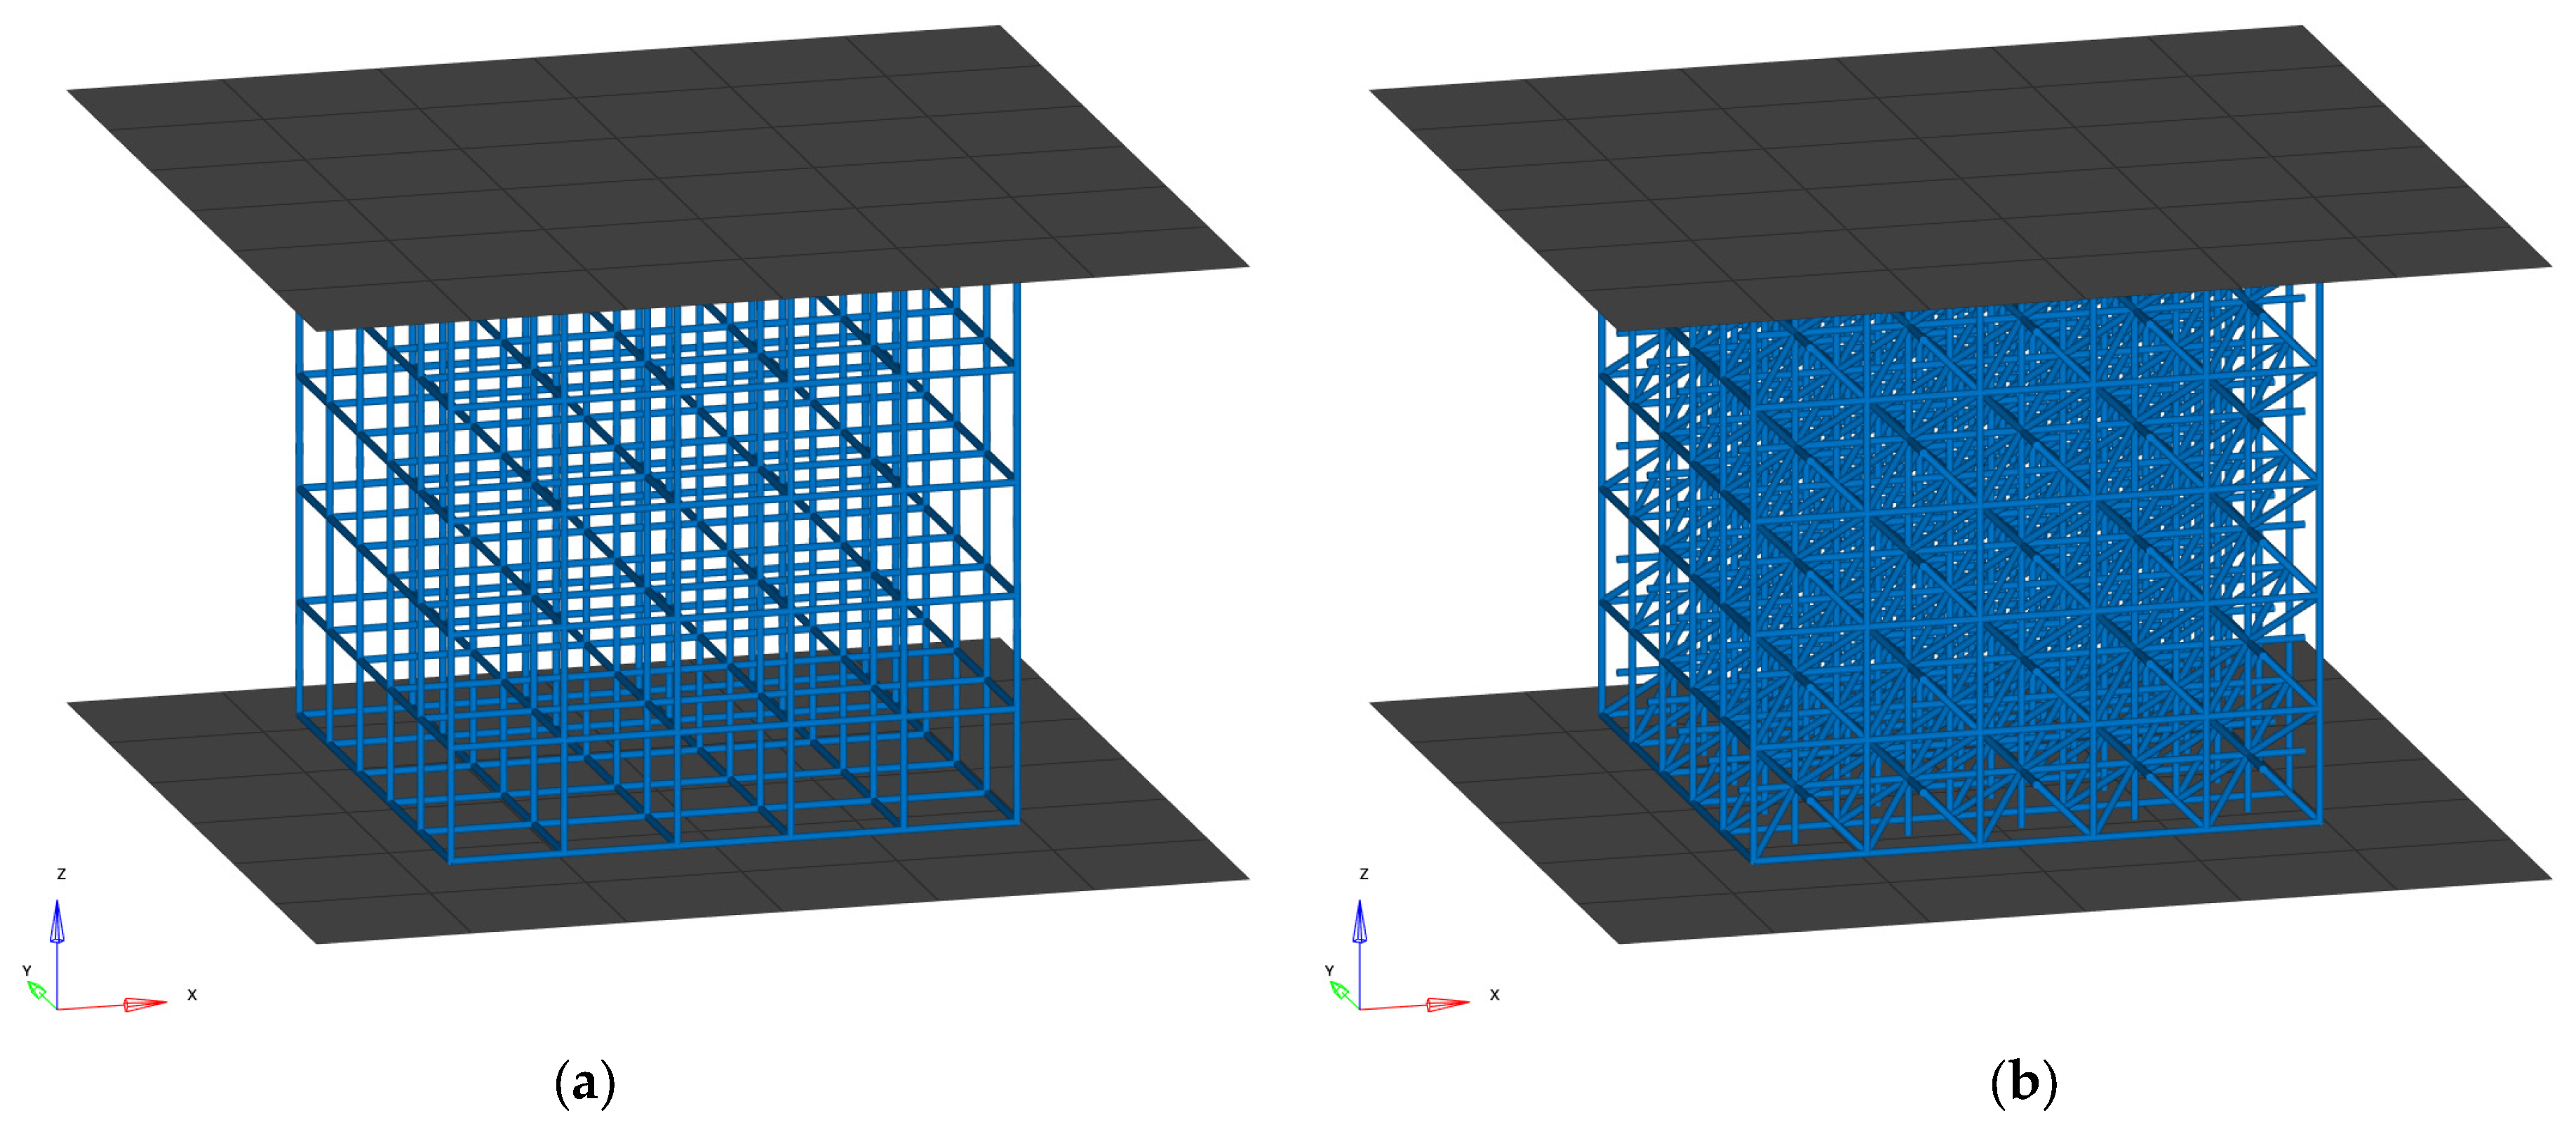
Two graph unit cell types (bending-dominated versus stretching-dominated) are examined in a compressive load case to assess their performance differences and improvement potential. Three thickness-grading styles are proposed, and the best-performing option is physically tested. Surface-based lattices are not investigated in this publication. Only a limited number of lattice and material options can be considered here; the investigation is, therefore, not intended to provide a universally valid gradient recommendation. Rather, the proposed optimization approach should be used to efficiently explore the improvement potential of other lattice configurations, materials, and load cases.

2. Materials and Methods

2.1. Geometry

A cuboid lattice geometry is created in nTop, a design program specifically focused on lattice structures using an implicit body approach [21]. The structures are filled with Simple Cubic and Isotruss unit cells, as depicted in Figure 2. They are considered for this study to represent examples of a bending-dominated type and a stretching-dominated type, respectively. The centres of the cube’s edge nodes are spaced 50 mm apart, and it contains five unit cells per axis, as shown in Figure 3. The models possess a uniform cell size of 10 mm per axis and a constant thickness of 1.3 mm. The total extents of the lattices are, therefore, increased to 51.3 mm per axis.

2.2. Material Parameters and Sample Manufacturing

The test geometries were manufactured with High Reusability Polyamide 12 (PA12) created by HP and produced with an HP Multi Jet Fusion (MJF) machine [22] by an external supplier. A standard layer height of 0.080 mm is applied, and samples are oriented such that their build direction is equal to the loading direction, as indicated by the red arrow in Figure 4. Each sample is built within a protective structure to reduce potential damage occurring during the standard postprocessing step of sandblasting to remove excess powder.
Table 1 and Figure 5 summarize the experimentally determined physical properties from tensile testing. A bilinear stress–strain curve was constructed (Figure 5b) based on the averaged results from five test samples (Figure 5a; see [23]). All samples were manufactured with their longitudinal axis oriented in parallel to the build direction to consider the worst-case loading scenario, wherein the load acts perpendicularly to the weakest plane. A Poisson ratio of 0.4 for as-built PA12 from Power Bed Fusion (PBF) machines is used [24]. The friction coefficient of PA12 in short-duration contact with steel is assumed to be 0.33 (c.f. [25]) and 0.4 in self-contact (c.f. [26]).

2.3. Finite Element Model and Optimization Setup

2.3.1. The Finite Element Model Setup

The explicit FEA solver Altair RADIOSS version 2021.2 [27] is used for the simulation series. Altair’s FEA preprocessor HyperMesh [28] is used to prepare and set up the models. A stationary rigid steel plate below the lattice cube acts as a foundation with a second rigid plate compressing it at a constant speed of 1000 mm/s from the top, as depicted in Figure 6. The velocity was chosen such that no inertial effects occur in the model, while the computation completes quickly enough for an acceptable total duration when executed several hundred times during the optimization. The moving plate does not have any rotational degrees of freedom and is restricted to move only on the vertical axis. The cube is compressed by 25 mm (or 50%) during a run time of 25 milliseconds. The minimum time step is limited to 0.15 microseconds to keep mass scaling significantly below 1%. Contact between beam elements is realised with a TYPE11 line contact, whereas contact between the rigid plates and the lattice body is set up with a TYPE7 general penalty contact. The latter has a constant gap factor such that the plates always touch the lattice body in an identical fashion independently of the beam element thickness. To avoid any artificial movement restrictions from the cube, no additional boundary conditions are imposed on it. Coulomb friction is applied between all parts with the friction coefficients listed in Section 2.2. The moving plate’s reaction force is traced at 20 kHz to accurately assess SEA performance during the optimization runs.
The lattice geometry is represented by 1D beam elements since this enables the easy manipulation of their thickness properties, a requirement for the proposed thickness grading method. Each strut of the lattice is split into 10 beam elements (see detail in Figure 7), ensuring that buckling can be captured adequately. Full geometric nonlinearities are considered; integrated beam elements (P18_INT_BEAM) with a circular cross-section and four integration points per section are utilized. An isotropic piecewise linear elastic–plastic material law (LAW36) is applied to model the nonlinear material behaviour. Strain rate effects are not considered since only data at one single strain rate are available to the authors.
By default, the piecewise linear elastic–plastic law extrapolates the stress–strain curve linearly beyond the given strain range, which can result in overly stiff geometry in the post-failure strain region. Therefore, an alternative approach must be found. In Altair RADIOSS, material failure in integrated beam elements can be considered by applying a simple element deletion method when the first principal strain in an element’s integration point reaches the material’s failure strain. However, this results in severely underpredicted reaction forces and is, therefore, not used. An alternative to this would be a gradual, linear stress reduction to zero in elements exceeding the failure strain, but RADIOSS’ implementation for integrated beam elements is faulty and not in a functioning state. Other failure models for beam elements are not available in RADIOSS. A different approach must be considered, which is why the stress–strain curve was continued at the ultimate tensile stress level. This avoids a further reaction force increase but adds to the overall compressive energy absorption of the geometry during the simulation. This is considered to be the best compromise of the given options.

2.3.2. Splitting and Linking of the Lattice

After the FEA model is set up in HyperMesh, the lattice is split into ten separate, equidistant regions along its height, as marked by the colours in Figure 7. The region identifier numbering scheme starts from T1 at the top of the lattice to T10 at the bottom. Each region possesses a single thickness attribute, and every layer of the unit cells is split in half. The RADIOSS solver input file is then exported for the subsequent steps.
Altair HyperStudy v.2021.2, a general optimization suite able to control and assess virtually any executable calculation software and its outputs [29], is used to link the separate lattice regions, control their thickness, and perform the optimizations. The procedure demonstrated here makes use of the fact that the thickness assignment of idealized 1D and 2D elements is achieved by providing a single thickness value in the solver input file. A section describing the beam element properties of a RADIOSS v.2021.2 input file is shown in Figure 8a. It contains information about its cross-section; iteration point distribution; and, among other things, the element group’s radius assignment marked by a red rectangle. HyperStudy allows to parameterize it, as shown in Figure 8b, and it can then be altered freely for parameter studies or optimization runs.
Upon importing the input file into HyperStudy, it is parameterized by defining each thickness property as an optimization variable. However, performing optimization runs with ten separate variables would require significant computational resources. Therefore, the thickness parameters are linked by a mathematical function using the lattice’s height as an independent variable. The lattice’s origin point is located at the top layer, while the height is assessed at the lower edge of each region (at 5 mm, 10 mm, etc.), as indicated by the arrows in Figure 7. Three different functions are considered:
Linear   law :   T h = a h + c + b
Quadratic   law :   T h = a ( h + c ) 2 + b
Power   law :   T h = a h c + b
The linear law (Equation (1)) was chosen to add to the investigations reviewed in Section 1.2, which also considered linear thickness progressions and demonstrated significant performance improvements. It is defined such that it can include an inflexion point via the insertion of the absolute value function. The quadratic law (Equation (2)) follows a similar approach but is intended to provide larger thickness differences between regions than the linear law to investigate any potential differences. Both functions include a scaling factor, a; a constant factor, b; and a shifting factor, c, allowing the inflexion point to be altered. The limits of the shifting parameter, c, allow the inflexion point to be moved outside of the considered range, which also permits purely increasing or decreasing thickness progression. The power law (Equation (3)) makes identical use of the a and b parameters, but the c parameter acts as an exponent in this case. It is set up symmetrically with respect to the middle plane (i.e., T1 is equal to T10, T2 is equal to T9, etc.) to prevent extreme thickness values at the upper and lower regions. The linear and quadratic laws possess no such inherent symmetry. The power law was added to investigate the performance of a thickness distribution similar to what occurs in pomelo skin, where the cell walls are very thick and close to the outer edges while decreasing to a near-constant level in between [30]. Since pomelo fruits fall from heights of up to 10 m to the ground without fracturing, this indicates that this approach may possess high energy absorption capabilities.
In each approach, the number of optimization variables is decreased from ten to three, reducing the computational effort for finding an optimum distribution drastically. Generally, the laws linking the discrete regions may be arbitrarily chosen, and independent variables other than the height can be considered.

2.3.3. Thickness Optimization Procedure

The goal is to maximize and compare the specific energy absorption capabilities of each approach while restricting the mass of the geometry to a constant value. SEA is defined as the integral of the transient reaction force, F R , at the moving plate over its travelled distance, s, normalized by the structure’s mass, m 0 , as shown in Equation (4).
SEA = 1 m 0 0 s F R ( a , b , c , s ) d s
The goal is, therefore, the maximization of SEA by altering the parameters a, b, and c as expressed by Equation (5). Their limits, provided in Table 2, are chosen such that a broad design space is covered to permit numerous explorable combinations. More important than these limits are the constraints imposed on each region’s minimum and maximum radiuses, which can lie between 0.4 and 1 mm. The lower bound ensures reasonable manufacturability, while the upper bound leaves sufficient space between their outer edges such that the lattice is not entirely compressed at the chosen compression level.
max a , b , c ( SEA )
A mass limit is imposed to prevent the optimization algorithm from simply increasing the thickness endlessly to fulfil the maximization goal and to keep the relative density constant, ensuring comparability between models. It is equal to each reference lattice’s mass with a 1.3 mm uniform beam diameter, which is the thickness of the uniform lattice structures to which the optimized ones are compared. The standard constraint enforcement of HyperStudy is enabled, which considers a constraint violation of 0.5% acceptable, reducing the required optimization iterations. The mass is only parsed once in the initial step of the simulation to avoid any influence of mass scaling that may occur during the simulation.
A Design of Experiment (DOE) study using the Modifiable Extensible Lattice Sequence (MELS; see [31]) approach is run first with 50 iterations to explore the design space and provide initial sampling points for the optimization procedure. It is then relayed into the optimization run, which employs the Global Response Search Method (GRSM; see [32]) algorithm with an upper limit of 500 iterations. The GRSM algorithm is a gradient-based optimization method that uses a response surface fit with global sampling to increase the probability of finding the global optimum. Its fundamental principle is represented schematically in Figure 9. The exact methodology is proprietary and not available to the public; therefore, no further information can be provided here.

2.4. Physical Testing

The results of the base models and optimized models are verified by compressing the lattice structures on a universal testing machine, a Form + Test UP 5E. Given its movement speed limits, the compression velocity of 1000 mm/s used in the simulation models cannot be applied in the physical tests and is thus lowered to 1 mm/s.

3. Results

3.1. Physical Test of Uniform Lattice Structures

A comparison of weights reported from the FEA model, the nTopology model, and the physical measurements is reported in Table 3. The Simple Cubic lattice FEA model has a mass of 6.7 g, whereas the Isotruss lattice FEA model has a mass of 22.2 g. It is worth noting that the FEA models do not accurately capture overlapping beams at their connecting nodes; therefore, their weights are slightly higher than those of the actual geometry reported in nTopology or from physical weighing. The reported mass in nTopology amounts to 6.2 g for the Simple Cubic lattice with a relative density of 5% and 19.0 g for the Isotruss lattice with a relative density of 15%.
Figure 10a depicts compression test results for the three Simple Cubic lattice samples versus the FEA model, plotted as the moving plate’s reaction force versus its displacement. The experimental reaction force curves clearly show a linear elastic region up to the first layer collapse beginning at 400–450 N, after which, the force fluctuates in a plateau region at a level of approximately 200 N. The plateau region is characterized by two layer collapses at a displacement of 10 mm and 17.5 mm. The FEA model’s reaction force greatly surpasses that of the experimental tests up to the initial layer collapse, reaching 1273 N. Beyond its linear elastic region, the plateau phase of the FEA model coincides well with the experimental results both quantitatively and qualitatively, but it does not adequately capture the reaction force peak caused by the layer collapse at the 10 mm mark. The increased buckling strength of the FEA model is explained by its flawless geometry and material composition. It contains no deviations in the geometry and material composition found in physical parts, artificially increasing the buckling strength of the structure. To test this statement, the model was also simulated after introducing random deviations to the elements’ nodal positions. Figure 11 compares the base model with two versions with random nodal deviations of up to 0.1 mm and 0.2 mm, respectively. The force peak is markedly reduced and approaches the level seen from the test samples, while the plateau regions remain comparable but slightly elevated. Their energy absorption values amount to approximately 5.9 J for both variants. The potential material property deviations of the FEA model were not explored in this context.
Figure 10b shows the experimental and simulative results of the Isotruss lattice models. The peak reaction forces of the linear elastic region of the experimental curves range from 3420 N to 3950 N, while the FEA model reaches 3215 N. The ensuing plateau region of test sample 1 is marked by two clearly discernible force peaks caused by sequential layer collapse. As for test sample 2, the same region shows a much smaller reaction force fluctuation range, remaining close to 2250 N. Test sample 3 shows total brittle failure immediately after the linear elastic region, at which point, it completely loses its load-bearing capacity until the compression plate contacts the structure again and reaches a reaction force level similar to the other test samples during the plateau phase.
The FEA model peaks at 3220 N at the end of the linear elastic region and, in the plateau region, closely follows the force fluctuations observed for samples 1 and 2. The most noticeable difference between experiment and simulation is the failure mode that occurred, which is not directly visible by observing the plots. All the samples first experienced a beginning layer collapse in the top and bottom lattice layers, which was also present in the FEA model. While the latter continued exclusively via consecutive layer collapse over the course of the compression, the physical samples failed through shear banding in addition to layer collapse. According to Liu et al. [33], shear band formation is favoured by material concentrations around a lattice’s nodes rather than its struts. Given the geometrical discretization at nodes during meshing (see Figure 12) and deviations stemming from the manufacturing technique, differences from the target thickness that cause this behaviour can occur. Despite this difference in behaviour, the reaction force levels were fairly aligned throughout the whole procedure.
Note that the result curves from the simulations are shown after filtering with an SAE J211/1 filter, but the numerical values were calculated based on nonfiltered results. Reaction force curves from the test samples were not subject to filtering.
The sequences of images in Figure 13 and Figure 14 depict the experimental behaviours of the structures compared with their Finite Element models. After surpassing the linear elastic phase, the uniform Simple Cubic lattice sample exhibits buckling beams in the second and last layers from the bottom. To compensate for the reduced height availability, the entire section is shifted forward. In the FE model, there is a more localized layer shift where only one section of horizontally oriented beams moves sideways because of buckling.
Similar to the physical test sample, the Isotruss FEA model displays the most significant buckling response in the lowest and uppermost cell layers, where the corner beams bend outward more than in other layers. The FEA model then shows a complete layer collapse in the middle section first, while the physical model fails because of shear banding throughout the entire structure.
Table 4 summarizes the total absorbed energy per sample and its specific energy absorption attained during the compression test. The Simple Cubic lattice’s SEA value, as determined using the FEA model, lies 14.9% above the average results obtained from the physical tests. This is explained by the significantly higher force peak during the linear elastic region of the compression procedure, as shown in Figure 10a On the other hand, the SEA performance values of samples 1 and 2 of the Isotruss lattices are 1% and 12% higher than those predicted with the FEA model, whereas sample 3 only reaches 75% because of its complete loss of load-bearing capacity during the test.
The absorbed energy levels are overestimated by the FE models compared with the averaged values of both lattice types. In the case of the SC lattice, this can be explained by the increased buckling strength of the FEA model since the remaining part of the curve coincides very well with the test results. If only samples 1 and 2 of the Isotruss lattice test are considered, and the third sample is discarded as an outlier, their average energy absorption amounts to 57.2 J, which comes within 8% of the value predicted by the FEA model.

3.2. FEA Optimization Results

SEA values resulting from the optimization runs are summarized in Table 5; their thickness distributions are displayed in Figure 15. For the Simple Cubic lattice, the thickness value curve of the linear law approach shows an inflexion point between the T3 and T4 regions, situating the thickest part of the lattice in its upper half. The thickness values do not deviate strongly from the initial distribution, varying from 1.4 mm at its thickest part to 1.2 mm at its thinnest. The quadratic law approach shows a much larger spread, with a thickness of 1.05 mm in the first region, 1.6 mm in the middle, and 0.82 mm in the last region. Given its definition, the power law approach shows a symmetric thickness distribution, with the thinnest regions situated in the middle section of the lattice. Here, the outer regions’ diameters increase to 1.32 mm and reduce to 1.26 mm in the middle section. They remain 3.4% below the mass limit, while the other approaches make full use of it. All three approaches attain significant SEA value improvement predictions, with the linear law approach reaching a 29% increase over the uniform lattice. On the other hand, the same thickness optimization approaches yield only marginal changes in the Isotruss lattice structure. The quadratic law approach allows for a 5.1% increase in SEA, while the power law approach yields a slightly negative result.
The reaction force evolutions of each lattice type and optimisation strategy plotted versus the displacements of the compression plate are plotted in Figure 16. It appears that the maximal response force levels for the Simple Cubic lattice structure reach values that are comparable to those of the uniform base model. Only the quadratic thickness distribution approach model peaks at a much lower level. The increase in energy absorption is caused by a considerably greater mean reaction force level in the plateau phase for all thickness optimisation techniques. It becomes visible when comparing the plateau regions of the linear and quadratic law approaches that the linear law approach gains the majority of the absorbed energy in the first half, up to a displacement of 12.5 mm, while the quadratic law approach gains it in the second.
All of the Isotruss models’ reaction force curves peak in the linear elastic phase at about 3000 N to 3250 N of force. The force levels of the thickness optimisation methods then move through a trough that descends to 1500 N–1750 N before fluctuating around 2500 N.
The linear and quadratic thickness distribution approaches yield nearly identical improvements for the Simple Cubic lattice, whereas the quadratic distribution law performs better than the others in the case of the Isotruss lattice structure. It is chosen for the optimization step of the study.

3.3. Physical Test Results of Optimized Lattices

The reaction force plots of the optimized lattices from the physical tests are shown in Figure 17 with their respective results from the simulations. The Simple Cubic lattice samples again show lower force peaks compared with the simulations, analogously to the samples with uniform thickness discussed previously. The Simple Cubic lattice FEA model sufficiently predicts when force peaks from sequential layer collapse will occur but produces significantly higher reaction forces. The Isotruss lattice FEA model underestimates the achieved force peaks slightly but remains close to the plateau force seen in the later stages of the compression test.
All of the models’ absorbed energies and SEA values are listed in Table 6. The lattice samples all weigh considerably less than what was assumed in the FEA model, which impacts their SEA performance positively. The absorbed energy of the Simple Cubic lattice simulation is nearly twice as large as that of the test samples, as can be estimated from the corresponding graph in Figure 17a, where the FEA model predicts a large initial force peak and then consistently overestimates the force level greatly. Thickness measurements of the samples revealed that their diameters were 0.1–0.2 mm lower than expected in regions with a required thickness under 1 mm. The simulation was repeated with uniform diameter reductions of 0.1 mm and 0.2 mm. The results are shown in Figure 18, and a much closer fit is apparent. Their absorbed energies were 4.7 J and 3.4 J for 0.1 mm and 0.2 mm thickness reductions. The SEA performance amounted to 796 J/kg with a 0.1 mm reduction and 690 J/kg with a 0.2 mm reduction. The former model reaches energy absorption and SEA levels that are comparable to the samples’ average, indicating that the negative thickness deviation is at the root of the performance difference.
The Isotruss lattice samples achieve 17.7% higher SEA values than those predicted with their FE models. However, focusing on their non-normalized absorbed energies alone, their differences are significantly smaller and only amount to 1% and 4%. The disparities in SEA levels, therefore, stem from the differing sample weights compared with FE model weights.

3.4. Discussion of the Results

Difficulties arise when correlating FEA models with physical test results, highlighting the challenges that occur when simulating additively manufactured lattice structures. Parts exhibit material and geometry imperfections that are challenging to account for in advance, and their influence can result in vastly different model behaviour. The tensile properties of the tested material samples varied significantly, with ultimate tensile strengths ranging from 32 MPa to 51 MPa and maximum strains ranging from 3.5% to 11%. Using their average properties might not necessarily be transferrable to a different batch of samples from a later date or be transferrable to singular samples. Printing orientation also influences the final part properties, as the undersides of surfaces exhibit higher porosity than those of the top surfaces, and tolerances vary depending on features being oriented horizontally, vertically, or at any angle in between. While samples were all manufactured with identical orientations, angled structures can differ from their horizontally or vertically oriented counterparts in the same sample, influencing its global response in FEA models. Moreover, possible geometrical deviations such as warping, material accumulation at lattice nodes due to discretization from meshing the geometry, and feature size tolerances from sandblasting during postprocessing and when nearing the production method’s limits exacerbate accurate modelling even further. The buckling response of the investigated unit cell types reacts very sensitively to any imperfections occurring in test samples, as evidenced by these findings.
Beyond these issues, the assumptions regarding the general setup of the FEA models were confirmed to be adequate and accurate for the models, as evidenced by our results. Models with the necessary changes applied to them closely matched both the reaction force curves of the test samples and the accumulated average energy absorption values. The specific energy absorption reported from the FEA models was slightly underestimated since the reported sample weights were overestimated because of overlapping beam elements at unit cell corner nodes. This can be corrected by using the non-normalized absorbed energy of the lattice instead of SEA while still limiting the structure’s maximum weight and calculating the SEA value based on the physical sample weights. The choice of using SEA as the optimization metric was made to allow the study to also explore lower lattice weights, but the optimizer mostly operated above or very close to the upper limit and did not significantly venture in the opposite direction.

4. Summary and Discussion

A method of optimizing lattice structures was demonstrated and tested for maximum specific energy absorption in compressive load cases. The method links the thicknesses of discrete lattice regions via three different mathematical functions using the physical height as the independent variable. The number of required optimization variables is reduced from one per single lattice region to a total of three, thus reducing the required computation time significantly. The method can be used for highly nonlinear simulations and arbitrary optimization goals. The simulations predict a large improvement potential for the Simple Cubic lattice structure when using the proposed linear and quadratic thickness distribution approaches. The optimization simulations of the Isotruss lattice yielded only minute changes.
Although the improvements anticipated from the initial FEA optimizations were not fully realized during physical testing, the results became remarkably close after addressing the deviations. Thus, the authors are confident that the optimization method and the FEA modelling approach are reliable and can produce the expected results when manufacturing constraints are respected.
Improvements to the study can be achieved by exploring different graph and surface unit cell types, relative densities, and material options, as they can result in vastly different optimization potentials compared with the ones presented. Avoiding graph lattice types prone to buckling could facilitate the correlation of tests and FEA models, as they are highly sensitive to a multitude of factors that are difficult to control. Furthermore, avoiding feature sizes approaching the manufacturing method’s limits is advisable to mitigate feature sizes that significantly deviate from the target. Moreover, other optimization goals and lattice topologies, such as surface-based lattices, should be explored using this method.

Author Contributions

Conceptualization, T.D. and S.K.; methodology, T.D.; software, T.D.; validation, T.D.; formal analysis, T.D.; investigation, T.D.; resources, S.K.; data curation, T.D.; writing—original draft preparation, T.D.; writing—review and editing, S.K.; visualization, T.D.; supervision, S.K.; project administration, S.K.; funding acquisition, S.K. All authors have read and agreed to the published version of the manuscript.

Funding

This research received no external funding.

Institutional Review Board Statement

Not applicable.

Informed Consent Statement

Not applicable.

Data Availability Statement

The data are contained within the article.

Conflicts of Interest

The authors declare no conflict of interest.

References

  1. Anné, G.; Vleugels, J.; Van Der Biest, O. Functionally graded ceramics. In Ceramic-Matrix Composites: Microstructure, Properties and Applications; Elsevier: Amsterdam, The Netherlands, 2006; pp. 575–596. [Google Scholar] [CrossRef]
  2. Shabana, Y.M.; Noda, N.; Tohgo, K. Elasto-plastic thermal stresses in functionally graded materials considering microstructure effects. In Proceedings of the Seventh Cairo University International MDP Conference, Cairo, Egypt, 15–17 February 2000. [Google Scholar]
  3. Zhou, W.; Ai, S.; Chen, M.; Zhang, R.; He, R.; Pei, Y.; Fang, D. Preparation and thermodynamic analysis of the porous ZrO2/(ZrO2 + Ni) functionally graded bolted joint. Compos. Part B Eng. 2015, 82, 13–22. [Google Scholar] [CrossRef]
  4. Noronha, J.; Dash, J.; Leary, M.; Watson, M.; Qian, M.; Kyriakou, E.; Brandt, M. Additively Manufactured Functionally Graded Lattices: Design, Mechanical Response, Deformation Behavior, Applications, and Insights. JOM 2023, 75, 5729–5754. [Google Scholar] [CrossRef]
  5. Gibson, L.J.; Ashby, M.F. Cellular Solids: Structure & Properties; Cambridge University Press: Oxford, UK, 1988. [Google Scholar] [CrossRef]
  6. Chen, W.; Zheng, X.; Liu, S. Finite-element-mesh based method for modeling and optimization of lattice structures for additive manufacturing. Materials 2018, 11, 2073. [Google Scholar] [CrossRef] [PubMed]
  7. Yang, J.; Chen, X.; Sun, Y.; Zhang, J.; Feng, C.; Wang, Y.; Wang, K.; Bai, L. Compressive properties of bidirectionally graded lattice structures. Mater. Des. 2022, 218, 110683. [Google Scholar] [CrossRef]
  8. Song, J.; Wang, Y.; Zhou, W.; Fan, R.; Yu, B.; Lu, Y.; Li, L. Topology optimization-guided lattice composites and their mechanical characterizations. Compos. Part B Eng. 2018, 160, 402–411. [Google Scholar] [CrossRef]
  9. Rahman, H.; Yarali, E.; Zolfagharian, A.; Serjouei, A.; Bodaghi, M. Energy absorption and mechanical performance of functionally graded soft–hard lattice structures. Materials 2021, 14, 1366. [Google Scholar] [CrossRef] [PubMed]
  10. Pham, M.-S.; Liu, C.; Todd, I.; Lertthanasarn, J. Damage-tolerant architected materials inspired by crystal microstructure. Nature 2019, 565, 305–311. [Google Scholar] [CrossRef] [PubMed]
  11. Daynes, S.; Feih, S.; Lu, W.F.; Wei, J. Optimisation of functionally graded lattice structures using isostatic lines. Mater. Des. 2017, 127, 215–223. [Google Scholar] [CrossRef]
  12. Chen, Z.; Xie, Y.M.; Wu, X.; Wang, Z.; Li, Q.; Zhou, S. On hybrid cellular materials based on triply periodic minimal surfaces with extreme mechanical properties. Mater. Des. 2019, 183, 108109. [Google Scholar] [CrossRef]
  13. Wu, J.; Aage, N.; Westermann, R.; Sigmund, O. Infill Optimization for Additive Manufacturing—Approaching Bone-Like Porous Structures. IEEE Trans. Vis. Comput. Graph. 2017, 24, 1127–1140. [Google Scholar] [CrossRef] [PubMed]
  14. Niknam, H.; Akbarzadeh, A. Graded lattice structures: Simultaneous enhancement in stiffness and energy absorption. Mater. Des. 2020, 196, 109129. [Google Scholar] [CrossRef]
  15. Ajdari, A.; Nayeb-Hashemi, H.; Vaziri, A. Dynamic crushing and energy absorption of regular, irregular and functionally graded cellular structures. Int. J. Solids Struct. 2011, 48, 506–516. [Google Scholar] [CrossRef]
  16. Maskery, I.; Hussey, A.; Panesar, A.; Aremu, A.; Tuck, C.; Ashcroft, I.; Hague, R. An investigation into reinforced and functionally graded lattice structures. J. Cell. Plast. 2016, 53, 151–165. [Google Scholar] [CrossRef]
  17. Maskery, I.; Aboulkhair, N.T.; Aremu, A.O.; Tuck, C.J.; Ashcroft, I.A.; Wildman, R.D.; Hague, R.J.M. A mechanical property evaluation of graded density Al-Si10-Mg lattice structures manufactured by selective laser melting. Mater. Sci. Eng. A 2016, 670, 264–274. [Google Scholar] [CrossRef]
  18. Choy, S.Y.; Sun, C.-N.; Leong, K.F.; Wei, J. Compressive properties of functionally graded lattice structures manufactured by selective laser melting. Mater. Des. 2017, 131, 112–120. [Google Scholar] [CrossRef]
  19. Tao, W.; Liu, Y.; Sutton, A.; Kolan, K.; Leu, M.C. EasyChair Preprint Design of Lattice Structures with Graded Density Fabricated by Additive Manufacturing “Design of lattice structures with graded density fabricated by additive manufacturing”. In Proceedings of the 2018 International Symposium on Flexible Automation, ISFA 2018, Kanazawa, Japan, 15–19 July 2018. [Google Scholar]
  20. Bai, L.; Gong, C.; Chen, X.; Sun, Y.; Xin, L.; Pu, H.; Peng, Y.; Luo, J. Mechanical properties and energy absorption capabilities of functionally graded lattice structures: Experiments and simulations. Int. J. Mech. Sci. 2020, 182, 105735. [Google Scholar] [CrossRef]
  21. nTop. Available online: https://www.ntop.com (accessed on 31 October 2023).
  22. HP MJF. Available online: https://www.hp.com/us-en/printers/3d-printers/learning-center/3d-printing-process.html#section=hp-multi-jet-fusion (accessed on 31 October 2023).
  23. Decker, T.; Kedziora, S.; Museyibov, E. Comparison of Strength Properties of Common Powder Bed Fusion and Stereolithography Materials. In Proceedings of the 11th International Conference on Nano and Materials Science, Singapore, 13–15 January 2023. [Google Scholar]
  24. Faes, M.; Wang, Y.; Lava, P.; Moens, D. Variability in the mechanical properties of laser sintered PA-12 components. In Proceedings of the 26th Annual International Solid Freeform Fabrication Symposium—An Additive Manufacturing Conference, Austin, TX, USA, 10–12 August 2015; SFF: Singapore, 2015; pp. 847–856. [Google Scholar]
  25. Aldahash, S.A. Friction and wear properties of oriented Polaymide 12 objects manufactured by SLS Technology. J. Engin. Appl. Sci. 2019, 15, 9–25. [Google Scholar]
  26. Roppenecker, D.B.; Grazek, R.; Coy, J.A.; Irlinger, F.; Lueth, T.C. Friction coefficients and surface properties for laser sintered parts. In Proceedings of the ASME International Mechanical Engineering Congress and Exposition, Proceedings (IMECE), San Diego, CA, USA, 15–21 November 2013; Volume 2, pp. 1–10. [Google Scholar]
  27. Altair. Available online: https://altair.com (accessed on 31 October 2023).
  28. Altair HyperMesh. Available online: https://altair.com/hypermesh/ (accessed on 31 October 2023).
  29. Altair HyperStudy. Available online: https://altair.com/hyperstudy/ (accessed on 31 October 2023).
  30. Fischer, S.F.; Thielen, M.; Loprang, R.R.; Seidel, R.; Fleck, C.; Speck, T.; Bührig-Polaczek, A. Pummelos as concept generators for biomimetically inspired low weight structures with excellent damping properties. Adv. Eng. Mater. 2010, 12, B658–B663. [Google Scholar] [CrossRef]
  31. Modifiable Extensible Lattice Sequence (MELS). Available online: https://2021.help.altair.com/2021.2/hwdesktop/hst/topics/design_exploration/method_modified_extensible_lattice_sequence_doe_r.htm (accessed on 31 October 2023).
  32. Global Response Search Method (GRSM). Available online: https://2021.help.altair.com/2021.2/hwdesktop/hst/topics/design_exploration/method_global_response_surface_method_r.htm (accessed on 31 October 2023).
  33. Liu, X.; Wada, T.; Suzuki, A.; Takata, N.; Kobashi, M.; Kato, M. Understanding and suppressing shear band formation in strut-based lattice structures manufactured by laser powder bed fusion. Mater. Des. 2021, 199, 109416. [Google Scholar] [CrossRef]
Figure 1. (a) Examples of bending-dominated (left) and stretching-dominated (right) unit cell categories; (b) schematic reaction force development of compressed lattice composed of ductile material with stretching-dominated cells (solid line), bending-dominated cells (dashed line) and a brittle lattice exhibiting sequential layer collapse (dotted line). Three distinct regions are visible—(1) linear elastic part, (2) plateau region, (3) densification.
Applsci 13 12969 g001
Figure 2. (a) Simple Cubic and (b) Isotruss unit cells.
Applsci 13 12969 g002
Figure 3. (a) Simple Cubic and (b) Isotruss lattice structures with unit cells of 10 mm edge length. The cubes possess equal external dimensions of 51.3 mm per axis, the centres of their corner nodes are distanced 50 mm apart.
Applsci 13 12969 g003
Figure 4. Printed sample next to its protective cage, necessary during postprocessing with sand-blasting. The part’s build direction is identical to the load direction and is marked by a red arrow.
Applsci 13 12969 g004
Figure 5. (a) Stress–strain data obtained from tensile testing. (b) Averaged, piece-wise linear true stress–strain data used for FEA modelling.
Applsci 13 12969 g005
Figure 6. FEA model setup showing the Simple Cubic (a) and Isotruss (b) lattice structures discretized with 1D elements between the two steel plates. The lower plate is stationary and rigidly fixed, while the top plate moves downwards at 1000 mm/s for 25 ms.
Applsci 13 12969 g006
Figure 7. Splitting and linking of the lattice geometry. The graph on the right schematically shows the stepwise thickness distribution linked to mathematical functions that can be defined arbitrarily. The detail on the left side shows the subdivision of the beam into ten beam elements for increased accuracy.
Applsci 13 12969 g007
Figure 8. Beam element property definition of a RADIOSS model input file with its thickness property marked in red (a) and the same section after parameterization of the thickness value in HyperStudy (b).
Applsci 13 12969 g008
Figure 9. Fundamental principle of the GRSM optimization algorithm, recreated based on [32].
Applsci 13 12969 g009
Figure 10. (a) Reaction force versus displacement plots of the Simple Cubic lattice tests and simulations with uniform geometry. (b) Reaction force versus displacement plots of the Isotruss lattice tests and simulations with uniform geometry.
Applsci 13 12969 g010
Figure 11. Comparison of the Simple Cubic lattice’s FEA model reaction force with models incorporating random node position deviations of up to 0.1 mm and 0.2 mm.
Applsci 13 12969 g011
Figure 12. Geometrical deviation from the target caused by the meshing procedure used to export the geometry (a); FE representation of cylindrical beam elements overlapping at nodes (b); and printed lattice geometry (c).
Applsci 13 12969 g012
Figure 13. Comparison of structural behaviour between physical testing of the Simple Cubic lattice (sample 1) (a) and its FEA model (b) at identical plate displacements of 2.5 mm, 10 mm, and 20 mm.
Applsci 13 12969 g013
Figure 14. Comparison of structural behaviour between physical testing of the Isotruss lattice (sample 1) (a) and its FEA model (b) at identical plate displacements of 2.5 mm, 10 mm, and 20 mm.
Applsci 13 12969 g014
Figure 15. Diameter values of Simple Cubic (a) and Isotruss (b) lattices after optimization (T1: bottom, T10: top).
Applsci 13 12969 g015
Figure 16. Reaction force versus compression plate displacement of the optimized Simple Cubic lattice geometries (a) and the Isotruss lattice geometries (b) compared with results from the uniform lattice structures.
Applsci 13 12969 g016
Figure 17. Reaction force versus compression plate displacement of the Simple Cubic lattice geometries (a) and the Isotruss lattice geometries (b) with the quadratic thickness optimization approach.
Applsci 13 12969 g017
Figure 18. Comparison of optimised Simple Cubic FEA model with quadratic thickness distribution and 0.1 mm constant diameter reduction vs. the test samples.
Applsci 13 12969 g018
Table 1. Average material properties of HP PA12.
Physical Properties of HP PA12
Secant modulus at 0.1% strain1480 MPa
Poisson’s ratio0.4 (from [24])
Density0.94 g/cm³
Ultimate tensile strength50.6 MPa
Offset yield strength, R p 0.2 % 29.6 MPa
Engineering strain at break5.1%
Table 2. Optimization variable limits. N.B.: The limits and functions determine the element’s radius, not its diameter.
abc
Linear law±0.02±4±200
Quadratic law±0.001±1±50
Power law±2±2±2
Table 3. Weights of the investigated geometries as reported with the FEA model, the nTop model, and their physical sample weights.
Simple Cubic LatticeIsotruss Lattice
FEA model weight (g)6.7422.22
nTop model weight (g)6.219.0
Actual weights (g)5.9/6.0/5.720.0/18.7/20.3
Average of actual weights (g)5.8619.67
Table 4. Total absorbed energy and specific energy absorption (SEA) values of the Simple Cubic and Isotruss lattice structures with uniform beam diameters. Sample 3 of the Isotruss model is considered an outlier and marked by a star (*).
Simple Cubic LatticeIsotruss Lattice
Absorbed Energy (J)Weight (g)SEA (J/kg)Absorbed Energy (J)Weight (g)SEA (J/kg)
Sample 14.65.977756.220.02809
Sample 25.26.086658.218.73114
Sample 34.65.781042.3 *20.32084
Avg. samples4.85.981852.219.72669
Simulated6.36.7494061.822.222780
Table 5. Total absorbed energy and specific energy absorption (SEA) values of the Simple Cubic and Isotruss lattice structures with uniform beam diameter.
Grading ApproachSimple Cubic LatticeIsotruss Lattice
Absorbed Energy (J)Weight (g)SEA (J/kg)Absorbed Energy (J)Weight (g)SEA (J/kg)
Baseline value6.36.74 g94061.822.22 g2780
Linear law8.16.71 g1213 (+29.0%)62.622.20 g2819 (+1.4%)
Quadratic law8.26.74 g1210 (+28.7%)65.122.27 g2921 (+5.1%)
Power law7.26.51 g1105 (+17.5%)61.722.23 g2775 (−0.2%)
Table 6. Total absorbed energy and specific energy absorption (SEA) values of the Simple Cubic and Isotruss lattice samples after optimization with the quadratic thickness distribution approach.
Simple Cubic LatticeIsotruss Lattice
Absorbed Energy (J)Weight (g)SEA (J/kg)Absorbed Energy (J)Weight (g)SEA (J/kg)
Sample 14.76.078461.518.83269
Sample 23.95.471958.818.93109
Sample 34.45.875273.920.33939
Avg. samples4.15.775264.719.33439
Simulated8.26.74121065.122.272921
Disclaimer/Publisher’s Note: The statements, opinions and data contained in all publications are solely those of the individual author(s) and contributor(s) and not of MDPI and/or the editor(s). MDPI and/or the editor(s) disclaim responsibility for any injury to people or property resulting from any ideas, methods, instructions or products referred to in the content.

