Abstract
In order to alleviate the conflict at intersections in a networked environment between trams in a semi-exclusive right-of-way mode and social vehicles, the running characteristics of these trams and vehicles and their coupling characteristics with the intersection signal are analyzed. The positive and negative effects of the special priority signal on the intersection are considered, and a guidance optimization model that combines urban rails and roads is constructed. With the aim of creating an unplanned delay adjustment scenario for trams, an online collaborative optimization algorithm is proposed, which takes the energy consumption, passenger travel time and comfort of both trams and connected vehicles as optimization objectives in order to realize integrated adjustment of the running trajectories and signal timing, and the population is evolved by using an adaptive elitist genetic algorithm. The study is based on the actual traffic information and timing scheme of an intersection on the T1 line of the Sanya Tram. By comparing with conventional trajectories, the optimized trajectories reduce the total transit time by about 17.1%, the total energy consumption by about 34.7% and the passenger discomfort degree by about 27.8%. The contradiction of the right-of-way distribution at the intersection is alleviated, effectively safeguarding the interests of different users and enterprises. The experimental results show that the model has excellent applicability for different proportions of passenger numbers.
1. Introduction
Green and intelligent urban transportation systems have become the main focus in the development of the transportation industry. A series of products of the information era, such as modern trams, the car network, car–road coordination, road network monitoring and automatic driving, have been increasingly applied in modern transportation systems. As a kind of urban transportation mode with a large transportation capacity, good energy conservation, short construction period and good investment return, modern trams are developing rapidly in many cities across the world [1]. In China, for example, 21 cities or regions nationwide had opened tram lines by the end of June 2022, totaling a length of 532.97 km.
Trams in a semi-exclusive right-of-way mode have an exclusive lane in the running section and share right-of-way with other line users at intersections. Semi-exclusive right-of-way systems can make full use of the advantages of modern trams [2,3]. Currently, it has become the most widely used form of right-of-way.
In operation of modern trams in a semi-exclusive right-of-way mode, allocation of right-of-way between trams and social vehicles at intersections is one of the most important contradictions and core problems. When trams running at top speed cannot pass through an intersection during a green light, the signal priority strategy is usually given to trams based on their arrival time. This easily leads to an increase in the delay of other users at intersections, which reduces the service level and other indicators of the intersections.
In recent years, connected and automated vehicle (CAV) technologies have become a research hotspot in the transportation industry. However, there are few studies on the digital information exchange between urban rail and road. If we study the digital integrated traffic control in the network environment according to the characteristics of the tram and CAVs, the indices of the intersections of tram lines will be further improved.
As shown in Figure 1, this article will research the optimization scheme of the intersections of tram lines in a network environment. In the networked environment built in this article, trams, CAVs and intersection signals can interact with the central computing equipment. Before passing through the intersection, the initial information, such as the timing information from the approaching signal machine, the running status and the number of passengers of the tram and the CAVs, etc., is sent to the central computing equipment. According to the basic information it receives, the computing equipment returns the scheme of adjustment (including adjustment of signal timing and vehicle speed).
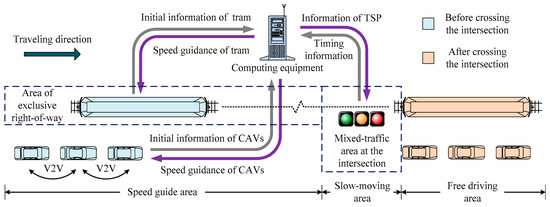
Figure 1.
Schematic diagram of a tram line’s network environment.
The structure of the paper is as follows: in the literature review, studies of transit signal priority, optimal control of urban rail and intersection driving strategy of CAVs are summarized. Section 3 introduces the mathematical model of the tram and CAVs, as well as the objective function and constraints. The methodology to solve the proposed model is developed and outlined in Section 4. Case studies and the results are discussed in Section 5. Finally, the research conclusions and future research directions are put forward in Section 6.
2. Literature Review
Transit signal priority (TSP) is a key technology in operation of trams that can learn from mature research results of conventional buses. Based on these studies, the characteristics of the running process of trams can be considered. Christofa et al. [4] conducted a preliminary study on a signalized intersection in Athens and ranked priority according to bus carrying capacity. Xu et al. [5] proposed an optimization model to optimize bus signal priority and took bus delay as the basis for TSP. Some scholars considered the effects of the TSP characteristics and the additional delay of the queue on the nonpriority route. These studies estimated the impact of TSP on the service levels at each approach point. They also observed that the signal priority decreased the level of intersection service by several levels under the condition of heavy traffic [6,7]. Shi et al. [8] designed a simulated annealing algorithm to verify the efficiency and security of the generated optimal signal. Hu et al. [9] took real-time vehicle information and facility information as the basic information for the input system and used the efficient dynamic programming algorithm to configure this system. Guo et al. [10] provided a new way to optimize signal priority. They proposed a combined model of predictive control and a deep reinforcement learning solution to minimize stopping of trams at intersections while reducing delay of general vehicles. In recent years, some scholars have discussed the negative impact of trams on social vehicles at controlled intersections, but the description of social vehicles was rough, and the negative impact of TSP was simply calculated based on historical traffic flow [11,12,13]. Most of the studies of TSP were focused on bus signal priority. A tram is different from a conventional bus in that it has a long body and large capacity; thus, the timing, duration and impact of the priority signal need to be reconsidered. At present, there is little research on TSP of trams as most studies have focused on basic calculations and qualitative analyses. The positive effects of TSP on trams have seldom been considered.
For the aspect of optimal control of the trajectory of urban rail, Su et al. [14] analyzed the energy consumption characteristics of trains under different working conditions. However, they simplified the traction force, braking force and resistance of trains to a constant. The model increased the difficulty of solving practical problems. Xu et al. [15] used the control subsection method to analyze the travel time and energy consumption of a subway system. Canca and Zarzo [16] proposed a network energy-saving schedule design method, which considered the requirements of passengers and operators, and constructed a multiobjective optimization model to solve the problem of balance between train running times and energy consumption. Zhang et al. [17] analyzed the energy required for railway operation and took different speed limit sections as the research background. The study designed a particle swarm algorithm to obtain the interstation operation curve. Lu et al. [18] optimized the train speed curve based on the genetic algorithm and ant colony optimization algorithm. The model planned the curve according to the classical four-stage method of train operation. Zhang and Zhuan [19,20,21] designed an optimal speed controller to reduce energy consumption of heavy-duty trains. The objective was to reduce energy wasted when braking. These studies mainly focused on energy-saving operation of subways. These scholars took the line between two adjacent stations as a whole section. Although trams usually operate in a similar mode to a subway, the influences of signal timing and speed limits at intersections should be taken into account; therefore, it is difficult to directly apply these past results to tram systems.
On the topic of the intersection driving strategy of CAVs, Guo et al. [22,23] conducted in-depth research on distributed trajectory optimization and stability control for CAVs. They proposed a quadratic spacing policy to improve the flexibility of speed planning and regulations. Additionally, a two-layered framework was established for optimization of the distributed trajectory. The experimental results show that these methods can effectively optimize the trajectory of a fleet. Ye et al. [24] used the signal phase, time information and state prediction of the vehicle to apply the eco-approach and departure (EAD) system at intersections. Some scholars researched the technical optimization of V2V and V2I. They proved that application of these technologies can effectively improve the efficiency of intersections and reduce emissions [25,26,27,28]. Alsabaan et al. [29] analyzed the driving patterns of CAVs at signalized intersections. The study utilized signal lights to communicate with vehicles and enabled CAVs to pass through intersections in a nonstop or gentle acceleration/deceleration manner. Yu et al. [30] ensured the ideal speed of CAVs by optimizing the phase sequence, cycle length, duration of a green light and arrival time of vehicles. Guo et al. [31] calculated the planning speed of a fleet based on Lev Pontryagin’s minimum principle and constructed an ecological driving model based on prediction of departure time. The abovementioned documents represent some of the deep research that has been conducted on trajectory planning of CAVs at intersections. However, this past research has not considered improving the utilization ratio of intersections by combining network technology with the TSP technology of trams.
Combined with the above research and the related literature, there are few studies on the positive and negative effects of the special TSP of trams, and full utilization of TSP by social vehicles was seldom considered. Another problem is that there are few studies on digital integration of trams and CAVs. Those studies of ecological driving of CAVs at intersections seldom considered integration of complex tram lines. The trajectory of a tram and CAV in different TSP schemes is shown in Figure 2. The guidance area construction method in Figure 2 is from [24,30]. After vehicles enter the speed guide area, the tracks of vehicles are determined according to the allowed time period of the traffic signal ahead and predetermined rules. There are many options for trams and CAVs to pass through intersections. In different schemes, the tram has different running indices, and its effects on CAVs in different phases are also different. As shown in Figure 2a, when there is no signal priority, the tram and CAVs in the same phase have overall longer travel times in the running section but have no effect on vehicles in other phases. As shown in Figure 2b–d, the tram has priority to pass through the intersection by using the green extension, phase insertion and early green schemes, respectively. The same-phase CAVs follow the tram to share the benefits of signal priority. However, different signal priorities will have different impacts on the vehicles in the occupied phase, and the extent of the impact is related to the traffic flow of the occupied phase and other factors. The model of digital cooperation among trams, CAVs and traffic signals is established to solve these challenges and improve the overall performance of the signal-controlled intersection.
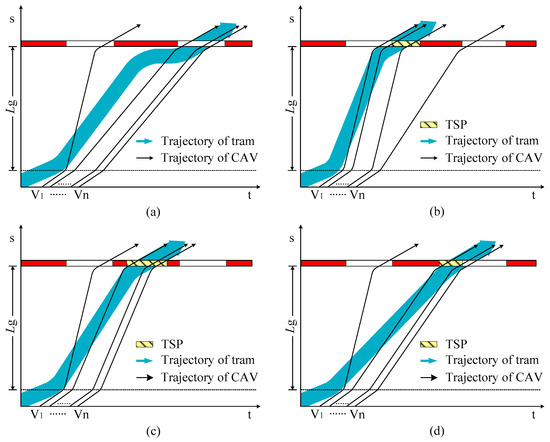
Figure 2.
Schematic diagram of tram and CAV (same direction) trajectory under different TSP schemes. (a) No signal priority scheme. (b) Green extension scheme. (c) Phase insertion scheme. (d) Early green scheme.
This paper aims to solve the problem of the right-of-way conflict between trams and CAVs by developing a new cooperative control method. The new method, which combines urban rail and road traffic, aims to determine the location and duration of tram TSP more reasonably and carry out coordinated trajectory planning for trams and CAVs. The main contributions are as follows:
- Different from the usual research on control of a single mode of urban transportation [15,17,24], this paper puts forward a conception of digital integration of trams, connected vehicles and intersection signal machines in order to achieve intelligent traffic on tram lines.
- In general, studies on intersection priority control of trams are rough to establish the social vehicle model, and the positive influence of the special TSP of trams on social vehicles has not been considered [6,7,9,12]. In this study, the influence of tram body length on TSP is considered, and V2I and V2V communication technology can be used to realize full utilization of TSP in the network environment.
- A new online collaborative optimization algorithm is proposed, and three objective functions combining rail and road are constructed. In this way, the integrated optimization problem of cross-transportation modes is realized. Additionally, the adaptive elitist genetic algorithm is used to solve the problem. These innovative and effective methods have not been proposed in previous tram control studies [6,11,12].
3. Mathematical Model
3.1. Dynamic Model of Trams
According to the operating characteristics of trams, the traction and braking forces have different maximum values at different operating speeds. The formulas for traction and braking characteristics of trams are defined as
Trams in semi-exclusive right-of-way mode enjoy independent right-of-way in running sections and share right-of-way with other road users at intersections. The speed limit can be divided into section speed limit and intersection speed limit. As shown in Figure 3, there are several feasible operating curves for trams in the running section, but only one curve represents how a tram can pass in the shortest time, which is called the fastest curve. In previous studies, to save train passengers time when traveling, the combination of maximum traction, cruise, coast and maximum braking is usually used to form the optimal control curve of the train [32].
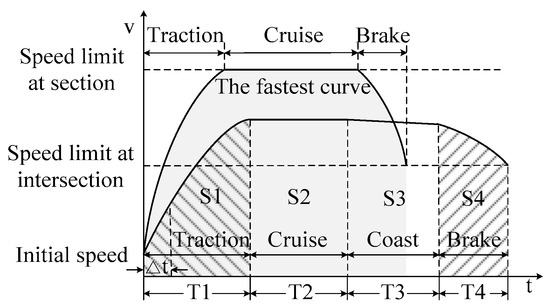
Figure 3.
Four-phase driving strategy curve of tram.
Factors such as the running condition of social vehicles at intersections should be considered when planning the optimal control curve of trams; thus, the traction and braking forces in the traction and braking stages need not be the maximum. The running time of the trams in the running section can be flexibly changed by adjusting the traction and braking forces; i.e., the planning time can be longer than the time of the fastest curve.
The traction acceleration , coast acceleration , braking acceleration and basic resistance of the trams are obtained by analyzing the traction, coast and braking states of the trams, respectively, and are expressed as follows:
where represents the total mass of a fully loaded tram (set to 67.5 t); and are the ratio of maximum traction and maximum braking force; is the coefficient of basic resistance (set to 2.62); is the coefficient of rolling resistance (set to 0.094) and is the coefficient of air resistance (set to 0.00078).
The acceleration motion of the tram running process is a complex variable; thus, the conventional discrete method is used in the simulation process. The information storage matrix is established and the whole running process is divided into several segments of uniformly accelerated rectilinear motion with a step length (set to 0.1 s). The discrete speed and distance of trams are calculated as follows:
where , and are the initial speed, acceleration and distance at the ith time step.
3.2. Guidance Model of CAVs
V2V communication, one of the earliest practical intelligent road traffic technologies, can be used to form a flexible vehicle fleet between CAVs [33]. The fleet control system is mainly divided into two layers, where the lower layer is responsible for the speed of the coordination control of the following cars. The upper layer is responsible for the speed control of the lead vehicle; the lead vehicle obtains timing information from the signal machine via V2I communication and calculates its recommended speed based on predetermined rules.
This study puts forward that the “road train”, which is composed of CAVs in the same phase as trams, can pass through intersections at the same time with trams by using TSP, fully utilizing the right-of-way at intersections. V2I communication can also help to avoid wasting the right-of-way, which is caused by drivers unknown to the TSP and the hesitancy of manipulation.
In this paper, the intelligent driver model (IDM) was adopted as the car-following model. Because of the excellent performance of the IDM in traffic dynamics, many scholars have studied the field of traffic control by utilizing it. The input of the model is the speed of the car in front, the distance between the car and the car in front and the speed of the car. The output is the acceleration of the car [34]. The IDM is suitable to be applied to the research of this paper, and it is expressed as follows:
where the vehicle’s acceleration, max acceleration, instant speed, desired speed, gap, relative speed and desired gap are denoted as , , , , , and , respectively.
The expression for the desired gap is:
where , and are the safe gap (set to 1.5 m), reaction time (set to 0.8 s) and comfort deceleration, respectively.
The upper control scheme states that, when the lead vehicle enters the speed guidance area, the shortest expected time to arrive at the intersection is first calculated; i.e., this is the time to reach an intersection when the target speed is the maximum speed limit. The minimum time for the lead vehicle to reach the intersection is expressed as follows:
where represents the time between the arrival of the lead vehicle in the guide area and the arrival of the stop line at the intersection; is the length of speed guide area; represents the initial speed of the leading car entering the speed guidance area; is the speed limit of CAVs and is the comfort acceleration.
If the calculated time of arrival is in a green light period, the number of cars allowed to pass during the remaining green light period is calculated. If all the following vehicles cannot make it through the intersection, the follow-up vehicles are guided through the intersection at the next green light period. The maximum number of cars that can pass is expressed as follows:
where represents the moment when the lead vehicle enters the guidance area; represents the end of the green light for that phase; is the actual distance between vehicles; l is the length of a vehicle and is the target speed.
When the fleet is in a state of equilibrium flow, , we can obtain the actual distance from Equations (9) and (10). The expression is:
If the calculated time of arrival is during a red light period (the downstream vehicles regard the green light period when the upstream vehicles pass as the red light period), the total section transit time is updated to the time between the arrival of the lead vehicle in the guidance area and the start of the next green light. The average target speed is calculated based on the total transit time and the length of the guidance area, and then the speed guide curve is obtained by performing the distance compensation planning calculation.
The key to determining speed guidance is distance compensation planning. After the leader vehicles enter the guidance area, their distance and duration to reach the intersection are fixed. Therefore, when the CAV’s speed is lower or higher than the target average speed when the lead vehicle enters the guidance area, the driving distance is compensated for by accelerating and decelerating the guidance. The target speed is determined by calculating the distance and the acceleration or deceleration duration, where the target speed must satisfy the speed limit constraint.
The following assumptions were made in establishment of the tram and CAV model:
- The TSP strategy only considers the green extension, early green and phase insertion schemes.
- All vehicles are connected to the Internet. The connected vehicles choose the road before the speed guidance area and only adjust their speed in the speed guidance area.
- Ignoring the communication delay, both trams and connected vehicles strictly obey the speed guidance scheme.
- The connected vehicles with different driving directions travel the same distance through the intersection.
- The influence of the slope of the road surface on the trams and the connected vehicles, as well as the additional resistance of the trams, is not considered.
3.3. Objective Function
In this study, the goals of the trams and CAVs are dealt with in a unified way. The developed model is expected to reduce the transit time of road users, reduce the running energy consumption and improve the comfort of road users.
3.3.1. Minimum Weighted Total Transit Time of Passengers
Total transit time includes the transit time of all tram and CAV passengers in all directions, from the start of the guidance area to the stop line of the intersection. To encourage public transportation and ensure right-of-way priority of public transportation, the weight coefficient is added to help the model focus on reducing the transit time of tram passengers. The target for total transit time is:
where is the number of trams fully loaded; is the ratio of a full load; ~ are the traction, cruise, coast and braking duration of trams, respectively; is the number of passengers in the sth CAV and is the transit time of the sth CAV. In order to ensure relative right-of-way priority of public transport, weight coefficients and are added (set to 0.6 and 0.4) to ensure that the model is more focused on reducing the transit time of tram passengers.
3.3.2. Minimum Total Energy Consumption for Tram and CAVs
Similar to the target for transit time, total energy consumption includes the energy consumption of tram and CAVs, and the target for total energy consumption is:
where represents the energy consumption of the tram and represents the energy consumption of the sth CAV.
The running energy consumption index of the tram is:
where represents the factor that converts electrical energy into mechanical energy during traction; represents the factor that converts mechanical energy into electrical energy during braking and is the power of the auxiliary system.
The vehicle-specific power (VSP) model is chosen as the energy consumption model of CAV because it is unified with the energy consumption model unit of trams and is widely used. The energy consumption of a vehicle on a flat road is related to its instantaneous speed and acceleration [35] and can be expressed as follows:
The energy consumption calculation of CAVs includes the energy consumption in the guidance area and the energy consumption in the velocity recovery stage, and the running energy consumption index is:
where represents the mass of a CAV (set to 1.2 t).
3.3.3. Maximum Passenger Comfort
The average absolute value of the rate of acceleration change is taken as the index of the passenger’s discomfort degree. The smaller the calculated target value is, the smaller the vehicle’s impact rate on the passengers is; the smoother the vehicle is, the more comfortable the passengers are. Both tram passengers and CAV passengers have the same standards in judgment of comfort, and, thus, passenger comfort is calculated together. The target for comfort is:
where m is the statistical total of acceleration.
3.4. Constraints
The tram operation status and TSP information constraints are as follows:
where and are the maximum speed of the tram in the intersection and running sections; , and are the distance traveled with traction, coast and braking, respectively; represents the cruising speed of the tram; represents the end speed of a tram in coast mode; , and are the duration of the green extension, phase insertion and early green schemes in cycle k, respectively; is a 0–1 variable that determines whether cycle k implements the TSP, where the value is 1 if implemented and 0 if not; is the maximum duration of TSP; and are the beginning and the end of the phase insertion; is the end of the original green light phase of the tram; is the beginning of the green light phase of the tram in cycle k + 1; is the minimum interval for phase insertion; and are the beginning of the third and fourth phases, respectively.
Equation (20) is the constraint of the train running-state information. Equation (21) is the duration constraint of three TSPs for trams. Equation (22) is the constraint of the phase insertion interval, where the first line represents the minimum interval between the beginning time of the tram phase insertion and the end time of its original green light phase, and the other represents the minimum interval between the end time of phase insertion and the beginning time of the next cycle’s original green light phase. Equation (23) is a phase protection constraint to prevent phase insertion, which divides the green light period of the inserted phase into two parts. This kind of unreasonable phase insertion would lead to a decrease in intersection safety and use efficiency. Therefore, the phase insertion period must contain the beginning of phase three or phase four.
4. Methodology
To realize digital cooperation between rail and road, an online collaborative optimization algorithm is designed in this paper to determine the effect of TSP information on trams and CAVs. The algorithm’s design steps are shown in Algorithm 1.
4.1. Input Information
Input line information, timing information and the initial parameters of trams and CAVs are considered. These initial parameters include the time when trams and CAVs enter the guidance area, the initial speed, the number of passengers, the speed limit of the running section and the intersection, etc.
4.2. Chromosome Encoding
The chromosomes are encoded by real numbers, and the individual gene is composed of the ratios of the maximum traction and the maximum braking force ( and ) and the traction distance and the braking distance of the tram ( and ).
From initial speed and , tractive track can be obtained, and, from , tractive time and cruising speed can be determined. Taking the speed limit at the intersection of the tram as the last speed of the running section, braking time and terminal coasting speed can be deduced by using and , and coasting track can be obtained. From coasting track and cruising speed, coasting time and distance can be obtained, and then cruising distance and time can be obtained. From this, the traveling distance and duration of each working condition can be obtained, and then the guiding scheme for trams can be obtained. Enough random chromosomes are generated the first time, and the running-state constraint is used as the screening condition. The size of the population is set to 50.
4.3. TSP Information Calculation
The type and minimum duration of the TSP are calculated by using the guidance scheme of the tram and timing information from the intersection. The population is adjusted if the TSP information constraints are not satisfied.
4.4. CAV Speed Guide
Timing information is updated according to the TSP. For example, if the TSP occurs in signal cycle k, then the pass period of phase one (phase one is the tram pass phase) is updated as follows:
In the same way, we can update the period of the remaining phases. The objects of guidance are CAVs that were originally planned to pass in the phase of the TSP and in the following three phases. The speed guidance calculation is conducted for CAVs according to the updated timing information.
4.5. Fitness Calculation
In the study, three optimization indices are included. The fuzzy mathematical programming method is used to deal with the three indices, and the multiobjective optimization problem is transformed into a single-objective optimization problem. The comprehensive optimization goal is:
where , , , , and are the maximum and minimum values of the three objective functions of Equations (14), (15) and (19), respectively.
In this paper, the fitness function of a chromosome is defined as
where is the maximum estimate of the objective function.
4.6. Solved with the Adaptive Elitist Genetic Algorithm (A-EGA)
In this paper, the A-EGA is designed to solve the problem of the traditional genetic algorithm being slow and falling easily into the local optimal solution.
Improvements to the A-EGA’s selection, crossover and mutation operators are as follows:
- (1)
- Selection: After fitness calculation of the comprehensive objective function, selection begins. In the selection process, elite individuals are retained, and the roulette selection method is adopted. The survival probability of the individuals is determined by their fitness. The elite reservation strategy improves the convergence ability of the genetic algorithm.
- (2)
- Crossover and mutation: A random number is used to determine the position of the crossover. The mutation operation takes a fixed-value mutation. In crossover and mutation operations, the crossover probability Pc and mutation probability Pm directly affect the convergence speed of the algorithm. If Pc and Pm are too large, they will destroy the chromosome structure with good fitness, and, if Pc and Pm are too small, they may fall under the local optimal solution. A value that is too large or too small will lead to a decrease in evolutionary efficiency. Therefore, an adaptive crossover and mutation operation is constructed. The calculation formulas for the probability of an adaptive crossover and mutation are defined as
When superior offspring are produced in the process of evolution, the probability of crossover and mutation is reduced. In other words, in order to extend the search range and maintain the diversity of the population, the algorithm is given a higher probability to generate new solutions in the early stage of evolution, and, in order to improve the convergence rate of the algorithm, the algorithm is given a smaller probability to destroy the optimal solution in the late stage of evolution. The values of Pc max and Pm max are obtained from reference [36] and set to 0.9 and 0.4, respectively. The number of iterations is set to 100. The optimal scheme is outputted after the required number of iterations is reached.
| Algorithm 1 Main function of online collaborative optimization algorithm | |
| 1 | Input: The line information, the timing information, the initial parameters of |
| tram and CAVs and the constraints | |
| 2 | Output: TSP strategy, guidance scheme of tram and CAVs |
| 3 | Initial population ← Initialization (P1, P2, S1, S4); |
| 4 | New population ← ∅; |
| 5 | for (i = 1…N) do // N is the total number of iterations |
| 6 | for (each individual ∈ Initial population) do |
| 7 | while true do |
| 8 | TS ← Calculate the speed guidance strategy of the tram; |
| 9 | AT, AS ← Calculate the time and speed when the tram reaches the |
| intersection (TS); | |
| 10 | TSP ← Calculate the type, location and duration of the TSP (AT, |
| AS); | |
| 11 | if the flag for the constraint is true then |
| 12 | break; |
| 13 | end if |
| 14 | Initial population ← Coding adjustment; |
| 15 | end while |
| 16 | CS ← Calculate speed guidance strategy of the CAVs of the TSP-related |
| phase (TSP); | |
| 17 | FIT ← Calculate the fitness of the objective function (TS, CS); |
| 18 | end for |
| 19 | New population ← New population ∪ Elite individual; |
| 20 | Selected couples ← selection (Current population); |
| 21 | Crossed couples ← crossover (Selected couples); |
| 22 | Offspring ← mutation (Crossed couples); |
| 23 | New population ← New population ∪ Offspring; |
| 24 | end for |
5. Results and Discussion
5.1. Numerical Case
The Jinjiling–Jiefang intersection on the T1 line of the Sanya Tram is selected as the case for analysis. The Sanya Tram has a central layout, and Jiefang Road station’s platform type is an asymmetric side platform. The timing information of the Jinjiling–Jiefang intersection, including the number of lanes, traffic volume, capacity and service level of each entrance at the intersection, were obtained before the case analysis.
There are ten lanes in the east–west direction and eight lanes in the north–south direction at the Jinjiling–Jiefang intersection. The tram station is located on the east–west side of the intersection. To simplify the calculation, multiple lanes in the same direction are merged into a single lane, and the traffic volume is the quotient of the original traffic volume in that direction and the number of original lanes. The channelization diagram of the Jinjiling–Jiefang intersection is shown in Figure 4, the phase scheme of the signal control is shown in Table 1 and the traffic volume and the number of lanes at the intersection are shown in Table 2. The parameters of the CAV simulation set in this study refer to those from existing studies [33,34], and the main parameters of the simulation calculation are shown in Table 3.
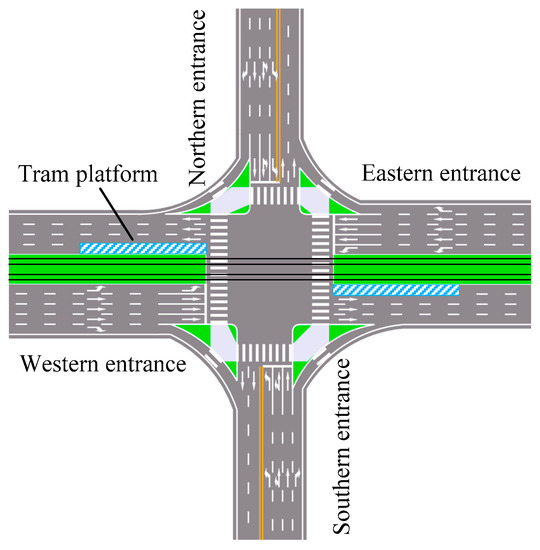
Figure 4.
Channelization of Jinjiling–Jiefang intersection.

Table 1.
Signal-controlled phase scheme.
Table 2.
Traffic volume and number of lanes at Jinjiling–Jiefang intersection.
Table 3.
Main parameter settings of the simulation calculation.
5.2. Performance Comparison with and without Optimization
The iteration of the fitness function is shown in Figure 5. To effectively analyze the effect of the cooperative optimization of trams and CAVs, the TransSuite traffic control method, described in [37], is compared with the target guidance method designed in this paper. When the tram is delayed and cannot move through the intersection in the corresponding phase as planned, it is necessary to control the tram to reduce its delay. When the tram still cannot pass through the intersection according to the fastest curve, the conventional method in [37] usually sets up TSP for trams according to the arrival time of the tram to reduce public transport delay.
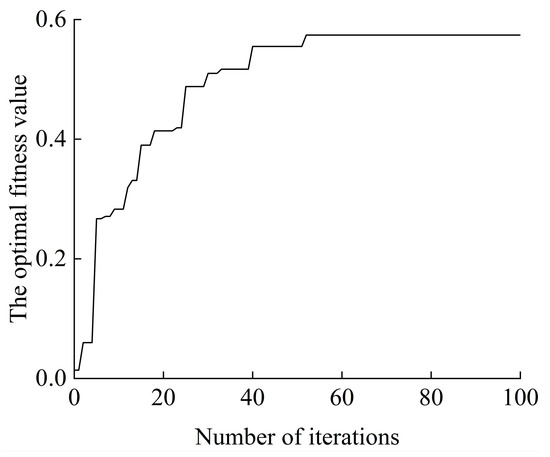
Figure 5.
Iterative process of fitness function.
When the conventional method is used to solve the problem, the tram arrives at the intersection at the beginning of the second phase of the cycle, and the TSP type is the green extension scheme. When using the target guidance method in this paper, the tram arrives at the intersection at the beginning of the third phase of the cycle, and the TSP type is the phase insertion scheme. Comparing the changes in the CAV trajectories obtained by the two methods, Figure 6a–c corresponds to the three phases involved, that is, the second phase, the third phase and the first phase of the next cycle, respectively. It can be seen from Figure 6a that there are many CAVs that plan to pass in the second phase. If the TSP is set to the second phase, the green time of the second-phase CAVs is reduced, forcing the upstream vehicles to be guided into the second phase of the next cycle. If the TSP is set to the third phase, the CAVs passing through the intersection in the second phase will not be affected. As can be seen from Figure 6b, there are a few CAVs scheduled to pass through in the third phase. Although the TSP occupies part of the third phase, the CAVs of this phase can still pass in the remaining time after their arrival time delay. Therefore, the TSP did not have a significant impact on the CAVs in this phase. As can be seen from Figure 6c, if the TSP of the tram is set to the second phase, the TSP is not fully utilized as CAVs in the first phase cannot pass through the intersection with the tram. When the TSP is set to the third phase, several CAVs can pass through the intersection with the tram due to TSP, which can reduce the first-phase traffic pressure in the next cycle; thus, the overall trajectory of CAVs passing through the intersection in the first phase is optimized.
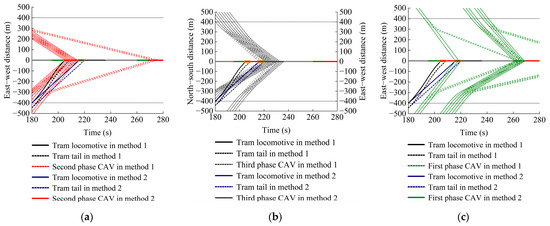
Figure 6.
Comparison of connected vehicle trajectories. (a) The second phase. (b) The third phase. (c) The first phase of the next cycle.
The trajectory charts of a tram and CAVs obtained by using the conventional method from [37] and the target guidance method are shown in Figure 7a,b, respectively. The results are shown in Table 4. Compared with the conventional method, the transit time of the tram increased by 45.8%, but the total transit time of the tram and CAVs decreased by 17.1%. For the aspects of energy consumption and comfort, it can be observed that both the tram and CAVs run smoothly due to the guidance from this paper. The acceleration and deceleration process, which is violent in the conventional method, is avoided. The total energy consumption of the tram and CAVs is reduced by 34.7%. The discomfort value is reduced by 25.8%. The index obtained by the target guidance method is better than that obtained with the model from [37]. The scheme in this paper can effectively reduce overall transit time, running energy consumption and comfort index for different intersection users.
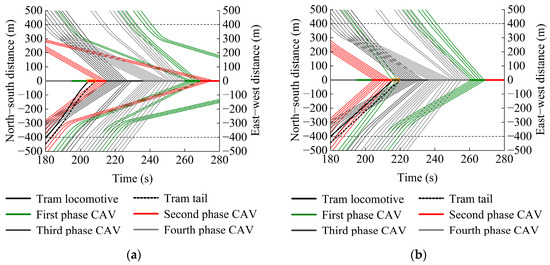
Figure 7.
Trajectories of tram and connected vehicles. (a) Conventional method. (b) Target guidance method.
Table 4.
Comparison of indicators from two different strategies.
The passenger ratio of trams to social vehicles varies greatly between workdays and non-workdays and between peak hours and flat hours; therefore, the applicability of this model is analyzed, with the results shown in Figure 8. As can be seen from Figure 8, with the increase in the proportion of tram passengers, the value of the objective function obtained by the conventional method shows a decreasing trend. The objective function obtained through optimization of the model presented a zigzag pattern of first falling, then rising and finally falling.
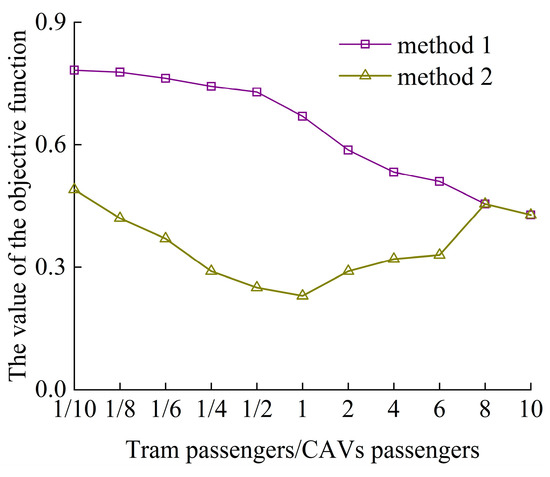
Figure 8.
Applicability analysis with different passenger ratios.
The reason for this is that, when the number of tram passengers is small and the number of social vehicle passengers is large, the priority given to the tram by the conventional method will have a greater negative impact on many social vehicle passengers. With the increase in the proportion of tram passengers, an advantage in priority gradually appears. Through the optimization of the target guidance method designed in this paper, when the ratio does not reach 1, the optimized TSP type is the phase insertion scheme only at the early stage of the third phase. In this case, the energy consumption and comfort indices of the tram and CAVs are low, and the passing time of the tram passengers is longer. When the ratio is greater than 1 and less than 6, the phase insertion scheme that only occurs in the third phase cannot reduce the transit time of tram passengers; therefore, the TSP changes into the phase insertion scheme that occupies the second phase and the third phase at the same time. With an increase in the ratio, occupation of the second phase increases. When the ratio is 6 to 8, a large increase is mainly caused by the change in the TSP from the phase insertion to green extension scheme. When the ratio is above 8, the TSP has little influence on social vehicles and, thus, the optimization results are in accordance with the scheme obtained by the conventional method, in which a part of the energy consumption and comfort index are sacrificed to reduce the transit time of many tram passengers. The optimized scheme obtained by the target guidance method proposed in this paper can adapt to scenarios with different passenger proportions and has good applicability.
5.3. Discussion of the Limitations
5.3.1. Network Environment
Advanced digital technologies are needed to realize intelligent traffic control in smart cities. Under the ideal network environment constructed in this paper, all the trams and social vehicles are connected to the unified control network, and it is expected that interworking and cooperative control can be achieved between different transportation means. In further research works, more in-depth research on the hybrid environment of connected and non-connected vehicles should be carried out. This paper can provide a theoretical reference for this kind of control engineering.
5.3.2. Semi-Exclusive Right-of-Way System
In this paper, the tram line system that is adopted is a semi-exclusive right-of-way system, which is widely used in urban road systems. In practice, there are still many kinds of right-of-way systems, such as the exclusive right-of-way system and mixed right-of-way system. Therefore, in further research works, more extensive research on different types of tramways should be carried out.
6. Conclusions
In this paper, the problem of right-of-way conflict between trams and CAVs at an intersection was analyzed, and the influence of tram length on TSP was considered. The objective functions of transit time, energy consumption and comfort degree were constructed.
In this paper, digital integration of trams, CAVs and the intersection signal was explored and an online collaborative optimization algorithm was proposed to solve the integrated optimization problem using a cross-transportation mode. In order to avoid the problem of the traditional genetic algorithm being slow and falling easily into the local optimum solution, an improved elitist genetic algorithm based on adaptive thought was proposed.
The method was verified by testing it on a case of an intersection on the T1 line of the Sanya Tram. Optimized TSP information was determined for a tram and CAVs. It was found that TSP tends to occur at the position that is most advantageous to the CAVs in the same phase as the tram and has the least influence on the CAVs in the occupied phase. The method can reduce the wasted potential of right-of-way, relieve the right-of-way conflict between different modes of transportation and has good applicability. Our next research study will focus on linkage of traffic signal controls in arterial intersections.
Author Contributions
Conceptualization, J.D. and Y.M.; methodology, Y.M. and Z.Z.; software, W.L.; validation, Z.Z. and J.Z.; formal analysis, W.L.; investigation, W.L.; data curation, W.L.; writing—original draft preparation, W.L.; writing—review and editing, W.L.; visualization, W.L.; supervision, Y.M.; funding acquisition, Z.Z. All authors have read and agreed to the published version of the manuscript.
Funding
This research is funded by the National Natural Science Foundation of China (61763025).
Institutional Review Board Statement
Not applicable.
Informed Consent Statement
Not applicable.
Data Availability Statement
The data used to support the findings of this study are available from the corresponding author upon request.
Conflicts of Interest
The authors declare that they have no conflict of interest.
References
- Pietrzak, K.; Pietrzak, O. Tram system as a challenge for smart and sustainable urban public transport: Effects of applying bi-directional trams. Energies 2022, 15, 5685. [Google Scholar] [CrossRef]
- He, J.; Li, Y.; Long, S.; Xu, Y.; Chen, J. Energy-efficient tram speed trajectory optimization considering the influence of the traffic light. Front. Energy Res. 2022, 10, 3389. [Google Scholar] [CrossRef]
- Zhou, W.; Bai, Y.; Li, J.; Zhou, Y.; Li, T. Integrated optimization of tram schedule and signal priority at intersections to minimize person delay. J. Adv. Transp. 2019, 2019, 1–18. [Google Scholar] [CrossRef]
- Christofa, E.; Papamichail, I.; Skabardonis, A. Person-based traffic responsive signal control optimization. IEEE Trans. Intell. Transp. 2013, 14, 1278–1289. [Google Scholar] [CrossRef]
- Xu, M.; Ye, Z.; Sun, H.; Wang, W. Optimization model for transit signal priority under conflicting priority requests. Transp. Res. Rec. 2016, 2539, 140–148. [Google Scholar] [CrossRef]
- Skabardonis, A.; Christofa, E. Impact of transit signal priority on level of service at signalized intersections. Proc.–Soc. Behav. Sci. 2011, 16, 612–619. [Google Scholar] [CrossRef]
- An, Y.; Wu, N.; Zhao, X.; Li, X.; Chen, P. Hierarchical Colored petri nets for modeling and analysis of transit signal priority control systems. Appl. Sci. 2018, 8, 141. [Google Scholar] [CrossRef]
- Shi, W.; Yu, C.; Ma, W.; Wang, L.; Nie, L. Simultaneous optimization of passive transit priority signals and lane allocation. KSCE J. Civ. Eng. 2020, 24, 624–634. [Google Scholar] [CrossRef]
- Hu, J.; Zhang, Z.; Feng, Y.; Sun, Z.; Li, X.; Yang, X. Transit signal priority enabling connected and automated buses to cut through traffic. IEEE Trans. Intell. Transp. 2022, 23, 8782–8792. [Google Scholar] [CrossRef]
- Guo, G.; Wang, Y. An integrated MPC and deep reinforcement learning approach to trams-priority active signal control. Control Eng. Pract. 2021, 110, 104758. [Google Scholar] [CrossRef]
- Shi, J.; Sun, Y.; Schonfeld, P.; Qi, J. Joint optimization of tram timetables and signal timing adjustments at intersections. Transp. Res. C-Emer. 2017, 83, 104–119. [Google Scholar] [CrossRef]
- Ji, Y.; Tang, Y.; Du, Y.; Zhang, X. Coordinated optimization of tram trajectories with arterial signal timing resynchronization. Transp. Res. C-Emer. 2019, 99, 53–66. [Google Scholar] [CrossRef]
- Ou, D.; Yan, H.; Li, H.; Li, W. Optimization of conflicting tram signal priority requests based on spatiotemporal interlocking logic using microscopic simulation. Int. J. Softw. Eng. Know. 2018, 28, 507–522. [Google Scholar] [CrossRef]
- Su, S.; Li, X.; Tang, T.; Gao, Z. A subway train timetable optimization approach based on energy-efficient operation strategy. IEEE Trans. Intell. Transp. 2013, 14, 883–893. [Google Scholar] [CrossRef]
- Xu, X.; Li, K.; Li, X. A multi-objective subway timetable optimization approach with minimum passenger time and energy consumption. J. Adv. Transp. 2016, 50, 69–95. [Google Scholar] [CrossRef]
- Canca, D.; Zarzo, A. Design of energy efficient timetables in two-way railway rapid transit lines. Transp. Res. B-Meth. 2017, 102, 142–161. [Google Scholar] [CrossRef]
- Zhang, H.; Jia, L.; Wang, L.; Xu, X. Energy consumption optimization of train operation for railway systems: Algorithm development and real-world case study. J. Clean. Prod. 2019, 214, 1024–1037. [Google Scholar] [CrossRef]
- Lu, S.; Hillmansen, S.; Ho, T.; Roberts, C. Single-train trajectory optimization. IEEE Trans. Intell. Transp. 2013, 14, 43–50. [Google Scholar] [CrossRef]
- Zhang, L.; Zhuan, X. Braking-penalized receding horizon control of heavy-haul trains. IEEE Trans. Intell. Transp. 2013, 14, 1620–1628. [Google Scholar] [CrossRef]
- Zhang, L.; Zhuan, X. Optimal operation of heavy-haul trains equipped with electronically controlled pneumatic brake systems using model predictive control methodology. IEEE Trans. Control Syst. Technol. 2014, 22, 13–22. [Google Scholar] [CrossRef]
- Zhang, L.; Zhuan, X. Development of an optimal operation approach in the MPC framework for heavy-haul trains. IEEE Trans. Intell. Transp. 2015, 16, 1391–1400. [Google Scholar] [CrossRef]
- Guo, G.; Yang, D.; Zhang, R. Distributed trajectory optimization and platooning of vehicles to guarantee smooth traffic flow. IEEE Trans. Intell. Vehicl. 2022, in press. [Google Scholar] [CrossRef]
- Guo, G.; Zhao, Z.; Zhang, R. Distributed trajectory optimization and fixed-time tracking control of a group of connected. IEEE Trans. Veh. Technol. 2022, in press. [Google Scholar] [CrossRef]
- Ye, F.; Hao, P.; Qi, X.; Wu, G.; Boriboonsomsin, K.; Barth, M. Prediction-based eco-approach and departure at signalized intersections with speed forecasting on preceding vehicles. IEEE Trans. Intell. Transp. 2019, 20, 1378–1389. [Google Scholar] [CrossRef]
- Dong, C.; Wang, H.; Li, Y.; Liu, Y.; Chen, Q. Economic comparison between vehicle-to-vehicle (V2V) and vehicle-to-infrastructure (V2I) at freeway on-ramps based on microscopic simulations. IET Intell. Transp. Syst. 2019, 13, 1726–1735. [Google Scholar] [CrossRef]
- Lin, Q.; Li, S.; Xu, S.; Du, X.; Yang, D.; Li, K. Eco-driving operation of connected vehicle with V2I communication among multiple signalized intersections. IEEE Intel. Transp. Syst. Mag. 2021, 13, 107–119. [Google Scholar] [CrossRef]
- Outay, F.; Kamoun, F.; Kaisser, F.; Alterri, D.; Yasar, A. V2V and V2I communications for traffic safety and CO2 emission reduction: A performance evaluation. Procedia Computer Sci. 2019, 151, 353–360. [Google Scholar] [CrossRef]
- Wang, C.; Wang, Y.; Peeta, S. Cooperative roundabout control strategy for connected and autonomous vehicles. Appl. Sci. 2022, 12, 12678. [Google Scholar] [CrossRef]
- Alsabaan, M.; Naik, K.; Khalifa, T. Optimization of fuel cost and emissions using V2V communication. IEEE Trans. Intell. Transp. Syst. 2013, 14, 1449–1461. [Google Scholar] [CrossRef]
- Yu, C.; Feng, Y.; Liu, H.; Ma, W.; Yang, X. Integrated optimization of traffic signals and vehicle trajectories at isolated urban intersections. Transp. Res. B-Meth. 2018, 112, 89–112. [Google Scholar] [CrossRef]
- Guo, G.; Li, D. PMP-based set-point optimization and sliding-mode control of vehicular platoons. IEEE Trans. Comput. Soc. Sy. 2018, 5, 553–562. [Google Scholar] [CrossRef]
- Scheepmakerg, G.; Goverde, R.; Kroon, L. Review of energy-efficient train control and timetabling. Eur. J. Oper. Res. 2017, 257, 355–376. [Google Scholar] [CrossRef]
- Homchaudhuri, B.; Vahidi, A.; Pisu, P. Fast model predictive control-based fuel efficient control strategy for a group of connected vehicles in urban road conditions. IEEE Trans. Control Syst. Technol. 2017, 25, 760–767. [Google Scholar] [CrossRef]
- Song, C.; Jia, H. Multi-State car-following behavior simulation in a mixed traffic flow for ICVs and MDVs. Sustainability 2022, 14, 13562. [Google Scholar] [CrossRef]
- Zhao, Q.; Chen, Q.; Wang, L. Real-time prediction of fuel consumption based on digital map API. Appl. Sci. 2019, 9, 1369. [Google Scholar] [CrossRef]
- Tang, L.; Ariano, A.; Xu, X.; Li, Y.; Ding, X.; Sama, M. Scheduling local and express trains in suburban rail transit lines: Mixed–integer nonlinear programming and adaptive genetic algorithm. Comput. Oper. Res. 2021, 135, 105436. [Google Scholar] [CrossRef]
- Kwong, I.; Nourinejad, M.; Shalaby, A. Existing Problems of Transit Signal Priority on Streetcar Routes. Transp. Res. Rec. 2020, 2674, 861–873. [Google Scholar] [CrossRef]


Disclaimer/Publisher’s Note: The statements, opinions and data contained in all publications are solely those of the individual author(s) and contributor(s) and not of MDPI and/or the editor(s). MDPI and/or the editor(s) disclaim responsibility for any injury to people or property resulting from any ideas, methods, instructions or products referred to in the content. |
© 2023 by the authors. Licensee MDPI, Basel, Switzerland. This article is an open access article distributed under the terms and conditions of the Creative Commons Attribution (CC BY) license (https://creativecommons.org/licenses/by/4.0/).