Article

Use of Syzygium aromaticum L. Fermented Plant Extract to Enhance Antioxidant Potential: Fermentation Kinetics

by
Edyta Kucharska
1,*,
Martyna Zagórska-Dziok
2,
Paweł Bilewicz
3,
Sebastian Kowalczyk
3 and
Robert Pełech
1
1
Department of Chemical Organic Technology and Polymeric Materials, Faculty of Chemical Technology and Engineering, West Pomeranian University of Technology in Szczecin, 10 Pulaski Street, 70-322 Szczecin, Poland
2
Department of Technology of Cosmetic and Pharmaceutical Products, Medical College, University of Information Technology and Management in Rzeszow, 35-225 Rzeszów, Poland
3
Dancoal Sp. z o.o., 35 Prosta Street, 72-100 Goleniów, Poland
*
Author to whom correspondence should be addressed.
Appl. Sci. 2024, 14(11), 4900; https://doi.org/10.3390/app14114900
Submission received: 30 April 2024 / Revised: 28 May 2024 / Accepted: 3 June 2024 / Published: 5 June 2024

Abstract

:
The concept of our research is related to the use of stems from S. aromaticum L. in the fermentation process in order to obtain new cosmetic raw materials with high antioxidant potential that are safe for human fibroblasts (HDFs) and keratinocytes (HaCaTs). This evaluation involves treating cell lines with different concentrations of fermented extracts to establish a noncytotoxic dose range. The focus was on evaluating antioxidant activity (AA), total polyphenol content (TPC), and lactic acid efficiency (LAe). For this purpose, the most favourable technological parameters of the fermentation process of stems were determined, including the type of microorganisms, initial sugar content, plant raw material content, and fermentation time. In the present study, lactic acid was obtained with maximum efficiency by stem fermentation in the presence of lactic acid bacteria (LAB) and molasses as a source of six-carbon sugars. In addition, fermentation kinetics was investigated, the essence of which was to identify the technological parameters that allow the highest values of the main functions describing the process (AA, TPC LAe). Two kinetic models were used to determine the kinetics of process function changes during fermentation. The most favourable fermentation conditions for maximum antioxidant activity (26.88 mmol Tx/L ± 0.19), total polyphenol content (5.96 mmol GA/L ± 0.19), and lactic acid efficiency (88% ± 1) were: type of microorganism L. rhamnosus MI-0272, initial sugar content 3.20%, plant raw material content 6.40%, and a fermentation time of 9 days. The values of chelating activity (ChA), AA, and TPC in the fermented stems increased more than two-fold compared to the non-fermented extracts. Reducing activity (RA) and LAe increased to 46.22 mmol Fe3+/L ± 0.29 and 88% ± 1, respectively. Of the kinetic models adopted, follow-up reaction equations and first-order equations best described the time-dependent changes taking place. This study shows that the process function values of AA and LAe are dependent on the LAB strain and the content of the plant material, and the rate of change of TPC may largely depend on the forms of phenolic compounds formed during fermentation.

1. Introduction

Advances in biological research have shown the extraordinary potential of plant extracts (PEs) as important cosmetic raw materials for use in cosmetic formulations. PEs are obtained by isolating the necessary bioactive components from the plant material using processes such as maceration, solvent extraction, supercritical fluid extraction, or Soxhlet extraction [1]. Fermented plant extracts (FPEs) have recently been exploited as new cosmetic raw materials due to their antioxidant, anti-ageing, moisturising, and anti-allergenic characteristics, as well as increased bioactivity, biocompatibility, and bioavailability [2,3,4,5,6,7]. Obtaining FPEs entails not only removing the necessary bioactive components from plant material but also degrading or transforming undesired substrata into acceptable products via the activity of suitable microbes. Microorganisms break down plant components in plant materials, enhancing their biological activity by turning high-molecular molecules into low-molecular structures. The structural breakdown of the cell walls of plant raw materials and the hydrolytic activity of microorganisms during the fermentation increases the concentration of anthocyanins, flavonoids, organic acids, proteins, ceramides, amino acids, or biological enzymes [8]. During fermentation, bacteria and fungi may produce antioxidants by enzymatically converting phenolic glycosides found in plant source materials into free polyphenols [6,7,9,10,11].
Blueberry fruit fermentation in the presence of lactic acid bacteria (LAB) Lactobacillus plantarum and fermented, as well as black tea with kombucha, both indicate the existence of phenolic components in (fermented plant extracts) FPEs [12]. Polyphenols, including chlorogenic acid and caffeoyl derivatives, as well as flavonoids, may suggest the biological potential of yerba mate’s FPE for dermatological uses [13]. Polyphenolic compounds (a class of plant-derived chemicals having a phenolic structure) have piqued the interest of the beauty industry due to the multiple health advantages associated with their antioxidant and anti-inflammatory properties [2,14]. Polyphenols scavenge free radicals, neutralising their detrimental effects and decreasing oxidative stress in the body while also lowering risk factors for chronic illnesses such as cardiovascular disease and some malignancies [1,15]. In the presence of Pediococcus acidilactici (KCCM 11614), the fermented plant extract from Magnolia denudata flowers showed more anticancer activity against human gastric adenocarcinoma (AGS) and human colon cancer LoVo cells than the unfermented plant extract [16]. Plant extracts produced through the fermentation of Rhus verniciflua bark shown anticancer efficacy against the colon cancer cell line HCT-116, as well as the potential to trigger apoptosis and block the hedgehog pathway [17]. Ophiopogon japonicas extract fermented with the fungus Cordyceps militaris (first fermentation for 10 days) and then fermented with a mixture of bacterial strains Lactobacillus plantarum, Enterococcus faecium, and Bifidobacterium longum (second fermentation for 2 days) can prevent cardiovascular diseases associated with vascular smooth muscle cell proliferation and migration [2,16,18]. Furthermore, the fermented plant extract produced from ginseng in the presence of Aspergillus usamii KCTC 6954 demonstrated stronger anticancer activity against human hepatoma cells (HepG2s) and the human colon cancer cell line (DLD-1) than the unfermented ginseng extract. Ginseng extract was treated with β-glucosidase from Aspergillus usamii KCTC 6954 due to the fact that this enzyme is capable of converting major ginsenosides into minor ginsenosides. The fermentation process increased the concentration of smaller ginsenosides, enhancing the anticancer effect of the fermented ginseng plant extract compared to the non-fermented extract [14,19].
Lactic acid is a metabolite generated by lactic acid bacteria in the presence of carbohydrates, especially six-carbon sugars such as glucose or sucrose [20]. The most desired in commercial production are the enantiomers L(+) of lactic acid, which is primarily generated by homofermentative lactic fermentation bacteria of the Lactobacillus genus [21]. Lactic acid has traditionally been employed in the preparation of meat, fruit, and vegetables due to its powerful preservation effect; however, lately, it has gained popularity in the cosmetic business [22]. Its distinctive action is to acidify the environment since a low pH prevents the growth of unwanted microflora in food and cosmetic items [23].
Syzygium aromaticum L. belongs to the Myrtaceae family, which includes more than 3000 species and about 150 genera, such as the myrtle, eucalyptus, clove, and guava families. A review of the literature showed the high biological activity of essential oils and extracts obtained from most Myrtaceae species [24,25,26,27,28,29,30,31,32,33,34,35,36]. The oils and extracts from Acca sellowiana, Blepharocalyx salicifolius, Calyptranthes lucida, C. pallens, Eugenia acapulcensis, E. bacopari, E. beaurepaireana, E. brasiliensis, E. chlorophylla, E. pluriflora, E. umbelliflora, E. stipitata ssp. sororia, E. uruguayensis, and E. uniflora were found to have antibacterial properties. This was because they contained phenolics (eugenol and eugenol acetate) and terpenes (β-caryophyllene and α-humulene). Antioxidant (Campomanesia xanthocarpa, E. involucrata, E. uniflora, P. cattleyanum), antinociceptive (P. guajava, P. pohlianum, E. uniflora), anti-inflammatory (E. jambolana, Psidium cattleyanum), and analgesic (P. guianense) properties were also shown by some Myrtaceae species. Extracts obtained from plants of the Myrtaceae family (myrtle, eucalyptus, and clove) effectively inhibit the growth of Gram-negative and Gram-positive bacteria (S. marcescens, P. aeruginosa, Streptococcus sanguinis, Streptococcus mitis, Fusobacterium nucleatum, Escherichia coli, Staphylococcus aureus, S. marcescens, P. aeruginosa, Corynebacterium bovis, Corynebacterium striatum, and Corynebacterium jeikeium), which cause skin infections, tooth decay, and food spoilage. These results demonstrate the enormous potential of the Myrtaceae family [24,25,26,27,28,29,30,31,32,33,34,35,36].
The buds of the clove tree yield two principal products: cloves (S. aromaticum L.)—rich in essential oil—and eugenol (4-allyl-2-methoxyphenol), the main ingredient of clove oil. Currently, cloves are used in both the spice industry and the traditional Indonesian cigarette market, the kretek. The essential oil extract is utilised for plasticising, anaesthetic, antibacterial, and organoleptic qualities, which are used in cosmetics, dentistry, and the agro-food industries [34,37,38,39]. Because of its qualities, the oil has a wide range of uses, particularly in the pharmaceutical business (as a component in warming and analgesic ointments) and dentistry (as an ingredient in analgesic preparations, dental cavity fillings, mouth and gum rinses, and toothpaste) [34,37,40]. High antimicrobial and antioxidant activity classify eugenol as an absorption promoter [37,38]. Eugenol also has a positive effect on the complexion of people with acne and psoriasis, which is why it is recommended in cosmetic formulas designed for acne skin care, as it reduces the appearance of lesions and accelerates the healing of existing ones [37,38,41,42,43,44].
The presented research is related to the development of the most favourable process conditions for the fermentation of stems from S. aromaticum L. using lactic acid bacteria (LAB) and beet molasses (which is a valuable source of six-carbon sugars) to obtain fermented plant extracts (FPEs). Molasses, which is a by-product obtained in the production of sucrose from sugar beet, is a relatively cheap, readily available raw material and can be used to produce lactic acid by fermentation (eliminating the need for sugar). The evaluation of the influence of the type of microorganisms, initial sugar content, plant raw material content, and fermentation time aims to maximise the efficiency of the process towards the highest values of antioxidant activity (AA) of the fermented plant extracts, total polyphenol content (TPC), and lactic acid yield (LAe). A comparative analysis of the activities obtained between fermented and non-fermented extracts is also important. Moreover, the course of fermentation has been described in the form of kinetic models (by means of the corresponding follow-up reaction equations and first-order reactions) in order to obtain the cosmetic raw material included in topical preparations. Furthermore, in vitro tests conducted on human keratinocytes (HaCaTs) and fibroblasts (HDFs) enabled the bioactivity of extracts from S. aromaticum L. to be assessed, focusing on cell viability and establishing a non-cytotoxic dose range.

2. Materials and Methods

2.1. Materials

The ground stems of Syzygium aromaticum L. (average grain size less than 250 µm) were commercial samples, which were purchased from the Aromatika Adam Iwańczuk herbal shop (Hajnówka, Poland). The raw material had an average granularity of less than 250 µm. The beet molasses came from “Cukrownia Kluczewo” Stargard (Poland). DPPH (2,2-diphenyl-1-picrylhydrazyl) and Trolox (6-hydroxy-2,5,7,8-tetramethylchroman-2carboxylic acid, Tx) were obtained from Sigma Aldrich. Merck, Darmstadt (Germany) provided the Folin–Ciocalteu phenol reagent, iron II sulphate heptahydrate, iron II sulphate VI, ferrozine, iron III chloride, and gallic acid. OXOID (M.R.S. BROTH, Rogosa, Sharpe) supplied a lactic acid bacteria medium (CM0359, a non-selective medium for the abundant growth of lactic acid bacteria). Probiotics (Novara, Italy) provided the lactic acid bacteria strains Lactobacillus salivarius LY_0652, Lactobacillus reuteri MI_0168, Lactobacillus acidophilus MI-0078, Lactobacillus brevis LY_1120, Lactobacillus plantarum MI-0102, and Lactobacillus rhamnosus MI-0272. Lipase AY30 was obtained from Thermo Scientific (Białystok, Poland). Chempur (Piekary Śląskie, Poland) provided octane, methanol, and ethanol (96%).

2.2. Preparations of Fermented Stems Extract (FSE)

Fermenting S. aromaticum L. stems in the presence of lactic acid bacteria yielded new fermented plant extracts (FSEs). The raw material for lactic acid production was beet molasses, a by-product of the sugar industry. The total content of 6-carbon sugars (Brix) in the molasses was evaluated using a refractometer (KRUSS Optronic DR301-95, A. Kruss Optronic GmbH, Hamburg, Germany). The process uses beet molasses, eliminating the need for mineral salts such as (NH4)2SO4, CaCl2, and KH2PO4, which was necessary in the case of fermentations using sugar cane molasses [3,45]. Preliminary tests have confirmed the activity of molasses in the fermentation process. For this objective, molasses aqueous solutions were fermented with 3.20% inoculum (content determined based on previous experiments) but without mineral salts. The inoculum was a mixture of six strains of lactic acid bacteria: L. reuteri MI_0168, L. salivarius LY_0652, L. brevis LY_1120, L. acidophilus MI-0078, L. rhamnosus MI-0272, and L. plantarum MI-0102 [3]. Preliminary studies have shown that beet molasses contains sufficient nitrogen and phosphorus, necessary for the production of lactic acid [46]. This nitrogen is mainly represented by amino acids such as glutamic acid, aspartic acid, and alanine, and also by ammonium salts [47,48]. Adequate growth of lactic acid was observed in all molasses solutions to a similar extent to fermentations carried out in the presence of certified cane molasses requiring the additional use of mineral salts such as ammonium sulphate (0.64%), calcium chloride, and potassium dihydrogen phosphate (0.32%) [3].
Next, the stems were fermented with lactic acid bacteria. The fermentation was carried out until the maximum level of lactic acid (LA) was attained, the concentration of which was monitored using the GC-MS technique. The amount of total polyphenol content (TPC) was also measured during fermentation. Polyphenolic glucosides found in stems were transformed into more bioactive compounds (anthocyanin glucosides to aglycone forms and free phenolic acids), resulting in greater phenolic content in fermented plant extracts. In addition, the simpler structure of the derived metabolites contributes to the higher antioxidant activity of FSEs, with an increase in the ability to reduce DPPH radicals, relative to non-fermented extracts [49]. In addition to the plant matrix, the kind of LAB strain utilised influences the bioavailability of phenolic chemicals. Therefore, the fermentation of stems was carried out using six distinct LAB strains: L. reuteri MI_0168, L. salivarius LY_0652, L. brevis LY_1120, L. acidophilus MI-0078, L. rhamnosus MI-0272, and L. plantarum MI-0102.
The inoculum was prepared according to a previously developed methodology [3]. The following raw materials were placed in a 500 mL conical flask: beet molasses (the amount of which was controlled depending on the process parameter under study, while maintaining an initial sugar content of 1.60–4.60%), distilled water, plant material constituting stems (the amount of which was controlled depending on the process parameter under study, while maintaining content of 0.032–12.80%), and inoculum (3.20%). The contents of the flask were stirred until the molasses was entirely dissolved, after which the fermentation process began (at a temperature of 37.5 °C) for the proper duration. During the fermentation process, samples were collected and tested for lactic acid concentration (GC-MS) and also performed determinations for levels of phenolic compounds (spectrophotometric method utilising the Folin–Ciocalteu technique). Fermentation was carried out until the highest lactic acid yield (LAe) was obtained.
Fermentations were completed by performing two independent experiments. After the process was completed, lipase was added to hydrolyse the bacterial cell wall. The presence of lipase in the fermentation medium inhibits the further growth of LAB, thus inhibiting the fermentation process and inactivating bacterial growth, which is typical when conducting fermentation in the presence of microorganisms [3]. The obtained fermented plant extract was subjected to 3-stage filtration: 1. initially, the FSE underwent filtration using a glass funnel (to separate the plant material from the fermented plant extract); 2. subsequently, the FSE underwent centrifugation using a centrifuge (5 min, 166 Hz, 10,000 g) in order to separate the LAB cells present in the FSE; 3. ultimately, the FSE that had undergone extra filtration and centrifugation was further filtered using sterile syringe filters with a pore size of 0.45 µm (intended for sterilising filtration of aqueous solutions) in order to completely eliminate microorganisms from the fermented plant extract. This method eliminated bacteria from the fermented plant extract [3]. The quantity of extract collected and filtered was about 110–120 mL. The FSE were maintained frozen at −15 °C.

2.3. Determination of Antioxidant Activity: DPPH Assay

The DPPH free radical reduction method was used to assess the antioxidant capability of the FSEs obtained [37]. The investigations were performed using Thermo Scientific GENESYS 50 apparatus at λ = 517 nm. Trolox (Tx) was used as a reference compound.
The antioxidant activity of the FSEs was measured as follows: 2850 µL ethanolic solution of the DPPH radical (a concentration of 0.3 mmol/L) of absorbance about 1.000 ± 0.020 (at λ = 517 nm) was placed in a tube and 150 µL of appropriate extract was added. Blank samples without FSE were prepared in the same way, using distilled water in an amount of 150 µL. The tubes were wrapped in aluminium foil, sealed with a stopper, and incubated for 10 min at room temperature. Three independent tests were conducted. The antioxidant activity was expressed as mmol Tx/L FSE, based on the calibration curve y = −1.0321x + 1.1342, R2 = 0.997.

2.4. Determination of Total Polyphenols Content: Folin–Ciocalteu Method

The Folin–Ciocalteu technique (VWR, Suwanee, GA, USA) was used to assess the total polyphenol content of FSEs [37]. The investigations were performed using the Thermo Scientific GENESYS 50 apparatus (Thermo Fisher Scientific, Norristown, PA, USA) at λ = 750 nm. Gallic acid (GA) was used as a reference compound. TPC was expressed as mmol GA/L of FSE using the calibration curve for gallic acid (y = 0.0075x, R2 = 0.997).
The total polyphenol content of the FSEs was measured in the following way: In 10 mL flasks, 2000 µL of Folin–Ciocalteu reagent, 100 µL of suitable extract, and 1000 µL of saturated aqueous Na2CO3 were added. The flasks were filled to the mark with distilled water, closed tightly with a stopper, and incubated at ambient temperature for 15 min. The absorbance of the test solutions was measured at a wavelength of λ = 750 nm. Blank samples without the presence of FSE were prepared in the same way, using distilled water in an amount of 100 µL. Three independent tests were conducted.
The total polyphenol content was calculated using the following Formula (1):
T P C = C F A t . s . C F A b . s . · V s V F S E · 100 %
where:
TPC—total polyphenol content by F-C method [mmol/L],
CFAt.s.—concentration of phenolic acids in the tested sample [mmol/L],
CFAb.s.—concentration of phenolic acids in the blank sample [mmol/L],
Vs—total volume of solution introduced into volumetric flasks [L],
VFSE—volume of FSE introduced into volumetric flasks [L].

2.5. Determination of Lactic Acid by GC-MS

The GC-MS analysis was performed using a Shimadzu GCMS-QP2020 NX (Shimadzu, San Jose, CA, USA) with a Shimadzu SH-I-5MS column (30 m × 0.25 mm × 0.25 μm). The column temperature was maintained at 40 °C for 2 min before being programmed to 280 °C at a rate of 15 °C per minute. Helium’s flow rate as a carrier gas is 35 cm/s (1 µL/min). MS were taken at 70 eV with split 10. The analysis duration was 17 min, and the sample volume was 1 µL. Lactic acid generated during the fermentation process was identified by comparing mass spectra from the spectra library (NIST2020, Gaithersburg, MD, USA) to the LA benchmark employed [3]. The concentration of lactic acid in FSEs was calculated using the internal standard method (octane) and the obtained calibration curve: CLA= (1.518 × SLA + 1568)/SO, R2 = 0.9971, where: A—slope, B—intercept, CLA—lactic acid concentration [%], SLA and SO—lactic acid and octane peak area. All samples were tested three times. The results are shown as the mean ± SD.

2.6. Fermentation of Stems in the Presence of Lactic Acid Bacteria

A study of the influence of technological parameters on the fermentation process of stems was conducted (Table 1). The influence of the following process parameters was studied: type of microorganism, initial sugar content, plant raw material content, and fermentation time (Table 1). The most favourable technological parameters were selected based on the values of the main functions describing the process, such as antioxidant activity (AA), total polyphenol content (TPC), and lactic acid efficiency (LAe).

2.7. Kinetic Modelling

To understand the kinetics of changes in lactic acid yield (Lae) in this study, a mathematical model was adopted that follows the kinetics of the subsequent reaction. The use of this model has been widely adopted to describe bio-processes, especially processes describing the formation of lactic acid [14,50].
In the first stage of conducting stem fermentation in the presence of LAB and molasses (which is a source of 6-carbon sugars), the sugars are bio-transformed to lactic acid, after which the LA formed is then bio-transformed to the corresponding metabolites. In a simplified way, the course of lactic acid formation and disappearance is described in Equation (2) below:
S u g k 1 L A k 2 M e t
where:
Sug—sugar,
LA—lactic acid,
Met—metabolite.
The following Equation (3) describes changes in lactic acid efficiency (YLA) during the fermentation process (3):
Y L A = 100 % · k 1 k 2 k 1 · e x p k 1 · t e x p k 2 · t
where:
k1—lactic acid (LA) formation rate constant,
k2—lactic acid (LA) disappearance rate constant [day−1],
t—fermentation time [day].
The lactic acid efficiency variation (YLA) function reaches its maximum (tmax) at the point defined in Equation (4):
t m a x = l n k 2 k 1 k 2 k 1
where:
k1—lactic acid (LA) formation rate constant,
k2—lactic acid (LA) disappearance rate constant [day−1],
t—fermentation time [day].
The time (tmax) at which the lactic acid yield function reaches its maximum value was determined by calculating the reaction rate constants (k1 and k2), which were determined through nonlinear estimation using the computer programme STATISTICA 13.3.
In this study, we adopted a mathematical model for the kinetics of changes in antioxidant activity (AA) and total polyphenol content (TPC). This model mimics the kinetics of a first-order reversible reaction (5), for which the integral equation (Yi) takes the form shown in Equation (6).
R S k R + S
Y i = Y i e · 1 e x p k i · t
where:
Y—the corresponding parameter (AA or TPC),
k—reaction rate constant for an increase in the relevant parameter (AA or TPC),
The subscript e indicates the final (equilibrium) value.
The use of this model (based on mass exchange) has been widely adopted to describe the evaluation of the antioxidant activity of antioxidants [51,52].
Earnings (Xi) were defined as (7):
X i = Y i Y i 0 · V m
where:
m—mass of plant raw material [g],
V—volume of FSE [L],
Yi0—parameter values for time 0.
We assumed that the value Xi = Xi0 corresponds to a raw material content of 0.032%. We determined the contents of the components responsible for AA or TPC in the obtained FSEs after the fermentation process.
X i = X i 0 Y i Y i 0 · V m
The shape of the curves corresponds to the Langmuir adsorption equilibrium model (8):
X = X 0 b · Y 1 + b · Y

2.8. Cytotoxicity Analysis

2.8.1. Cell Culture

Cytotoxicity tests of FSE and SE from S. aromaticum L. were carried out on human fibroblasts (HDFs) and keratinocytes (HaCaTs) acquired from CLS Cell Lines Service (Eppelheim, Germany). Cells were cultivated in culture flasks in an incubator at 37 °C in a humidified environment containing 95% air and 5% carbon dioxide. Skin cells were cultured in Dulbecco’s Modified Essential Medium (DMEM medium; Biological Industries, Kibbutz Beit-Haemek, Israel) with the addition of the amino acid L-glutamine, 10% (v/v) Foetal Bovine Serum (FBS, Merck KGaA, Darmstadt, Germany), and 1% (v/v) antibiotic (100 U/mL penicillin and 1000 µg/mL streptomycin, Merck KGaA, Darmstadt, Germany). Cytotoxicity tests were conducted on cells grown in 96-well plates with a density of 1 × 10⁴ cells/well [53].

2.8.2. Alamar Blue (AB) Assay

The cytotoxicity of FSE and SE from S. aromaticum L. was determined using the capacity of keratinocytes and fibroblasts to decrease resazurin following exposure to the investigated samples. We used the methods previously published by Page et al. [41] with slight adjustments. Briefly, the cells were treated with FSE dissolved in DMEM culture media at doses of 0.1, 1.0, 2.5, 5.0, and 10.0% for 24 h. After aspiration, each well received a 60 µM resazurin solution (Merck KGaA, Darmstadt, Germany) and was incubated for two hours. Control cells were fibroblasts and keratinocytes that had not been exposed to FSE and were grown in DMEM. After 2 h, fluorescence was measured in individual wells at λ = 570 nm using a Filter Max UV–VIS spectrophotometer (Thermo Fisher Scientific, Waltham, MA, USA). As part of the analysis, three separate experiments were conducted, with each concentration of the analysed samples examined in triplicate.

2.8.3. Neutral Red (NR) Uptake Assay

Cytotoxicity studies were also carried out using a test that measured the absorption of neutral red dye through the lysosomes of keratinocytes and fibroblasts exposed to different doses of the tested FSE and SE. We conducted the study using the previously reported approach by Zagórska-Dziok et al. [54]. Briefly, cells were seeded in 96-well plates and incubated for 24 h with test samples dissolved in DMEM medium at concentrations of 0.1, 1.0, 2.5, 5.0, and 10.0%. After aspirating the materials, each well received 40 µg/mL of neutral red dye (Merck KGaA, Darmstadt, Germany) and was incubated for 2 h. The dye was then aspirated, and the cells were rinsed with sterile PBS. Next, we added 150 µL of destaining buffer (C2H5OH/CH3COOH/H2O, 50%/1%/49%) to each well and mixed for 5 min using an orbital shaker. After that, the absorbance at λ = 570 nm was measured using a Filter Max UV–VIS spectrophotometer (Thermo Fisher Scientific, Waltham, MA, USA). As part of the study, three separate experiments were carried out on each sample and evaluated in triplicate.

2.9. Reducing the Activity of Fe3+ to Fe2+

First, we prepared a calibration curve for Fe2+ ions using aqueous solutions of VI iron II sulphate (FeSO4). For this purpose, the following were introduced into 100 mL volumetric flasks: appropriate amounts of FeSO4 (so that the resulting concentrations of Fe2+ ions range from 0.5 to 5 mg/L) and 1 mg of ascorbic acid in order to reduce any Fe3+ ions in the sample present in the test sample. We fill the flasks to the mark with distilled water, close them snugly with a stopper, and agitate them to produce uniform solutions.
In the following step of the test, 1000 µL of the aqueous FeSO4 solution with ascorbic acid and 1000 µL of the aqueous ferrozine solution (with a concentration of 1 g/L) were added into glass test tubes. The tubes were closed tightly with a stopper and incubated at room temperature for 10 min, and then the absorbance of the test solutions was measured using a spectrophotometer at a wavelength of λ = 562 nm. Spectrophotometric analyses were carried out in triplicate using a Thermo Scientific GENESYS 50 instrument, obtaining a calibration curve for Fe2+ ions (y = 0.4888x + 0.0064; R2 = 0.999).
The capacity to reduce iron III ions to iron II using the ferrozine technique was assessed as follows: 1000 µL of aqueous FeCl3 solution (0.5 g/L Fe3+ concentration), 1 µL of FSE, and 1000 µL of aqueous ferrozine solution (1 g/L concentration) were put into glass tubes. The tubes are closed tightly with a stopper and incubated at room temperature for 10 min, and then the absorbance of the test solutions (λ = 562 nm) is measured using a spectrophotometer. The instrument was zeroed by adding 1000 µL of aqueous FeCl3 solution, 1 µL of distilled water, and 1000 µL of aqueous ferrozine solution as a reference.
We estimated the reduction activity (RA) of Fe3+ to Fe2+ using the following formula shown in Equation (2) [3]:
R A = C F e 2 + b . s . C F e 2 + t . s . · V s V F S E · 100 %
where:
RA—reduction activity of Fe3+ [mg/L],
CFe2+b.s.—concentration of Fe2+ ions in the blank sample [mg/L],
CFe2+t.s.—concentration of Fe2+ ions in the tested sample [mg/L],
Vs—total volume of solution introduced into volumetric flasks [L],
VFSE—volume of FSE introduced into volumetric flasks [L].

2.10. Chelating Activity of the Fe2+ Ion

The chelating capacity of Fe2+ was tested using the ferrozine method [55]. Metal ion chelation has a crucial role in the inhibition of reactive oxygen species production [56]. A calibration curve was prepared by utilising aqueous solutions of FeSO4 to measure Fe2+ ions. First, an initial FeSO4 solution with a Fe2+ content of 0.53 mmol/L was prepared. Next, a ferrozine initial solution (concentration of 3.2 mmol/L). Then, 1000 µL of the initial FeSO4 solution (final Fe concentrations of 3, 1.2, 0.6, and 0.3 mg/L) and 1000 µL of ferrozine were introduced into 10, 25, 50, and 100 mL volumetric flasks. The flasks were filled with distilled water, sealed firmly with a stopper, and left at room temperature for 10 min. The absorbance of the test solutions was measured using the Thermo Scientific GENESYS 50 equipment at the wavelength λ = 562 nm, resulting in a calibration curve for Fe2+ ions (y = 0.4888x + 0.0064, R2 = 0.999).
In the following step, 1000 µL of the initial FeSO4 solution, 100 µL of FSE, and 1000 µL of ferrozine were added to 10 mL volumetric flasks. The flasks were filled with distilled water, sealed tightly with a stopper, and allowed to incubate at room temperature for 10 min. The absorbance of the solutions was measured using a spectrophotometer at a wavelength of λ = 562 nm. Three independent tests were conducted.
The chelating activity (ChA) of Fe2+ ions was calculated using the following formula shown in Equation (3):
C h A = C F e 2 + b . s . C F e 2 + t . s . · V s V F S E · 100 %
where:
ChA—chelating activity of Fe2+ [mg/L],
CFe2+b.s.—concentration of Fe2+ ions in the blank sample [mg/L],
CFe2+t.s.—concentration of Fe2+ ions in the tested sample [mg/L],
Vs—total volume of solution introduced into volumetric flasks [L],
VFSE—volume of FSE introduced into volumetric flasks [L].
We used the same methods to evaluate the stems extract for comparison. The extraction of stems was carried out using the ultrasonic method. For this purpose, 20.0 g of ground plant material (in the amount of 6.40%) was introduced into 300 mL of distilled water, and extraction was carried out using an ultrasonic bath at 40 kHz (for 20 min at 40 °C), after which the extract obtained was filtered using a pressure funnel through a Whatman paper filter (EEA03).

2.11. GC-MS Analysis of FSE

The Gas Chromatography–Mass Spectrometry (GC-MS) analysis was performed using a Shimadzu GC-MS-QP2020 NX with a Shimadzu SH-I-5MS column (30 m × 0.25 mm × 0.25 μm). The column temperature was kept at 40 °C for 2 min, programmed to 300 °C at a rate of 10 °C /min, and kept constant at 300 °C for 2 min. The flow rate of helium as a carrier gas was 1 mL/min. MS were taken at 70 eV. The analysis duration was 28 min, and the sample volume was 1 µL. Identification of the major constituents of the FSE was made by comparison of their mass spectra located in the spectra library (NIST-2020).

3. Results

3.1. Studies of the Influence of Technological Parameters on Fermentation Stems and Kinetic Modelling

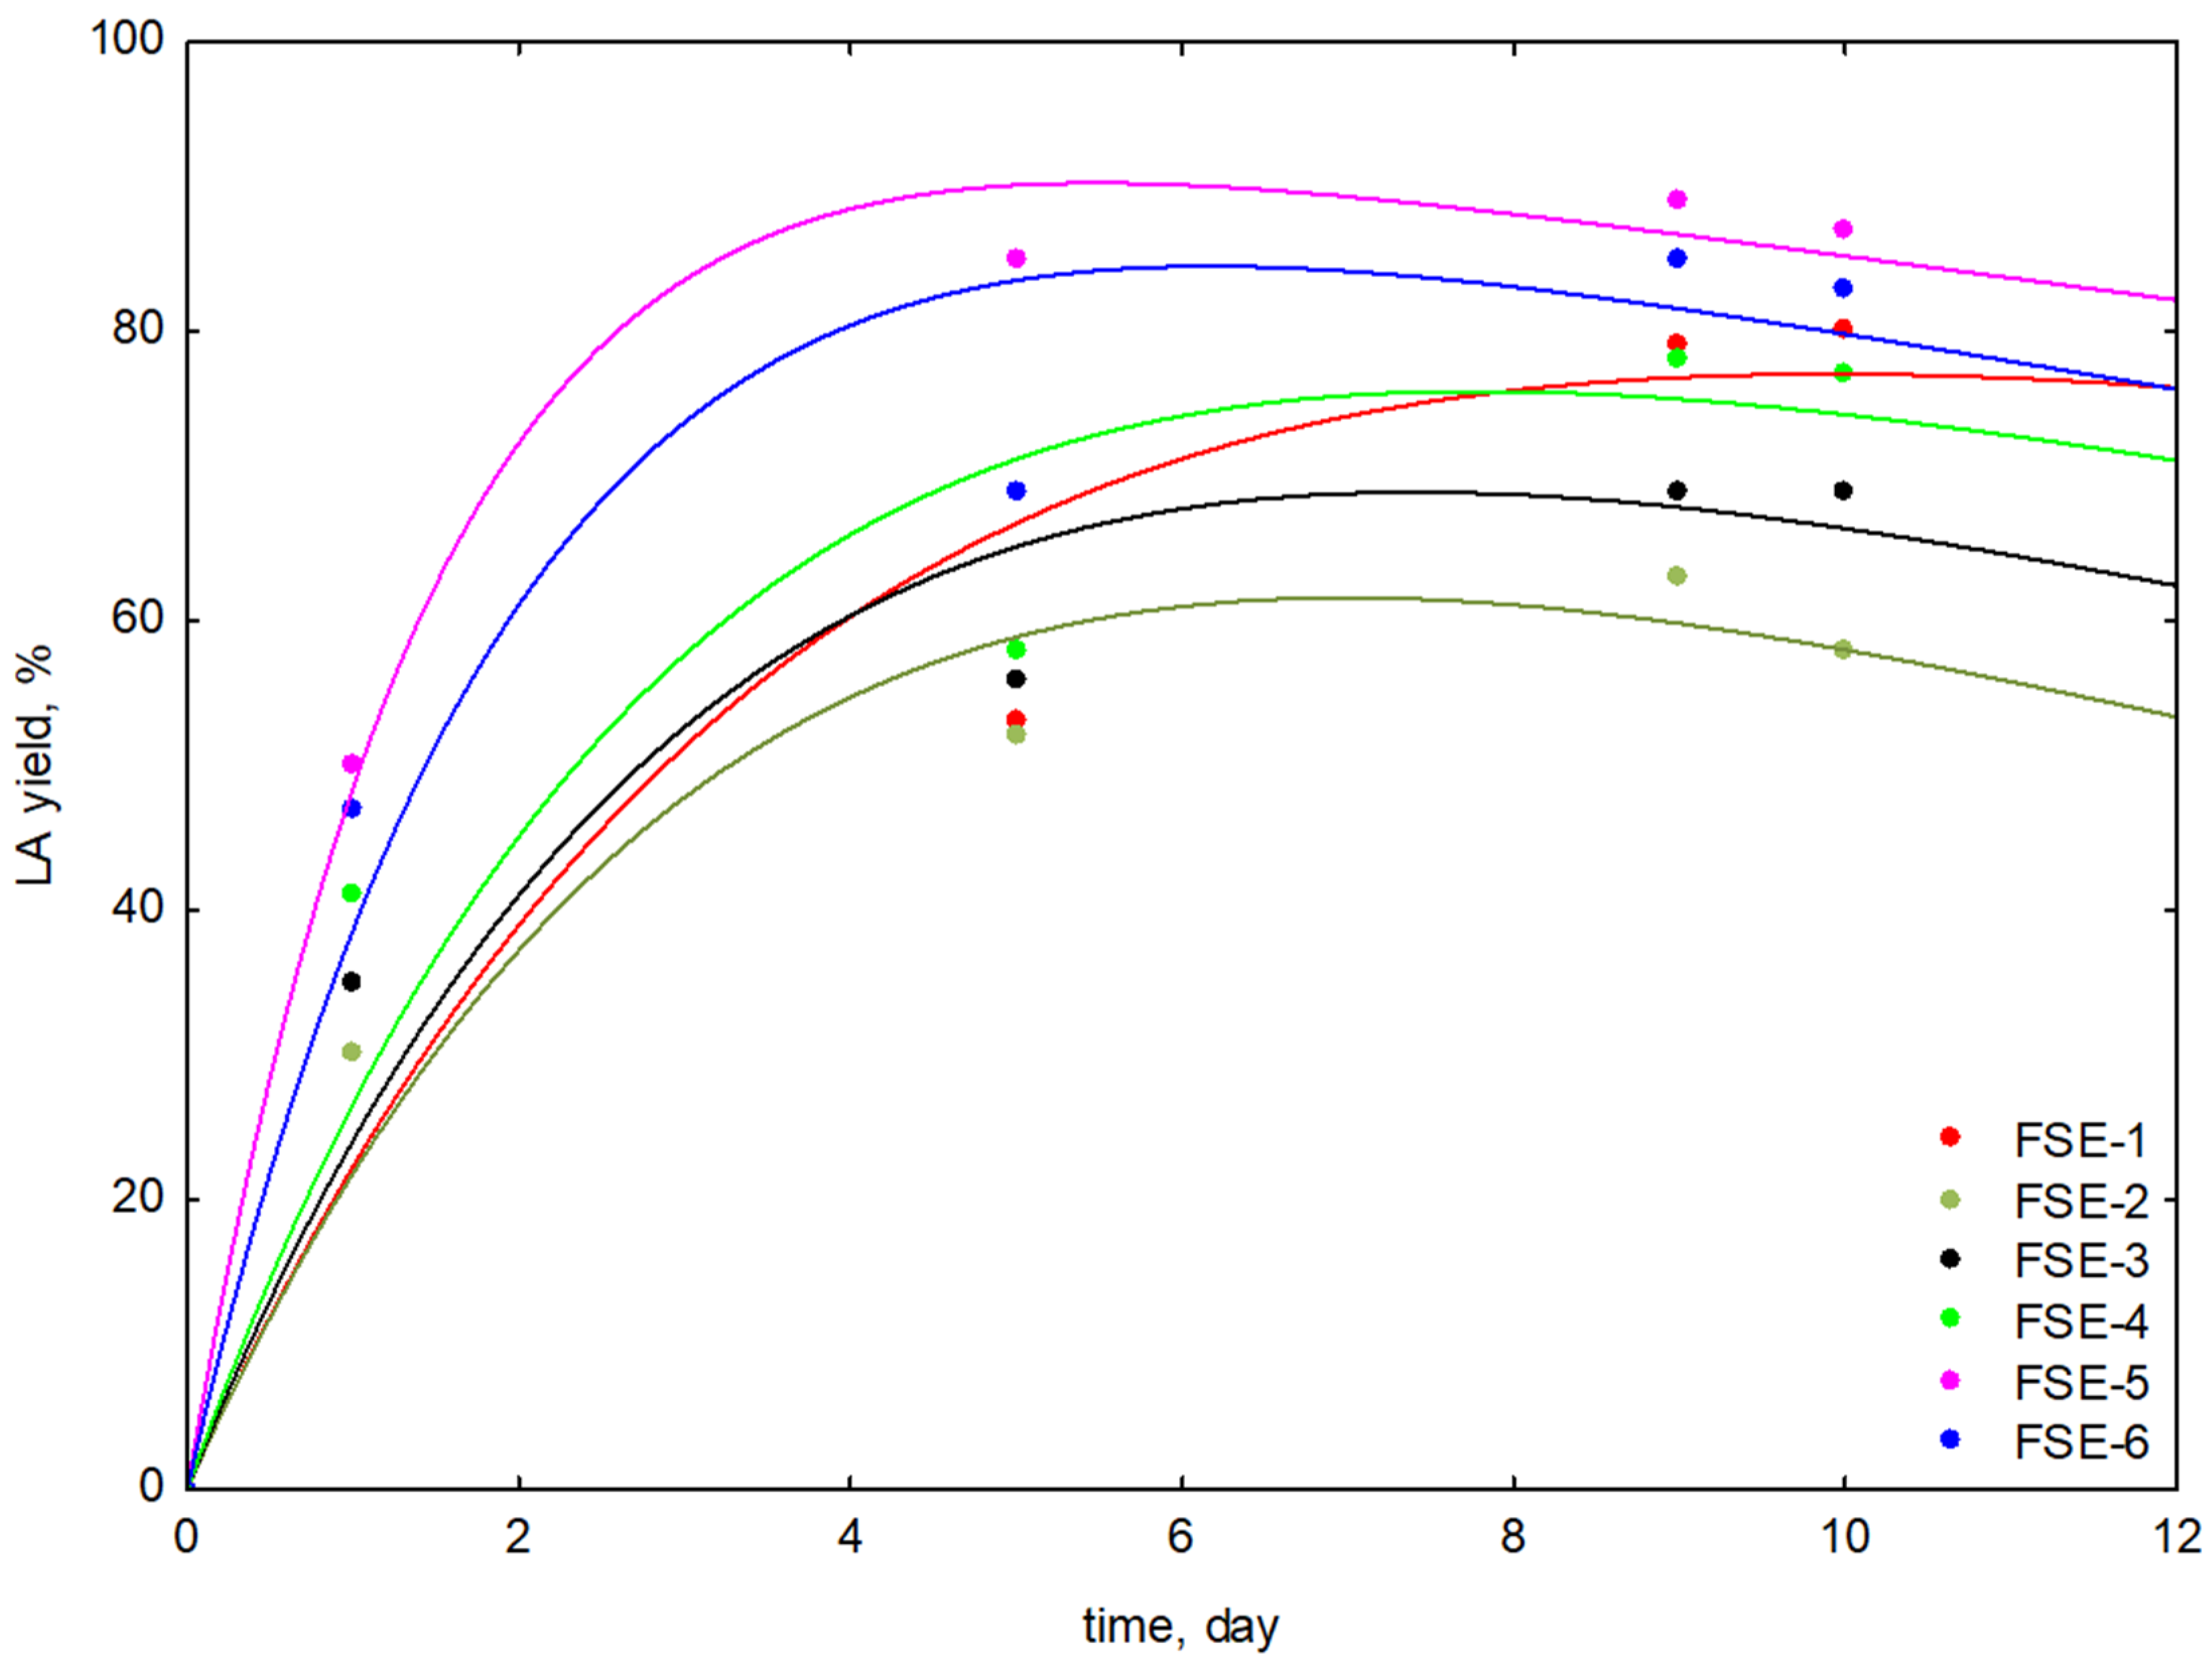
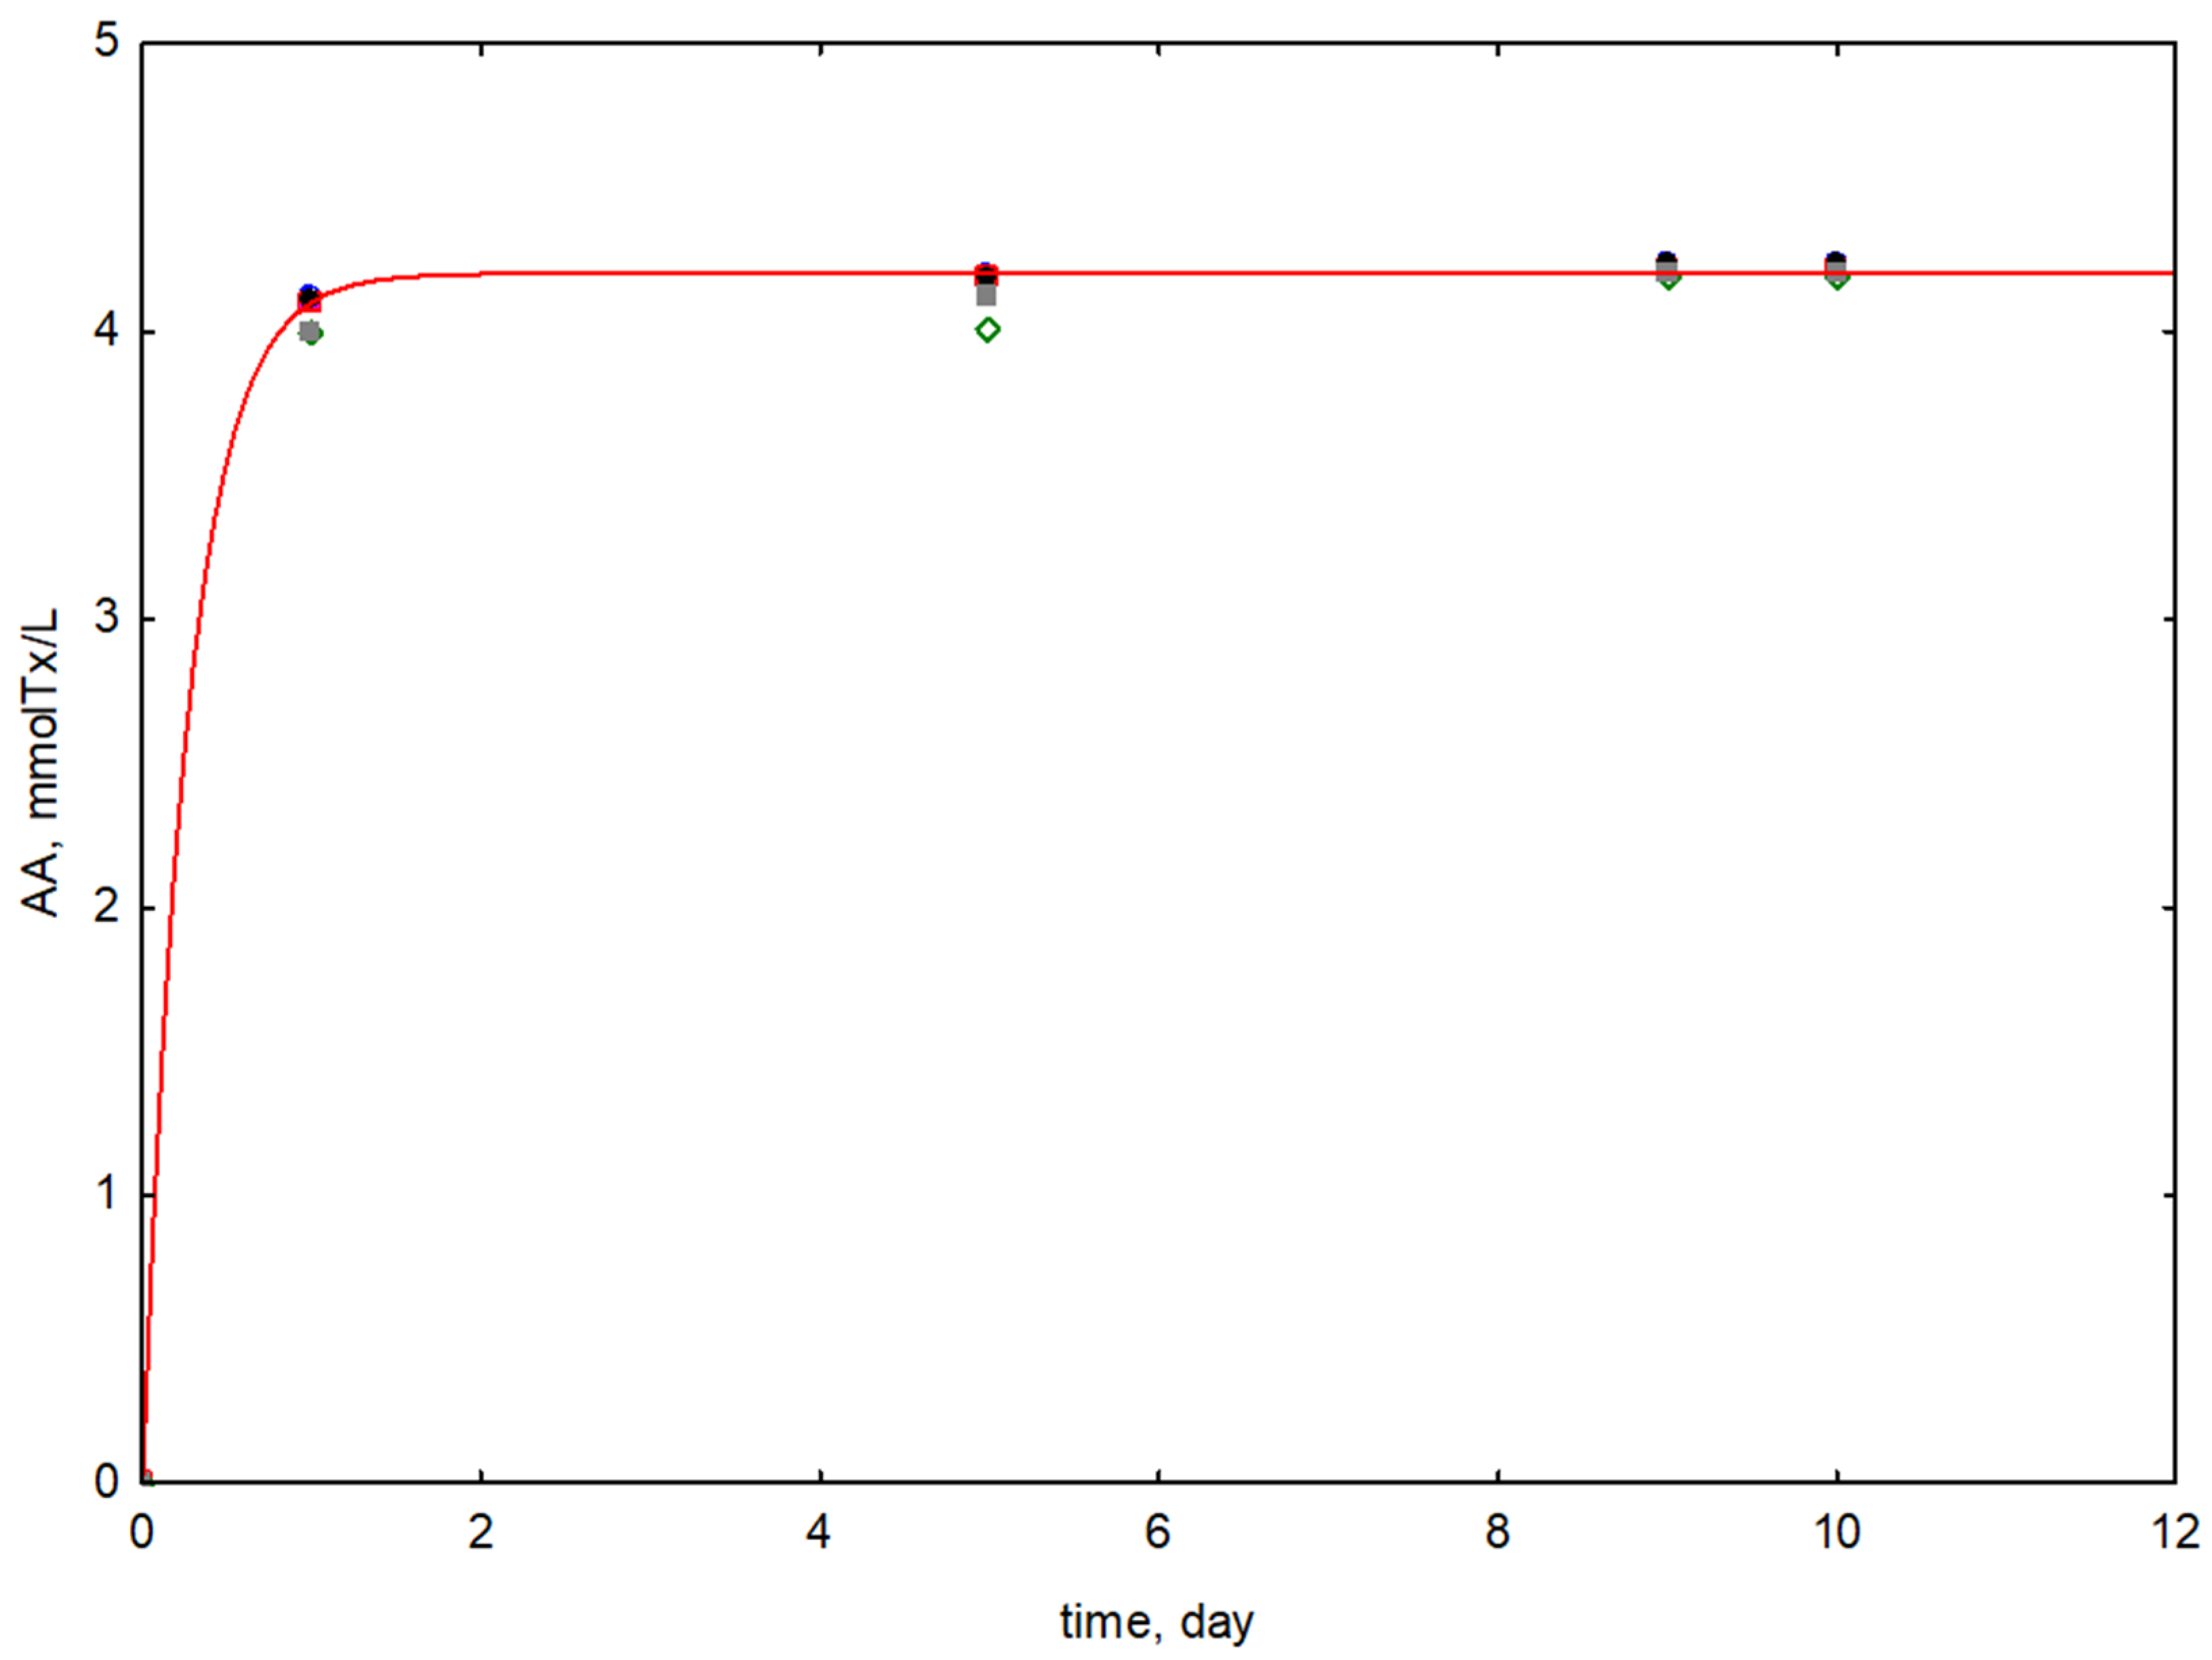
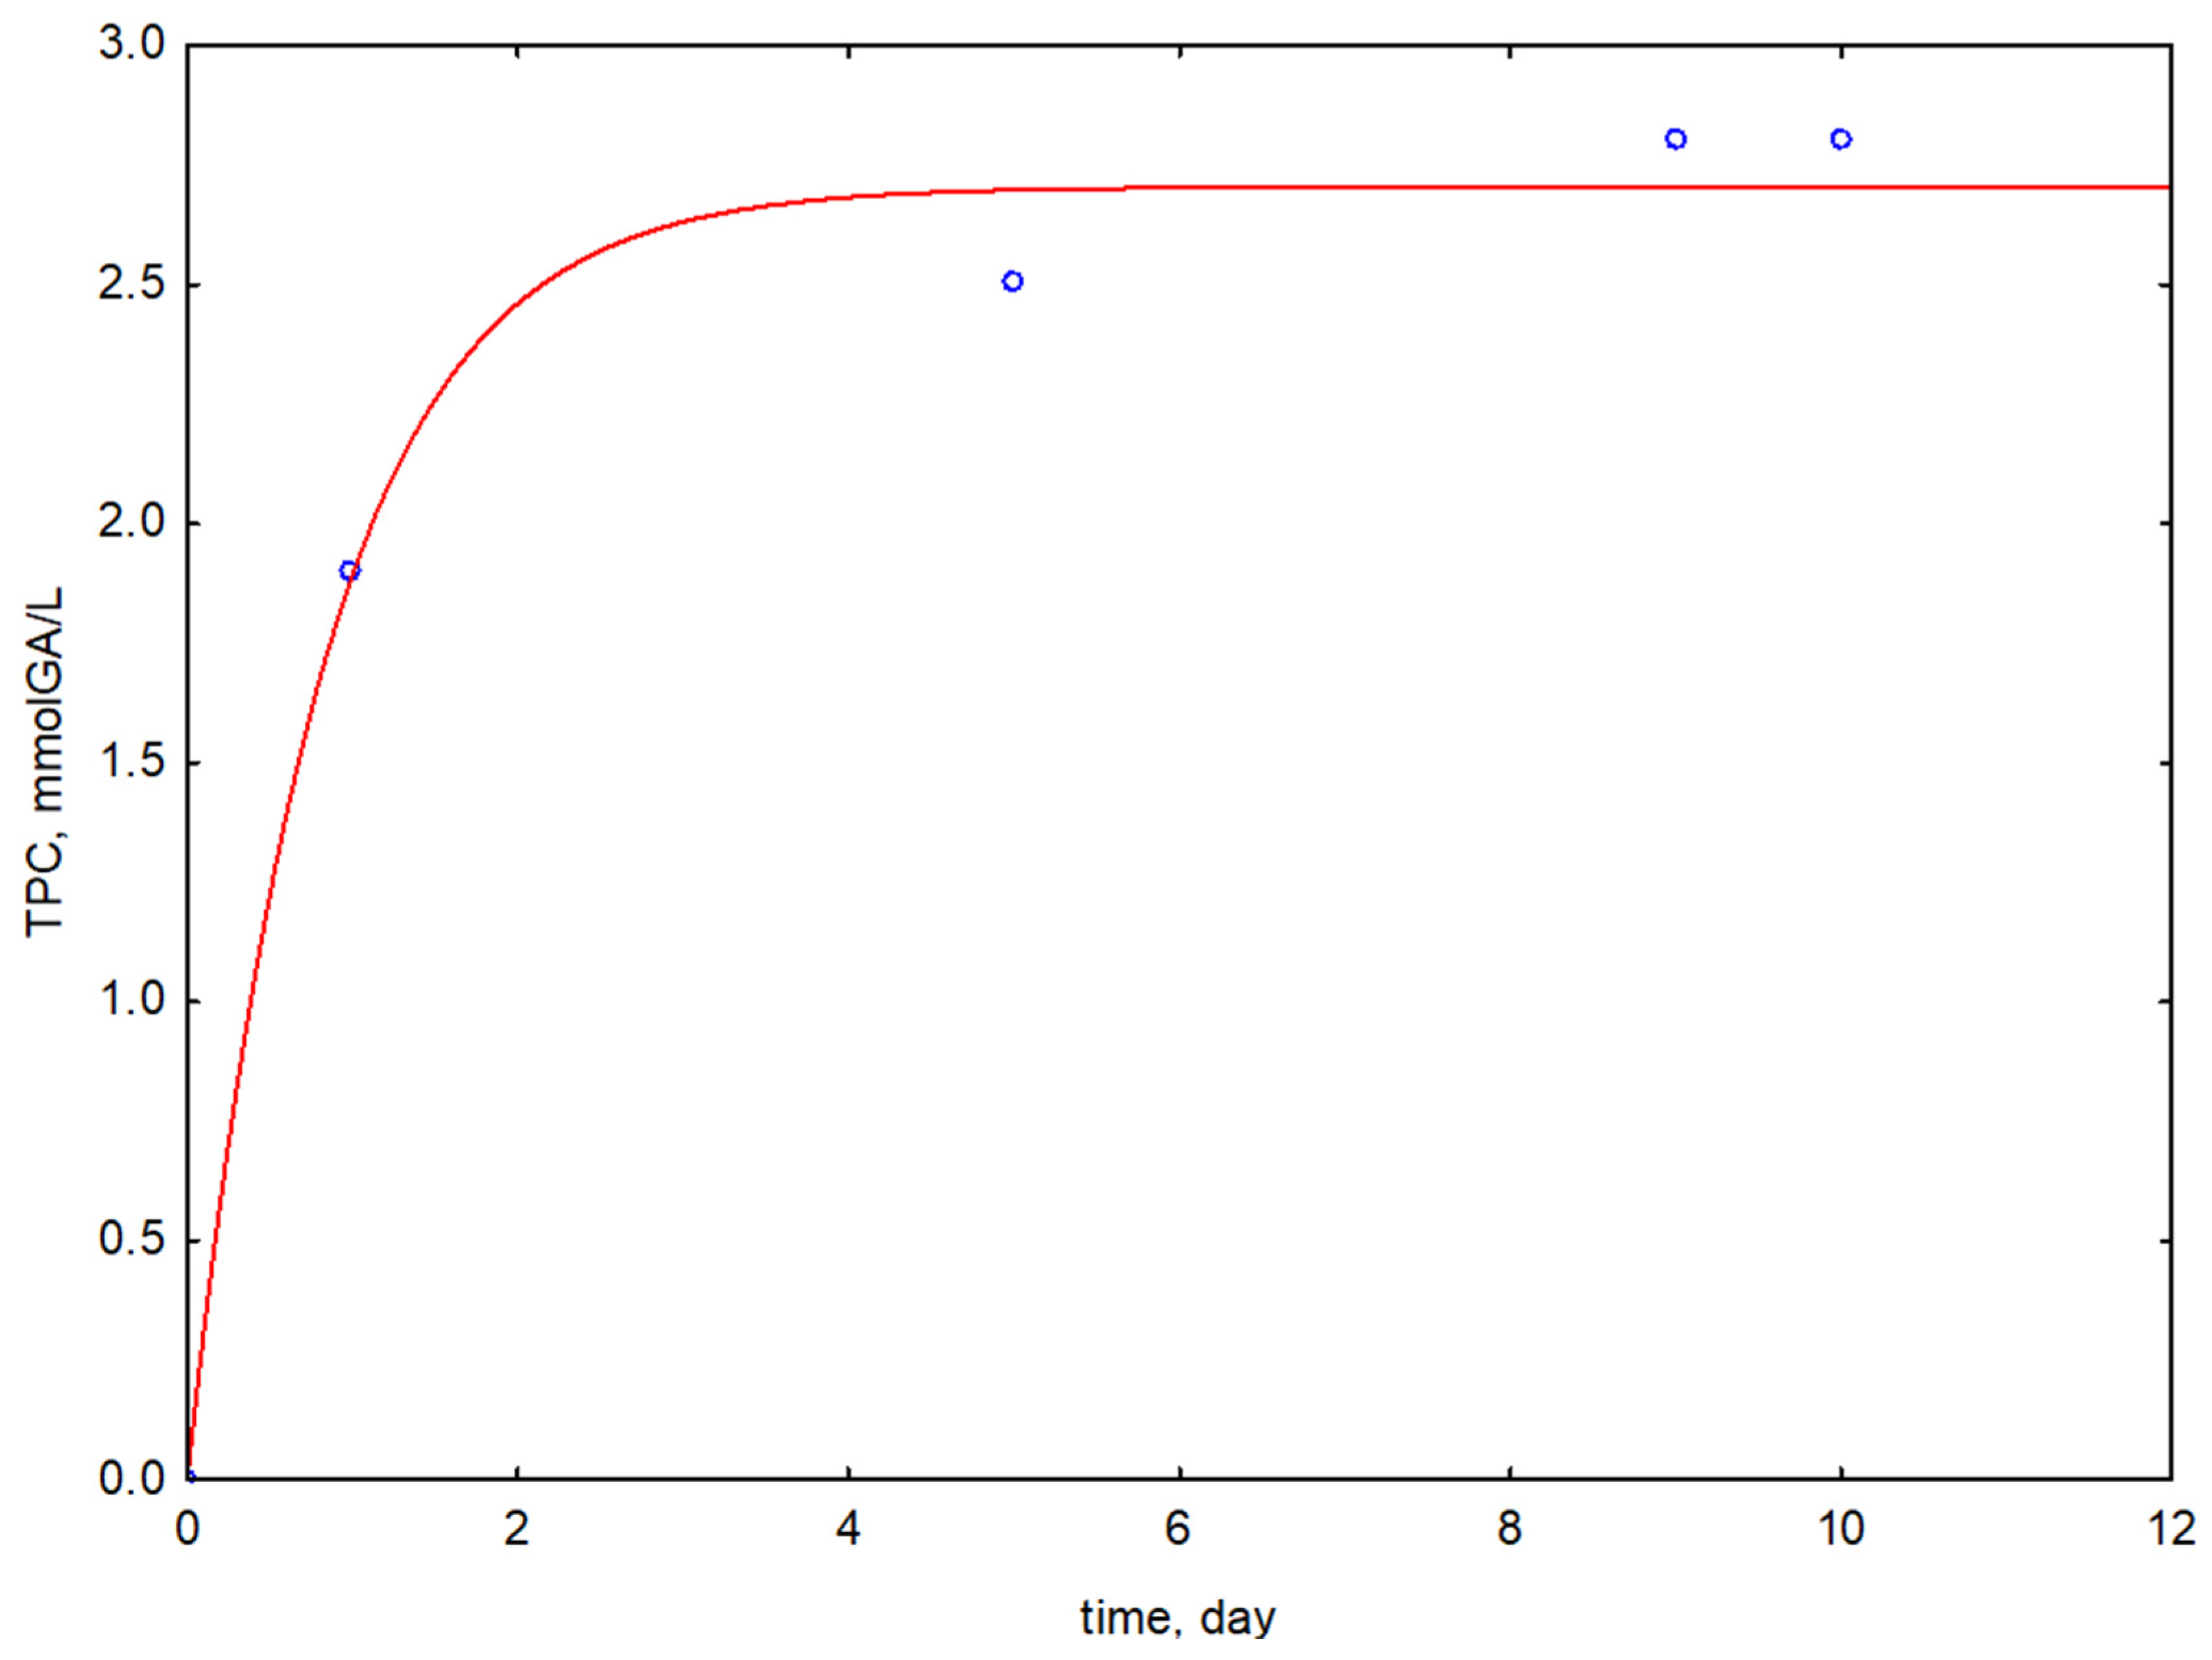
3.1.1. Studies on the Effect of Lactic Acid Bacteria Strains

Studies on the effect of lactic acid bacteria strains on changes in antioxidant activity (AA), total polyphenol content (TPC), and lactic acid efficiency (LAe) are presented in Table 2.
Based on the results obtained using GC-MS (Figure S1), it was found that the highest lactic acid yield was obtained after 9 days of fermentation in the presence of L. salivarius LY_0652 (FSE-2, LAe = 63% ± 1), L. brevis LY_1120 (FSE-3, LAe = 69% ± 1), L. rhamnosus MI-0272 (FSE-5, LAe = 89% ± 1), and L. plantarum MI-0102 (FSE-6, LAe = 85% ± 1). In the presence of L. reuteri MI_0168 and L. acidophilus MI-0078 strains, the highest LA yields of 80% ± 1 (for FSE-1) and 77% ± 1 (for FSE-4) were obtained after 10 days of running the process. For further studies on the effect of initial sugar content on the course of stem fermentation, strain L. rhamnosus MI-0272 and a fermentation time of 9 days were selected due to the highest yield of lactic acid formed during the process (89% ± 1). These conditions also yielded the highest value of antioxidant activity (AA = 4.23 mmol Tx/L ± 0.13) and the highest content of phenolic compounds (TPC = 2.82 mmol GA/L ± 0.18) (Table 2).
Figure 1 shows the course of changes in lactic acid yield during fermentation of clove tree stems in the presence of LAB, while Table S1 shows the kinetic values of lactic acid yield and time for the maximum of the function.
Stem fermentation in the presence of L. rhamnosus MI-0272 (FSE-5) resulted in the highest rate of LA growth and the lowest rate of lactic acid disappearance, according to the determined reaction rate constants k1 and k2 (Table S1) and the kinetic curves showing the changes in lactic acid yield during fermentation (Figure 1).
Table S2 shows the reaction rate constants and time for the maximum of the lactic acid yield change function during stem fermentation in the presence of LAB. Figure 2 and Figure 3 show the course of fitting the tested AA and TPC functions to the experimental points during the fermentation of clove tree stems in different LAB strains.
For all lactic acid bacterial strains tested, the final value of antioxidant activity (AA) is 4.2 mmol Tx/L, while the value of total polyphenol content (TPC) is 2.8 mmol GA/L. Meanwhile, the reaction rate constants k1 and k2 for the studied process in the direction of AA and TPC functions take the values of 3.7 and 1.2 day−1, respectively (Figure 2 and Figure 3, Equation (8)).

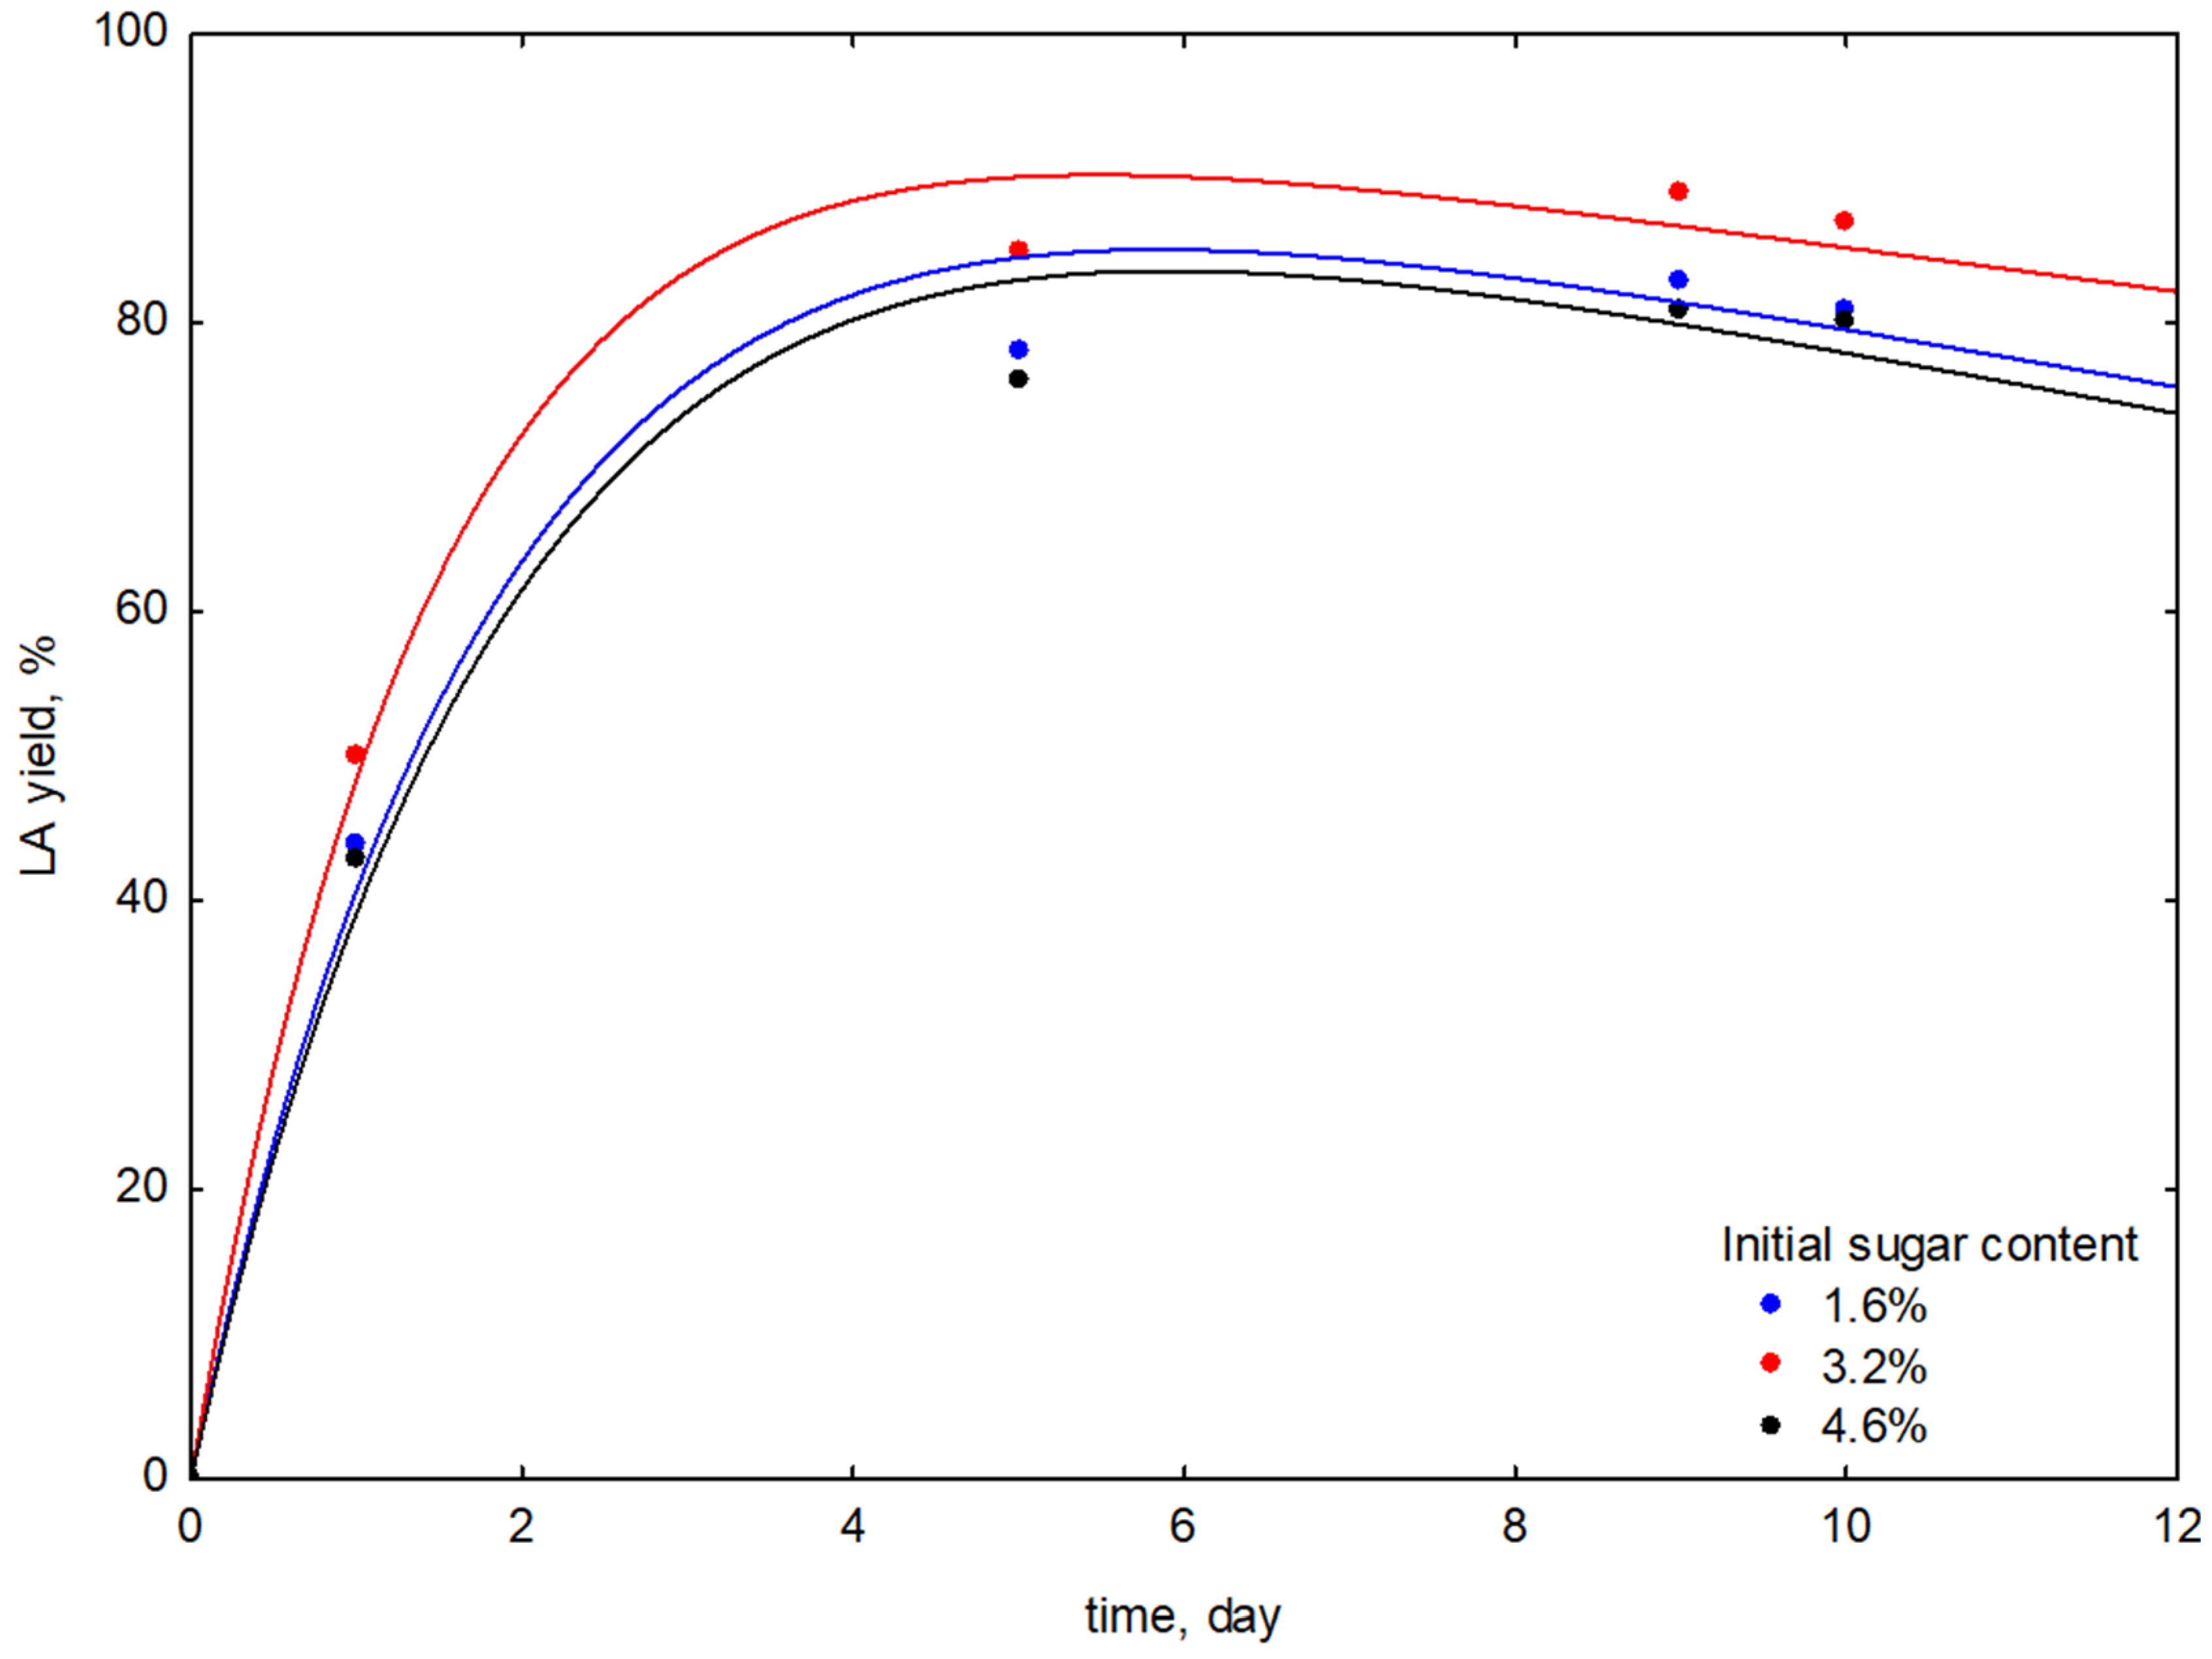
3.1.2. Studies on the Effect of the Initial Amount of Sugars

Studies on the effect of the initial amount of sugars on changes in antioxidant activity (AA), total polyphenol content (TPC), and lactic acid efficiency (LAe) are presented in Table 3.
Table 3 shows that the highest value of antioxidant activity (AA = 4.29 mmol Tx/L ± 0.22) and the highest content of phenolic compounds (2.84 ± 0.09) were obtained by conducting fermentation for 9 days using an initial sugar content of 4.60%. After lowering the initial sugar content to 3.20% on the ninth day of conducting the process, lactic acid formation was observed with the highest yield (Lae = 89% ± 1). For this reason, an initial sugar content of 3.20% and a fermentation time of 9 days were selected for further studies on the effect of plant raw material content on stem fermentation. Under these conditions, AA and TPC values were, respectively, 4.23 mmol Tx/L ± 0.13 and 2.82 mmol GA/L ± 0.18 (Table 3).
Figure 4 shows the course of changes in lactic acid yield during the fermentation of clove tree stems in the presence of L. rhamnosus MI-0272 using an initial sugar content of 1.60–4.60%, where the line corresponds to the values defined in Equation (3).
Stem fermentation tests in the presence of L. rhamnosus MI-0272 and using an initial sugar content in the range of 1.60–4.60% showed that the best ratio of lactic acid gain constant to LA decay constant was observed for the process carried out at an initial sugar content of 3.20% (FSE-8) according to the determined reaction rate constants k1 and k2 (Table S1); moreover, kinetic curves show changes in lactic acid yield during fermentation (Figure 4).

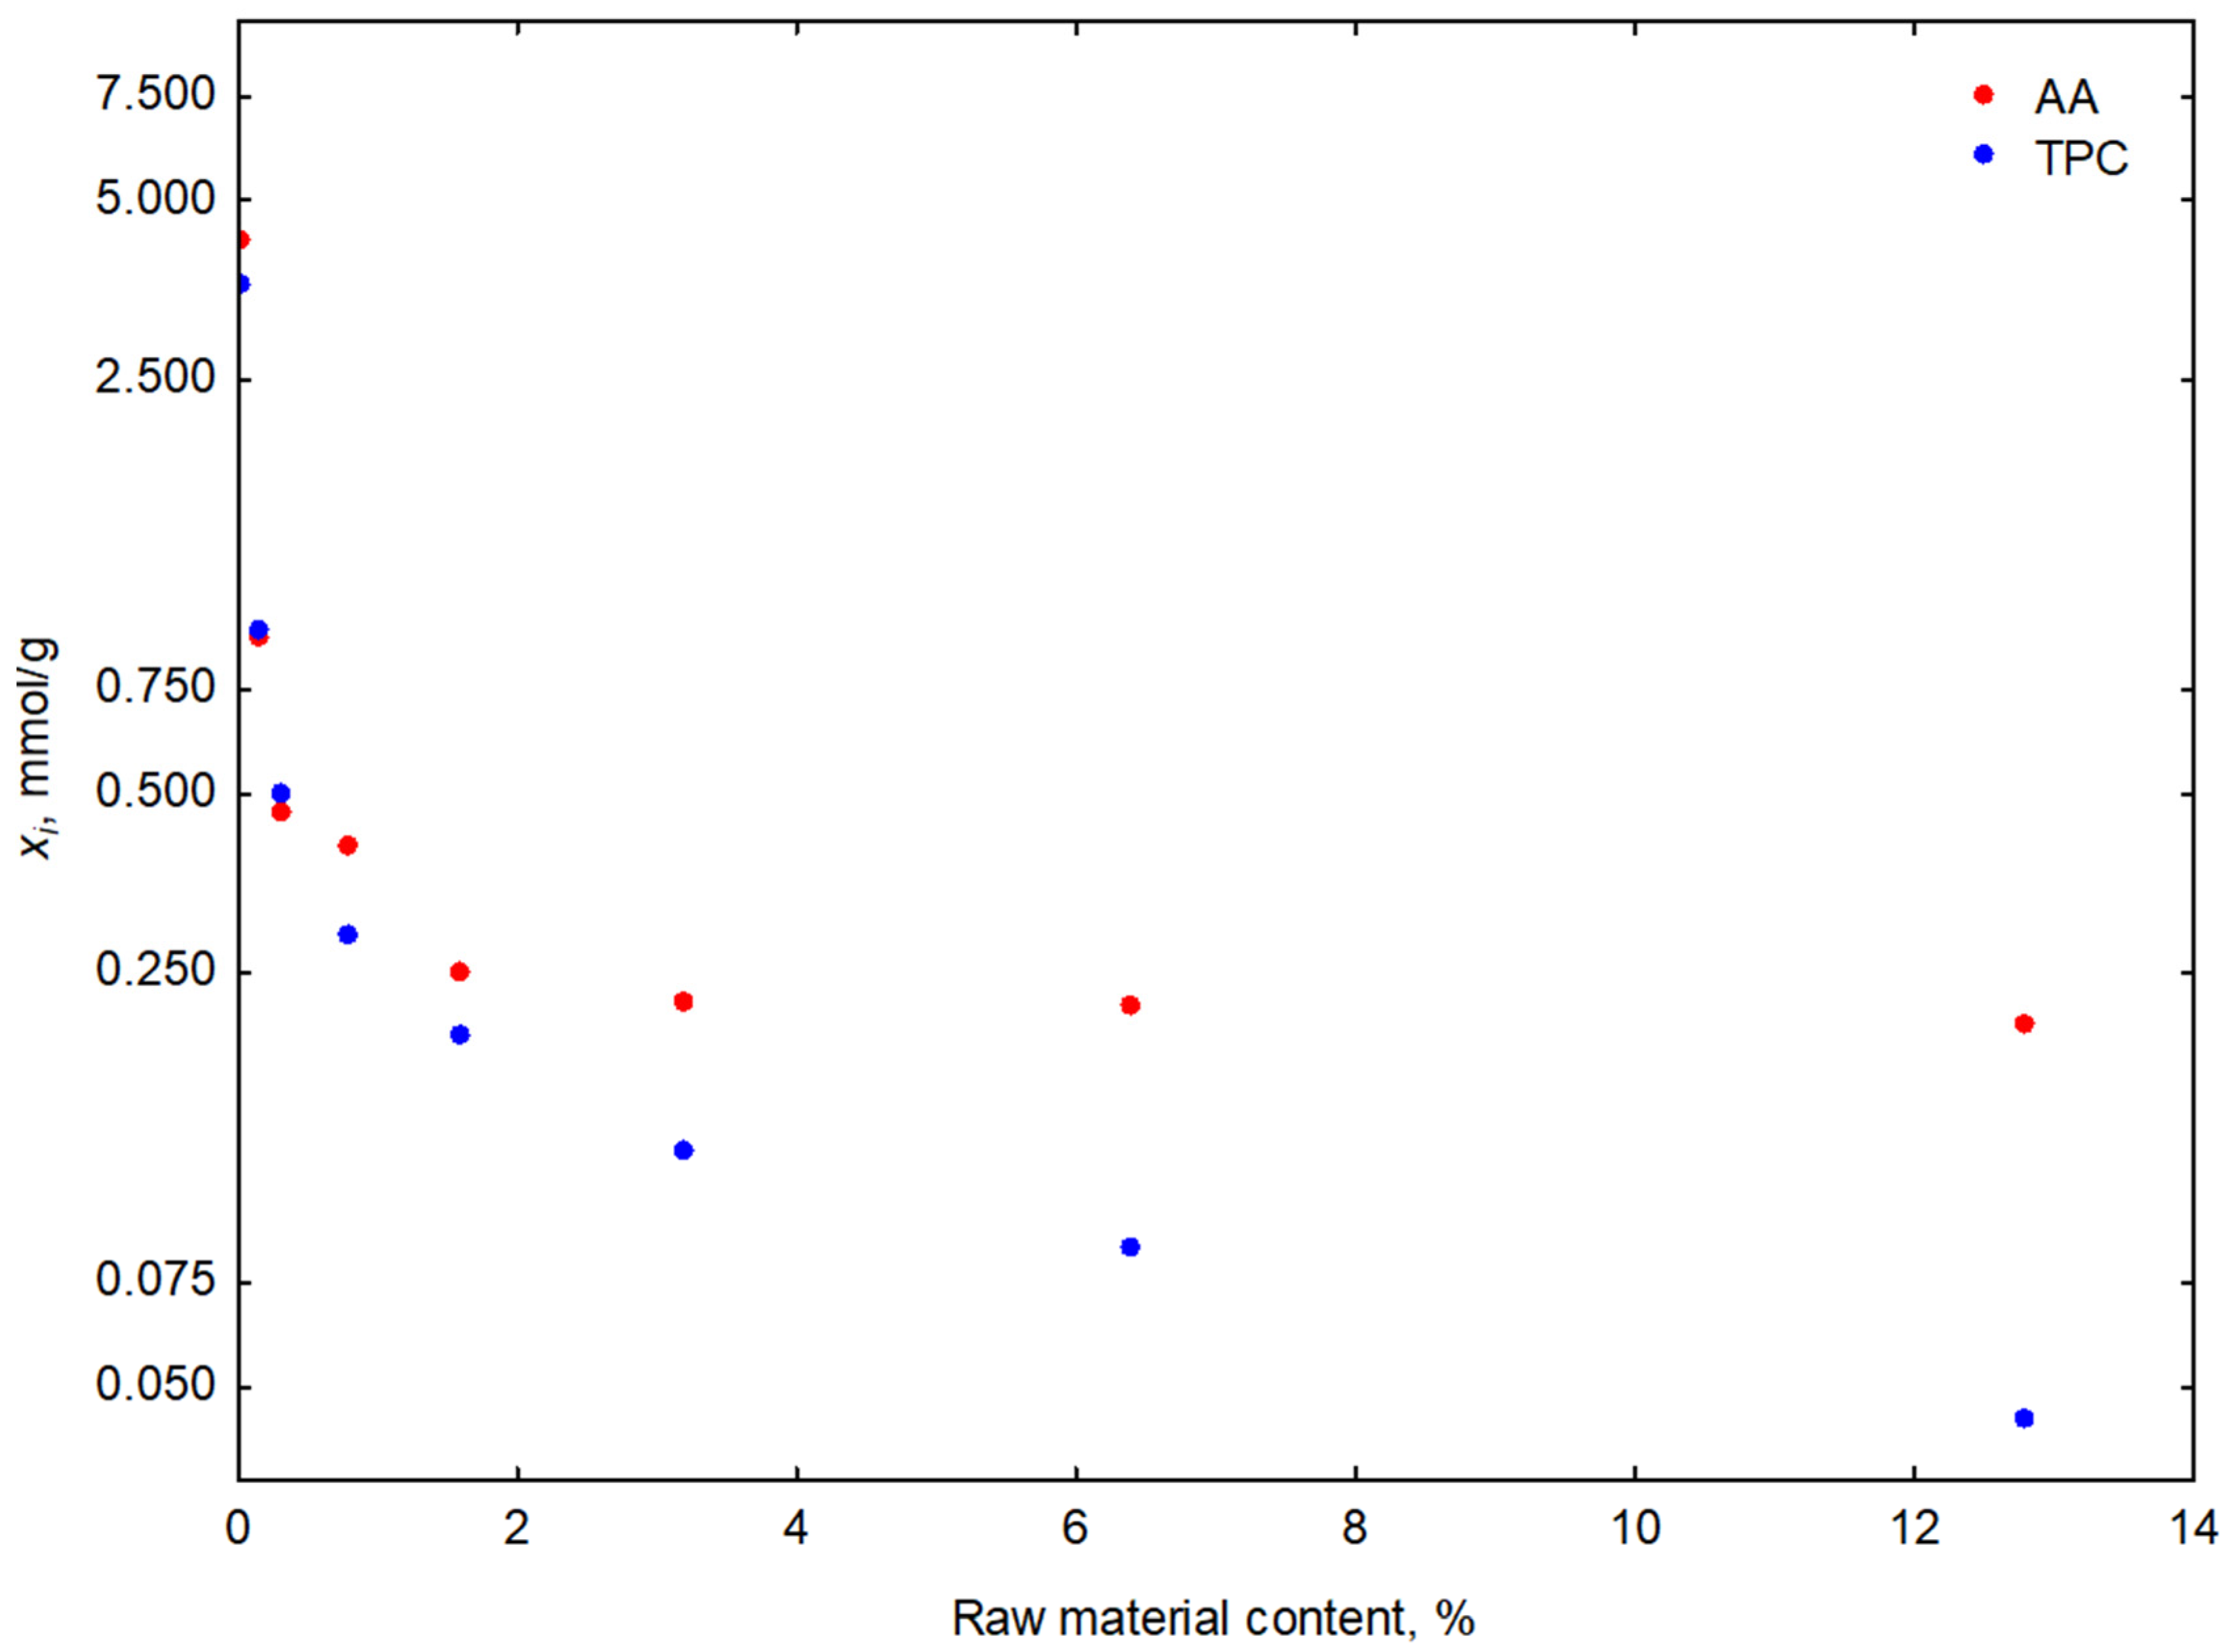
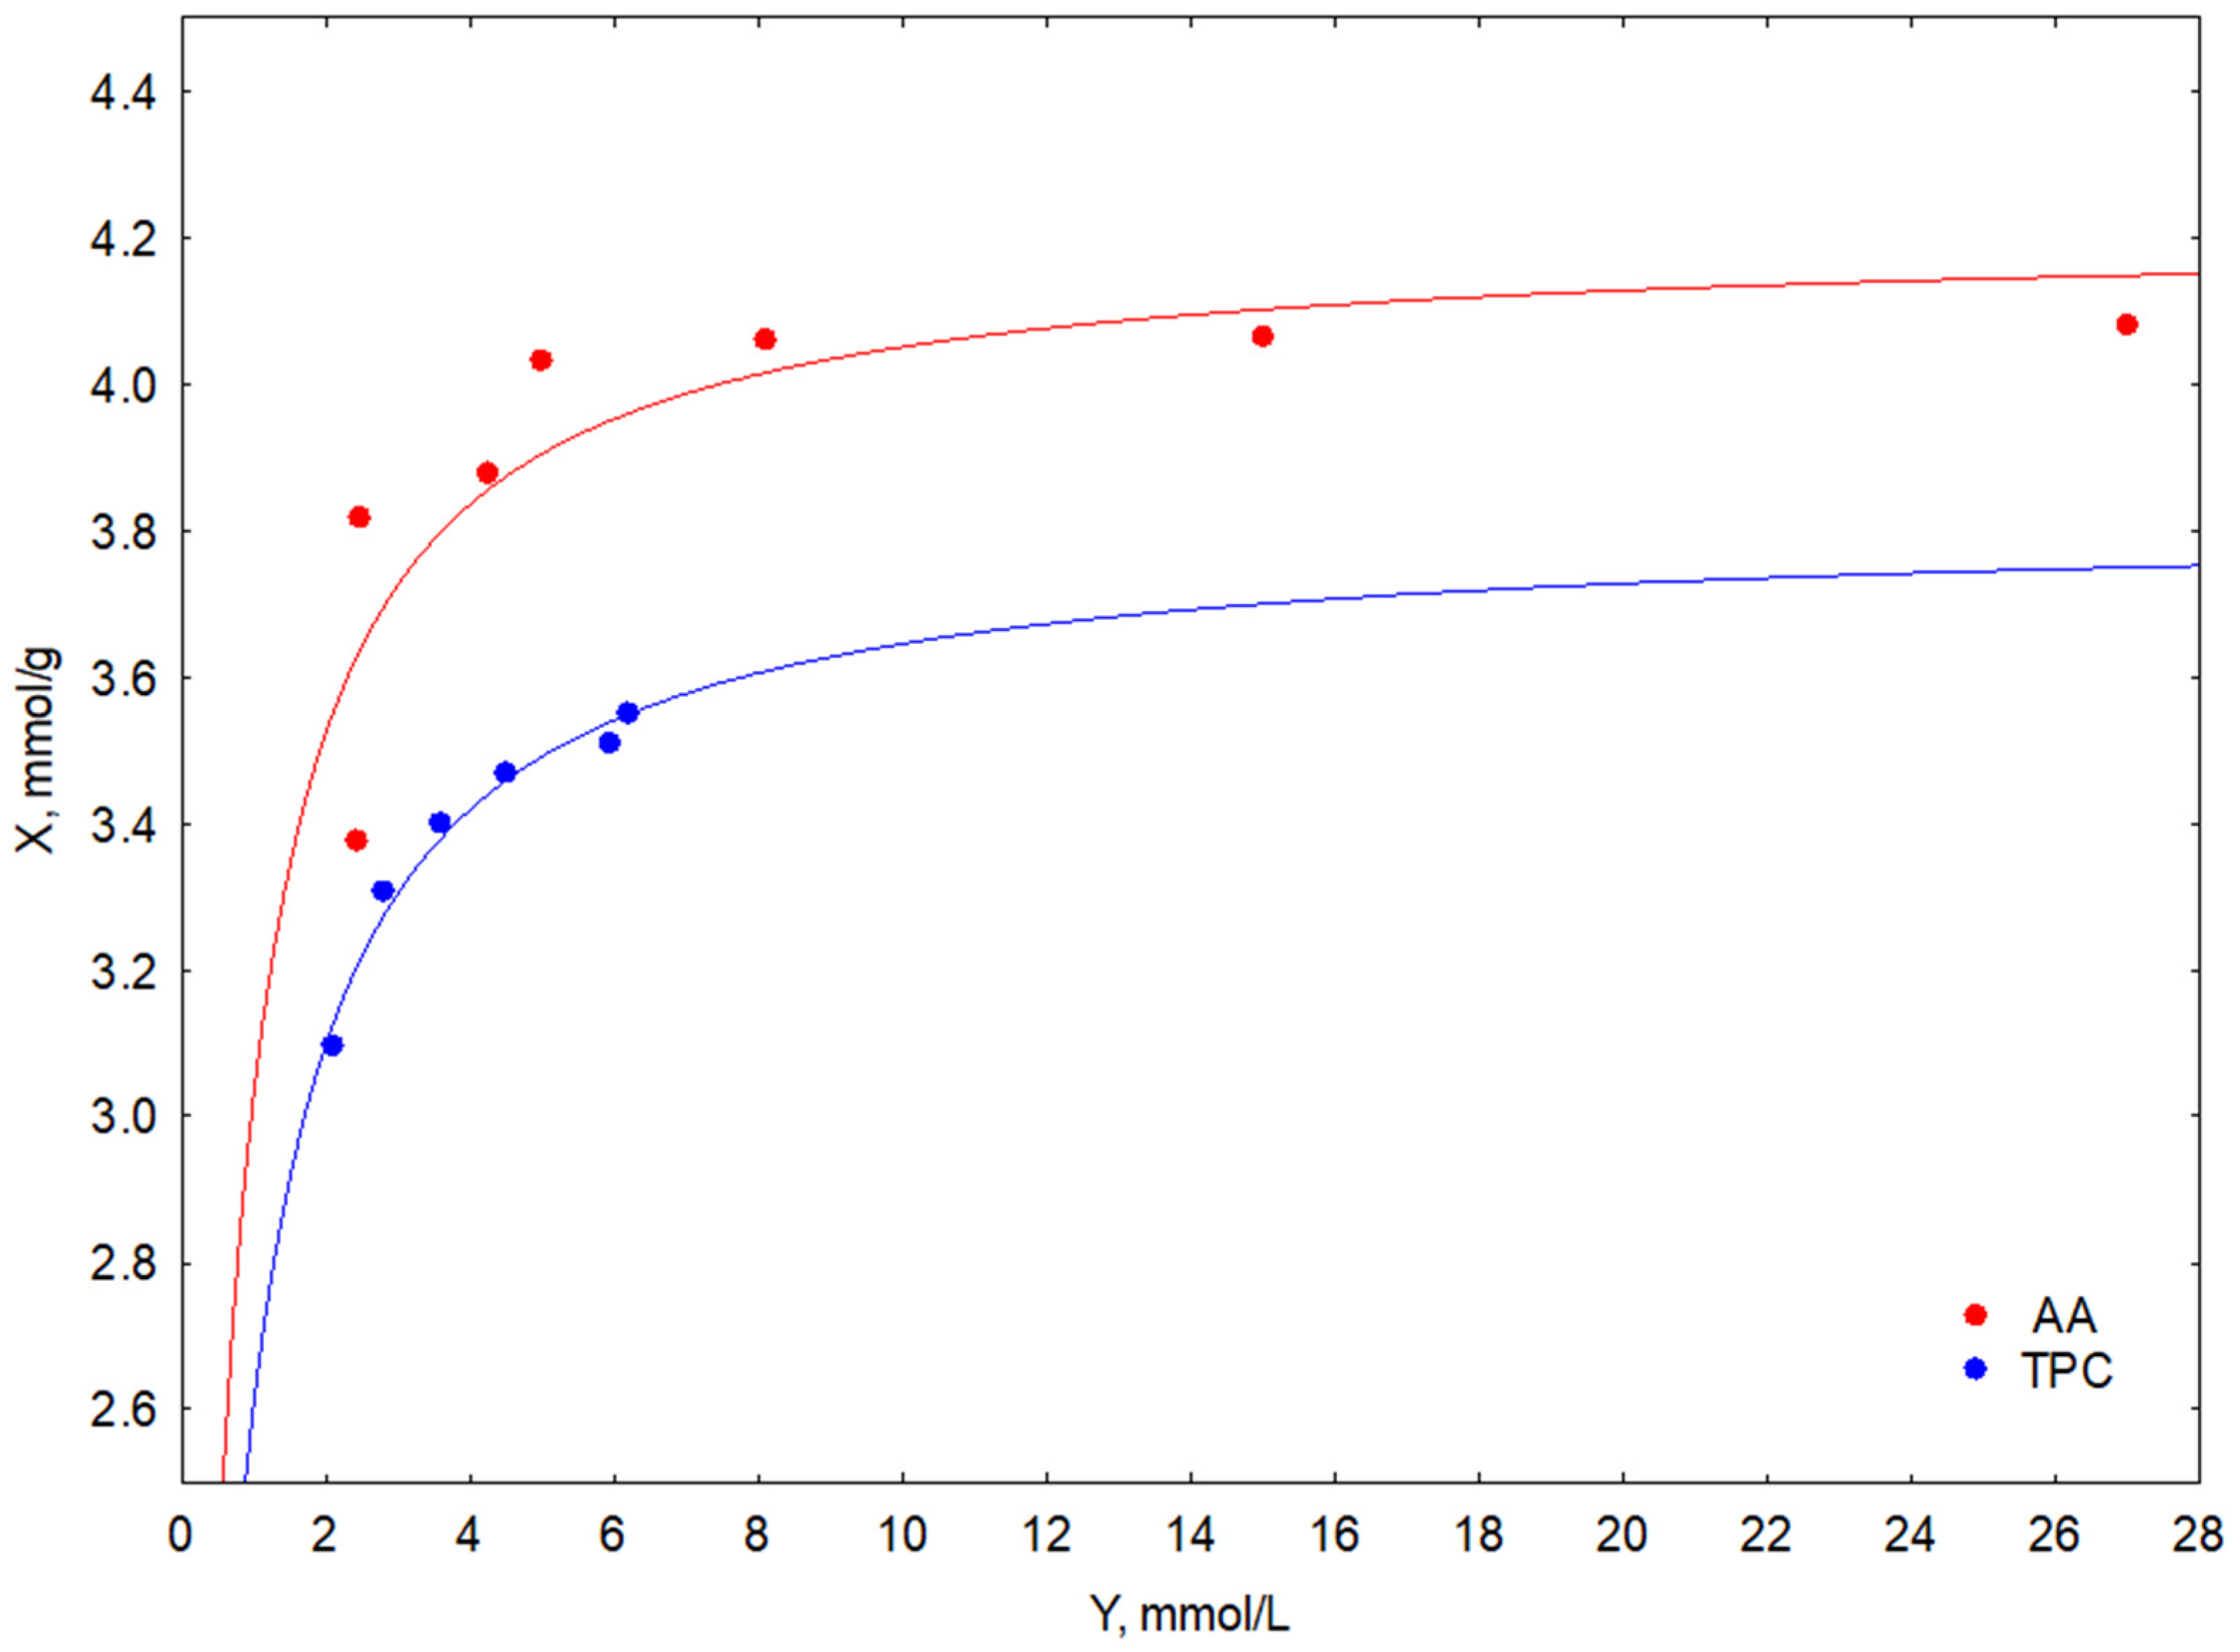
3.1.3. Studies on the Effect of the Plant Raw Material Content

Studies on the effect of raw plant material content on changes in antioxidant activity (AA), total polyphenol content (TPC), and lactic acid efficiency (LAe) are presented in Table 4.
Table 4 shows that the highest values of the two process functions tested (i.e., antioxidant activity and total polyphenol content) are obtained by conducting fermentation for 9 days and using raw plant material at 12.80%. Under these conditions, the lactic acid yield is 83%. After lowering the content of plant material (to 6.40%), lactic acid formation was observed with the highest yield (88%), with a slight decrease in AA (from 26.92 mmol Tx/L ± 0.22 to 26.88 mmol Tx/L ± 0.21) and TPC (from 6.03 mmol GA/L ± 0.16 to 5.96 mmol GA/L ± 0.19). Therefore, a plant material content of 6.40% and fermentation time of 9 days, due to the highest Lae (88% ± 1) and high AA and TPC values, were considered the most favourable (Table 4).
Figure 5 shows the changes in the output of AA and TPC parameters in relation to the unit weight of plant material used.
It can be seen from Figure 5 that the Yi0 values (Equation (7)) may come from the presence of active ingredients (such as syringic acid, p-hydroxybenzoic acid, vanillic acid, ferulic acid, and others) contained in the beet molasses used in the fermentation process, which are responsible for the increase in AA and TCP process function values. The observed increase in antioxidant activity and total polyphenol content cannot be attributed to the plant material used in the process.
Figure 6 shows the course of fitting the tested AA and TPC functions to the experimental points during stem fermentation in the presence of L. rhamnosus MI-0272.
The shape of the curves shown in Figure 6 corresponds to the Langmuir adsorption equilibrium model [57], for which the determined parameters X0 and b (Equation (7)) are, respectively, 4.2 and 3.8 mmol/g (for antioxidant activity and total polyphenol content) and 2.6 and 2.2 mmol/L (for AA and TPC), respectively.

3.2. Antioxidant Activity, Total Polyphenols Content, and LA Efficiency

Table 5 shows the results of the activity, total polyphenols content, and LA efficiency of FSE and PE from S. aromaticum L.
Table 5 shows the antioxidant activity (via a DPPH radical scavenging assay), total polyphenol content (via the Folin–Ciocalteu method), Fe2+ chelating activity, Fe3+ reducity, and the LA efficiency of FSE and SE. Antioxidant activity (AA) tests showed that the fermented plant extract had a higher degree of DPPH radical scavenging (11.60 mmol Tx/L ± 0.09) than the plant extract (9.21 mmol Tx/L ± 0.05). The results, presented in Table 4, show that FSE also has a higher content of phenolic compounds (TPC = 33.90 mmol GA/L ± 0.14) than the test extract (22.04 mmol GA/L ± 0.13). Studies of the chelating activity of Fe2+ ions and reducity of Fe3+ ions in the ferrozine test showed that the activity of the tested FSE chelating and reduction potential is 0.32 mmol Fe2+/L ± 0.01 and 49.09 mmol Fe3+/L ± 0.16, while, in the case of the PE, the ChA and RA value is lower (0.13 mmol Fe2+/L ± 0.01 and 35.42 mmol Fe3+/L ± 0.22). Based on the results obtained using GC-MS, it was found that lactic acid efficiency was obtained on the 10th day of conducting the fermentation of stems: LAe = 96% (Table 5).

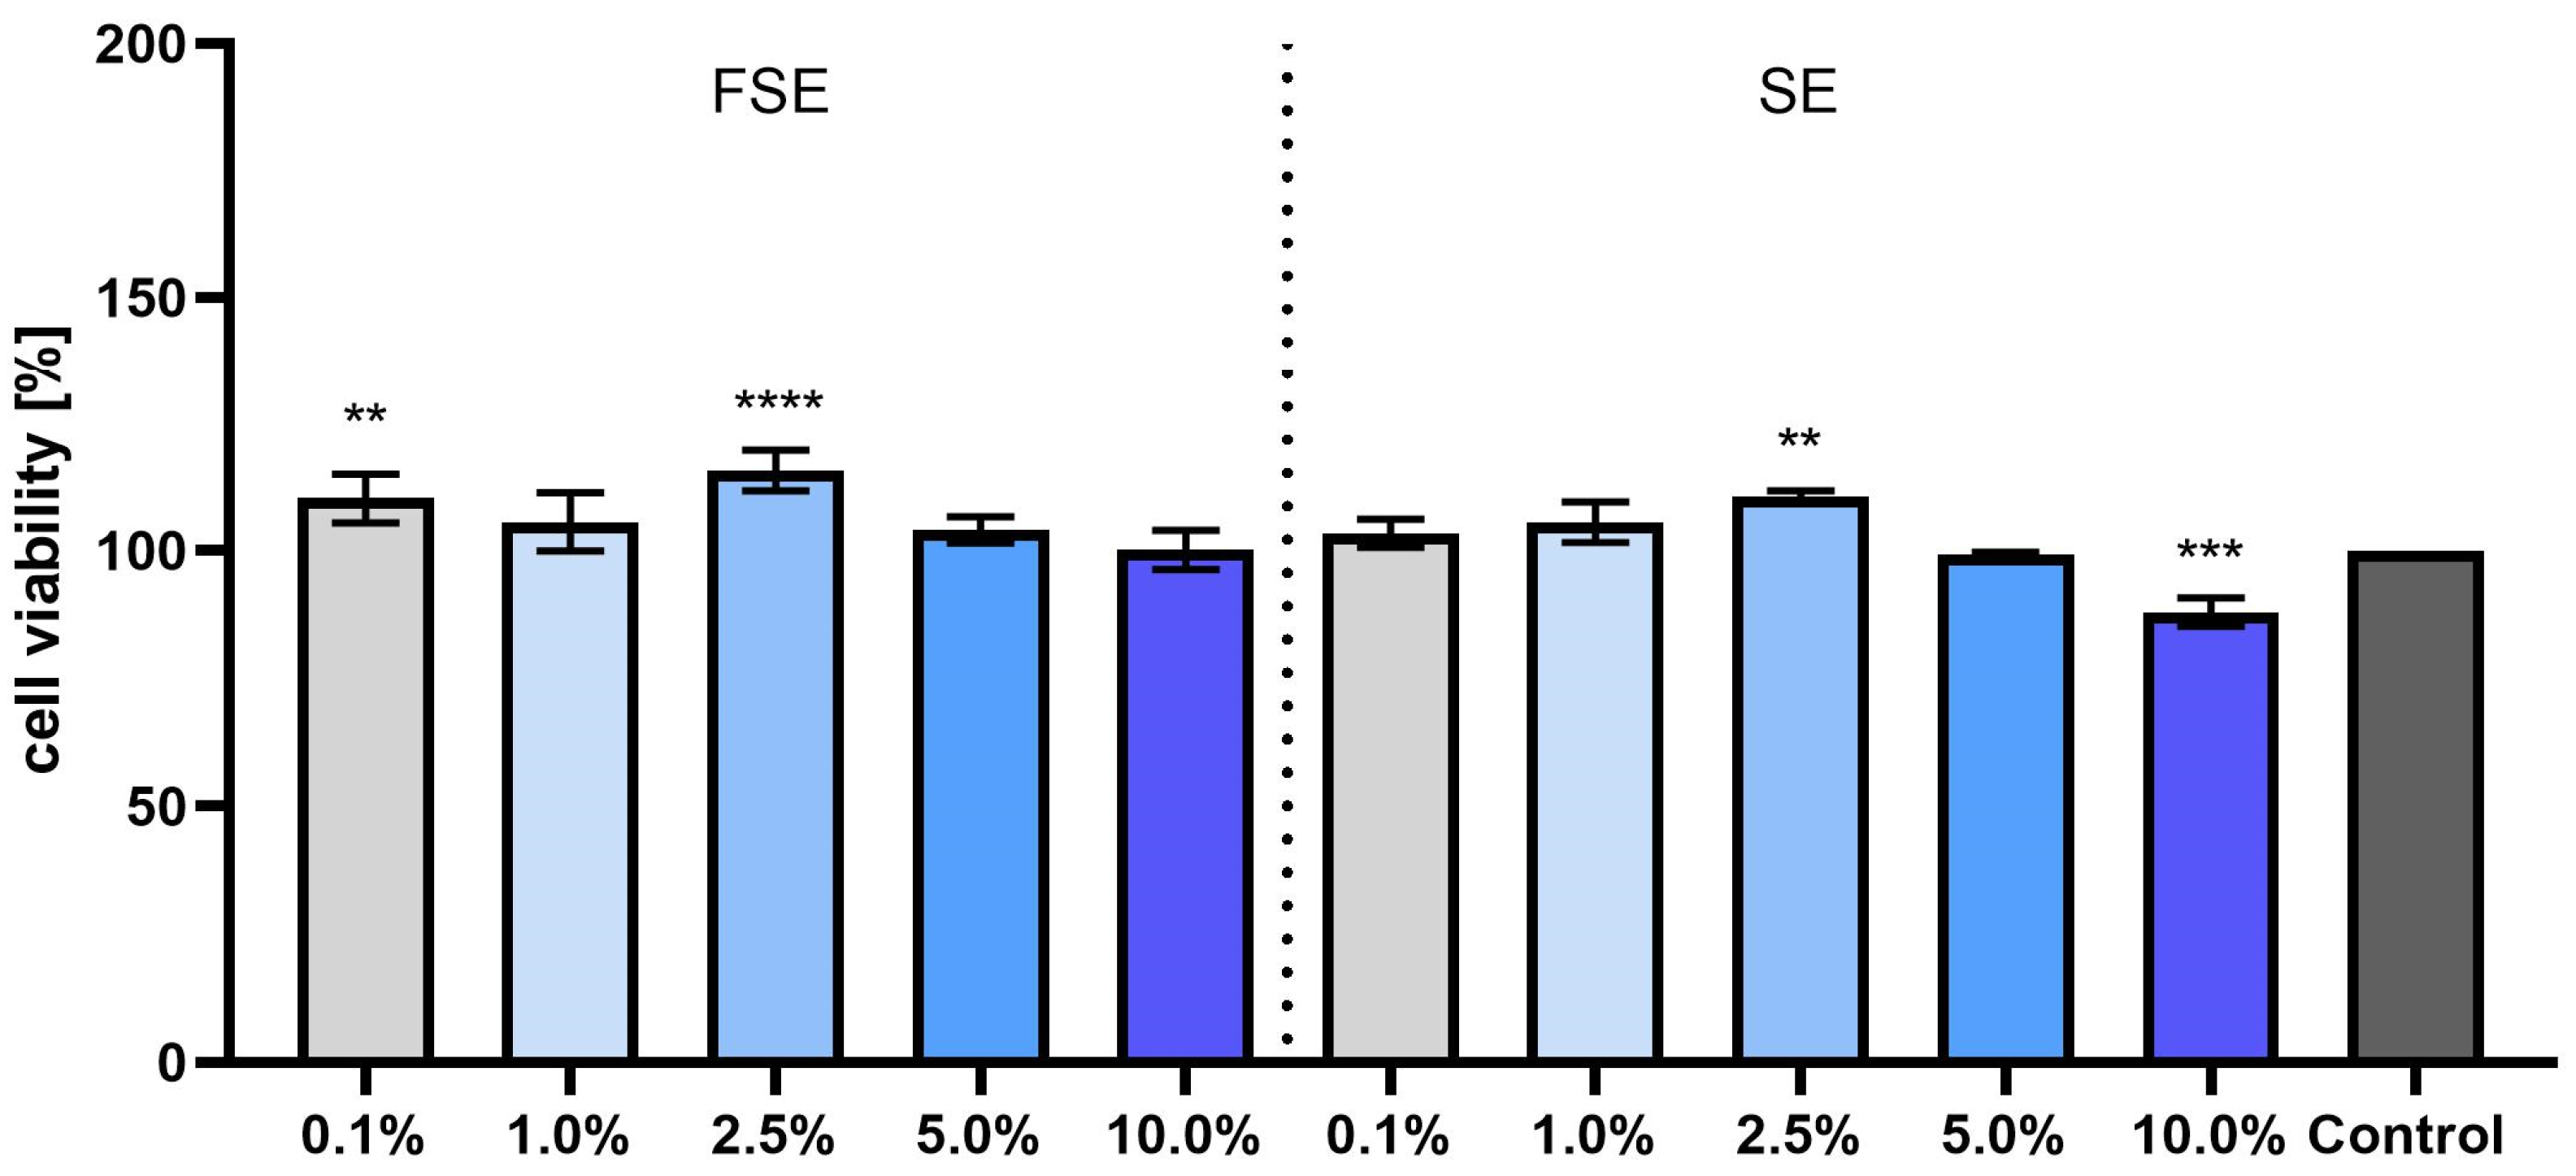
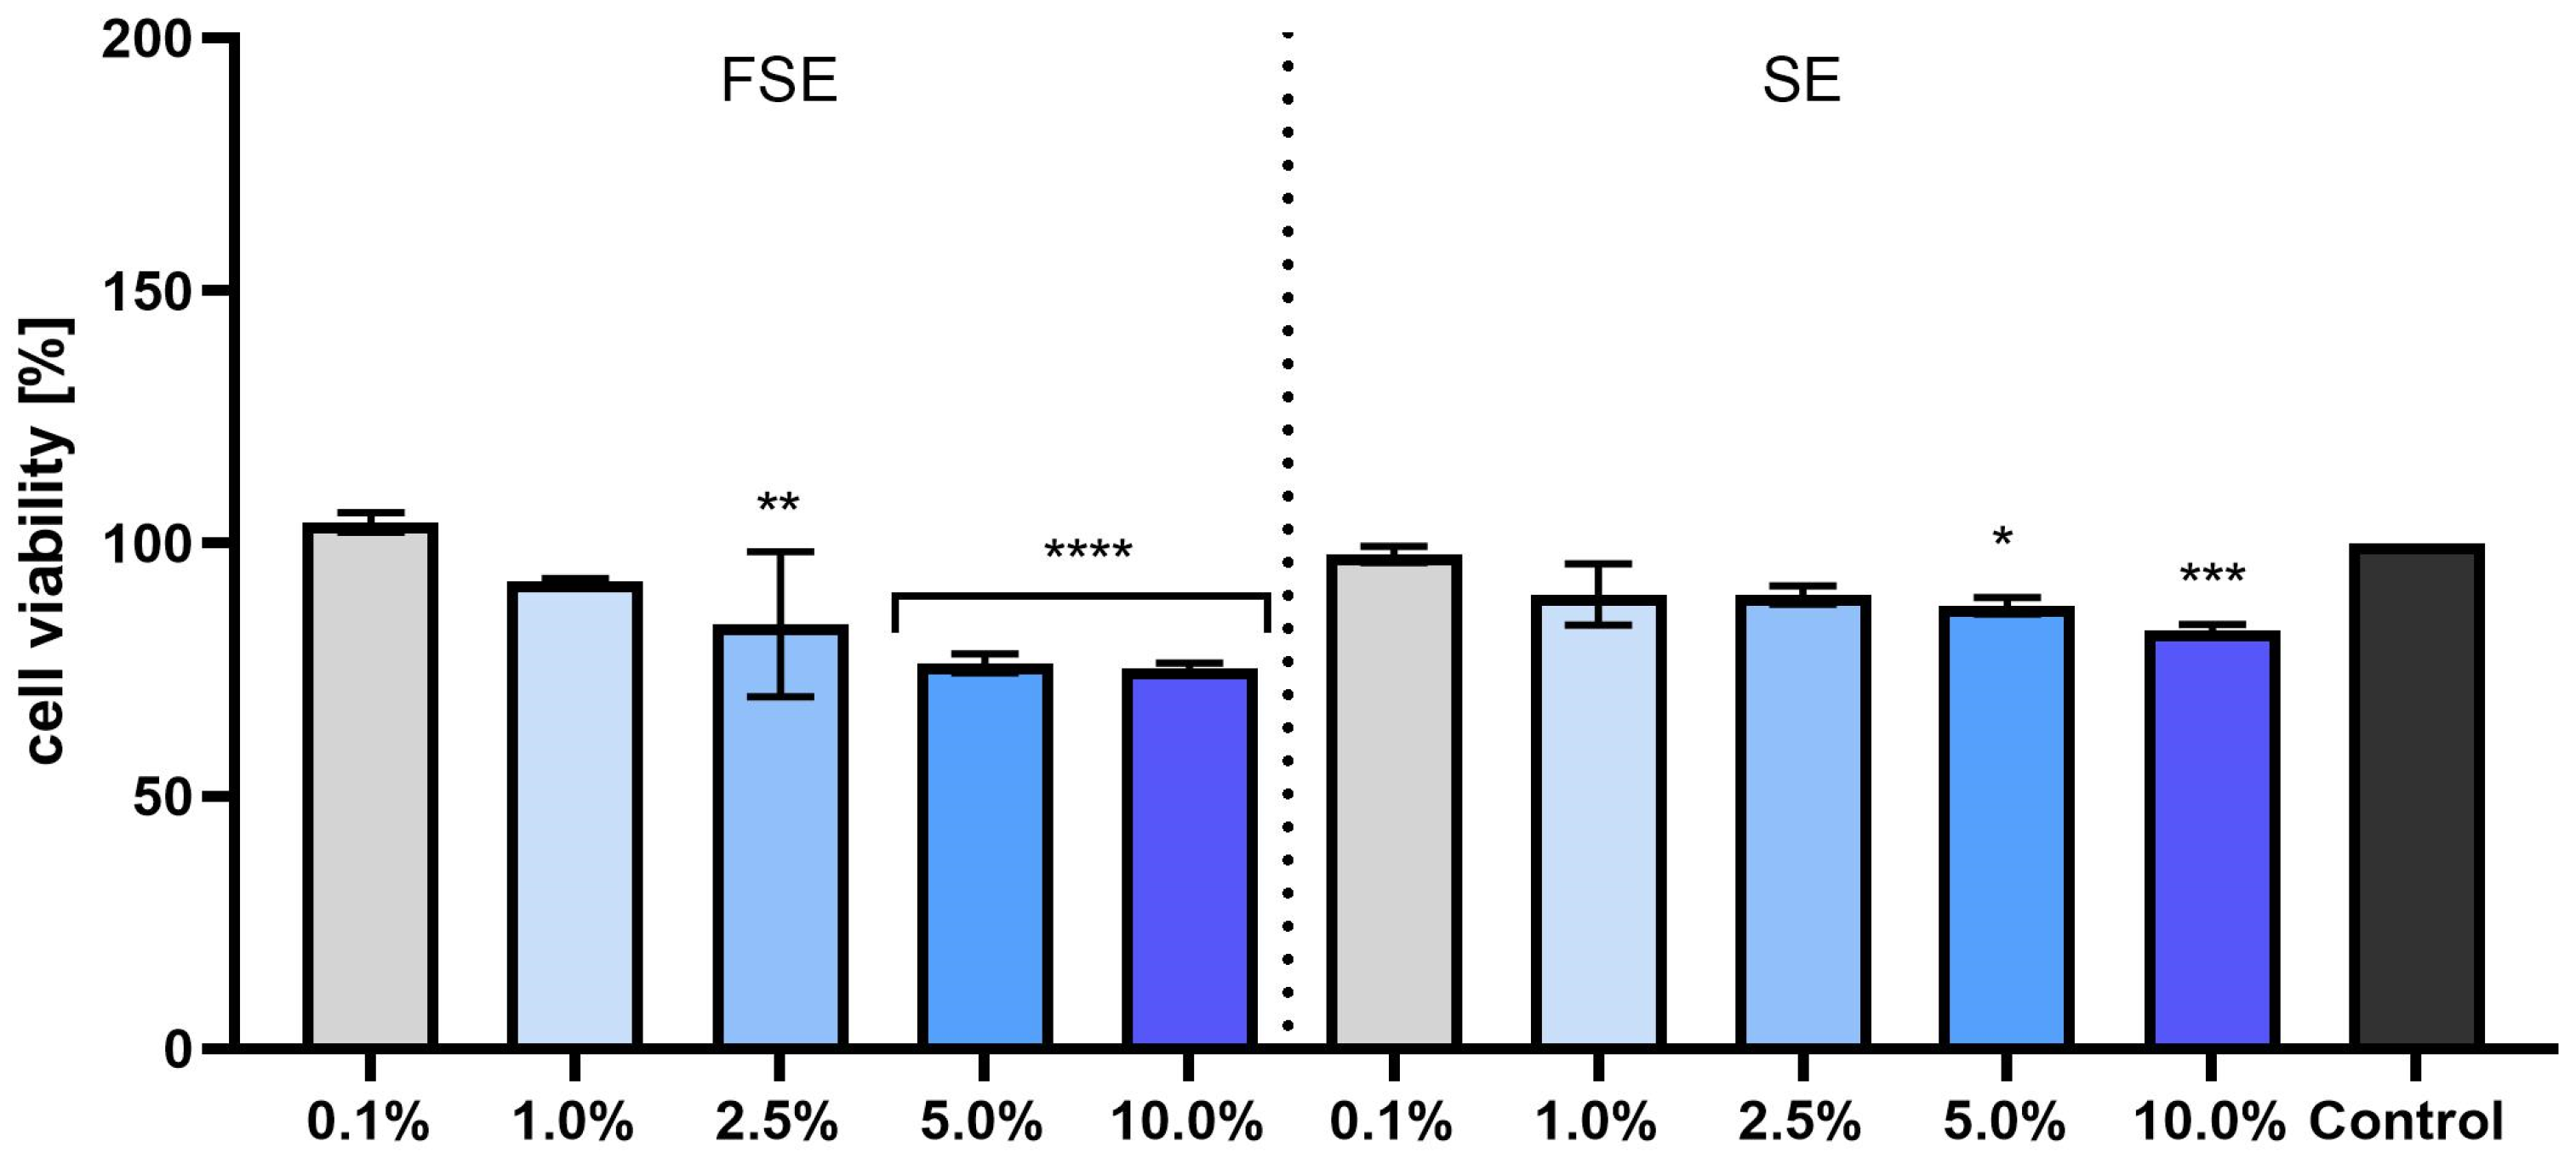
3.3. Cytotoxicity Evaluation

In order to assess the cytotoxicity of FSE and SE from S. aromaticum L., two assays were used to assess the impact of the tested samples on the viability and proliferative capacity of skin cells in vitro. The first one (Alamar blue) enables the assessment of the possibility of resazurin reduction, while the second one (neutral red) assesses the possibility of the incorporation of the neutral red dye in cell lysosomes. Two types of skin cells were used in the analyses: keratinocytes (HaCaTs) and fibroblasts (HDFs). The results of the tests performed are presented in Figure 7, Figure 8, Figure 9 and Figure 10.
The cytotoxicity of plant extracts is closely dependent on the part of the plant being extracted and the phytochemicals contained in that part of the plant material [58,59]. In vitro cytotoxicity studies have shown that both unfermented and fermented extracts of S. aromaticum L. (used in appropriate concentrations) can improve the metabolism and viability of skin cells (Figure 7, Figure 8, Figure 9 and Figure 10).

3.4. GC-MS Analysis

In the fermented extract from Syzygium aromaticum L., the main parts are eugenol, α- and β-caryophyllene, eugenyl acetate, and caryophyllene oxide (Figure S2). Eugenol, eugenyl acetate, and α- and β-caryophyllene are potentially responsible for the biological activity of FSE [34,35].

4. Discussion

Influence of process parameters on the fermentation of stems in the presence of L. rhamnosus MI-0272 showed that the highest values of the tested functions (AA, TPC, and LAe) were obtained on day 9 of the process, using a plant material content of 6.40% and an initial sugar content of 3.20%. This produces a fermented plant extract that is characterised by high antioxidant activity (AA) and a high content of polyphenolic compounds (TPC). Increasing the content of plant material (above 6.40%) inhibits the hydrolysis of six-carbon sugars (derived from beet molasses) to lactic acid, as a result of which their hydrolysis of sugars is observed [60]. This significantly reduces the efficiency of LA formed during fermentation. Using an optimal initial sugar concentration of 3.20%, lactic acid is obtained with a maximum efficiency of 88% (Table 4). Lactic acid efficiency values first increased during the process and then reached a maximum on day 9 or 10 of fermentation (depending on the strain used). Continuing the fermentation process resulted in a decrease in the efficiency of the lactic acid formed. Fermentation often inhibits LA production, resulting in a gradual decrease in the growth rate of lactic acid bacteria cells. Therefore, a gradual decrease in lactic acid concentration is observed as the process is prolonged. The inhibition of lactic acid is caused by the ability of the undissociated lactic acid to dissolve in the cytoplasmic membrane, while the dissociated lactate remains insoluble. This leads to the acidification of the cytoplasm and the disruption of proton motive forces. This event impacts the pH gradient across the cell membrane and reduces the cellular energy available for growth [61]. Comparing the influences of the type of strain used on the efficiency of the LA obtained, it was found that the use of L. rhamnosus MI-0272 as the fermentation strain allowed lactic acid to be obtained with the highest efficiency (88%). Therefore, L. rhamnosus MI-0272 was selected as the superior fermentation strain. The results showed that the obtained ferment from Rhodotorula glutinis and L. casei had the highest lactic acid content (15 g/L) [57]. Our study showed that all fermented plant extracts obtained had a higher lactic acid content (about 22 g/L) than the ferment from Rhodotorula glutinis and L. casei [57].
When lowering the initial sugar content (from 3.20 to 1.60%), there is a slight decrease in AA values from 4.23 mmol Tx/L ± 0.13 (on day 9 of fermentation) to 4.21 mmol Tx/L ± 0.18 (on day 9 of fermentation). Reducing the initial sugar content from 3.20 to 1.60% with shorter process times (from 1 to 5 days) results in lower TPC values from 10.74 mmol GA/L ± 0.03 to 8.78 mmol GA/L ± 0.03 (when fermentation is conducted for 1 day) and from 10.97 mmol GA/L ± 0.02 to 9.56 mmol GA/L ± 0.01 (when fermentation is conducted for 5 days). This phenomenon is related to the fact that the starting beet molasses contains antioxidants (free phenolic acids), which increase the antioxidant activity in the fermented plant extract [62]. The results correlate with kinetic studies. At the same time, increasing the initial sugar content regardless of the fermentation time decreases the value of the studied function from 75% ± 1 to 32% ± 1 (Table 3).
Lowering the content of plant material, regardless of fermentation time, causes the value of this function to decrease from about 1.73 mmol Tx/L ± 0.02 to about 19.94 mmol Tx/L ± 0.03. This means that for a plant material content of 6.40% and a fermentation time of 9 to 10 days, it is possible to achieve the highest content of phenolic compounds in FSE. With a fermentation time of 1 to 5 days (at the maximum plant material content), the value of this function gradually increases from 10.74 mmol GA/L ± 0.03 to 10.97 mmol GA/L ± 0.07. Lower plant material contents (from 0.32 to 3.20%) result in a decrease in TPC from 2.98 mmol GA/L ± 0.03 to 8.62 mmol GA/L ± 0.03. Table 4 also shows that increasing the plant material content at the selected fermentation time (from 9 to 10 days) results in a significant increase in TPC from about 3.76 mmol GA/L ± 0.04 (plant material content 0.32%) to about 8.62 mmol GA/L ± 0.03 (plant material content 3.20%) (Table 4).
Fermentation of black soybeans in the presence of Bacillus subtilis BCRC 14715 and using such solvents as water, methanol, ethanol, and acetone increased the total phenolic and flavonoid content, as well as the antioxidant activity of the obtained extracts. Phenols of different classes are converted into compounds that are more bioactive than the parent compounds, leading to higher contents of TPC and AA [49]. The fermented acetone extract had the highest total phenolic content of 40.42 ± 0.48 mg GA/g and the highest DPPH free radical scavenging effect (EC50 = 0.65 ± 0.02 mg/mL), while the fermented methanol extract showed the highest Fe2+ ion chelating capacity (EC50 = 2.17 ± 0.19 mg/mL). The active substance associated with the DPPH radical scavenging effect was most efficiently extracted from black soybeans using water as a solvent. Water effectively extracted iron (II) ion chelating principles from unfermented (yield = 44.20% ± 0.21) and fermented (yield = 50.79% ± 1.98) black soybeans, respectively [63]. Fermentation of cheonggukjang soybeans using Bacillus subtilis CS90 probiotics increased total polyphenol content (from 253 to 9414 mg/kg) and DPPH radical scavenging activity (from 53.6 to 93.9%), while total flavanol gallate content decreased by about 70% over the 60-h fermentation period. As fermentation time increased, significant differences in total phenolic acids were observed: 311.01 mg/kg (time = 0 h), 400.45 mg/kg (time = 12 h), 508.48 mg/kg (time = 24 h), 733.59 mg/kg (time = 36 h), 890.05 mg/kg (time = 48 h), and 1066.92 mg/kg (time = 60 h). In particular, the level of phenolic acids increased significantly with a decrease in flavanol gallates during the fermentation run. Total phenolic content (TPC) is higher after the fermentation of plant raw materials in the presence of LAB microorganisms, which can be explained by the generation of metabolites and the release of phenols from the plant matrix. However, in some cases, TPC reduction after fermentation is more common due to enzymatic or non-enzymatic oxidation, and diffusion of soluble phenolic compounds into fermentation secretions (exudates). In addition, the total phenolic content may increase or decrease depending on the strains of microorganisms [15,52,53].
During the ongoing fermentation of plant raw materials, it has been observed that gallates are converted into flavanols (epigallocatechin gallate into epigallocatechin). In addition, flavanols (catechin, epicatechin, epigallocatechin) exhibit antiviral, antimutagenic, anticancer, anti-obesity, and hypocholesterolemic effects. Flavanols are also considered to be effective antioxidants, and they work by scavenging oxygen radicals and chelating metal ions (for example, Fe2+ ions). Phenolic acids, such as gallic acid and its derivatives, also have antioxidant, antimutagenic, and anticancer effects. Gallic and rosemary acids were the most potent antioxidants among simple phenolic and hydroxycinnamic acids. A review of the literature indicates that phenolic acid content correlates with the antioxidant capacity of FPEs [64,65].
Degradation of anthocyanin glucosides to their aglycone forms and free phenolic acids is also observed during fermentation in the presence of lactic acid bacteria. Fermentation of jussar pulp by L. deubruekii, assisted by the action of β-glucosidase, led to the conversion of cyanidin 3-O-glucoside and cyanidin 3-O-rutinoside to the main product, protocatechuic acid, which is a phenolic compound. In addition, other phenolic acids, such as caffeic acid and ferulic acid, were detected in smaller amounts within a few hours of fermentation, indicating possible conversion between phenolic acids via chalcones. The simpler structure of these metabolites may contribute to the higher antioxidant activity of fermented jussar pulp, with an increase in oxygen radical-reducing capacity from 49.2 to 90.7% compared to the unfermented extract. Accordingly, L. plantarum and Oenococcus oeni deglycosylate anthocyanin glucosides into their aglycones: malvidin, delphinidin, and peonidin. Further ring cleavage released trihydroxybenzaldehyde and syringic acid (from malvidin), gallic acid (from delphinidin or demethylation of syringic acid), or vanillic acid (from peonidin) [49,66].
The degree of anthocyanin degradation by lactic acid bacteria depends on the LAB species. The highest anthocyanin content was observed by conducting fermentation in the presence of L. casei and L. bulgaricus; meanwhile, conducting fermentation in the presence of other L. species resulted in anthocyanins at lower levels. In addition, the anthocyanin content, particularly delphinidin 3-O-glucoside, in the fermented orange juice was more significantly reduced by L. rhamnosus or L. paracasei than by L. plantarum or L. brevis. These observations may be due to variability in β-glucosidase or β-galactosidase activity, and the presence of more hydroxyl groups in delphinidin increases its susceptibility to enzymatic degradation than that of other anthocyanins [67,68].
Of the kinetic models adopted, follow-up reaction equations and first-order equations best described the time-dependent changes taking place. On the other hand, the following reaction equations were best suited to explaining the generation and disappearance of lactic acid (LA). This research demonstrates that the process function values of AA and LAe are reliant on the LAB strain and plant material content, whereas the rate of change of TPC may be heavily influenced by the types of phenolic compounds generated during fermentation. In addition, the highest rate of lactic acid growth (with the lowest rate of LA disappearance) is characterised by the process for obtaining FSE-5. In addition, the best ratio of the lactic acid growth constant to the LA disappearance constant occurs when using an initial sugar content of 3.20%. Moreover, changes in the values of the main functions describing the process, AA and TPC, do not depend on the type of LAB strain used in the fermentation process. Their nature is typical of the diffusive transfer of active components with antioxidant potential contained in the plant raw material (and resting on antioxidant activity) in the solution, with simultaneous transformation of flavonoids (such as apigenin, kaempferol, luteolin, quercetin, and taxifolin) contained in the raw plant material undergoing transformation to free phenolic acids during fermentation (i.e., caffeic acid, gallic acid, ferulic acid, p-coumaric acid, sinapic acid, and vanillic acid), which are metabolic products (Figure 1, Figure 2, Figure 3, Figure 4, Figure 5 and Figure 6, Tables S1 and S2).
Fermentation is one of the methods used to increase phenolic acid content. When conducting fermentation of plant raw materials, the biotransformation of phenolic compounds (such as apigenin, kemferol, luteolin, quercetin, taxifolin, flavonoids, tannins, stilbenoids, lignans, and alkylresorcinols) via lactic acid bacteria occurs. During fermentation, anthocyanin aglycones (i.e., anthocyanidins) such as malvidin and peonidin are released, which are then converted to syringic acid and vanillic acid. Flavanols found in plant materials in monomeric form (catechin, epicatechin, epigallocatechin, and gallocatechin) or polymeric form (proanthocyanidins or condensed tannins) are converted into their free forms during fermentation. Catechin and epigallocatechin gallates are converted to catechin and epicatechin. In addition, epigallocatechin gallate is converted to free catechin, catechin esters, and gallic acid. Moreover, in addition to the transformation of phenolic compounds, fermentation induces condensation reactions between flavanols and anthocyanins, forming anthocyanin-flavanol pigments: in particular, cyanidin-3-glucoside-ethyl-epicatechin. Fermentation increases the levels of the flavanones naringerin, eriodictyol, and naringerin from eriodictyol-7-O-glucoside and naringerin-7-O-glucoside, respectively. During fermentation, bioconversion of flavones, that is, the conversion of baicalin and wogonoside into their more bioavailable, aglycone forms, baicalin and wogonin, respectively, can occur. The bioconversion of isoflavones from glycosidic to aglycone form is also observed during the fermentation of raw plant materials. During the bioconversion of daidzein, glycitrin, and genistein 7-O-glucoside, free daidzein, glycitrin, and genistein are formed. The deglycosylation of flavanols during fermentation results in the release of kaempferol, kaempferol 3-glucoside, quercetin, and quercetin 3-glucoside from rutin (quercetin 3-rutinoside) [49,50,65,66,69,70].
Cytotoxicity analyses showed that both unfermented and fermented extracts of S. aromaticum L. can increase the viability of skin cells in vitro (Figure 7, Figure 8, Figure 9 and Figure 10). However, taking into account the possibility of the cytotoxic effects of extracts and ferments obtained from this plant in higher concentrations, when considering its use as a raw material for the production of various preparations applied to the skin, the appropriate concentration should be selected. The possibility of cytotoxic effects of S. aromaticum on skin cells was also confirmed by Prashar et al. [71]. During studies using fibroblasts, they indicated the cytotoxic properties of both the oil from this plant and the eugenol itself. In contrast, in our study, we did not observe any cytotoxicity on fibroblasts treated with fermented stem extracts in the concentration range of 0–100,000 µg/mL (Figure 8), suggesting that FSEs from S. aromaticum L. can prolong skin cell viability. However, Kim et al. [72] did not observe any cytotoxicity on fibroblasts treated with clove extracts in the concentration range of 0–200 µg/mL [72]. These results indicate that cytotoxicity is strictly dependent on both the plant part and the phytochemicals it contains [58,59]. So far, there are no literature reports on the cytotoxicity of ferments from S. aromaticum L.; therefore, this work indicates for the first time the potential use of FSEs in the cosmetics and pharmaceutical industries.
The major components in FSE from Syzygium aromaticum L. were eugenol, α- and β-caryophyllene, eugenyl acetate, and caryophyllene oxide (Figure S2). Our S. aromaticum L. fermented extract contained similar classes of compounds (phenylpropanoid, sesquiterpenes, carboxylate ester, and oxygen derivative of sesquiterpenes) as the non-fermented extract from S. aromaticum L. analysed by Yassine El Ghallab et al. [73]. Syzygium aromaticum L. essential oil (from buds) was richer in diethyl phthalate, cadinene, α-copaene, 4-(2-propenyl)-phenol, chavicol, and α-cubebene, while the extract isolated from clove leaf contained benzyl hexahydropyrrolol [1,2-A] pyrazine-1,4-dione; 3,5 dihydroxy-4,4 dimethyl-2,5 cyclohexa-dien-1-one; nitrophenylazo tert-butyl sulphide, and 2-propylpiperidine as the main components [34,74]. This comparison suggests that essential oils and extracts obtained from different parts of the same plant (buds, leaves, and stems) may have different chemical compositions, which may result in different biological activities.
The constituents potentially responsible for the biological activity of the fermented extract from S. aromaticum L. are eugenol, eugenyl acetate, and α- and β-caryophyllene [34,35]. The analgesic, antioxidant, anticancer, antiseptic, antidepressant, antispasmodic, anti-inflammatory, antiviral, antifungal, and antimicrobial effects of eugenol, which is the main component of clove oil, have been documented [36,75]. Eugenol and eugenyl acetate are characterised by their ability to deactivate free radicals (DPPH) and antimicrobial activity [76]. Notably, Gülçin [77] reported the in vitro antioxidant effectiveness of eugenol and discussed the relationship between structure and activity. They showed that eugenol allows the donation of the hydrogen atom and, subsequently, fixes the phenoxil radical. Additionally, the eugenol compound has a pleasant carbon chain link with the aromatic ring, which can be involved in phenoxil radical stabilisation by resonance [77]. Other literature reports indicate that eugenol and its ester derivative are also characterised by anti-tumour activity against the B16 melanoma cell line [37,38,78].

5. Conclusions

A detailed study of the influence of technological parameters on the fermentation process of stems from S. aromaticum L. made it possible to determine the technological parameters at which lactic acid contained in fermented plant extracts is formed with the highest efficiency, namely, with the highest values of AA and TPC at the same time. The results obtained on the influence of the process parameters on the fermentation process of stems in the presence of lactic acid bacteria using beet molasses as a source of six-carbon sugars show that, by conducting fermentations over 9 days using 6.40% of raw plant material and an initial sugar content of 3.20%, it is possible to obtain lactic acid with the highest efficiency while also obtaining high AA and TPC values.
The fermentation of stems from S. aromaticum L. in the presence of LAB strains showed modifications in bio-chemical parameters and changes in antioxidant activity, phenolic compound content, and a lactic acid yield of FSEs. Antioxidant activity (AA) increased more than six-fold from 4.12 mmol Tx/L ± 0.11 (using process parameters consistent with FSE-1 fermentation) to 26.92 mmol Tx/L ± 0. 22 (using process parameters consistent with FSE-17 fermentation); moreover, under these conditions, there was also a more than three-fold increase in phenolic compounds (from 1.91 mmol GA/L ± 0.13 to 6.03 mmol GA/L ± 0.16), which are desirable for their health benefits, as well as a more than two-fold increase in LA yield (from 40% ± 1 to 83% ± 1).
The fermented plant extract obtained from the stems of S. aromaticum L. is a valuable cosmetic raw material with high antioxidant potential and is safe for dermal fibroblasts and keratinocytes. When used in the right concentration, FSE can be used to develop cosmetic products for topical application and skin health, offering an effective delivery of active ingredients with desired properties.
Of the two different kinetic models used, the first-order model was particularly suitable for antioxidant activity and phenolic compounds, and the follow-up reaction model was effective in describing the time-dependent yield of lactic acid. However, further research is required to indicate the content of flavonoids that are generally reduced during fermentation in order to understand the mechanisms and metabolism of flavonoid degradation and to identify phenolic acids as metabolic products.

Supplementary Materials

The following supporting information can be downloaded at: https://www.mdpi.com/article/10.3390/app14114900/s1, Figure S1. Example chromatogram of a FSE containing internal standard (octane RT = 4.731 min) and lactic acid (RT = and 5.920 min); Table S1. Kinetic values of lactic acid yield and time for maximum function during stem fermentation in the presence of LAB: FSE-1 (L. reuteri MI_0168); FSE-2 (L. salivarius LY_0652); FSE-3 (L. brevis LY_1120); FSE-4 (L. acidophilus MI-0078); FSE-5 (L. rhamnosus MI-0272); FSE-6 (L. plantarum MI-0102); Table S2. Reaction rate constants and time for maximum function of lactic acid yield changes during stem fermentation in the presence of LAB; Figure S2. The example chromatogram identifying the major constituents of the FSE: 1: eugenol (RT = 16.58 min), 2: α-caryophyllene (RT = 17.65 min), 3: β-caryophyllene (RT = 18.12 min), 4: eugenyl acetate (RT = 18.78 min), and 5: caryophyllene oxide (RT = 19.75 min).

Author Contributions

Conceptualization. E.K.; methodology. E.K. and M.Z.-D.; software, R.P.; formal analysis, E.K., M.Z.-D. and R.P.; investigation, E.K., M.Z.-D. and R.P.; resources, E.K.; data curation, E.K.; writing—original draft preparation, E.K.; writing—review and editing, E.K.; visualisation. E.K.; supervision, P.B. and S.K.; project administration, E.K.; funding acquisition, E.K. All authors have read and agreed to the published version of the manuscript.

Funding

This research received no external funding.

Institutional Review Board Statement

Not applicable.

Informed Consent Statement

Not applicable.

Data Availability Statement

The original contributions presented in the study are included in the article/Supplementary Material, further inquiries can be directed to the corresponding author.

Acknowledgments

We would like to express our sincere gratitude to “Cukrownia Kluczewo” Władysława Broniewskiego 23, 73-110 Stargard for their invaluable collaboration and support in providing molasses for our research endeavours.

Conflicts of Interest

Authors Paweł Bilewicz and Sebastian Kowalczyk were employed by the company Dancoal Sp. z o.o. The remaining authors declare that the re-search was conducted in the absence of any commercial or financial relationships that could be construed as a potential conflict of interest.

References

  1. Kowalczewski, P.Ł.; Zembrzuska, J. Advances in Biological Activities and Application of Plant Extracts. Appl. Sci. 2023, 13, 9324. [Google Scholar] [CrossRef]
  2. Herman, A.; Herman, A.P. Biological Activity of Fermented Plant Extracts for Potential Dermal Applications. Pharmaceutics 2023, 15, 2775. [Google Scholar] [CrossRef] [PubMed]
  3. Kucharska, E.; Sarpong, R.; Bobkowska, A.; Ryglewicz, J.; Nowak, A.; Kucharski, Ł.; Muzykiewicz-Szymańska, A.; Duchnik, W.; Pełech, R. Use of Silybum Marianum Extract and Bio-Ferment for Biodegradable Cosmetic Formulations to Enhance Antioxidant Potential and Effect of the Type of Vehicle on the Percutaneous Absorption and Skin Retention of Silybin and Taxifolin. Appl. Sci. 2024, 14, 169. [Google Scholar] [CrossRef]
  4. Pérez-Rivero, C.; López-Gómez, J.P. Unlocking the Potential of Fermentation in Cosmetics: A Review. Fermentation 2023, 9, 463. [Google Scholar] [CrossRef]
  5. Majchrzak, W.; Motyl, I.; Śmigielski, K. Biological and Cosmetical Importance of Fermented Raw Materials: An Overview. Molecules 2022, 27, 4845. [Google Scholar] [CrossRef] [PubMed]
  6. Faria, D.J.; de Carvalho, A.P.A.; Conte-Junior, C.A. Valorization of Fermented Food Wastes and Byproducts: Bioactive and Valuable Compounds, Bioproduct Synthesis, and Applications. Fermentation 2023, 9, 920. [Google Scholar] [CrossRef]
  7. Hussain, A.; Bose, S.; Wang, J.-H.; Yadav, M.K.; Mahajan, G.B.; Kim, H. Fermentation, a Feasible Strategy for Enhancing Bioactivity of Herbal Medicines. Food Res. Int. 2016, 81, 1–16. [Google Scholar] [CrossRef]
  8. Sharma, R.; Garg, P.; Kumar, P.; Bhatia, S.K.; Kulshrestha, S. Microbial Fermentation and Its Role in Quality Improvement of Fermented Foods. Fermentation 2020, 6, 106. [Google Scholar] [CrossRef]
  9. Gulsunoglu-Konuskan, Z.; Kilic-Akyilmaz, M. Microbial Bioconversion of Phenolic Compounds in Agro-Industrial Wastes: A Review of Mechanisms and Effective Factors. J. Agric. Food Chem. 2022, 70, 6901–6910. [Google Scholar] [CrossRef]
  10. Cvetanović, A.; Švarc-Gajić, J.; Zeković, Z.; Savić, S.; Vulić, J.; Mašković, P.; Ćetković, G. Comparative Analysis of Antioxidant, Antimicrobiological and Cytotoxic Activities of Native and Fermented Chamomile Ligulate Flower Extracts. Planta 2015, 242, 721–732. [Google Scholar] [CrossRef]
  11. He, X.; Zou, Y.; Yoon, W.-B.; Park, S.-J.; Park, D.-S.; Ahn, J. Effects of Probiotic Fermentation on the Enhancement of Biological and Pharmacological Activities of Codonopsis lanceolata Extracted by High Pressure Treatment. J. Biosci. Bioeng. 2011, 112, 188–193. [Google Scholar] [CrossRef] [PubMed]
  12. Garcia, C.; Guerin, M.; Souidi, K.; Remize, F. Lactic Fermented Fruit or Vegetable Juices: Past, Present and Future. Beverages 2020, 6, 8. [Google Scholar] [CrossRef]
  13. Ziemlewska, A.; Nizioł-Łukaszewska, Z.; Bujak, T.; Zagórska-Dziok, M.; Wójciak, M.; Sowa, I. Effect of Fermentation Time on the Content of Bioactive Compounds with Cosmetic and Dermatological Properties in Kombucha Yerba Mate Extracts. Sci. Rep. 2021, 11, 18792. [Google Scholar] [CrossRef]
  14. Vauzour, D.; Rodriguez-Mateos, A.; Corona, G.; Oruna-Concha, M.J.; Spencer, J.P.E. Polyphenols and Human Health: Prevention of Disease and Mechanisms of Action. Nutrients 2010, 2, 1106–1131. [Google Scholar] [CrossRef] [PubMed]
  15. Hussain, T.; Tan, B.; Yin, Y.; Blachier, F.; Tossou, M.C.B.; Rahu, N. Oxidative Stress and Inflammation: What Polyphenols Can Do for Us? Oxidative Med. Cell. Longev. 2016, 2016, e7432797. [Google Scholar] [CrossRef] [PubMed]
  16. Park, H.; Kim, H.-S.; Eom, S.J.; Kim, K.-T.; Paik, H.-D. Antioxidative and Anticanceric Activities of Magnolia (Magnolia denudata) Flower Petal Extract Fermented by Pediococcus Acidilactici KCCM 11614. Molecules 2015, 20, 12154–12165. [Google Scholar] [CrossRef] [PubMed]
  17. Lee, S.-O.; Kim, S.-J.; Kim, J.-S.; Ji, H.; Lee, E.-O.; Lee, H.-J. Comparison of the Main Components and Bioactivity of Rhus Verniciflua Stokes Extracts by Different Detoxification Processing Methods. BMC Complement. Altern. Med. 2018, 18, 242. [Google Scholar] [CrossRef] [PubMed]
  18. Song, J.-H.; Jeong, G.H.; Park, S.L.; Won, S.Y.; Paek, N.S.; Lee, B.-H.; Moon, S.-K. Inhibitory Effects of Fermented Extract of Ophiopogon Japonicas on Thrombin-Induced Vascular Smooth Muscle Cells. Mol. Med. Rep. 2016, 13, 426–432. [Google Scholar] [CrossRef] [PubMed]
  19. Oh, J.; Jeon, S.B.; Lee, Y.; Lee, H.; Kim, J.; Kwon, B.R.; Yu, K.-Y.; Cha, J.-D.; Hwang, S.-M.; Choi, K.-M.; et al. Fermented Red Ginseng Extract Inhibits Cancer Cell Proliferation and Viability. J. Med. Food 2015, 18, 421–428. [Google Scholar] [CrossRef]
  20. Sunder, S.; Bauman, J.S.; Decker, S.J.; Lifton, A.R.; Kumar, A. The Yeast AMP-Activated Protein Kinase Snf1 Phosphorylates the Inositol Polyphosphate Kinase Kcs1. J. Biol. Chem. 2024, 300, 105657. [Google Scholar] [CrossRef]
  21. Ioannou, P.; Ziogou, A.; Giannakodimos, I.; Giannakodimos, A.; Baliou, S.; Samonis, G. Infective Endocarditis by Lactobacillus Species—A Narrative Review. Antibiotics 2024, 13, 53. [Google Scholar] [CrossRef]
  22. Punia Bangar, S.; Suri, S.; Trif, M.; Ozogul, F. Organic Acids Production from Lactic Acid Bacteria: A Preservation Approach. Food Biosci. 2022, 46, 101615. [Google Scholar] [CrossRef]
  23. Fatani, S.A. Substance Use Disorders Management Educational Intervention: Development and Evaluating a Tailored Substance Use Disorder Intervention for Community Pharmacists in Saskatoon. Ph.D. Thesis, The University of Saskatchewan, Saskatoon, SK, Canada, 2021. [Google Scholar]
  24. Tariq, S.; Wani, S.; Rasool, W.; Shafi, K.; Bhat, M.A.; Prabhakar, A.; Shalla, A.H.; Rather, M.A. A Comprehensive Review of the Antibacterial, Antifungal and Antiviral Potential of Essential Oils and Their Chemical Constituents against Drug-Resistant Microbial Pathogens. Microb. Pathog. 2019, 134, 103580. [Google Scholar] [CrossRef]
  25. Caputo, L.; Capozzolo, F.; Amato, G.; De Feo, V.; Fratianni, F.; Vivenzio, G.; Nazzaro, F. Chemical Composition, Antibiofilm, Cytotoxic, and Anti-Acetylcholinesterase Activities of Myrtus communis L. Leaves Essential Oil. BMC Complement. Med. Ther. 2022, 22, 142. [Google Scholar] [CrossRef]
  26. Djipa, C.D.; Delmée, M.; Quetin-Leclercq, J. Antimicrobial Activity of Bark Extracts of Syzygium jambos (L.) Alston (Myrtaceae). J. Ethnopharmacol. 2000, 71, 307–313. [Google Scholar] [CrossRef]
  27. Da Silva, V.P.; Alves, C.C.F.; Miranda, M.L.D.; Bretanha, L.C.; Balleste, M.P.; Micke, G.A.; Silveira, E.V.; Martins, C.H.G.; Ambrosio, M.A.L.V.; De Souza Silva, T.; et al. Chemical Composition and In Vitro Leishmanicidal, Antibacterial and Cytotoxic Activities of Essential Oils of the Myrtaceae Family Occurring in the Cerrado Biome. Ind. Crops Prod. 2018, 123, 638–645. [Google Scholar] [CrossRef]
  28. Ferreira Macedo, J.G.; Linhares Rangel, J.M.; De Oliveira Santos, M.; Camilo, C.J.; Martins Da Costa, J.G.; Maria De Almeida Souza, M. Therapeutic Indications, Chemical Composition and Biological Activity of Native Brazilian Species from Psidium Genus (Myrtaceae): A Review. J. Ethnopharmacol. 2021, 278, 114248. [Google Scholar] [CrossRef]
  29. De Oliveira Raphaelli, C.; Camargo, T.M.; Radünz, M.; Dos Santos Pereira, E.; Da Rocha Concenço, F.I.G.; Vizzotto, M.; Da Rosa Zavareze, E.; Nora, L. Eugenia Pyriformis Cambess-Myrtaceae: An Unexplored Brazilian Specieswith Antimicrobial and Antioxidant Potential. CNF 2024, 20, 687–702. [Google Scholar] [CrossRef]
  30. Ojewole, J.A.O. Anti-Inflammatory and Analgesic Effects of Psidium Guajava Linn. (Myrtaceae) Leaf Aqueous Extracts in Rats and Mice. Methods Find. Exp. Clin. Pharmacol. 2006, 28, 441. [Google Scholar] [CrossRef] [PubMed]
  31. García, Y.M.; Ramos, A.L.C.C.; De Oliveira Júnior, A.H.; De Paula, A.C.C.F.F.; De Melo, A.C.; Andrino, M.A.; Silva, M.R.; Augusti, R.; De Araújo, R.L.B.; De Lemos, E.E.P.; et al. Physicochemical Characterization and Paper Spray Mass Spectrometry Analysis of Myrciaria Floribunda (H. West Ex Willd.) O. Berg Accessions. Molecules 2021, 26, 7206. [Google Scholar] [CrossRef] [PubMed]
  32. Olajide, O.A.; Awe, S.O.; Makinde, J.M. Pharmacological Studies on the Leaf of Psidium Guajava. Fitoterapia 1999, 70, 25–31. [Google Scholar] [CrossRef]
  33. Dexheimer, G.M.; De Oliveira Becker Delving, L.K.; De Oliveira, H.S.; Biolchi, V.; Goettert, M.I.; Pozzobon, A. Calyptranthes Grandifolia O.Berg (Myrtaceae) Ethanolic Extract Inhibits TNF-α Gene Expression and Cytokine Release In Vitro. Mol. Med. Rep. 2017, 15, 2873–2880. [Google Scholar] [CrossRef] [PubMed]
  34. Haro-González, J.N.; Castillo-Herrera, G.A.; Martínez-Velázquez, M.; Espinosa-Andrews, H. Clove Essential Oil (Syzygium aromaticum L. Myrtaceae): Extraction, Chemical Composition, Food Applications, and Essential Bioactivity for Human Health. Molecules 2021, 26, 6387. [Google Scholar] [CrossRef] [PubMed]
  35. Nuñez, L.; D’ Aquino, M. Microbicide Activity of Clove Essential Oil (Eugenia caryophyllata). Braz. J. Microbiol. 2012, 43, 1255–1260. [Google Scholar] [CrossRef] [PubMed]
  36. El-Saber Batiha, G.; Alkazmi, L.M.; Wasef, L.G.; Beshbishy, A.M.; Nadwa, E.H.; Rashwan, E.K. Syzygium aromaticum L. (Myrtaceae): Traditional Uses, Bioactive Chemical Constituents, Pharmacological and Toxicological Activities. Biomolecules 2020, 10, 202. [Google Scholar] [CrossRef] [PubMed]
  37. Makuch, E.; Nowak, A.; Günther, A.; Pełech, R.; Kucharski, Ł.; Duchnik, W.; Klimowicz, A. Enhancement of the Antioxidant and Skin Permeation Properties of Eugenol by the Esterification of Eugenol to New Derivatives. AMB Express 2020, 10, 187. [Google Scholar] [CrossRef] [PubMed]
  38. Makuch, E.; Nowak, A.; Günther, A.; Pełech, R.; Kucharski, Ł.; Duchnik, W.; Klimowicz, A. The Effect of Cream and Gel Vehicles on the Percutaneous Absorption and Skin Retention of a New Eugenol Derivative With Antioxidant Activity. Front. Pharmacol. 2021, 12, 658381. [Google Scholar] [CrossRef] [PubMed]
  39. Danthu, P.; Simanjuntak, R.; Fawbush, F.; Leong Pock Tsy, J.-M.; Razafimamonjison, G.; Abdillahi, M.M.; Jahiel, M.; Penot, E. The Clove Tree and Its Products (Clove Bud, Clove Oil, Eugenol): Prosperous Today but What of Tomorrow’s Restrictions? Fruits 2020, 75, 224–242. [Google Scholar] [CrossRef]
  40. Ratri, P.J.; Ayurini, M.; Khumaini, K.; Rohbiya, A. Clove Oil Extraction by Steam Distillation and Utilization of Clove Buds Waste as Potential Candidate for Eco-Friendly Packaging. J. Bahan Alam Terbarukan 2020, 9, 47–54. [Google Scholar] [CrossRef]
  41. Maddheshiya, S.; Ahmad, A.; Ahmad, W.; Zakir, F.; Aggarwal, G. Essential Oils for the Treatment of Skin Anomalies: Scope and Potential. South. Afr. J. Bot. 2022, 151, 187–197. [Google Scholar] [CrossRef]
  42. Esposito, E.; Nastruzzi, C.; Sguizzato, M.; Cortesi, R. Nanomedicines to Treat Skin Pathologies with Natural Molecules. Curr. Pharm. Des. 2019, 25, 2323–2337. [Google Scholar] [CrossRef] [PubMed]
  43. Parsaeimehr, A.; Martinez-Chapa, S.O.; Parra-Saldívar, R. Chapter 13—Medicinal Plants Versus Skin Disorders: A Survey From Ancient to Modern Herbalism. In The Microbiology of Skin, Soft Tissue, Bone and Joint Infections; Kon, K., Rai, M., Eds.; Clinical Microbiology: Diagnosis, Treatments and Prophylaxis of Infections; Academic Press: Cambridge, MA, USA, 2017; Volume 2, pp. 205–221. [Google Scholar]
  44. Ahmad, S.; Ullah, F.; Sadiq, A.; Ayaz, M.; Imran, M.; Ali, I.; Zeb, A.; Ullah, F.; Shah, M.R. Chemical Composition, Antioxidant and Anticholinesterase Potentials of Essential Oil of Rumex Hastatus D. Don Collected from the North West of Pakistan. BMC Complement. Altern. Med. 2016, 16, 29. [Google Scholar] [CrossRef] [PubMed]
  45. Adbhai, A.R.; Dewanjee, S.; Patel, K.G.; Karmakar, N. Sugar Beet Molasses Production and Utilization. In Sugar Beet Cultivation, Management and Processing; Misra, V., Srivastava, S., Mall, A.K., Eds.; Springer Nature: Singapore, 2022; pp. 885–904. ISBN 978-981-19273-0-0. [Google Scholar]
  46. Palmonari, A.; Cavallini, D.; Sniffen, C.J.; Fernandes, L.; Holder, P.; Fagioli, L.; Fusaro, I.; Biagi, G.; Formigoni, A.; Mammi, L. Short Communication: Characterization of Molasses Chemical Composition. J. Dairy Sci. 2020, 103, 6244–6249. [Google Scholar] [CrossRef] [PubMed]
  47. Al-Dhumri, S.A.; Al Mosallam, M.S.; Zhang, W.; Alharbi, S.; Abou-Elwafa, S.F. Application of Molasses as an Eco-Innovative Approach Substitutes Mineral Nitrogen Fertilization and Enhances Sugar Beet Productivity. Waste Biomass Valor. 2023, 14, 287–296. [Google Scholar] [CrossRef]
  48. Mordenti, A.L.; Giaretta, E.; Campidonico, L.; Parazza, P.; Formigoni, A. A Review Regarding the Use of Molasses in Animal Nutrition. Animals 2021, 11, 115. [Google Scholar] [CrossRef] [PubMed]
  49. Leonard, W.; Zhang, P.; Ying, D.; Adhikari, B.; Fang, Z. Fermentation Transforms the Phenolic Profiles and Bioactivities of Plant-Based Foods. Biotechnol. Adv. 2021, 49, 107763. [Google Scholar] [CrossRef] [PubMed]
  50. Yoshimura, M.; Amakura, Y.; Yoshida, T. Polyphenolic Compounds in Clove and Pimento and Their Antioxidative Activities. Biosci. Biotechnol. Biochem. 2011, 75, 2207–2212. [Google Scholar] [CrossRef] [PubMed]
  51. Bondet, V.; Brand-Williams, W.; Berset, C. Kinetics and Mechanisms of Antioxidant Activity Using the DPPH.Free Radical Method. LWT Food Sci. Technol. 1997, 30, 609–615. [Google Scholar] [CrossRef]
  52. Anissi, J.; El Hassouni, M.; Ouardaoui, A.; Sendide, K. A Comparative Study of the Antioxidant Scavenging Activity of Green Tea, Black Tea and Coffee Extracts: A Kinetic Approach. Food Chem. 2014, 150, 438–447. [Google Scholar] [CrossRef]
  53. Page, B.; Page, M.; Noel, C. A New Fluorometric Assay for Cytotoxicity Measurements In-Vitro. Int. J. Oncol. 1993, 3, 473–476. [Google Scholar] [CrossRef]
  54. Zagórska-Dziok, M.; Ziemlewska, A.; Mokrzyńska, A.; Nizioł-Łukaszewska, Z.; Wójciak, M.; Sowa, I. Evaluation of the Biological Activity of Hydrogel with Cornus mas L. Extract and Its Potential Use in Dermatology and Cosmetology. Molecules 2023, 28, 7384. [Google Scholar] [CrossRef] [PubMed]
  55. Karamać, M.; Pegg, R.B. Limitations of the Tetramethylmurexide Assay for Investigating the Fe(II) Chelation Activity of Phenolic Compounds. J. Agric. Food Chem. 2009, 57, 6425–6431. [Google Scholar] [CrossRef]
  56. Hossain, M.A.; Piyatida, P.; da Silva, J.A.T.; Fujita, M. Molecular Mechanism of Heavy Metal Toxicity and Tolerance in Plants: Central Role of Glutathione in Detoxification of Reactive Oxygen Species and Methylglyoxal and in Heavy Metal Chelation. J. Bot. 2012, 2012, e872875. [Google Scholar] [CrossRef]
  57. Lima, É.C.; Adebayo, M.A.; Machado, F.M. Kinetic and Equilibrium Models of Adsorption. In Carbon Nanomaterials as Adsorbents for Environmental and Biological Applications; Bergmann, C.P., Machado, F.M., Eds.; Carbon Nanostructures; Springer International Publishing: Cham, Switzerland, 2015; pp. 33–69. ISBN 978-3-319-18874-4. [Google Scholar]
  58. Moriasi, G.A.; Ireri, A.M.; Ngugi, M.P. In Vivo Cognitive-Enhancing, Ex Vivo Malondialdehyde-Lowering Activities and Phytochemical Profiles of Aqueous and Methanolic Stem Bark Extracts of Piliostigma thonningii (Schum.). Int. J. Alzheimer’s Dis. 2020, 2020, 1367075. [Google Scholar] [CrossRef] [PubMed]
  59. Yuenyong, J.; Pokkanta, P.; Phuangsaijai, N.; Kittiwachana, S.; Mahatheeranont, S.; Sookwong, P. GC-MS and HPLC-DAD Analysis of Fatty Acid Profile and Functional Phytochemicals in Fifty Cold-Pressed Plant Oils in Thailand. Heliyon 2021, 7, e06304. [Google Scholar] [CrossRef]
  60. Poletto, P.; Pereira, G.N.; Monteiro, C.R.M.; Pereira, M.A.F.; Bordignon, S.E.; De Oliveira, D. Xylooligosaccharides: Transforming the Lignocellulosic Biomasses into Valuable 5-Carbon Sugar Prebiotics. Process Biochem. 2020, 91, 352–363. [Google Scholar] [CrossRef]
  61. Othman, M.; Ariff, A.B.; Rios-Solis, L.; Halim, M. Extractive Fermentation of Lactic Acid in Lactic Acid Bacteria Cultivation: A Review. Front. Microbiol. 2017, 8, 2285. [Google Scholar] [CrossRef] [PubMed]
  62. Filipčev, B.; Lević, L.; Bodroža-Solarov, M.; Mišljenović, N.; Koprivica, G. Quality Characteristics and Antioxidant Properties of Breads Supplemented with Sugar Beet Molasses-Based Ingredients. Int. J. Food Prop. 2010, 13, 1035–1053. [Google Scholar] [CrossRef]
  63. Juan, M.-Y.; Chou, C.-C. Enhancement of Antioxidant Activity, Total Phenolic and Flavonoid Content of Black Soybeans by Solid State Fermentation with Bacillus subtilis BCRC 14715. Food Microbiol. 2010, 27, 586–591. [Google Scholar] [CrossRef]
  64. Zhou, Z.; Fu, C. A New Flavanone and Other Constituents from the Rhizomes of Cyperus Rotundus and Their Antioxidant Activities. Chem. Nat. Compd. 2013, 48, 963–965. [Google Scholar] [CrossRef]
  65. Cho, K.M.; Lee, J.H.; Yun, H.D.; Ahn, B.Y.; Kim, H.; Seo, W.T. Changes of Phytochemical Constituents (Isoflavones, Flavanols, and Phenolic Acids) during Cheonggukjang Soybeans Fermentation Using Potential Probiotics Bacillus Subtilis CS90. J. Food Compos. Anal. 2011, 24, 402–410. [Google Scholar] [CrossRef]
  66. Devi, A.; Konerira Aiyappaa, A.; Waterhouse, A.L. Adsorption and Biotransformation of Anthocyanin Glucosides and Quercetin Glycosides by Oenococcus oeni and Lactobacillus plantarum in Model Wine Solution. J. Sci. Food Agric. 2020, 100, 2110–2120. [Google Scholar] [CrossRef] [PubMed]
  67. YiRmiBeşoğlu, S.S.S.; Tefon Öztürk, B.E. Comparing Microbiological Profiles, Bioactivities, and Physicochemical and Sensory Properties of Donkey Milk Kefir and Cow Milk Kefir. Turk. J. Vet. Anim. Sci. 2020, 44, 774–781. [Google Scholar] [CrossRef]
  68. Wu, Y.; Li, S.; Tao, Y.; Li, D.; Han, Y.; Show, P.L.; Wen, G.; Zhou, J. Fermentation of Blueberry and Blackberry Juices Using Lactobacillus plantarum, Streptococcus thermophilus and Bifidobacterium bifidum: Growth of Probiotics, Metabolism of Phenolics, Antioxidant Capacity In Vitro and Sensory Evaluation. Food Chem. 2021, 348, 129083. [Google Scholar] [CrossRef] [PubMed]
  69. Sinz, S.; Kunz, C.; Liesegang, A.; Braun, U.; Marquardt, S.; Soliva, C.R.; Kreuzer, M. In Vitro Bioactivity of Various Pure Flavonoids in Ruminal Fermentation, with Special Reference to Methane Formation. Czech J. Anim. Sci. 2018, 63, 293–304. [Google Scholar] [CrossRef]
  70. Sordon, S.; Popłoński, J.; Tronina, T.; Huszcza, E. Microbial Glycosylation of Daidzein, Genistein and Biochanin A: Two New Glucosides of Biochanin A. Molecules 2017, 22, 81. [Google Scholar] [CrossRef]
  71. Prashar, A.; Locke, I.C.; Evans, C.S. Cytotoxicity of Clove (Syzygium aromaticum) Oil and Its Major Components to Human Skin Cells. Cell Prolif. 2006, 39, 241–248. [Google Scholar] [CrossRef] [PubMed]
  72. Kim, D.; Hwang, Y.; Chang, B.; Kim, D.; Cho, H.; Kim, S. Effects of the Syzygium aromaticum L. Extract on Antioxidation and Inhibition of Matrix Metalloproteinase in Human Dermal Fibroblast. Asian Pac. J. Trop. Biomed. 2019, 9, 53. [Google Scholar] [CrossRef]
  73. El Ghallab, Y.; Al Jahid, A.; Jamal Eddine, J.; Ait Haj Said, A.; Zarayby, L.; Derfoufi, S. Syzygium aromaticum L.: Phytochemical Investigation and Comparison of the Scavenging Activity of Essential Oil, Extracts and Eugenol. Adv. Tradit. Med. 2020, 20, 153–158. [Google Scholar] [CrossRef]
  74. Triandriani, W.; Sogandi; Saputri, D.D.; Suhendar, U. Antioxidant Activity of Endophytic Bacterial Extract Isolated from Clove Leaf (Syzygium aromaticum L.). JAAB 2020, 1, 9–17. [Google Scholar] [CrossRef]
  75. Sharma, A.; Bhardwaj, G.; Sohal, H.S.; Gohain, A. Eugenol. In Nutraceuticals and Health Care; Elsevier: Amsterdam, The Netherlands, 2022; pp. 177–198. ISBN 978-0-323-89779-2. [Google Scholar]
  76. Ulanowska, M.; Olas, B. Biological Properties and Prospects for the Application of Eugenol—A Review. IJMS 2021, 22, 3671. [Google Scholar] [CrossRef] [PubMed]
  77. Gulcin, I. Antioxidant Activity of Eugenol: A Structure–Activity Relationship Study. J. Med. Food 2011, 14, 975–985. [Google Scholar] [CrossRef] [PubMed]
  78. Alexa, V.T.; Galuscan, A.; Soica, C.M.; Cozma, A.; Coricovac, D.; Borcan, F.; Popescu, I.; Mioc, A.; Szuhanek, C.; Dehelean, C.A.; et al. In Vitro Assessment of the Cytotoxic and Antiproliferative Profile of Natural Preparations Containing Bergamot, Orange and Clove Essential Oils. Molecules 2022, 27, 990. [Google Scholar] [CrossRef] [PubMed]
Figure 1. Comparison of kinetic curves of changes in lactic acid yield during stem fermentation in the presence of LAB: FSE-1 (L. reuteri MI_0168); FSE-2 (L. salivarius LY_0652); FSE-3 (L. brevis LY_1120); FSE-4 (L. acidophilus MI-0078); FSE-5 (L. rhamnosus MI-0272); FSE-6 (L. plantarum MI-0102)—different lines correspond to values determined using Equation (3). Process parameters: initial sugar content of 3.20%; inoculum content of 3.20%; plant material content of 1.60%.
Applsci 14 04900 g001
Figure 2. Course of fitting the tested AA function to experimental points during stem fermentation in the presence of LAB: FSE-1 (L. reuteri MI_0168); FSE-2 (L. salivarius LY_0652); FSE-3 (L. brevis LY_1120); FSE-4 (L. acidophilus MI-0078); FSE-5 (L. rhamnosus MI-0272); FSE-6 (L. plantarum MI-0102).MI-0102).
Applsci 14 04900 g002
Figure 3. The course of fitting the tested TPC function to experimental points during stem fermentation in the presence of LAB: FSE-1 (L. reuteri MI_0168); FSE-2 (L. salivarius LY_0652); FSE-3 (L. brevis LY_1120); FSE-4 (L. acidophilus MI-0078); FSE-5 (L. rhamnosus MI-0272); and FSE-6 (L. plantarum MI-0102).
Applsci 14 04900 g003
Figure 4. Comparison of kinetic curves of lactic acid yield changes during stem fermentation using initial sugar content 1.60% (blue line); 3.20% (red line); 4.60% (black line). Process parameters: L. rhamnosus MI-0272, inoculum content 3.20%; plant material content 1.60%.
Applsci 14 04900 g004
Figure 5. The course of changes in output of AA and TPC parameters per unit weight of plant material used during stem fermentation in the presence of L. rhamnosus MI-0272.
Applsci 14 04900 g005
Figure 6. The course of fitting the tested TPC function to the experimental points during stem fermentation in the presence of L. rhamnosus MI-0272.
Applsci 14 04900 g006
Figure 7. The effect of S. aromaticum L. fermented stems extract (FSE) and stems extract (SE) in the concentration range of 0.1–10.0% on the reduction in resazurin in keratinocytes (HaCaTs) after 24-h exposure. Control cells were keratinocytes untreated with the tested samples, for which viability was assumed to be 100%. Data are the means ± SD of three independent experiments, each consisting of three replicates per test group. *** p < 0.0001, ** p < 0.01, * p < 0.05.
Applsci 14 04900 g007
Figure 8. The effect of S. aromaticum L. fermented stems extract (FSE) and stems extract (SE) in the concentration range of 0.1–10.0%, on the reduction in resazurin in fibroblasts (HDF) after 24-h exposure. Control cells were fibroblasts untreated with the tested samples for which viability was assumed to be 100%. Data are the means ± SD of three independent experiments. each consisting of three replicates per test group. **** p < 0.0001, *** p = 0.0006, ** p < 0.01.
Applsci 14 04900 g008
Figure 9. The effect of S. aromaticum L. fermented stems extract (FSE) and stems extract, in the concentration range of 0.1–10.0%, on the neutral red dye uptake in keratinocytes (HaCaTs) after 24 h of exposure. Control cells (green) were keratinocytes untreated with the tested samples for which viability was assumed to be 100%. Data are the means ± SD of three independent experiments, each consisting of three replicates per test group. **** p < 0.0001, *** p = 0.0006, ** p = 0.0015, * p = 0.01.
Applsci 14 04900 g009
Figure 10. The effect of S. aromaticum L. fermented stems extract (FSE) and stems extract (SE), in the concentration range of 0.1–10.0%, on the neutral red dye uptake in fibroblasts (HDFs) after 24 h of exposure. Control cells (green) were keratinocytes untreated with the tested samples for which viability was assumed to be 100%. Data are the means ± SD of three independent experiments, each consisting of three replicates per test group. ** p < 0.01, * p = 0.0121.
Applsci 14 04900 g010
Table 1. Technological parameters affecting the fermentation process of stems and the ranges of their changes.
Parameters of the Fermentation Process
UnitRanges of Change
Type of microorganism-L. reuteri MI_0168
L. salivarius LY_0652
L. brevis LY_1120
L. acidophilus MI-0078
L. rhamnosus MI-0272
L. plantarum MI-0102
Initial sugar content%1.60–4.60
Plant raw material content%0.032–12.80
Fermentation timedays1–10
Table 2. Studies on the effect of the type of microorganism (L. reuteri MI_0168, L. salivarius LY_0652, L. brevis LY_1120, L. acidophilus MI-0078, L. rhamnosus MI-0272, and L. plantarum MI-0102) on changes in antioxidant activity (AA), total polyphenol content (TPC), and lactic acid efficiency (LAe).
Fermented Stems Extract/Type of MicroorganismFermentation TimeAATPCLAe
Daysmmol Tx/Lmmol GA/L%
FSE-1
L. reuteri MI_0168
14.12 ± 0.111.91 ± 0.0940 ± 1
54.20 ± 0.172.53 ± 0.1653 ± 1
94.23 ± 0.192.83 ± 0.2079 ± 1
104.23 ± 0.182.83 ± 0.1380 ± 1
FSE-2
L. salivarius LY_0652
14.10 ± 0.191.90 ± 0.1242 ± 1
54.18 ± 0.112.52 ± 0.1952 ± 1
94.21 ± 0.092.81 ± 0.1363 ± 1
104.21 ± 0.212.81 ± 0.1158 ± 1
FSE-3
L. brevis LY_1120
13.99 ± 0.091.89 ± 0.0941 ± 1
54.00 ± 0.072.44 ± 0.0356 ± 1
94.19 ± 0.112.65 ± 0.0169 ± 1
104.19 ± 0.192.65 ± 0.0669 ± 1
FSE-4
L. acidophilus MI-0078
14.11 ± 0.191.89 ± 0.1141 ± 1
54.13 ± 0.142.44 ± 0.1258 ± 1
94.22 ± 0.192.65 ± 0.1170 ± 1
104.22 ± 0.162.65 ± 0.1177 ± 1
FSE-5
L. rhamnosus MI-0272
14.11 ± 0.101.92 ± 0.0950 ± 1
54.19 ± 0.112.52 ± 0.2185 ± 1
94.23 ± 0.112.82 ± 0.1389 ± 1
104.23 ± 0.132.82 ± 0.1587 ± 1
FSE-6
L. plantarum MI-0102
13.99 ± 0.221.91 ± 0.1347 ± 1
54.12 ± 0.192.51 ± 0.1369 ± 1
94.20 ± 0.172.81 ± 0.2085 ± 1
104.20 ± 0.172.81 ± 0.2185 ± 1
Mean ± SD (n = 3), process parameters: initial sugar content 3.20%; inoculum content 3.20%, plant material content 1.60%, fermentation time 10 days.
Table 3. Studies on the effect of the initial amount of sugars on changes in antioxidant activity (AA), total polyphenol content (TPC), and lactic acid efficiency (LAe).
Fermented Stems Extract/Initial Sugars ContentFermentation TimeAATPCLAe
Daysmmol Tx/Lmmol GA/L%
FSE-7
1.60%
14.09 ± 0.211.90 ± 0.1144 ± 1
54.17 ± 0.202.50 ± 0.1778 ± 1
94.21 ± 0.182.80 ± 0.1883 ± 1
FSE-8
3.20%
14.11 ± 0.201.92 ± 0.2150 ± 1
54.19 ± 0.172.52 ± 0.2185 ± 1
94.23 ± 0.132.82 ± 0.1889 ± 1
FSE-9
4.60%
14.24 ± 0.171.93 ± 0.1943 ± 1
54.25 ± 0.212.53 ± 0.1976 ± 1
94.29 ± 0.222.84 ± 0.0981 ± 1
Mean ± SD (n = 3), process parameters: L. rhamnosus MI-0272, inoculum content 3.20%; plant material content 1.60%, fermentation time 9 days.
Table 4. Studies on the effect of raw plant material content changes: antioxidant activity (AA), total polyphenol content (TPC), and lactic acid efficiency (LAe).
Fermented Stems Extract/Plant Material ContentFermentation TimeAATPCLAe
Daysmmol Tx/Lmmol GA/L%
FSE-10
0.032%
11.36 ± 0.111.02 ± 0.1142 ± 1
52.13 ± 0.111.25 ± 0.1149 ± 1
92.33 ± 0.141.65 ± 0.1979 ± 1
102.37 ± 0.142.43 ± 0.1987 ± 1
FSE-11
0.16%
11.77 ± 0.171.18 ± 0.1343 ± 1
52.21 ± 0.181.25 ± 0.1354 ± 1
92.41 ± 0.191.88 ± 0.1757 ± 1
102.45 ± 0.132.04 ± 0.1786 ± 1
FSE-12
0.32%
11.77 ± 0.111.25 ± 0.1940 ± 1
52.37 ± 0.121.49 ± 0.1353 ± 1
92.45 ± 0.212.19 ± 0.1387 ± 1
102.49 ± 0.192.35 ± 0.1986 ± 1
FSE-13
0.80%
12.81 ± 0.191.33 ± 0.1236 ± 1
54.01 ± 0.211.49 ± 0.1555 ± 1
94.25 ± 0.192.19 ± 0.1971 ± 1
104.29 ± 0.232.35 ± 0.1788 ± 1
FSE-14
1.60%
14.17 ± 0.191.46 ± 0.0950 ± 1
54.19 ± 0.221.57 ± 0.2185 ± 1
94.29 ± 0.162.66 ± 0.2189 ± 1
104.29 ± 0.112.82 ± 0.2387 ± 1
FSE-15
3.20%
15.70 ± 0.192.09 ± 0.1850 ± 1
56.22 ± 0.122.19 ± 0.1885 ± 1
98.10 ± 0.123.53 ± 0.2188 ± 1
108.14 ± 0.103.76 ± 0.2187 ± 1
FSE-16
6.40%
19.15 ± 0.135.09 ± 0.1950 ± 1
511.11 ± 0.135.33 ± 0.2085 ± 1
926.88 ± 0.215.96 ± 0.1988 ± 1
1026.88 ± 0.215.96 ± 0.1985 ± 1
FSE-17
12.80%
19.71 ± 0.115.17 ± 0.1149 ± 1
511.15 ± 0.225.41 ± 0.1883 ± 1
926.92 ± 0.226.03 ± 0.1683 ± 1
1027.00 ± 0.266.19 ± 0.1381 ± 1
Mean ± SD (n = 3), process parameters: L. rhamnosus MI-0272, inoculum content 3.20%; initial sugar content 3.20%, fermentation time: 9 days.
Table 5. The results for the activity, TPC, and LA efficiency of FSE and PE from S. aromaticum L.
Cosmetic Raw MaterialChelating Activity
ChA
Reduction Activity
RA
Antioxidant Activity
AA
Total Polyphenol Content
TPC
LA Efficiency
LAe
mmol Fe2+/L FSEmmol Fe3+/L FSEmmol Tx/Lmmol GA/L%
FSE *0.30 ± 0.0146.22 ± 0.2926.88 ± 0.285.96 ± 0.1988 ± 1
SE **0.12 ± 0.0129.31 ± 0.2113.24 ± 0.192.64 ± 0.110
Mean ± SD (n = 3), * fermentation process parameters of stems in the presence of LAB and beet molasses: type of microorganism (L. rhamnosus MI-0272), initial sugar content (3.20%), plant material content (6.40%), process time (9 days), ** parameters for the extraction process of stems using a 40 kHz ultrasonic bath: plant material content (6.40%), process time (20 min), and temperature of extraction (40 °C).
Disclaimer/Publisher’s Note: The statements, opinions and data contained in all publications are solely those of the individual author(s) and contributor(s) and not of MDPI and/or the editor(s). MDPI and/or the editor(s) disclaim responsibility for any injury to people or property resulting from any ideas, methods, instructions or products referred to in the content.

