
A Novel Debonding Damage Identification Approach of Hidden Frame-Supported Glass Curtain Walls Based on UAV-LDV System


Abstract
:1. Introduction
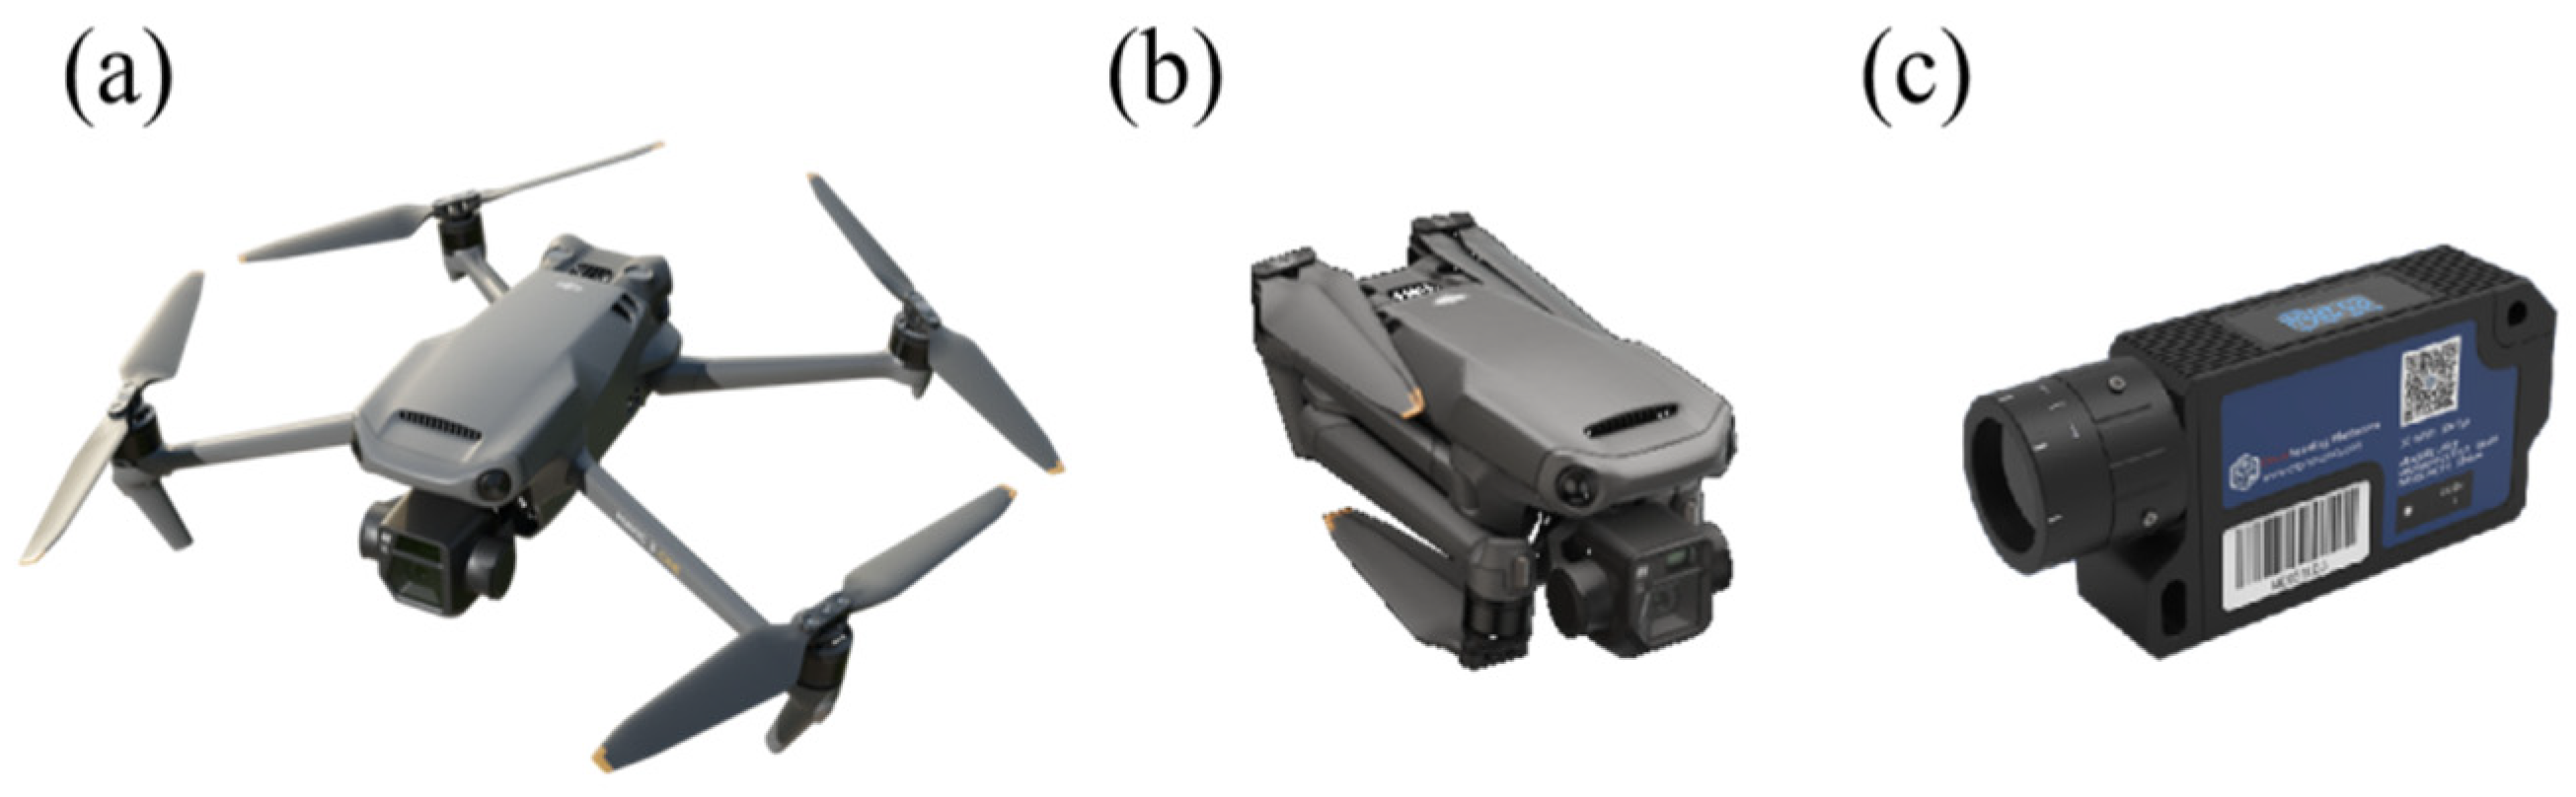
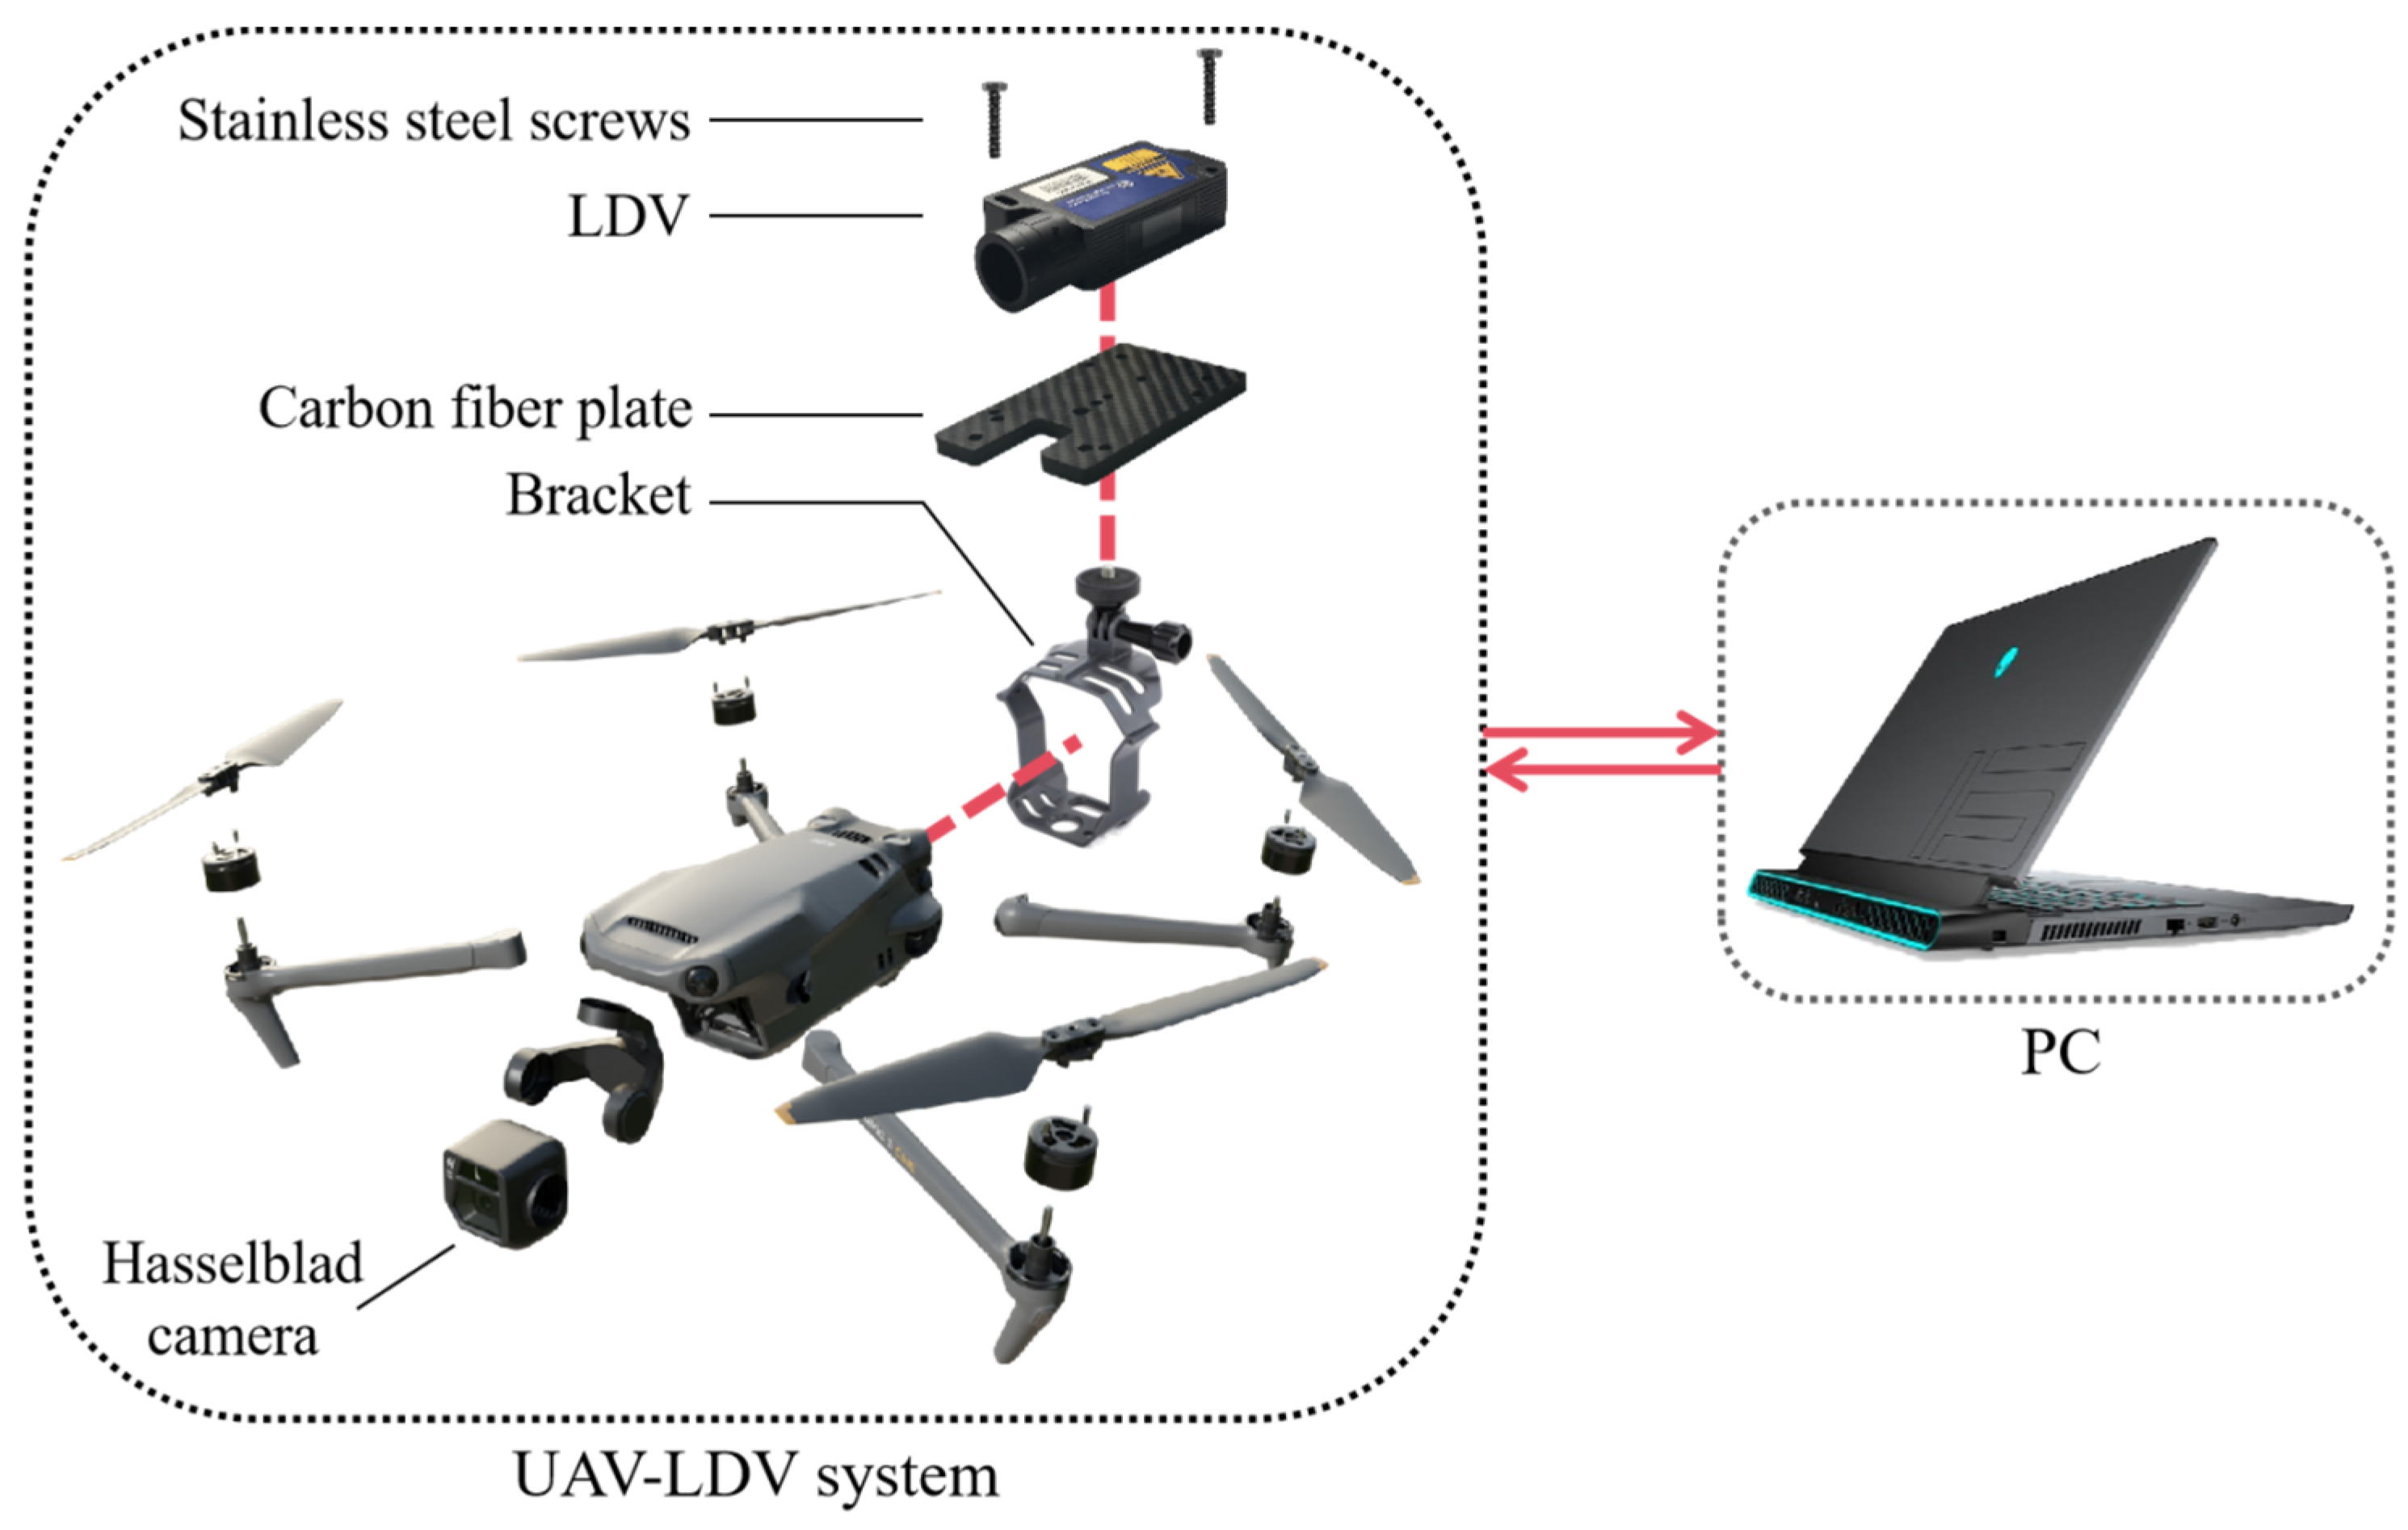
2. UAV and LDV Selection
3. Influence Factors of the UAV-LDV System
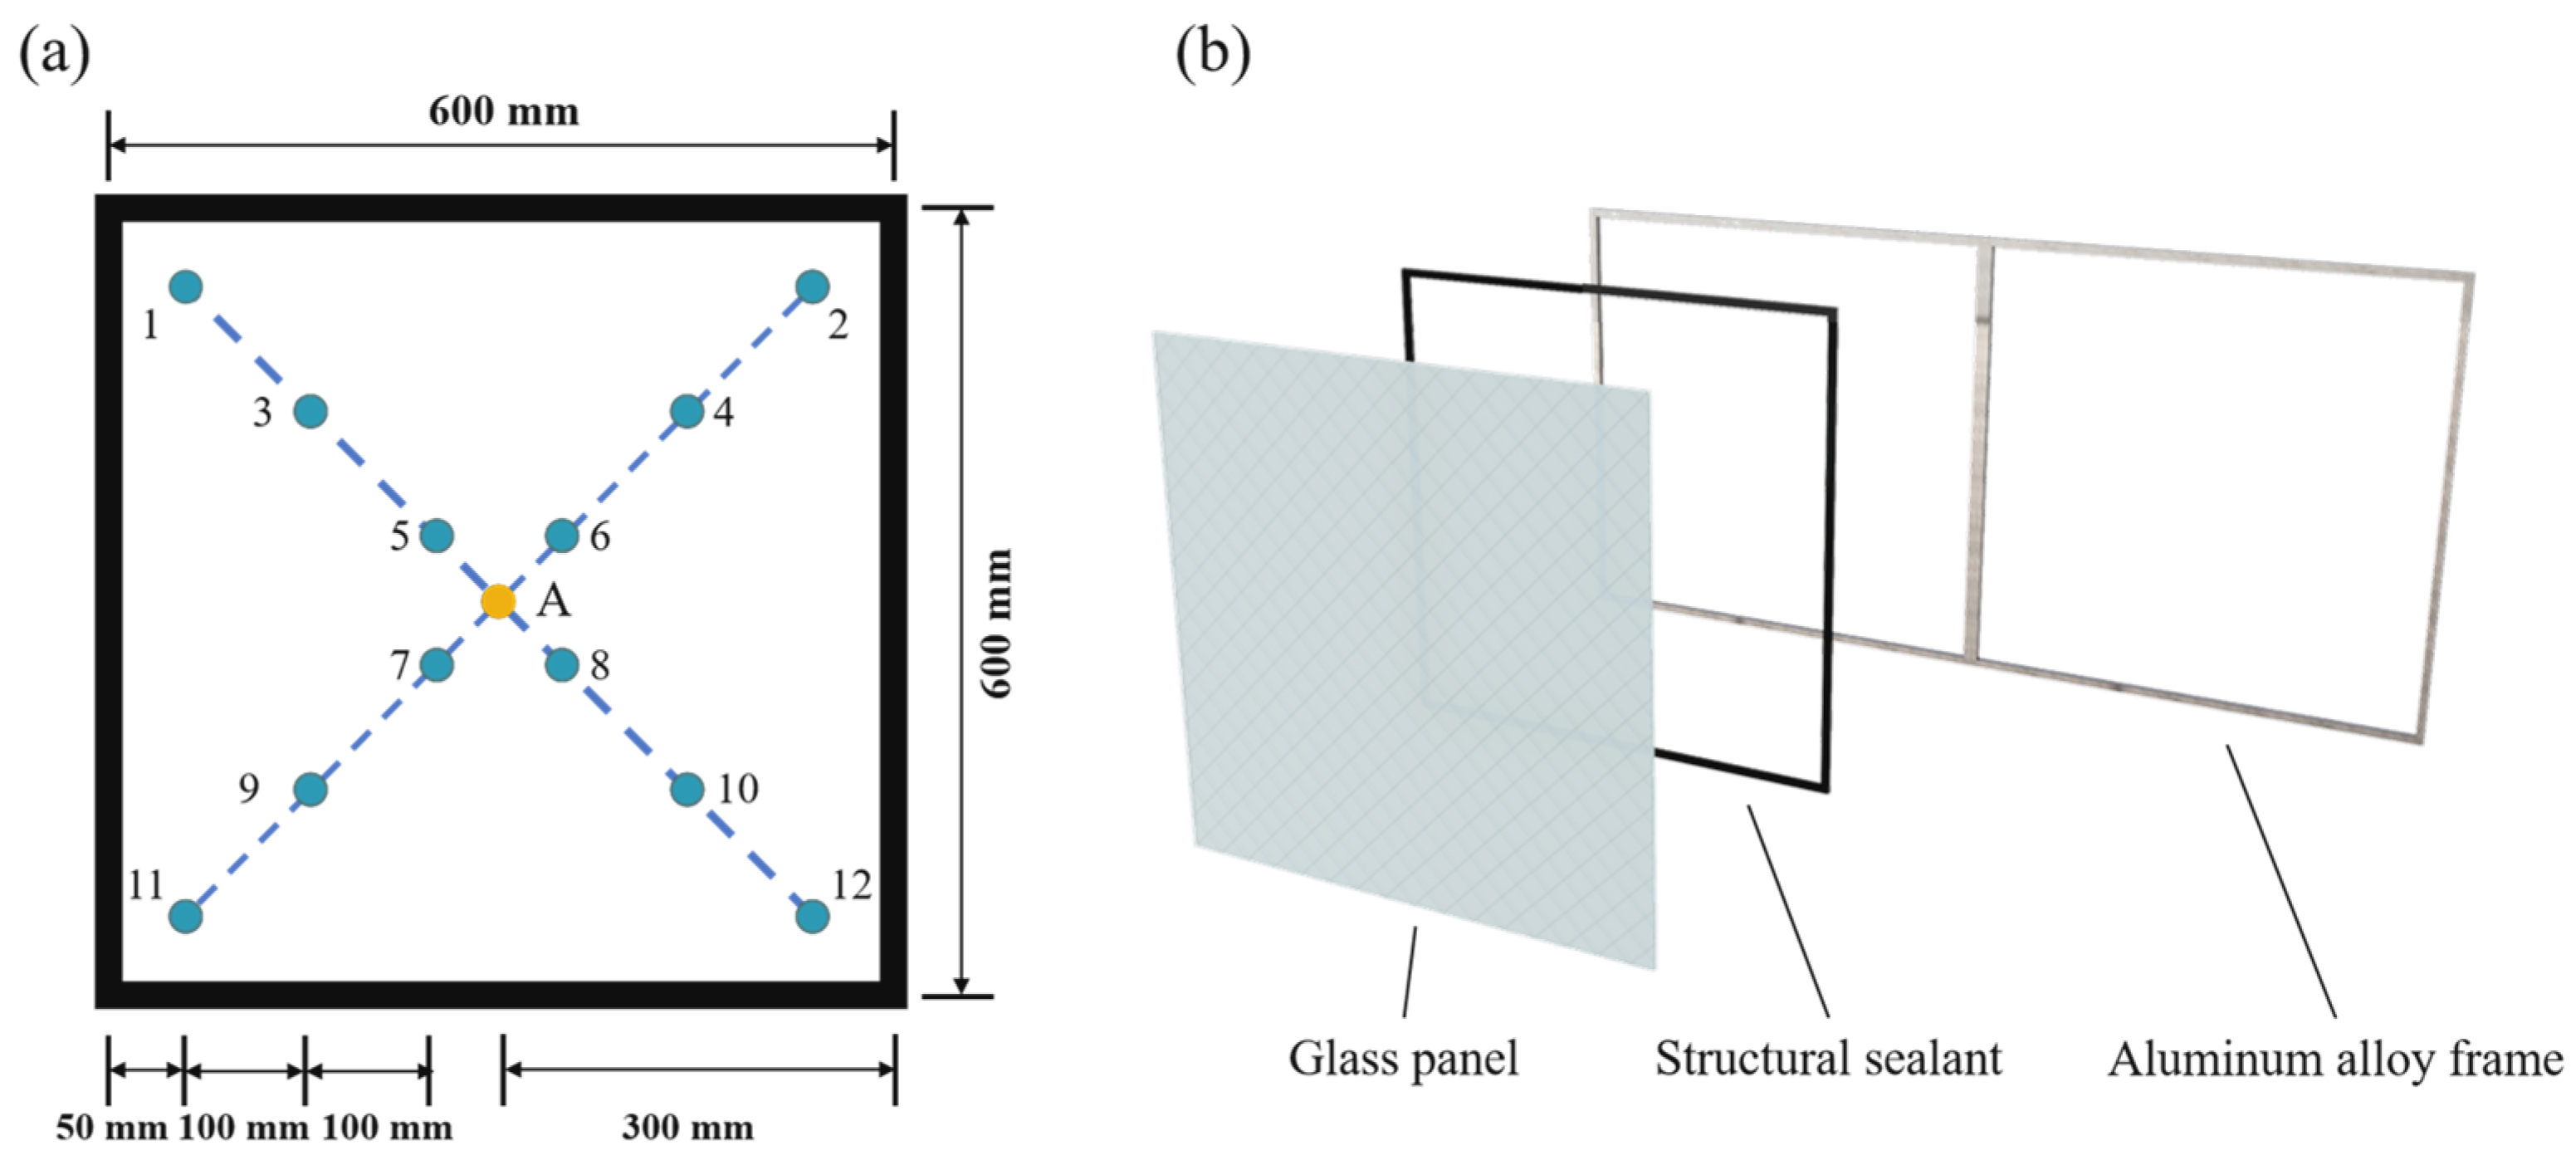
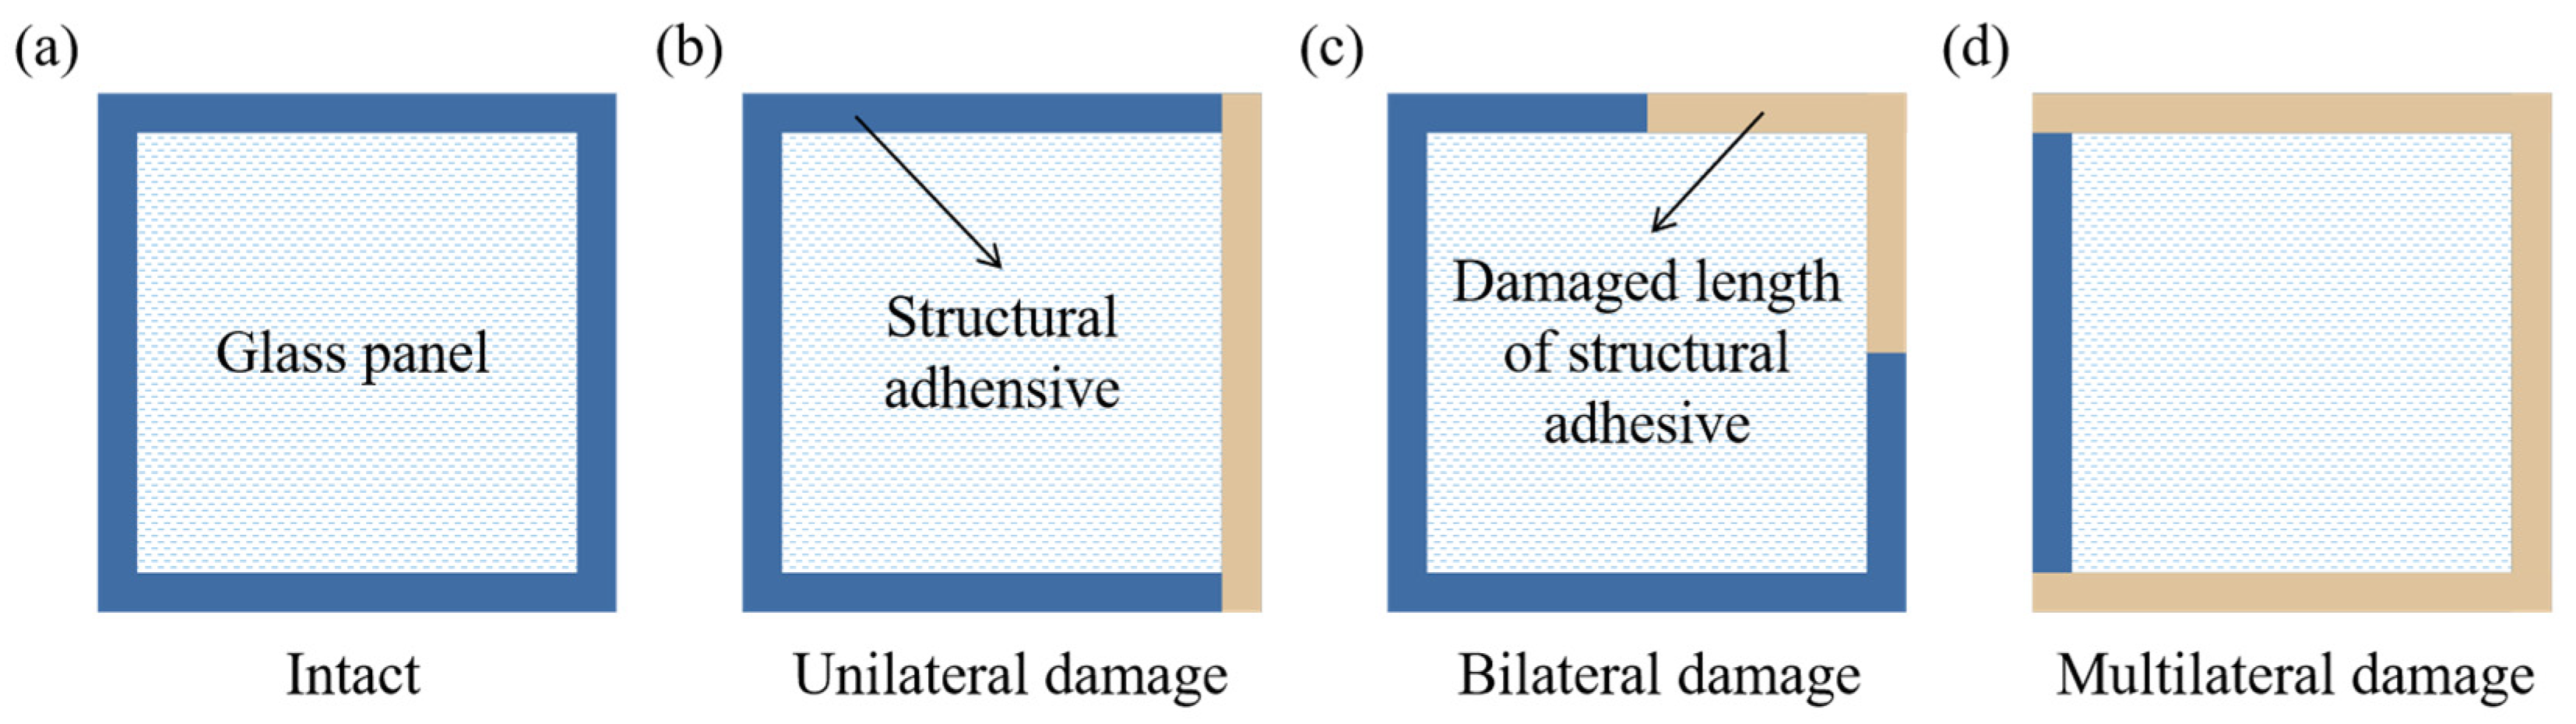
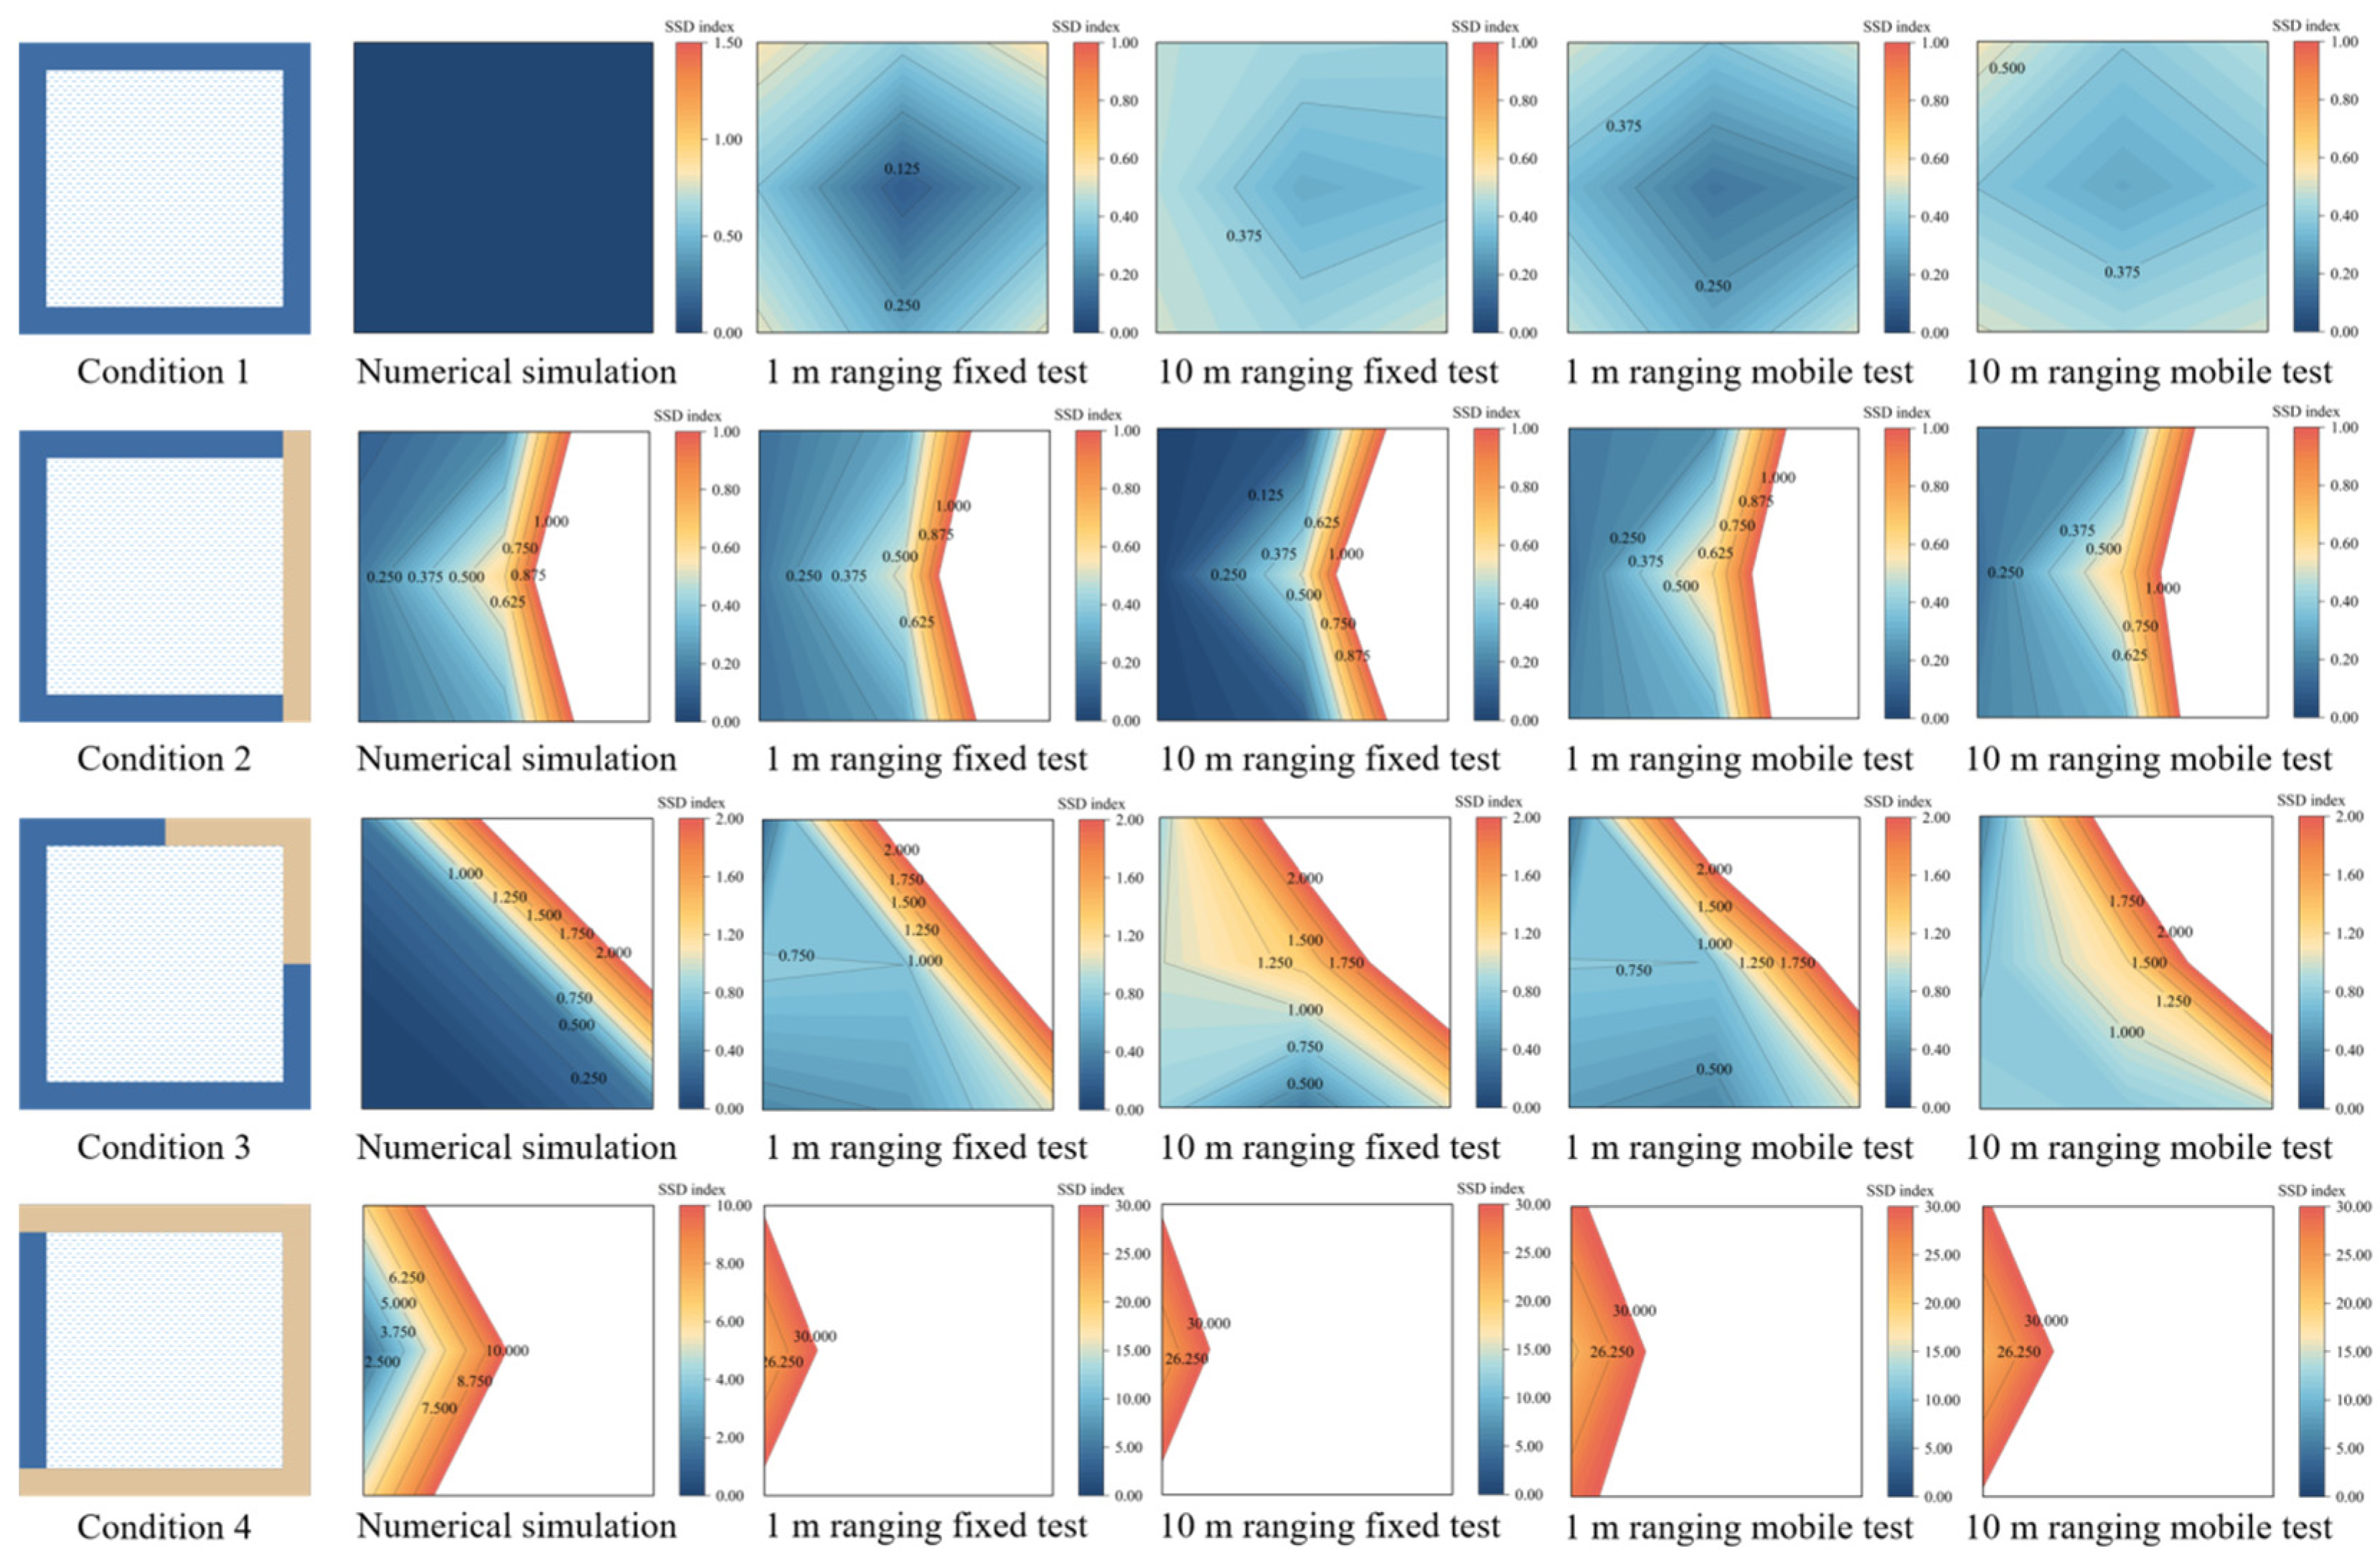
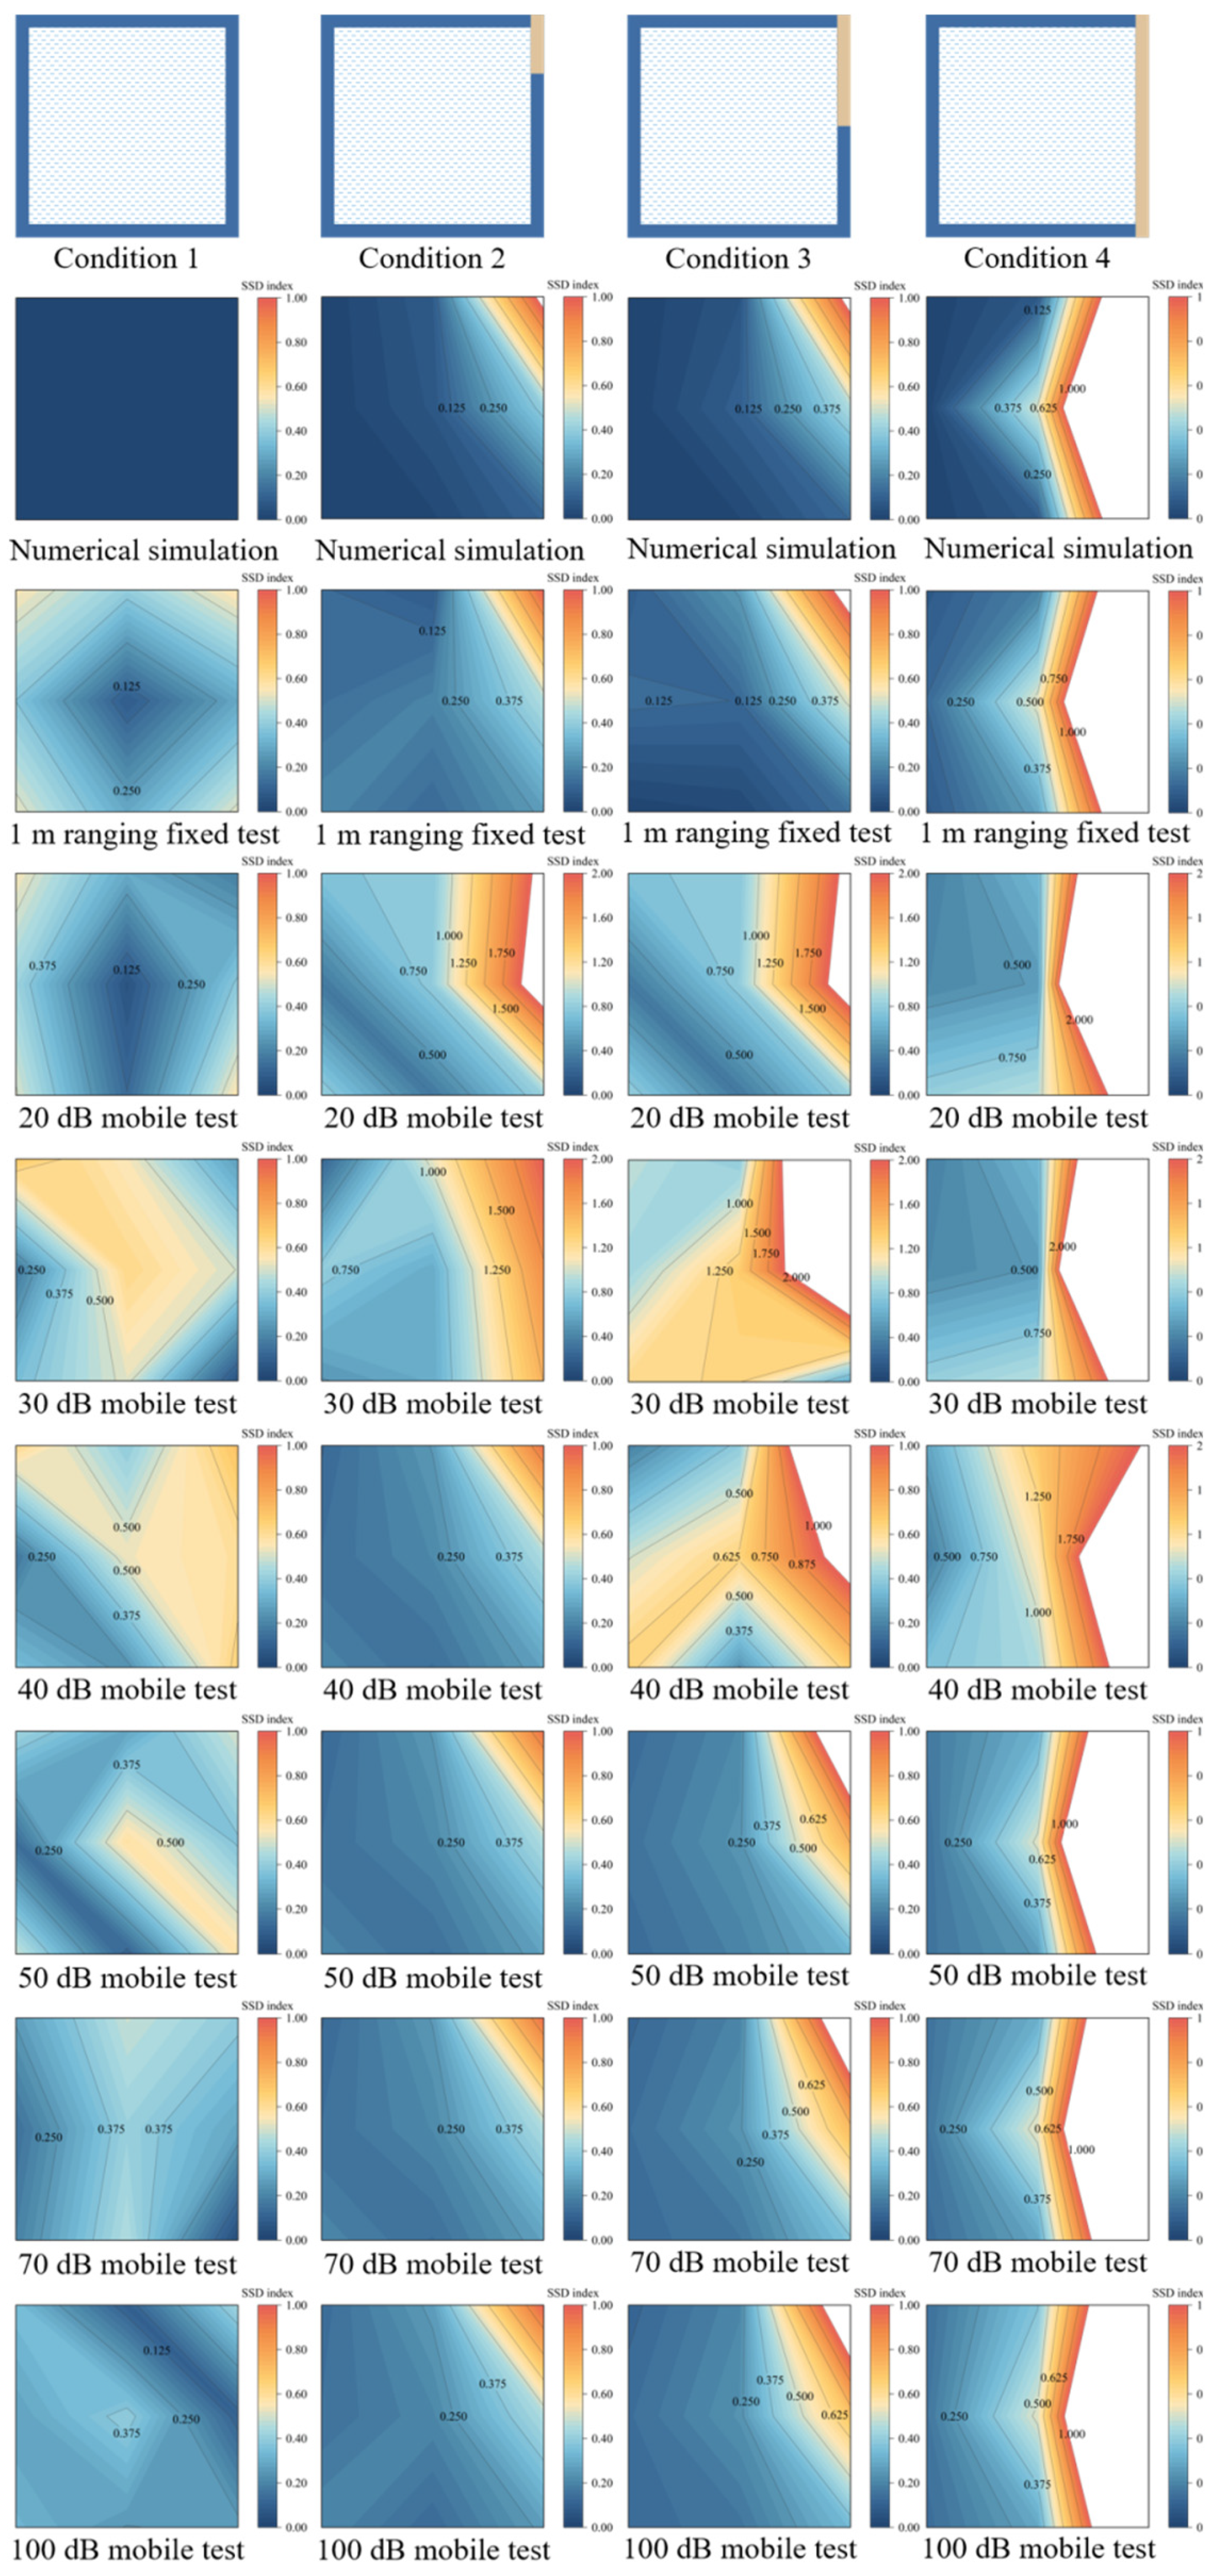
3.1. Selection of Assessment Indicators
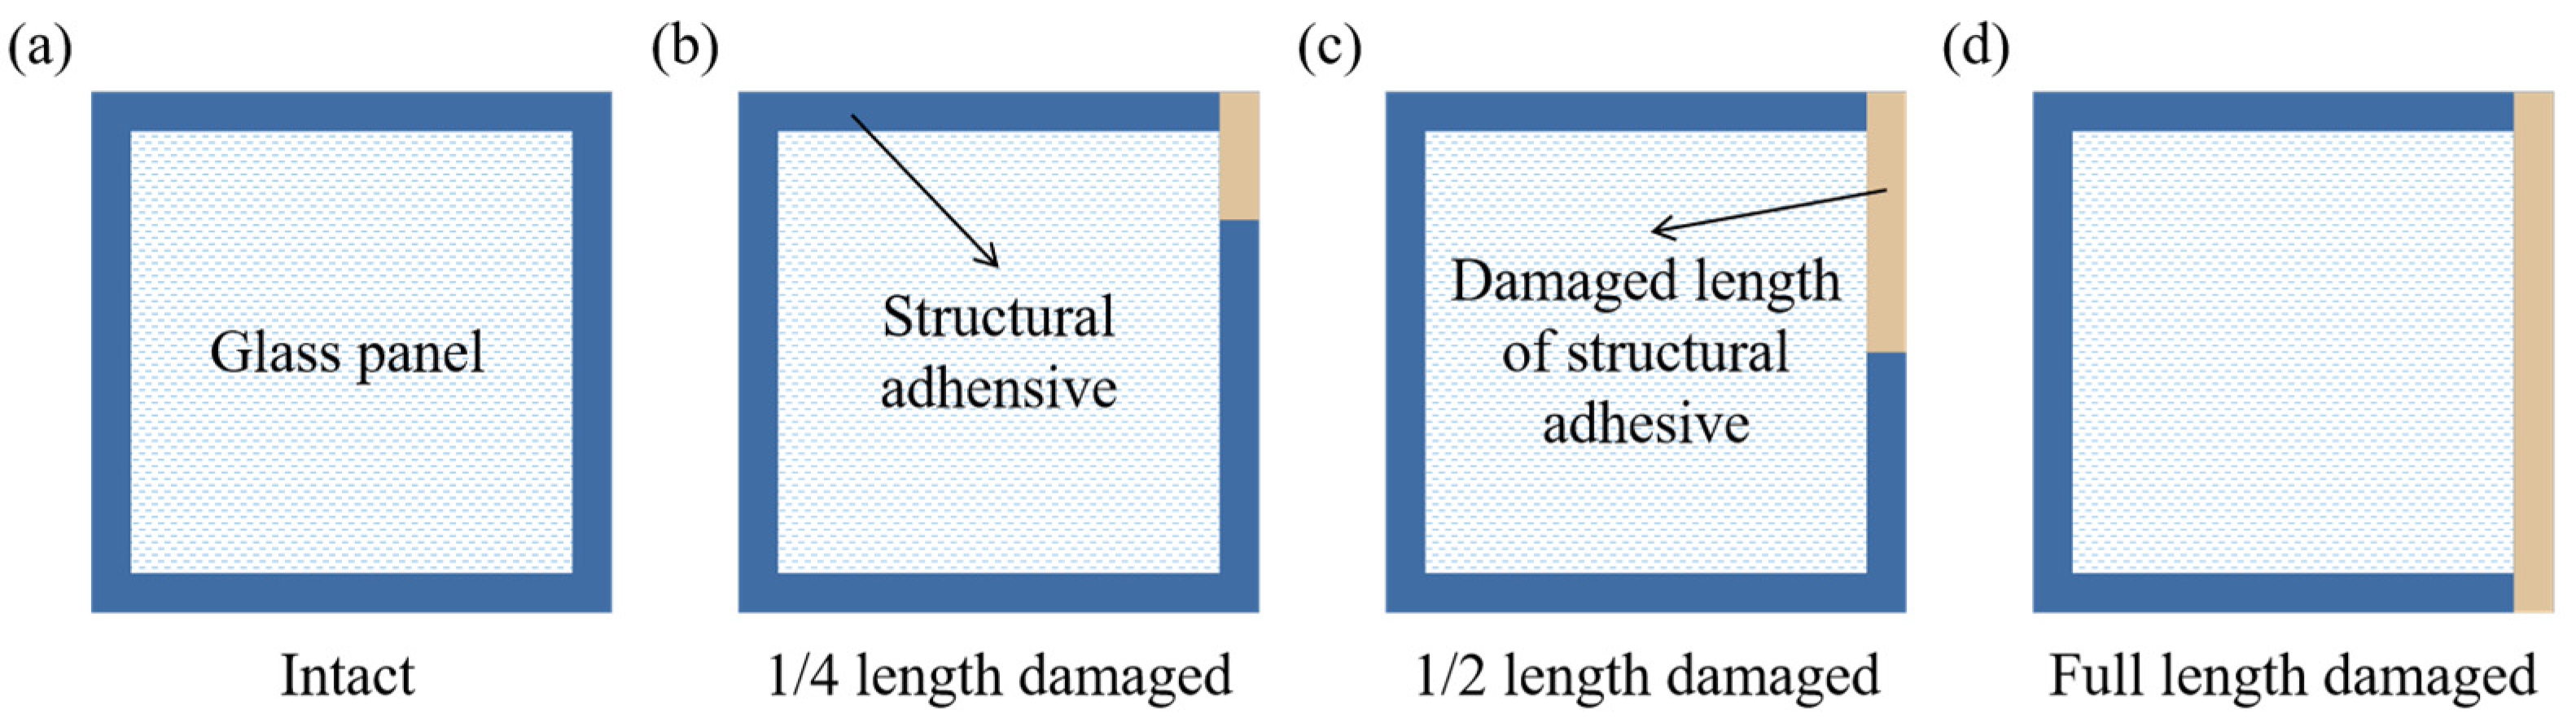
3.2. Similarity Relationship
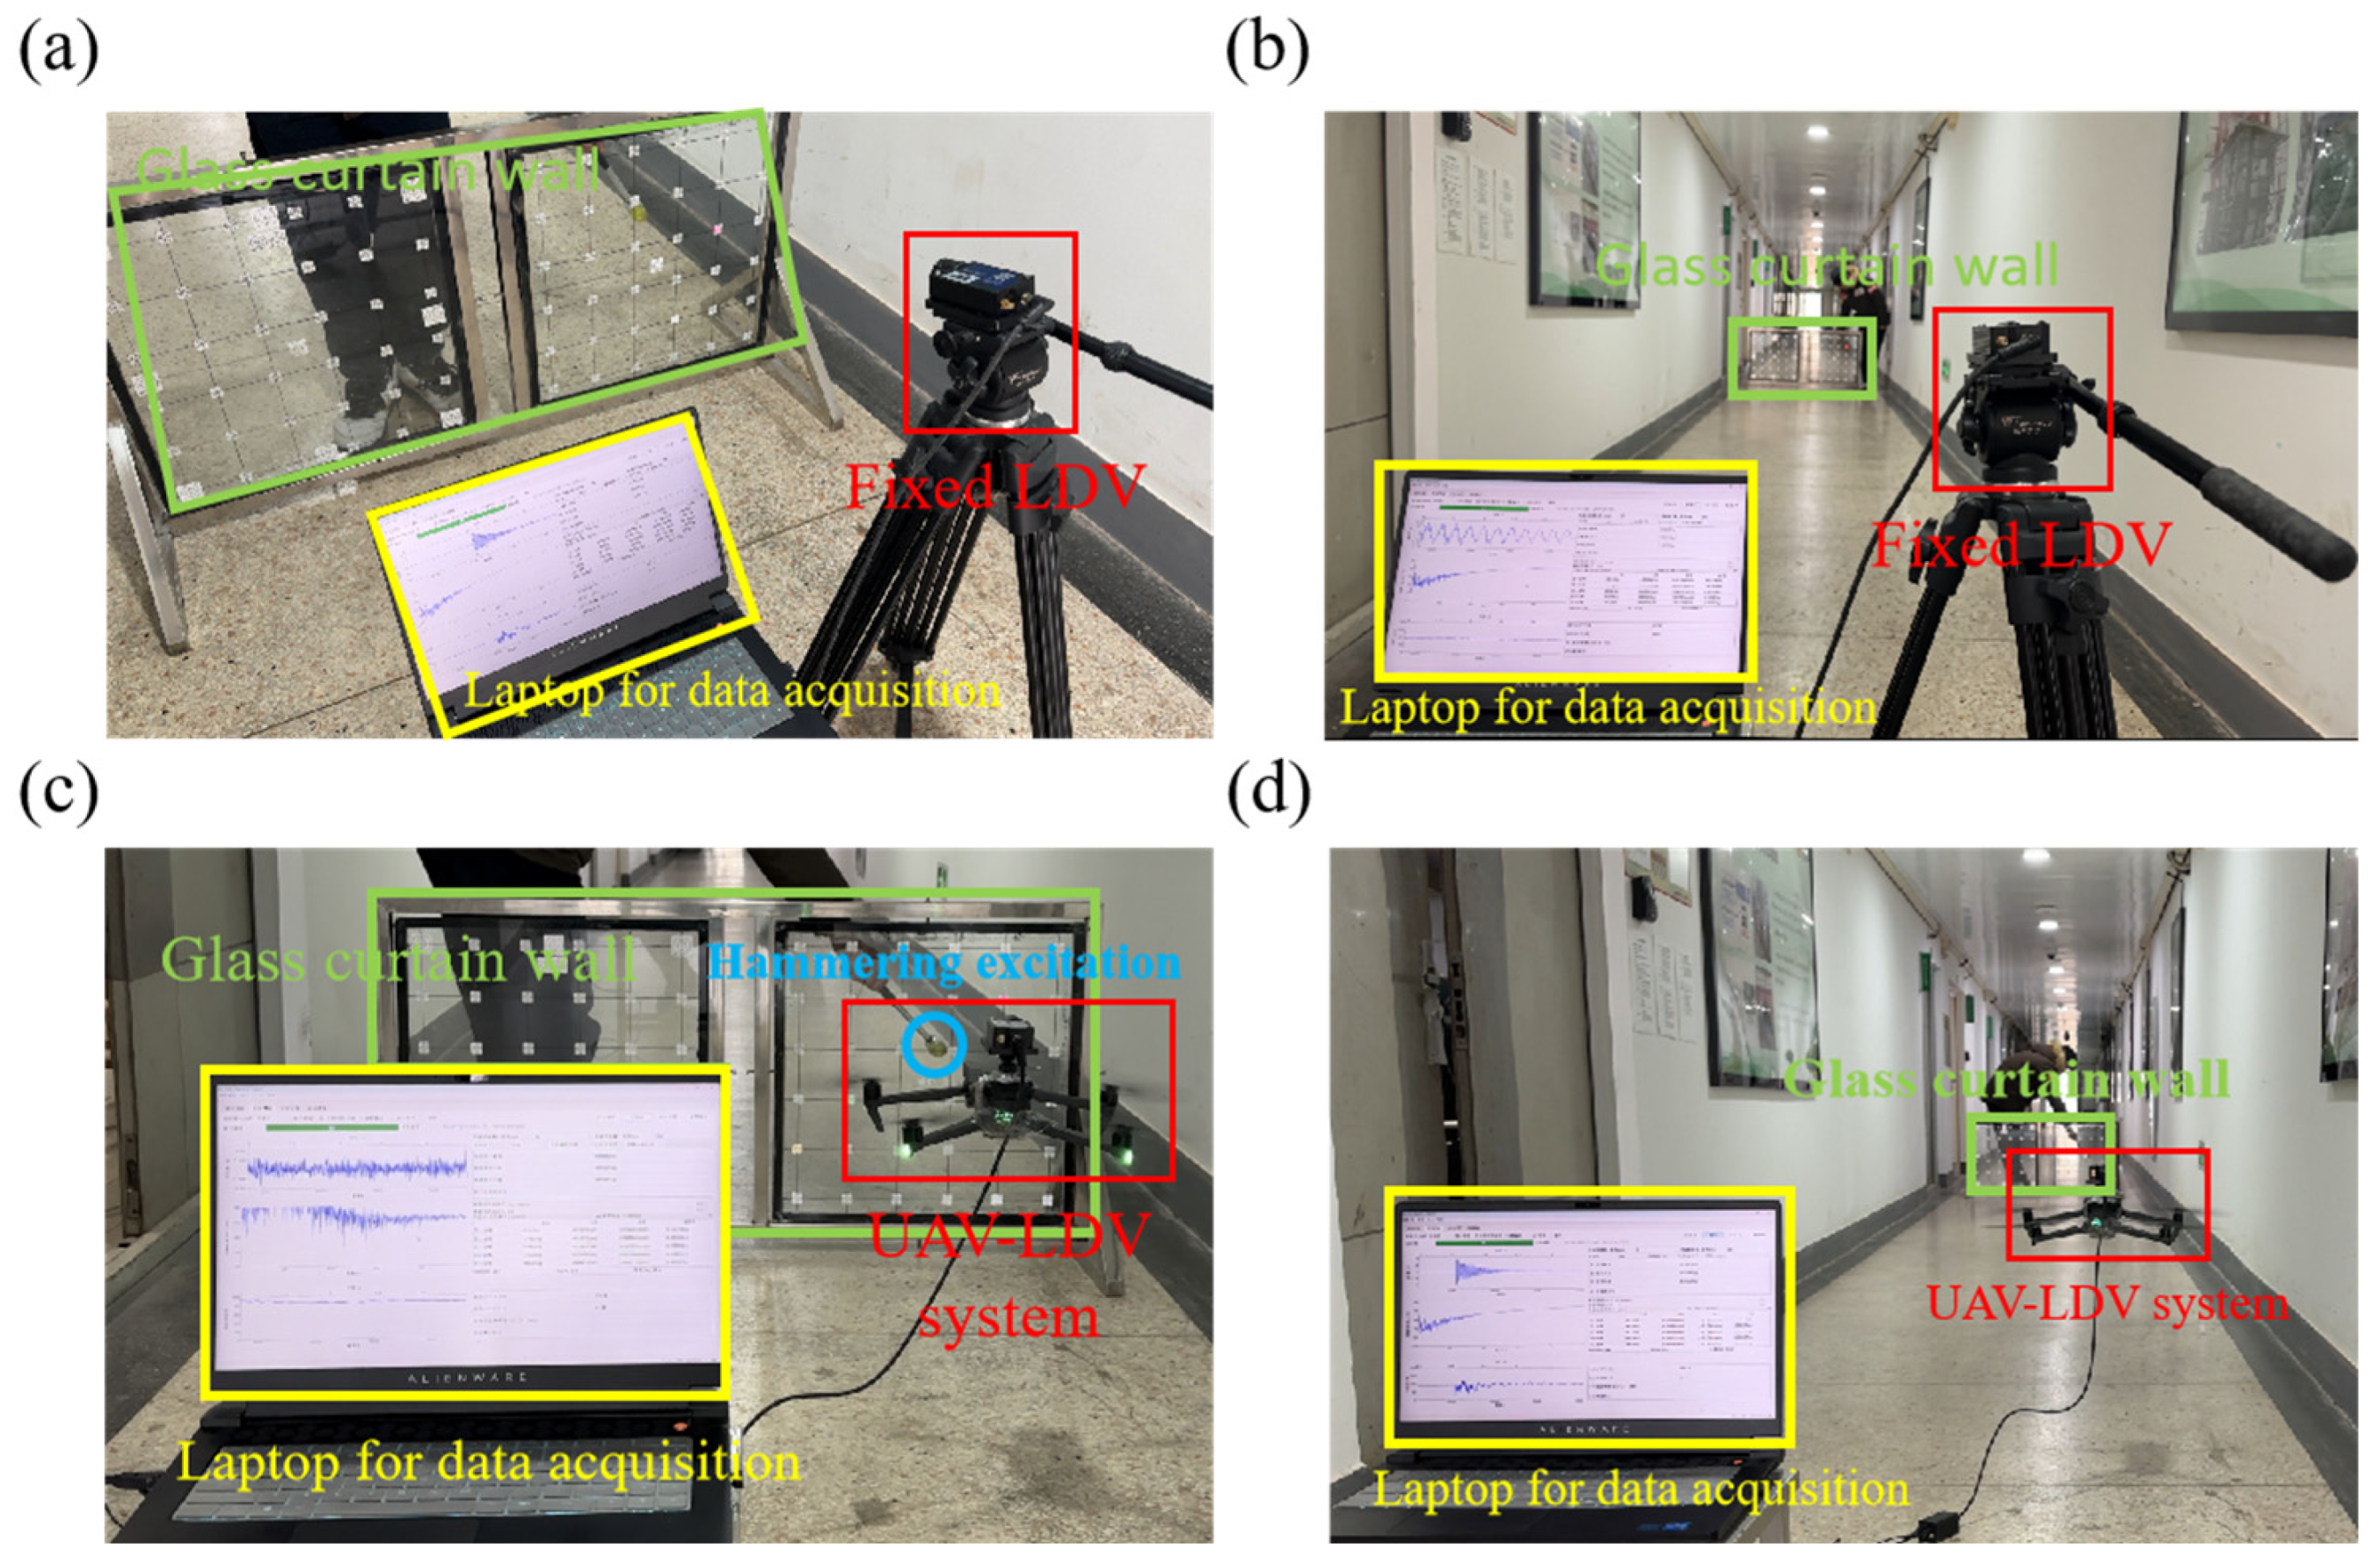
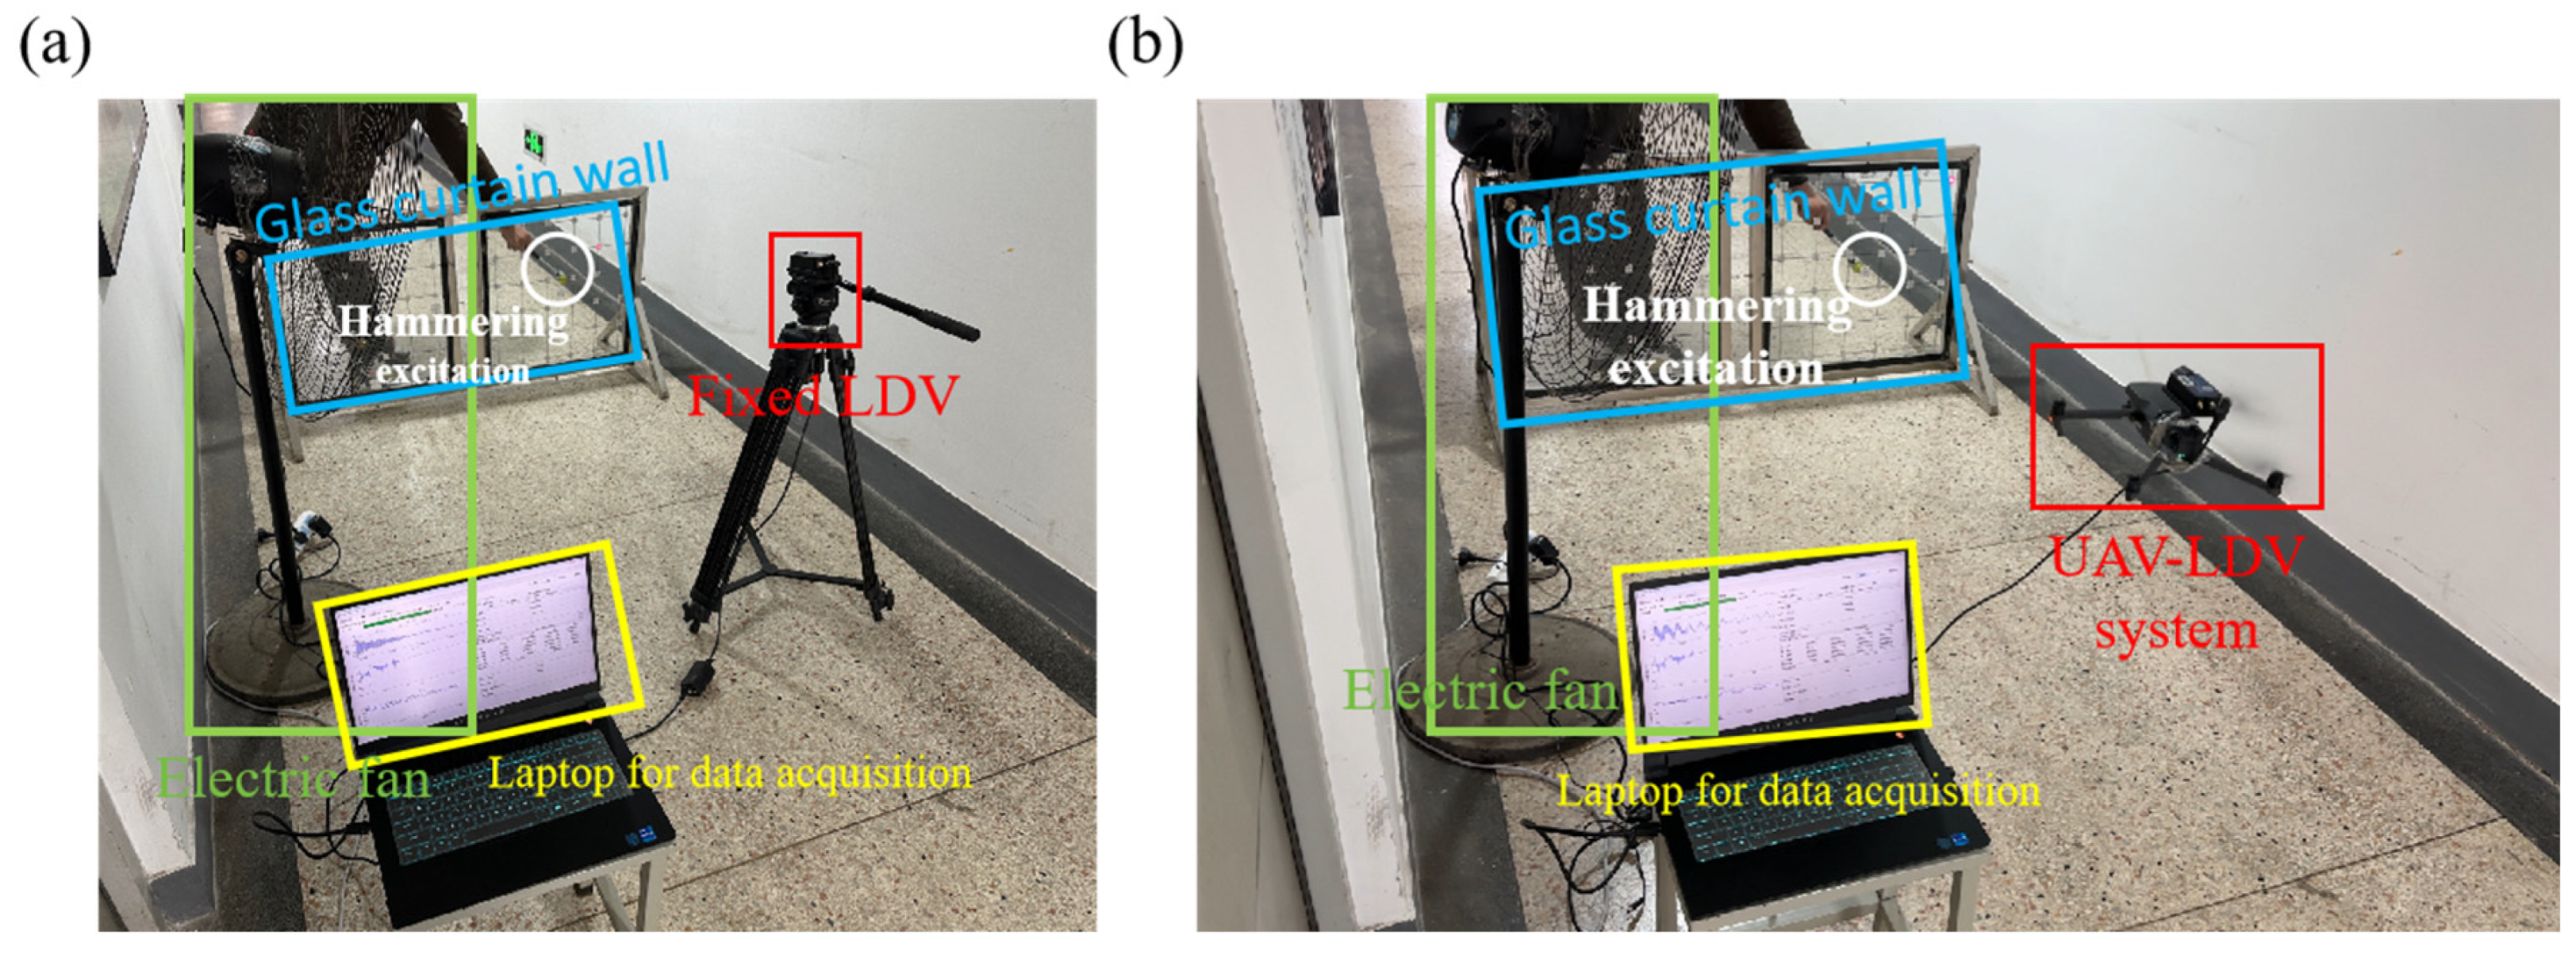
3.3. Testing Distance
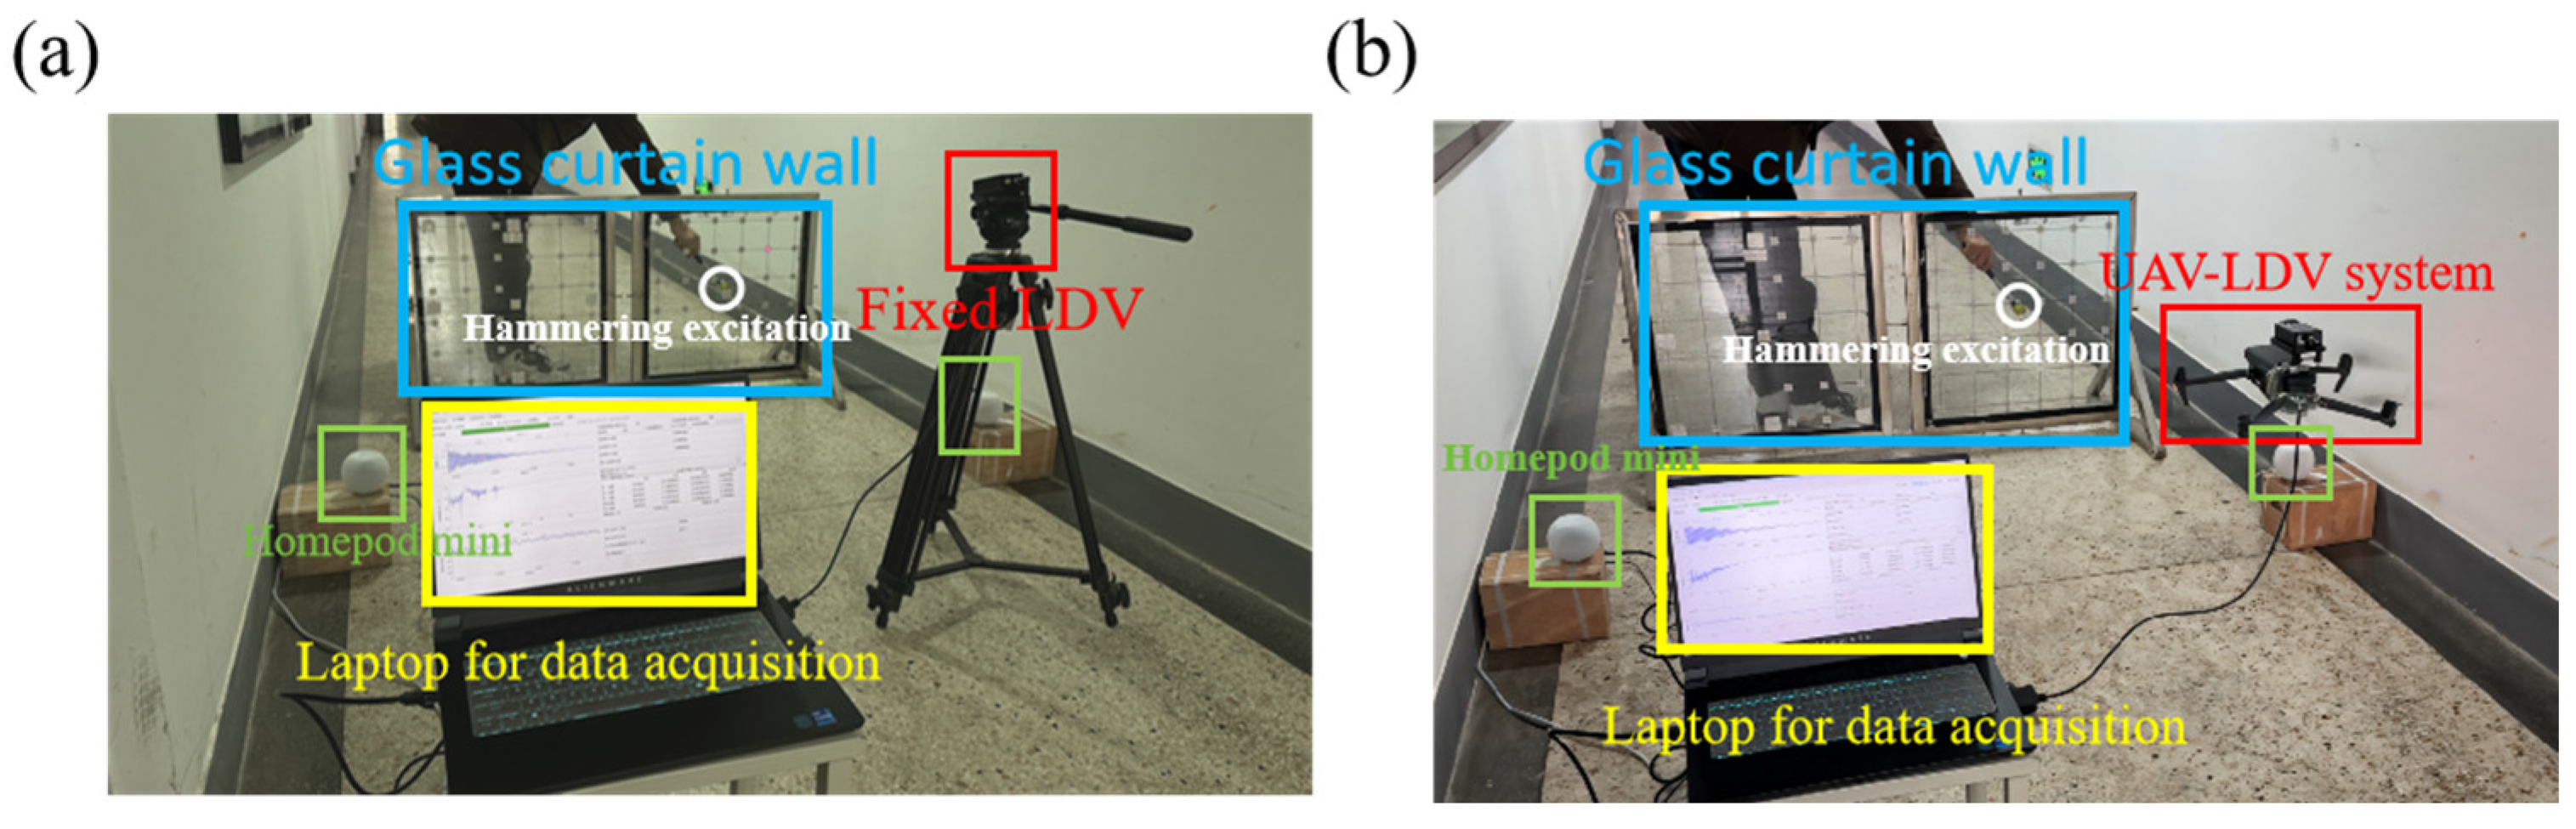
3.4. Noise Level
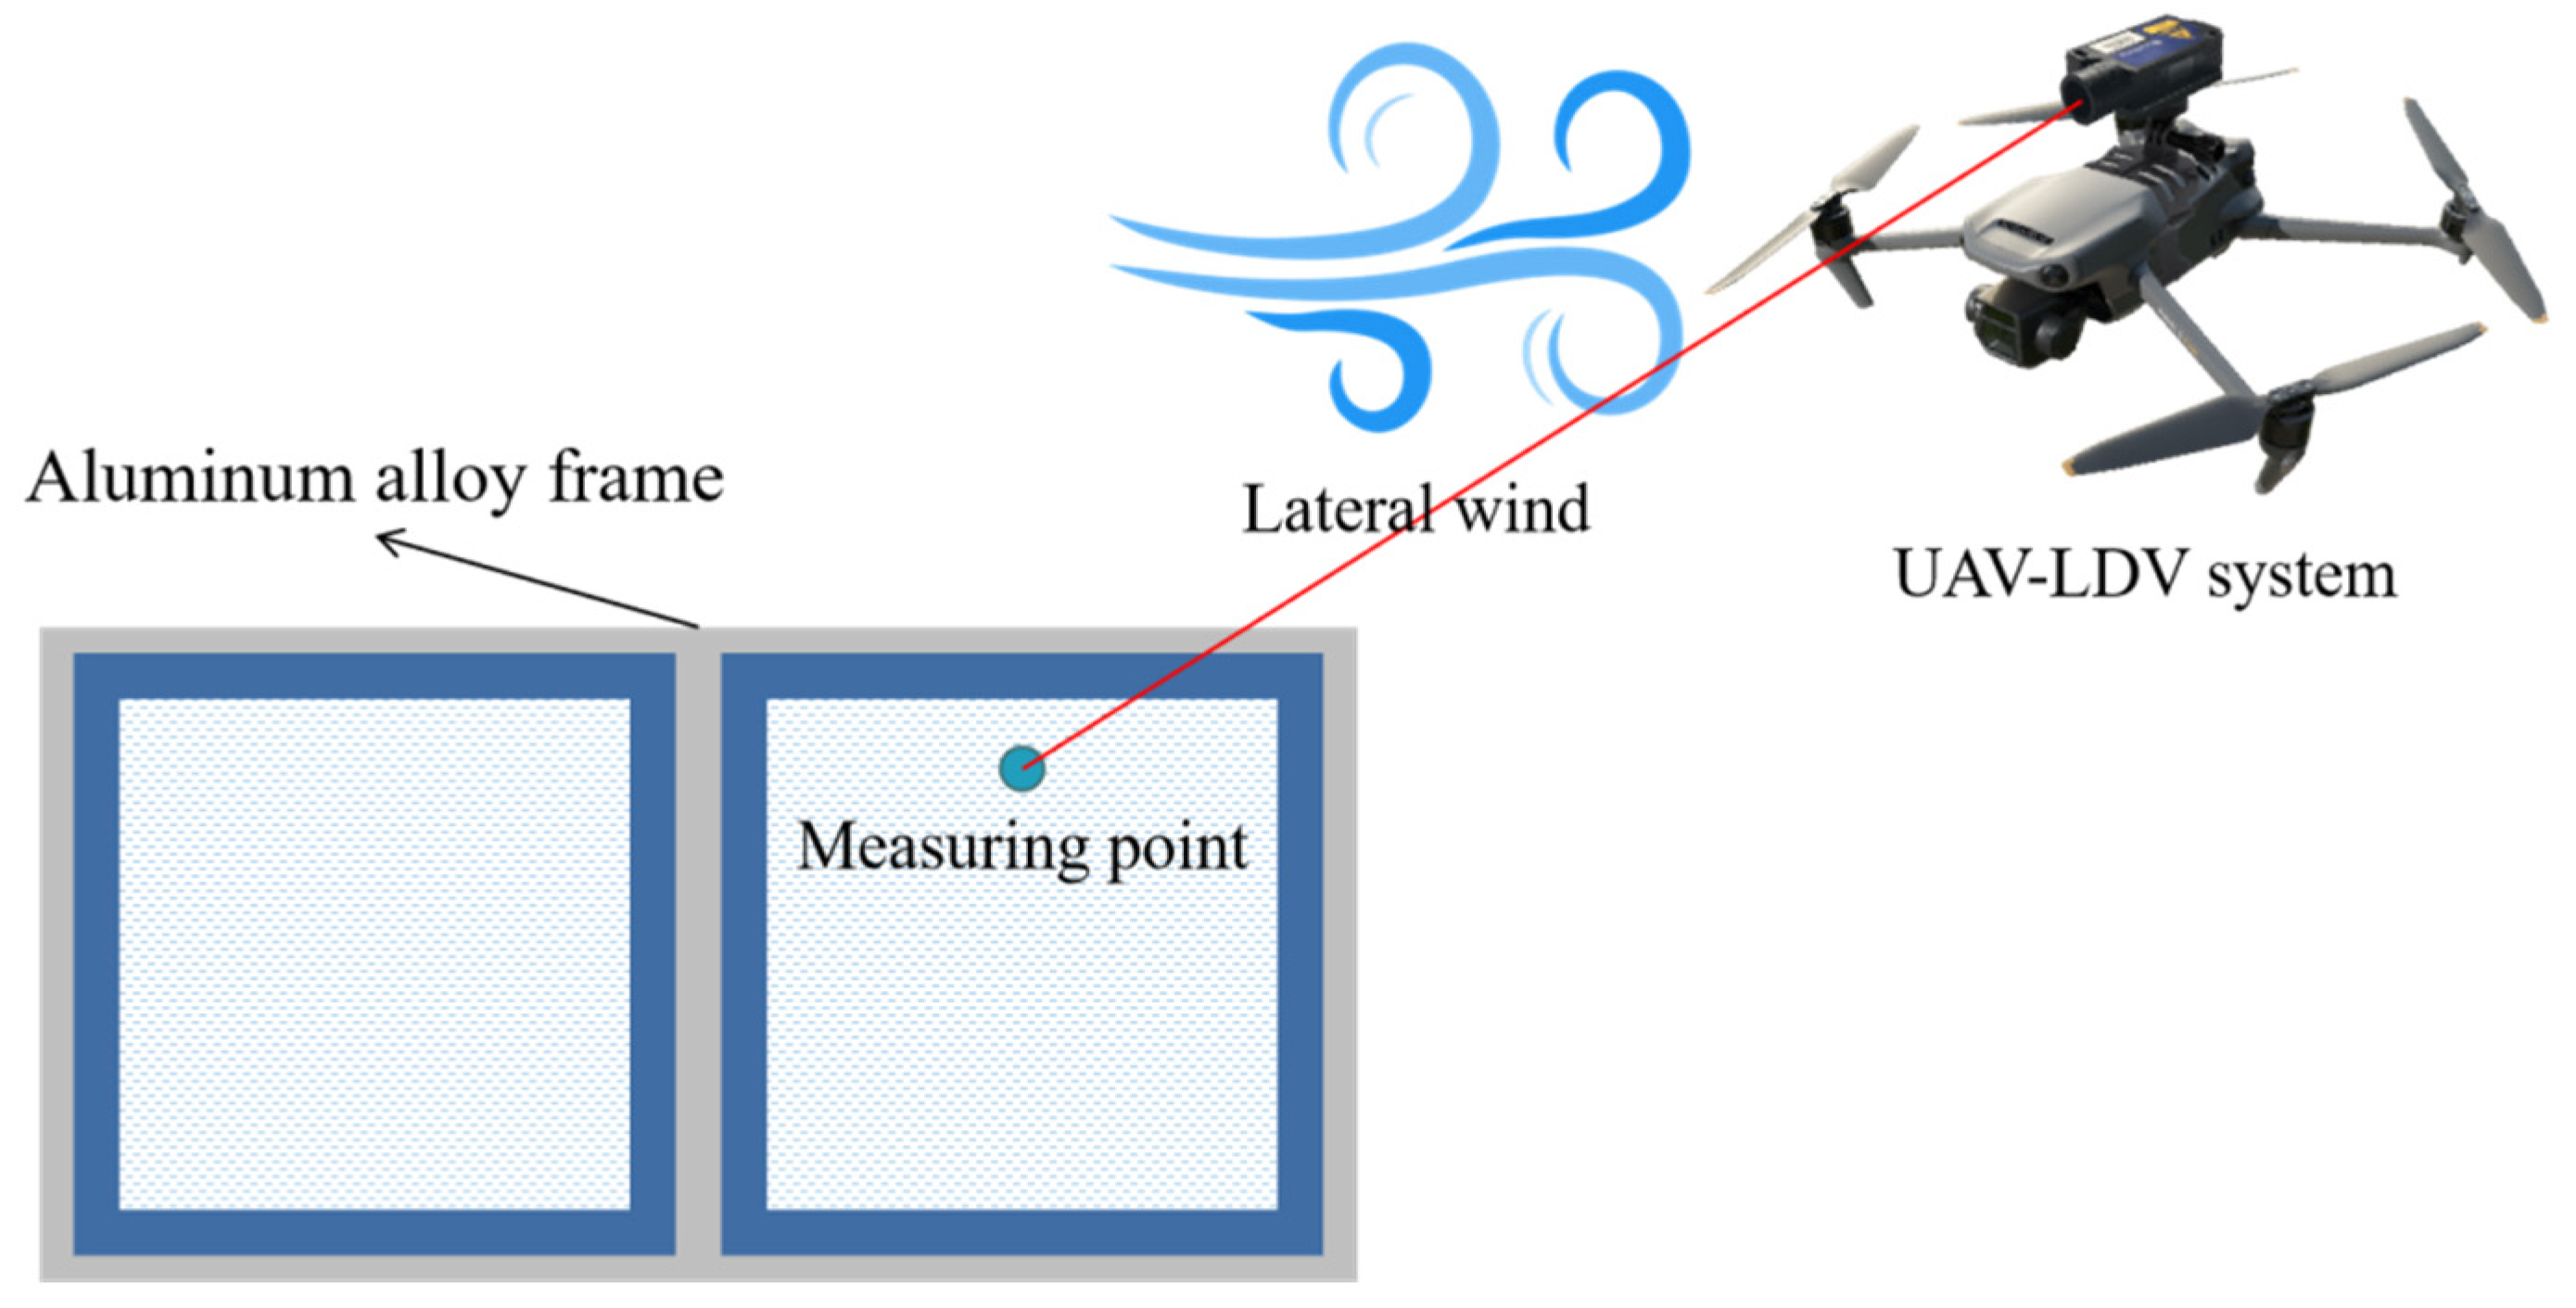
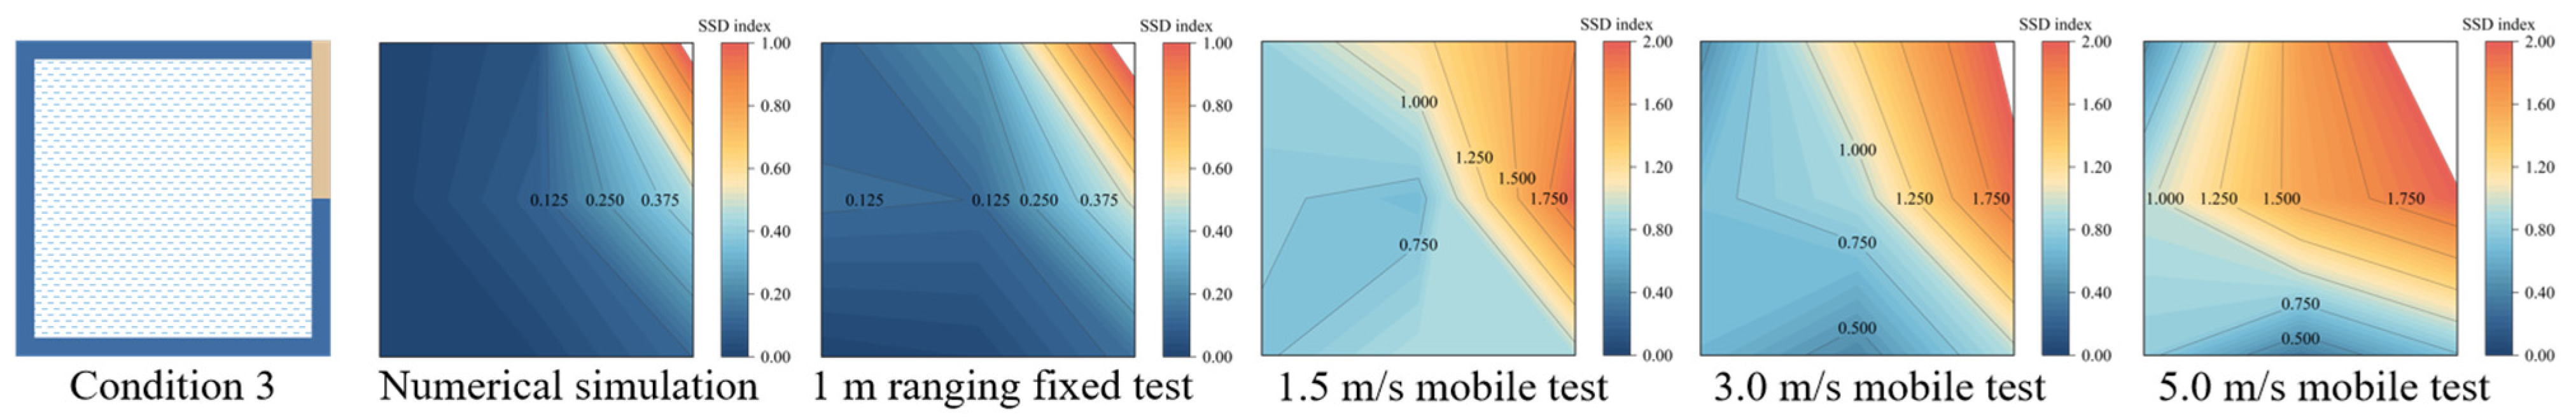
3.5. Wind Speed
4. Conclusions
Author Contributions
Funding
Data Availability Statement
Conflicts of Interest
References
- Górka, M. Use of aluminium and glass facades in urban architecture. Bud. Arch. 2020, 18, 29–40. [Google Scholar] [CrossRef]
- Zhang, L.; Lu, H.; Li, H. Multi-scale damage detection of glass curtain wall by acoustic emission and vibrational modal analysis. Sens. Smart Struct. Technol. Civ. Mech. Aerosp. Syst. 2023, 12486, 141–150. [Google Scholar] [CrossRef]
- China Academy of Building Research. JGJ 102-2003 Technical Code for Glass Curtain Wall Engineering; China Architecture & Building Press: Beijing, China, 2003. [Google Scholar]
- Huang, B.; Lu, W.; Cao, W. Discussion on safety assessment of existingarchitectural curtain walls. Struct. Eng. 2006, 3, 76–79. (In Chinese) [Google Scholar] [CrossRef]
- Liu, X.; Bao, Y.; Song, Y.; Qiu, Y. Safety evaluation of glass curtain walls by using dynamic method. China Civ. Eng. J. 2009, 42, 11–15. (In Chinese) [Google Scholar]
- Fang, Z.; Luo, W. Study on the damage detection of full-scale frame-concealed glass curtain-walls based on modal curvature. Value Eng. 2017, 20, 89–93. (In Chinese) [Google Scholar] [CrossRef]
- Wang, J. Research on Online Signal Collection and System for Glass Curtain Wall Detection. Master’s Thesis, Guizhou University, Guizhou, China, 2021. (In Chinese). [Google Scholar]
- Bedon, C.; Amadio, C. Numerical assessment of vibration control systems for multi-hazard design and mitigation of glass curtain walls. J. Build. Eng. 2018, 15, 1–13. [Google Scholar] [CrossRef]
- Wang, P.; Xiao, J.; Duan, Z.; Li, C. Intelligent development trend of building enclosure damage detection. JACE 2022, 39, 24–37. (In Chinese) [Google Scholar] [CrossRef]
- Huang, T.; Zhang, D.; Zhao, Y.; Liu, J.; Li, J. Comprehensive appraisal of the safety of hidden frame glass curtain wall based on fuzzy theory. J. Build. Eng. 2019, 26, 100863. [Google Scholar] [CrossRef]
- Efstathiades, C.; Baniotopoulos, C.C.; Nazarko, P.; Ziemianski, L.; Stavroulakis, G.E. Application of neural networks for the structural health monitoring in curtain-wall systems. Eng. Struct. 2007, 29, 3475–3484. [Google Scholar] [CrossRef]
- Duque, L.; Seo, J. Wacker, Synthesis of unmanned aerial vehicle applications for infrastructures. J. Perform. Constr. Fac. 2018, 32, 04018046. [Google Scholar] [CrossRef]
- He, D. Research in Damage Detection Techniques of Curtain Wall Structure Based on Movable LDV. Ph.D. Dissertation, School of Civil Enginering, Southeast University, Nanjing, China, 2023. (In Chinese). [Google Scholar]
- Liu, Z.; Guo, T.; Hebdon, M.H.; Han, W. Measurement and comparative study on movements of suspenders in long-span suspension bridges. J. Bridge Eng. 2019, 24, 04019026. [Google Scholar] [CrossRef]
- Liu, Z.; Guo, T.; Correia, J.; Wang, L. Reliability-based maintenance strategy for gusset plate connections in steel bridges based on life-cost optimization. J. Perform. Constr. Fac. 2020, 34, 04020088. [Google Scholar] [CrossRef]
- Zhi, G.; Xu, X.; Guo, T.; Chen, Z.; Zhang, M. Experimental and numerical investigation of vibrations in over-track scale model buildings. J. Build. Eng. 2023, 77, 107538. [Google Scholar] [CrossRef]
- Zhi, G.; Chen, Z.; Guo, T.; Zhang, M. Investigation of structure-borne noise propagation characteristics in a novel double-story high-speed railway station. J. Vib. Eng. Technol. 2023, 12, 5325–5344. [Google Scholar] [CrossRef]
- Zeng, J.; Wu, Z.; Todd, M.D.; Hu, Z. Bayes risk-based mission planning of Unmanned Aerial Vehicles for autonomous damage inspection. Mech. Syst. Signal Proc. 2023, 187, 109958. [Google Scholar] [CrossRef]
- Hu, C. Attitude stability control of UAV gyroscope based on neutral statistics for smart cities. Int. J. Syst. Assur. Eng. Manag. 2022, 13, 281–290. [Google Scholar] [CrossRef]
- Lei, Y.; Li, Y.; Wang, J. Aerodynamic analysis of an orthogonal octorotor UAV considering horizontal wind disturbance. Aerospace 2023, 10, 525. [Google Scholar] [CrossRef]
- Brandão, A.S.; Smrcka, D.; Pairet, É.; Nascimento; Saska, M. Side-pull maneuver: A novel control strategy for dragging a cable-tethered load of unknown weight using an UAV. IEEE Robot. Autom. Lett. 2022, 7, 9159–9166. [Google Scholar] [CrossRef]
- Hassan, M.A.A.; Phang, S.K. Optimized autonomous UAV design for duration enhancement. AIP Conf. Proc. 2020, 2233, 030004. [Google Scholar] [CrossRef]
- Fraga-Lamas, P.; Ramos, L.; Mondéjar-Guerra, V.; Fernández-Caramés, T.M. A review on IoT deep learning UAV systems for autonomous obstacle detection and collision avoidance. Remote Sens. 2019, 11, 2144. [Google Scholar] [CrossRef]
- DJI, DJI Mavic 3 Technical Support. Available online: https://www.dji.com/cn/mavic-3/specs (accessed on 15 May 2014).
- Yoon, S.; Jr, B.F.S.; Lee, S.; Jung, H.J.; Kim, I.H. A novel approach to assess the seismic performance of deteriorated bridge structures by employing UAV-based damage detection. Struct. Control. Health Monit. 2022, 29, e2964. [Google Scholar] [CrossRef]
- Car, M.; Markovic, L.; Ivanovic, A. Autonomous wind-turbine blade inspection using LiDAR-equipped unmanned aerial vehicle. IEEE Access 2020, 8, 131380–131387. [Google Scholar] [CrossRef]
- Ding, W.; Yang, H.; Yu, K.; Shu, J. Crack detection and quantification for concrete structures using UAV and transformer. Automat. Constr. 2023, 152, 104929. [Google Scholar] [CrossRef]
- Goricanec, J.; Ereiz, S.; Orsag, M.; Duvnjak, I. Identification of the dynamic parameters of bridge elements using unmanned aerial vehicle. J. Sound Vib. 2023, 556, 117901. [Google Scholar] [CrossRef]
- Han, Y.; Feng, D.; Wu, W.; Yu, X.; Wu, G.; Liu, J. Geometric shape measurement and its application in bridge construction based on UAV and terrestrial laser scanner. Automat. Constr. 2023, 151, 104880. [Google Scholar] [CrossRef]
- Li, J.; Peng, Y.; Tang, Z.; Li, Z. Three-dimensional reconstruction of railway bridges based on unmanned aerial vehicle-terrestrial laser scanner point cloud fusion. Buildings 2023, 13, 2841. [Google Scholar] [CrossRef]
- Wang, Y.; Duan, C.; Huang, X.; Zhao, J.; Zheng, R.; Li, H. Task-driven path planning for unmanned aerial vehicle-based bridge inspection in wind fields. Fluids 2023, 8, 321. [Google Scholar] [CrossRef]
- Christiansen, N.; Carpenter, J.R.; Daewel, U. The large-scale impact of anthropogenic mixing by offshore wind turbine foundations in the shallow North Sea. Front. Mar. Sci. 2023, 10, 1178330. [Google Scholar] [CrossRef]
- Liang, E.P.; Ma, G.S.; Li, Y.; Zheng, X.; Wu, F.; Li, S.; Li, D. Summary of the impact of aeolian sand environment on key parts of wind turbine. Sci. Sin-Phys. Mech. As. 2023, 53, 234701. [Google Scholar] [CrossRef]
- Ma, B.; Yang, J.; Chen, X. Revealing the ecological impact of low-speed mountain wind power on vegetation and soil erosion in South China: A case study of a typical wind farm in Yunnan. J. Clean Prod. 2023, 419, 138020. [Google Scholar] [CrossRef]
- Sun, X.; Wu, W.; Wang, J.; Xu, L.; Jiang, R.; Sun, Y.; Fang, L. Optimization design of negative pressure adsorption car for internal defect detection of wind turbine blades on UAV. AIP Adv. 2023, 13, 025133. [Google Scholar] [CrossRef]
- Liu, Z.; Wang, X.; Liu, Y. Application of unmanned aerial vehicle hangar in transmission tower inspection considering the risk probabilities of steel towers. IEEE Access 2019, 7, 159048–159057. [Google Scholar] [CrossRef]
- Yu, C.; Yang, Y.; Cheng, Y.; Wang, Z.; Shi, M.; Yao, Z. UAV-based pipeline inspection system with Swin Transformer for the EAST. Fusion Eng. Des. 2022, 184, 113277. [Google Scholar] [CrossRef]
- Yin, H.; Tan, C.; Zhang, W.; Cao, C.; Xu, X.; Wang, J.; Chen, J. Rapid compaction monitoring and quality control of embankment dam construction based on UAV photogrammetry technology: A case study. Remote Sens. 2023, 15, 1083. [Google Scholar] [CrossRef]
- Lenda, G.; Marmol, U. Integration of high-precision UAV laser scanning and terrestrial scanning measurements for determining the shape of a water tower. Measurement 2023, 218, 113178. [Google Scholar] [CrossRef]
- Wu, Z.; Zeng, J.; Hu, Z.; Todd, M.D. Optimization of unmanned aerial vehicle inspection strategy for infrastructure based on model-enabled diagnostics and prognostics. Mech. Syst. Signal Proc. 2023, 204, 110841. [Google Scholar] [CrossRef]
- Xu, F.; Wang, B.; Shen, J.; Hu, J.; Jiang, G. Design and realization of the claw gripper system of a climbing robot. J. Intell. Robot Syst. 2018, 89, 301–317. [Google Scholar] [CrossRef]
- Li, S.; Chen, S. Field monitoring and prediction on temperature distribution of glass curtain walls of a super high-rise building. Eng. Struct. 2022, 250, 113405. [Google Scholar] [CrossRef]
- Sabatier, J.; Ekimov, A.; Aranchuk, V.; Mack, R. Remote detection of vehicle obscured by forest canopy using laser Doppler vibrometer. J. Acoust. Soc. Am. 2008, 124, 2508. [Google Scholar] [CrossRef]
- Gioffre, M.; Cavalagli, N.; Pepi, C.; Trequattrini, M. Laser Doppler and radar interferometer for contactless measurements on unaccessible tie-rods on monumental buildings: Santa maria della consolazione temple in todi. JPCS 2017, 778, 012008. [Google Scholar] [CrossRef]
- Sugimoto, T.; Sugimoto, K.; Uechi, I.; Utagawa, N.; Kuroda, C. Outer wall inspection using acoustic irradiation induced vibration from UAV for noncontact acoustic inspection method. In Proceedings of the IEEE International Ultrasonics Symposium Conference 2018, Kobe, Japan, 22–25 October 2018; pp. 1–9. [Google Scholar] [CrossRef]
- Schewe, M.; Ismail, M.A.; Rembe, C. Towards airborne laser Doppler vibrometry for structural health monitoring of large and curved structures. Insight Non-Destr. Test. Cond. Monit. 2021, 63, 280–282. [Google Scholar] [CrossRef]
- Schewe, M.; Ismail, M.A.A.; Zimmermann, R.; Durak, U.; Rembe, C. Flyable mirror: Airborne laser Doppler vibrometer for large engineering structures. JPCS 2024, 2698, 012007. [Google Scholar] [CrossRef]
- Garg, P.; Nasimi, R.; Ozdagli, A.; Zhang, S.; Mascarenas, D.D.L.; Taha, M.R.; Moreu, F. Measuring transverse displacements using Unmanned Aerial Systems Laser Doppler Vibrometer (UAS-LDV): Development and field validation. Sensors 2020, 20, 6051. [Google Scholar] [CrossRef] [PubMed]
- Komgom, C.N.; Mureithi, N.W.; Lakis, A.A. Application of time synchronous averaging, spectral kurtosis and support vector machines for bearing fault identification. In Proceedings of the ASME 2008 Pressure Vessels and Piping Conference, Chicago, IL, USA, 27–31 July2008; Volume 61601, pp. 137–146. [Google Scholar] [CrossRef]
- Halkon, B.J.; Rothberg, S.J. Towards laser Doppler vibrometry from unmanned aerial vehicles. JPCS 2018, 1149, 012022. [Google Scholar] [CrossRef]
- Ma, T.; Yang, C.; Gan, W.; Xue, Z.; Zhang, Q.; Zhang, X. Analysis of technical characteristics of fixed-wing VTOL UAV. In Proceedings of the 2017 IEEE International Conference on Unmanned Systems, Beijing, China, 27–29 October 2017; pp. 293–297. [Google Scholar] [CrossRef]
- Sabour, M.H.; Jafary, P.; Nematiyan, S. Applications and classifications of unmanned aerial vehicles: A literature review with focus on multi-rotors. Aeronaut. J. 2023, 127, 466–490. [Google Scholar] [CrossRef]
- Rothberg, S.J.; Allen, M.S.; Castellini, P.; Di Maio, D.; Dirckx, J.J.J.; Ewins, D.J.; Halkon, B.J.; Muyshondt, P.; Paone, N.; Ryan, T.; et al. An international review of laser Doppler vibrometry: Making light work of vibration measurement. Opt. Laser. Eng. 2017, 99, 11–22. [Google Scholar] [CrossRef]
- Huang, Z.; Xie, M.; Chen, C.; Du, Y.; Zhao, J. Engineering application of a safety-state evaluation model for hidden frame-supported glass curtain walls based on remote vibration. J. Build. Eng. 2019, 26, 100915. [Google Scholar] [CrossRef]
- Zheng, H.; Zhang, X.; Wang, H.; Pan, D.; Jian, K. Damage detection of bonded structure of building glass curtain wall based on origin FRP. J. Vib. Shock 2021, 40, 289–298. (In Chinese) [Google Scholar] [CrossRef]
- Zhang, Y.; Wang, S. Damage detection for abeam based on imaginary part of its FRF. J. Vib. Shock 2018, 37, 38–42. (In Chinese) [Google Scholar] [CrossRef]
- Tang, A. Research on Grid Structure Damage Identification Combined with Modal Strain Energy Decomposition Method and Wavelet Packet Energy Index. Master’s Thesis, Chongqing University, Chongqing, China, 2021. (In Chinese). [Google Scholar]
- Wang, B.; Wang, D.; Ali, Z.A.; Bai, T.; Wang, H. An overview of various kinds of wind effects on unmanned aerial vehicle. Meas. Control 2019, 52, 731–739. [Google Scholar] [CrossRef]


| Specific Items | Specifications |
|---|---|
| Bare Weight | 895 g |
| Dimensions (Folded/Unfolded) | Folded (without propellers) 221 × 96.3 × 90.3 mm (Length × Width × Height) Unfolded (without propellers) 347.5 × 283 × 107.7 mm (Length × Width × Height) |
| Max Flight Time (no wind) | 46 min |
| Max Hovering Time (no wind) | 40 min |
| Max Wind Speed Resistance | 12 m/s |
| Operating Temperature | −10° to 40° C (14° to 104° F) |
| GNSS | GPS + Galileo + BeiDou |
| Hovering Accuracy Range | Vertical: ± 0.1 m (with Vision Positioning); ± 0.5 m (with GNSS Positioning) Horizontal: ± 0.3 m (with Vision Positioning); ± 0.5 m (with High-Precision Positioning System) |
| Maximum Take-off Weight with Payload | 1200 g |
| Frequency Range | Laser Wavelength | Displacement Resolution | Maximum Speed Range | Displacement Repeatability | Output Signal | Weight |
|---|---|---|---|---|---|---|
| DC~2.5 MHz | 1310 mm | 1.28 nm | 1500 mm/s | 10 nm | Digital | 213.7 g |
| Weight of the bracket | Weight of the system | |||||
| 90.2 g | 1198.9 g | |||||
| Order | Frequency/Hz | |||
|---|---|---|---|---|
| Numerical Simulation [13] | Point 2 Test | Point 4 Test | Point 6 Test | |
| 1st | 101.0 | 99.2 | 95.7 | 93.1 |
| 2nd | 234.3 | / | 227.1 | 228.9 |
| 3rd | 354.2 | 329.6 | 330.8 | / |
| 4th | 364.3 | 378.4 | 375.9 | / |
| 5th | 449.8 | 436.4 | 435.2 | 433.3 |
| Conditions | First-Order Natural Frequency (Hz) | ||||||||
|---|---|---|---|---|---|---|---|---|---|
| Numerical Simulation | Fixed Test | Mobile Test | |||||||
| 1 m | Error | 10 m | Error | 1 m | Error | 10 m | Error | ||
| Condition 1 | 101.00 | 101.43 | 0.43% | 101.27 | 0.27% | 104.34 | 3.30% | 106.15 | 5.10% |
| Condition 2 | 66.11 | 65.13 | −1.48% | 64.47 | −2.48% | 69.64 | 5.34% | 70.48 | 6.61% |
| Condition 3 | 75.37 | 72.04 | −4.42% | 71.86 | −4.66% | 74.07 | −1.72% | 80.67 | 7.03% |
| Condition 4 | 15.34 | 15.10 | −1.56% | 14.09 | −8.15% | 15.92 | 3.78% | 13.36 | −12.91% |
| Conditions | Noise Level (dB) | First-Order Natural Frequency (Hz) | ||||
|---|---|---|---|---|---|---|
| Numerical Simulation | Fixed Test | Error | Mobile Test | Error | ||
| Condition 1 | 20 | 101.00 | 101.73 | 0.72% | 105.97 | 4.17% |
| 30 | 101.92 | 0.91% | 105.92 | 3.92% | ||
| 40 | 102.1 | 1.09% | 92.48 | −9.42% | ||
| 50 | 103.21 | 2.19% | 93.28 | −9.62% | ||
| 70 | 98.43 | −2.54% | 92.65 | −5.87% | ||
| 100 | 96.62 | −4.34% | 86.26 | −10.72% | ||
| Condition 2 | 20 | 91.09 | 91.61 | 0.57% | 96.37 | 5.80% |
| 30 | 90.63 | −0.50% | 88.67 | −2.66% | ||
| 40 | 92.83 | 1.91% | 92.48 | 1.53% | ||
| 50 | 91.25 | 0.18% | 94.34 | 3.57% | ||
| 70 | 94.12 | 3.33% | 84.05 | −7.73% | ||
| 100 | 88.24 | −3.13% | 101.04 | 10.92% | ||
| Condition 3 | 20 | 88.52 | 88.81 | 0.33% | 80.32 | −9.26% |
| 30 | 88.1 | −0.47% | 86.58 | −2.19% | ||
| 40 | 89.29 | 0.87% | 92.72 | 4.74% | ||
| 50 | 90.79 | 2.56% | 95.31 | 7.67% | ||
| 70 | 86.02 | −2.82% | 94.68 | 6.96% | ||
| 100 | 85.31 | −3.63% | 96.95 | 9.52% | ||
| Condition 4 | 20 | 66.11 | 66.28 | 0.26% | 64.1 | −3.04% |
| 30 | 66.9 | 1.19% | 64.47 | −2.48% | ||
| 40 | 66.1 | −0.02% | 61.94 | −6.31% | ||
| 50 | 63.04 | −4.64% | 62.88 | −4.89% | ||
| 70 | 68.77 | 4.02% | 71.94 | 8.82% | ||
| 100 | 70.12 | 6.07% | 73.67 | 11.44% | ||
| Average of 1st Order Natural Frequency (Hz) | |||||
|---|---|---|---|---|---|
| Numerical Simulation | Wind Speed (m/s) | Fixed Test | Error | Mobile Test | Error |
| 88.52 | 1.5 | 88.68 | 0.18% | 85.41 | −3.51% |
| 3.0 | 88.97 | 0.51% | 83.48 | −5.69% | |
| 5.0 | 88.13 | −0.44% | 96.13 | 8.60% | |
Disclaimer/Publisher’s Note: The statements, opinions and data contained in all publications are solely those of the individual author(s) and contributor(s) and not of MDPI and/or the editor(s). MDPI and/or the editor(s) disclaim responsibility for any injury to people or property resulting from any ideas, methods, instructions or products referred to in the content. |
© 2024 by the authors. Licensee MDPI, Basel, Switzerland. This article is an open access article distributed under the terms and conditions of the Creative Commons Attribution (CC BY) license (https://creativecommons.org/licenses/by/4.0/).
Share and Cite
Zheng, H.; Guo, T.; Zhi, G.; Hu, Z. A Novel Debonding Damage Identification Approach of Hidden Frame-Supported Glass Curtain Walls Based on UAV-LDV System. Appl. Sci. 2024, 14, 5412. https://doi.org/10.3390/app14135412
Zheng H, Guo T, Zhi G, Hu Z. A Novel Debonding Damage Identification Approach of Hidden Frame-Supported Glass Curtain Walls Based on UAV-LDV System. Applied Sciences. 2024; 14(13):5412. https://doi.org/10.3390/app14135412
Chicago/Turabian StyleZheng, Haoyang, Tong Guo, Guoliang Zhi, and Zhiwei Hu. 2024. "A Novel Debonding Damage Identification Approach of Hidden Frame-Supported Glass Curtain Walls Based on UAV-LDV System" Applied Sciences 14, no. 13: 5412. https://doi.org/10.3390/app14135412