Abstract
The current investigation scrutinized the strategic approaches employed by the top four teams in the Brazilian Men’s Volleyball Superliga, according to the match’s opponent. The study encompasses the analysis of 22 matches, involving teams ranked first through fourth, competing against each of the 12 teams participating in the 21–22 season of the Brazilian Men’s Volleyball Superliga, including one home and one away match for each team. Social network analysis facilitated the identification of the interconnections and particularities among all variables, offering a comprehensive perspective. The findings unveiled that during the offensive phase, the second-, third-, and fourth-ranked teams consistently exhibited higher eigenvector values, irrespective of the opposing team, notably when the middle-blocker positioned themselves in front and near the setter. Conversely, the championship-winning team displayed variations in offensive tactics. The team securing the second position demonstrated alterations in setting placement, whereas the other teams executed settings aimed at zones 3 and 4. Additionally, the initial setter’s position at the commencement of a rally displayed varying eigenvector values based on the opponent, indicating team rotation as a performance determinant. Thus, barring the finalist team, the performance of the remaining teams is intricately intertwined with the individual characteristics of players.
1. Introduction
In sports, game analysis helps the coach and technical committee understand indicators that modulate performance, facilitating adjustments in both training and games [,]. This practice, while not novel, is actively employed to enhance tactical aspects, considering the context of training and its situational constraints [,]. Therefore, when scrutinizing team performance, one must consider the relationships within the game, involving the team, the opponent, the environment, and the multiple interactions that arise from these dynamics [,,]. Based on the information obtained from game analysis, the teams’ behavior patterns are identified, strengths and weaknesses are detected, and tactical possibilities emerge, allowing departure from traditional playing structures [,,].
Studies on match analysis in sports currently indicate a correlation between performance and game location [,], player experience [,], type of game played [,] game rules [,], offensive and defensive phases [,], team level [,], and other aspects inherent to the game context. Furthermore, it is observed that the analysis of tactical behaviors, for the most part, results from the interpretation of general metrics [,,], examining the team’s tactical behaviors that specify success or failure in the match [,,].
When considering the dynamics and categorization into game complexes of volleyball, Complex I, the focus of this manuscript, consists of reception, setting, and attack, while Complex II consists of serving, blocking, defending, setting, and counterattacking [,]. Within this framework, analyzing the volleyball game from the Game Complex perspective becomes necessary since the behavior of the teams differs depending on the initial offensive construction, such as reception or defense. Moreover, it varies based on game conditions occurring within the system (in-system conditions), with ideal conditions for offensive construction, or outside the system (off-system), where there are limited conditions for offensive construction []. Furthermore, an observation emerges that teams tend to score more attack points in complex I [,], attributed to better ball control during reception, resulting in a more robust offensive structure [,,].
In this context, the analysis of Complex I in volleyball underscores a relationship between reception and subsequent actions, such as the setting effectiveness [,], attack tempo [,,], attack effect [,,,], and blocker number [,,]. Furthermore, several studies indicate an association or prediction [,,,,,] between the game actions of complex I, highlighting that receptions that allow an organized attack, quick settings, and powerful attacks culminate in attack point [,,,].
In this scenario, it is important to identify that research has evolved the approach to sports performance analysis over time, seeking to comprehend performance according to the match context [,]. In this framework, Social Network Analysis (SNA) has been applied, allowing for a more comprehensive analysis considering direct and indirect links between performance indicators in data processing, permitting a more detailed analysis adjusted to the match [,,,,,,]. In volleyball, research using SNA and Eigenvector Centrality indicate the highest values in complex I for attacks executed at the ends of the net, especially in zones 4 and 2 [,], with second attack tempo [,], powerful attack [,] against simple block or broken double block [,], defended attack or attack point [,], and middle-blocker centered in zone 3 in the initial blocking condition [].
Although volleyball studies on game patterns are well-established in the literature, it is evident that many analyses are generalized, overlooking specificities that may vary depending on teams [,,,,,,,,]. Although research in this field considers the game ecological context within a competitive environment, it often fails to consider the dynamic interaction between the individual and the game environment through the possibilities of action, which emanate from different configurations of the game [,,,,]. In essence, it is necessary to analyze the characteristics of each team, as tactical game plans are specific to the strengths and weaknesses of the teams involved. Based on the aforementioned considerations, the aim was to analyze the type of game played by the top four teams in the Brazilian Men’s Volleyball Superliga, taking into account the match’s opponent. We hypothesize that the game type will differ depending on the opponent.
2. Materials and Methods
2.1. Sample
Twenty-two matches were analyzed involving the top four teams against each of the twelve participating teams in the 2021/2022 Brazilian Men’s Volleyball Superliga, including one home and one away game for each team. The sample comprised a total of 1699 attacks examined following receptions that enabled organized attacks with all available options [].
2.2. Variables
Location of middle-blocker attack: Considering the position where the middle-blocker jumped to attack, the player jumps ahead and close to the setter (TF); the player jumps behind and close to the setter (TC); the player jumps ahead and away from the setter (T7) [,].
Setting: To verify how the setter distribution by team occurred, we considered the setting for zones 4 (SETT-P4), 3 (SETT-P3), 2 (SETT-P2), 1 (SETT-P1), and 6 (SETT-P6) and also the ball attacked by the setter in the second touch (including the setter dump) (2SETT).
Number of Blockers: To analyze the impact of the distribution on subsequent play actions, the number of blockers was considered. Blocks were classified as triple [1 × 3], broken triple [1 × (2 + 1)], double [1 × 2], broken double [1 × (1 + 1)], single [1 × 1], no block by merit of the setter [1 × 0] [].
Attack Effect: Attack effects were categorized as error (the attacker strikes the ball into the net, out of bounds, or violates the regulations), blocked (the attacker fails due to opponent block), continuity (the attack does not result in a final action and allows the counter-attack), and point (the attack results in a direct point as the ball touches the opponent side or is deflected by blocking off the court) [].
Finally, we analyze the initial position of the setter at the beginning of the rally, identifying the configuration in Rotation 1 (R1), Rotation 2 (R2), Rotation 3 (R3), Rotation 4 (R4), Rotation 5 (R5), and Rotation 6 (R6). The setter’s initial position provides insights into offensive organization, with all teams using the same attacking system (5-1). For instance, when the setter is in R1, there are three attackers in the net, but the opposite is in R4 and the outside hitter is in R2. On the other hand, when the setter is in R5, there are three attackers in the net, but the opposite is in R2 and the outside hitter is in R4.
2.3. Data Collection
All matches were filmed with a view from above the court, with a high-definition (1080p) Sony® camera positioned approximately 7–9 m behind the court bottom line, and five meters above ground level. All footage was provided by the technical staff of the Brazilian Volleyball Team. Three physical education professionals with more than five years of experience as performance analysts analyzed the actions used in the study. For reliability testing, 30% of the actions were reanalyzed, which is above the 10% reference value []. Cohen’s Kappa value for intra-observer was 1 with a standard error equal to 0. The inter-observer value ranged between 0.93 and 0.99, with respective standard errors of 0.03 and 0.01. These values exceed the recommended value of 0.75 [].
2.4. Data Analysis
For the social network analysis, we created four networks, each corresponding to one of the teams under examination. Data were recorded in a Microsoft Excel 2015 for Windows spreadsheet, and IBM SPSS Statistics (Version 23, Armonk, NY, USA) was employed for data quality control and exploratory statistics. Social network analysis was conducted using Gephi 0.8.2-beta for Windows (Version 10.10.3, France). In this study, social network analysis was chosen due to its capability to analyze and explore the connectivity and specificity of relationships among all setting variables, providing a comprehensive view. We utilized eigenvector centrality, grounded on the concept that a node exhibits greater centrality when connected to nodes that are also more central [,]. Hence, a node’s centrality is influenced not only by the number of its adjacent nodes but also by its interaction characteristics []. Node size and edge thickness were manipulated to highlight the magnitude of the eigenvector measure. Consequently, node size determines the visual contrast of variables based on eigenvector centrality. When a variable is directly or simultaneously related to another, it forms a connection, and through eigenvector centrality, the indirect connections of a node are also considered [,]. For organization, Fruchterman was utilized with Reigold distribution (area 100,000), arranging nodes with the highest eigenvector centrality at the center of each sub-network [].
3. Results
The analysis of social networks using the eigenvector was conducted on a per-team basis, focusing on teams that finished in the top four in the Volleyball Super League. Table 1 presents the eigenvector values for each team, considering the attack construction.

Table 1.
Eigenvector values for the attack construction.
When analyzing the attack construction (See Figure 1, Figure 2, Figure 3 and Figure 4), it is observed that the teams that came in second, third, and fourth positions exhibited higher eigenvector values, regardless of the opponent, for the middle-blocker jumper positioned in front of and close to the setter (eigenvector values ranging between 0.14 and 1.00). However, the Super League champion team showed variation in offensive construction, presenting higher eigenvector values for the middle-blocker jumping in front and close to the setter and the middle-blocker jumping in front and away from the setter, depending on the opponent (ranging between 0.26 and 0.94). Regarding the setting zone, it is noteworthy that the teams predominantly set to zones 3 and 4, depending on the opponent (ranging between 0.12 and 0.89). The second-place team exhibited the highest variability in the setting zone, compared to the other teams analyzed.
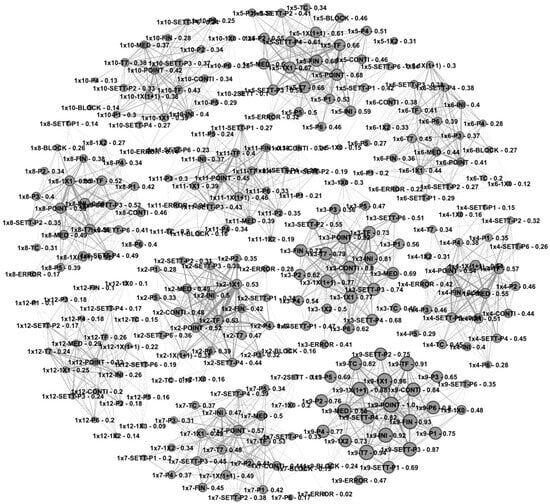
Figure 1.
Network analysis of the team ranked 1st.
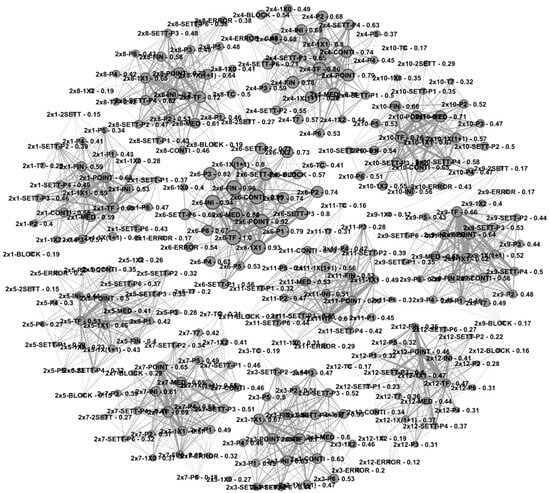
Figure 2.
Network analysis of the team ranked 2nd.
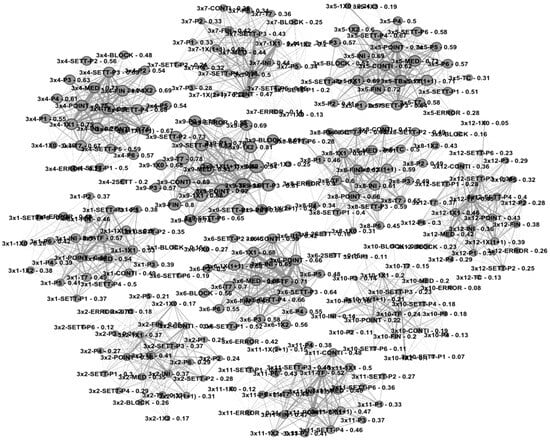
Figure 3.
Network analysis of the team ranked 3rd.
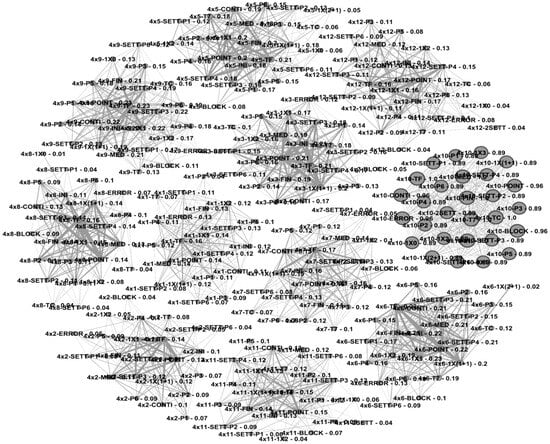
Figure 4.
Network analysis of the team ranked 4th.
Regarding the results of the attack condition (see Figure 1, Figure 2, Figure 3 and Figure 4 and Table 2), it is observed that the highest eigenvector values were, for the most part, for 1 × 1 or 1 × (1 + 1) blocks (eigenvector values varying between 0.13 and 0.96), attack point (ranging between 0.13 and 1.00), and the setter’s initial position in the rally, being specific to the opponent (ranging between 0.11 and 0.89).
Table 2.
Eigenvector values for the attack condition.
4. Discussion
Match analysis should take into account the teams involved in the game to provide indications of factors that affect team performance, as the specific characteristics of these teams determine the style of game played [,,,]. In the volleyball context, the research in this area has predominantly analyzed the championships in a generalized manner, indicating factors that influence overall performance [,,,,], without considering that there are differences in game patterns depending on the opponent. Given this scenario, this research aimed to analyze the type of game played by the four best teams in the Brazilian Men’s Volleyball Superliga, according to the match’s opponent. We hypothesized that the game type played would differ depending on the opponent, which was partially confirmed. Below, we will discuss point by point the game procedures that were evaluated and the results found.
When considering the middle-blocker attack location, notable variations were observed only with the team ranked first. This result indicates that this team sought to start the offensive construction, generating uncertainty regarding the distribution of attack location for the opponent. Furthermore, it implies that the middle-blockers of this team’s attackers exhibit heightened effectiveness in these two types of settings provided for the middle-blocker. This fact is reinforced when analyzing the setting zone, as eigenvector values are consistently higher for settings carried for zone 3. Previous research in this area aligns partially with the presented results, demonstrating that eigenvector values are higher for the TF and TC, respectively [,]. However, there is a difference in this offensive construction of the game when teams win or lose games. Losing teams exhibit higher eigenvector values for TF and TC, while winning teams show higher eigenvector values for TF and T7 []. Thus, the team’s attacking performance is related to the distance the setter is from the attackers and the net [,], suggesting that in Brazilian volleyball, it is preferred to play with the middle-blocker ahead and close to the setter (TF), increasing the displacement of the opposing team’s blocker.
The results regarding the setting zone reveal that the highest eigenvector values are concentrated for setting zones 3 and 4. However, when observing the team positioned in second place, where greater variability in the setting is evident, high eigenvector values are also identified for zone 6 (notably in the games against the fourth- and fifth-placed teams). In this context, the second-place team facilitates the play construction called pipe, that is, the attack of the player from zone 6 close to the player from zone 3, making defensive structure difficult. Furthermore, across the analyzed teams, there is a clear preference to play from the center of the court forward of the setter, that is, to set to zones 3, 4, and 6, allowing greater predictability at the location of the setting. These results corroborate the existing literature, as Brazilian teams predominantly employ attackers from the net, preferably with attacks from zone 4 and zone 3, while at the same time avoiding setting for attackers from the backcourt [,,,,,,]. In this sense, it is observed that teams rarely use the attack from the backcourt, and when they do use it, it occurs more in zone 6 [,,], reducing the occurrence of plays that allow offensive numerical superiority in the same area of the court, as occurs in the pipe [,,]. In this context, teams appear to adopt a less risky and more conservative approach, avoiding backcourt attacks and favoring a style of play with attackers at the net to enhance unpredictability.
When considering the blocker’s number and the attack effect, it was observed that the teams predominantly executed attacks against single or broken double blocks and obtained the point of attack. These results indicate that the opposing defensive system could not anticipate and adapt to the demands imposed by the offensive structure. Research in this area indicates that, for the most part, there are double and single blocks [,,], and there is a relationship between the number of blockers, the athlete who received the serve, and the reception quality [,]. Concerning the attack point, the literature consistently demonstrates that this is the most recurrent effect in volleyball [,,,,,]. In this context, when considering that the present research solely analyzed organized attack conditions with all available attackers, it is noteworthy that there are high eigenvector values for 1 × (1 + 1) blocks. Therefore, this result may indicate that the blockers, even in ideal distribution conditions, managed to anticipate the location of the attack. Thus, the fact that the teams mostly rise from the center of the court forward (zones 3 and 4) makes it easier for blockers to read the game, allowing for better defensive organization.
The results regarding the setter’s initial position at the beginning of the rally indicate a high variability among teams, suggesting that teams sought to start the game with a specific team formation, considering the influence of this rotation on the offensive construction, especially in complex I about the opposing team rotation. Research that analyzed team rotation and performance indicators highlighted that the most effective attack often occurs when the setter’s initial position is zone 2 [,]. Additionally, research indicates that when the setter occupies rotations in zones 6, 1, and 2, there is an association with winning the game []. In this scenario, the divergences between research in the area and the results found reside in the fact that research generally analyzes championships. Consequently, the differences found in the results show specificities inherent to the opponent encountered. Accordingly, these results suggest that teams start with the set-in formations that allow them to enhance performance indicators based on both team’s rotations, that is, to define the team’s best attackers against the blockers and vice versa.
In a general analysis, the results showed that the teams classified in the first two positions sought to vary their offensive pattern, with the team classified in first place changing the type of setting to the middle-blocker, while the team classified in second place varied the setting zone. In this context, these teams probably achieved better performances by adapting better to the opponent; that is, the decision making in the offensive construction was based on the specifying aspects of the context about the ecology of the game, something that has been discussed in the literature for a long time [,,,]. On the other hand, the teams in third and fourth place opted for traditional, low-risk game strategies, suggesting that setters need better ability to interpret the game scenario, as it seems that the offensive construction was predetermined and neglected information from the opponent’s defensive system [] (Nascimento, Laporta, Pedrosa, et al., 2023). Therefore, except for the championship finalist teams, the performance of the other teams depends on the players’ characteristics, mainly attackers, since there are no differences in the playing pattern adopted against the opponents.
5. Conclusions
In this sense, high-level Brazilian volleyball teams must vary their offensive pattern in response to the opponent. Therefore, training environments should replicate and simulate scenarios that require increased attacks from the backcourt and the opposing attacker, generating unpredictability in the opponent’s defensive system. Furthermore, given that this study has the limitation of not considering games that take place at home and away from home, it is suggested that future research analyzes the pattern of offensive play according to the opponent and the game location, as there are differences in performance emanating from this variable that were not specified in this manuscript.
Author Contributions
Conceptualization, M.H.d.N. and G.D.C.T.C.; methodology, A.B.F. and A.C.R.R.; software, H.U. and H.d.O.C.; validation, G.F.P., L.S.F. and L.L.; formal analysis, M.H.d.N., A.B.F. and A.C.R.R.; investigation, G.D.C.T.C.; resources, H.d.O.C.; data curation, H.U.; writing—original draft preparation, G.D.C.T.C. and M.H.d.N.; writing—review and editing, G.F.P., H.U., L.S.F., and L.L.; visualization, all authors; supervision, G.D.C.T.C. All authors have read and agreed to the published version of the manuscript.
Funding
This research received no external funding.
Institutional Review Board Statement
The study was conducted in accordance with the Declaration of Helsinki, and approved by the Ethics Committee of UNIVERSIDADE FEDERAL DE GOIÁS protocol CAAE: 15137319.6.0000.5083 approved 5 June 2019.
Informed Consent Statement
Informed consent was obtained from all subjects involved in the study.
Data Availability Statement
Data is contained within the article.
Conflicts of Interest
The authors declare no conflicts of interest.
References
- Eom, H.J.; Schutz, R.W. Statistical Analyses of Volleyball Team Performance. Res. Q. Exerc. Sport 1992, 63, 11–18. [Google Scholar] [CrossRef] [PubMed]
- Hughes, M. Notational analysis—A mathematical perspective. Int. J. Perform. Anal. Sport 2004, 4, 97–139. [Google Scholar] [CrossRef]
- Rocha, A.C.R.; Laporta, L.; Rodrigues, G.P.; de Lira, C.A.B.; Castro, H.d.O.; Costa, G.d.C.T. Is it possible for the reception and the player-receiver to influence the offensive construction in volleyball? An ecological vision and Intragame procedural relationships in high-level teams. Int. J. Perform. Anal. Sport 2023, 23, 319–333. [Google Scholar] [CrossRef]
- Rocha, A.C.R.; Laporta, L.; Rodrigues, G.P.; Guimarães, J.d.S.; Nascimento, M.H.D.; Rodrigues, M.C.J.; Leonardi, T.J.; de Lira, C.A.B.; Castro, H.d.O.; Costa, G.D.C.T. Inter e intra-variability of the best ranked teams: A network analysis in male high-level volleyball. PLoS ONE 2023, 18, e0280365. [Google Scholar] [CrossRef] [PubMed]
- Araújo, D.; Davids, K. The (Sport) Performer-Environment System as the Base Unit in Explanations of Expert Performance. J. Expert. 2018, 1, 144–154. [Google Scholar]
- Gibson, J.J. The Senses Considered as Perceptual Systems; Allen & Unwin: London, UK, 1966. [Google Scholar]
- Woods, C.T.; McKeown, I.; Rothwell, M.; Araújo, D.; Robertson, S.; Davids, K. Sport Practitioners as Sport Ecology Designers: How Ecological Dynamics Has Progressively Changed Perceptions of Skill “Acquisition” in the Sporting Habitat. Front. Psychol. 2020, 11, 654. [Google Scholar] [CrossRef] [PubMed]
- Lord, F.; Pyne, D.B.; Welvaert, M.; Mara, J.K. Methods of performance analysis in team invasion sports: A systematic review. J. Sports Sci. 2020, 38, 2338–2349. [Google Scholar] [CrossRef]
- Nascimento, M.H.; Laporta, L.; Pedrosa, G.F.; Rocha, A.C.R.; de Lira, C.A.B.; Campos, M.H.; Guimarães, J.d.S.; Leonardi, T.J.; Rodrigues, M.C.J.; Figueiredo, L.S.; et al. The Decision-Making of High-Level Volleyball Setters in the 2021-2022 Volleyball Men’s Superliga: Does the Opponent Matter? Percept. Mot. Ski. 2023, 130, 2603–2620. [Google Scholar] [CrossRef]
- Nascimento, M.H.; Laporta, L.; Rocha, A.C.R.; De Lira, C.A.B.; Campos, M.H.; Pedrosa, G.F.; Guimarães, J.D.S.; Rodrigues, M.C.J.; Leonardi, T.J.; Castro, H.D.O.; et al. Decision making in men’s high-level volleyball: Analysis of the setter based on game performance. J. Phys. Educ. Sport 2023, 23, 603–612. [Google Scholar] [CrossRef]
- González-Rodenas, J.; Aranda-Malavés, R.; Tudela-Desantes, A.; Moreno, F.C.; Casal, C.A.; Aranda, R. Effect of Match Location, Team Ranking, Match Status and Tactical Dimensions on the Offensive Performance in Spanish ‘La Liga’ Soccer Matches. Front. Psychol. 2019, 10, 2089. [Google Scholar] [CrossRef]
- Oliva-Lozano, J.M.; Rojas-Valverde, D.; Gómez-Carmona, C.D.; Fortes, V.; Pino-Ortega, J. Impact of contextual variables on the representative external load profile of Spanish professional soccer match-play: A full season study. Eur. J. Sport Sci. 2021, 21, 497–506. [Google Scholar] [CrossRef] [PubMed]
- Lemes, J.C.; Luchesi, M.; Diniz, L.B.F.; Bredt, S.D.G.T.; Chagas, M.H.; Praça, G.M. Influence of pitch size and age category on the physical and physiological responses of young football players during small-sided games using GPS devices. Res. Sports Med. 2020, 28, 206–216. [Google Scholar] [CrossRef] [PubMed]
- Trombiero, D.S.; Praça, G.M.; Borges, E.d.P.A.; de Lira, C.A.B.; Leonardi, T.J.; Laporta, L.; Castro, H.d.O.; Costa, G.D.C.T. Analysis of Physiological, Physical, and Tactical Responses in Small-Sided Games in Women’s Soccer: The Effect of Numerical Superiority. Appl. Sci. 2023, 13, 8380. [Google Scholar] [CrossRef]
- Praça, G.M.; Chagas, M.H.; Bredt, S.G.T.; Andrade, A.G.P.; Custódio, I.J.O.; Rochael, M. The influence of the offside rule on players’ positional dynamics in soccer small-sided games. Sci. Med. Footb. 2021, 5, 144–149. [Google Scholar] [CrossRef] [PubMed]
- Brito, E.; Sousa, R.; Bredt, S.D.; Greco, P.J.; Clemente, F.M.; Teoldo, I.; Praça, G.M. Influence of limiting the number of ball touches on players’ tactical behaviour and network properties during football small-sided games. Int. J. Perform. Anal. Sport 2019, 19, 999–1010. [Google Scholar] [CrossRef]
- Praça, G.M.; Moreira, P.E.D.; de Andrade, A.G.P.; Clemente, F.M.; de Oliveira, W.B.; Demétrio, G. Integrating notational and positional analysis to investigate tactical behavior in offensive and defensive phases of football matches. Proc. Inst. Mech. Eng. Part P J. Sports Eng. Technol. 2022. [Google Scholar] [CrossRef]
- Ramos, A.; Coutinho, P.; Silva, P.; Davids, K.; Guimarães, E.; Mesquita, I. Entropy measures reveal collective tactical behaviours in volleyball teams: How variability and regularity in game actions influence competitive rankings and match status. Int. J. Perform. Anal. Sport 2017, 17, 848–862. [Google Scholar] [CrossRef]
- Araújo, C.R.P.; Tosini, L.; Freire, A.B.; Costa, G.D.C.T.; Meira, C.M. Reception-attack relation in men’s and women’s volleyball during the Rio 2016 Olympics. J. Phys. Educ. Sport 2020, 20, 2008–2012. [Google Scholar] [CrossRef]
- Costa, G.D.C.T.; Ceccato, J.S.; de Oliveira, A.S.; Evangelista, B.F.d.B.; Castro, H.d.O.; Ugrinowitsch, H. Men’S hight level volleyball: Association between game actions on the side-out. J. Phys. Educ. 2016, 27, 1–15. [Google Scholar] [CrossRef][Green Version]
- Marcelino, R.; Sampaio, J.; Amichay, G.; Gonçalves, B.; Couzin, I.D.; Nagy, M. Collective movement analysis reveals coordination tactics of team players in football matches. Chaos Solitons Fractals 2020, 138, 109831. [Google Scholar] [CrossRef]
- Costa, G.D.C.T.; Freire, A.B.; Fernández-Echeverría, C.; Evangelista, B.F.d.B.; Pedrosa, G.F.; Ugrinowitsch, H.; Castro, H.d.O. Análise do ataque do jogador de ponta no voleibol brasileiro masculino. Rev. Bras. Ciências Esporte 2020, 42, e2003. [Google Scholar] [CrossRef]
- Drikos, S.; Barzouka, K.; Nikolaidou, M.-E.; Sotiropoulos, K. Game variables that predict success and performance level in elite men’s volleyball. Int. J. Perform. Anal. Sport 2021, 21, 767–779. [Google Scholar] [CrossRef]
- Rocha, A.C.R.; Freire, A.B.; Martins, L.R.; Maia, M.P.; Guimarães, J.d.S.; Ugrinowitsch, H.; Castro, H.d.O.; Costa, G.D.C.T. Predictive factors of the attack efficacy: The case of the Brazilian women’s Volleyball League champion team. Rev. Bras. Cineantropometria Desempenho Hum. 2019, 21, e59383. [Google Scholar] [CrossRef]
- Hurst, M.; Loureiro, M.; Valongo, B.; Laporta, L.; Nikolaidis, T.P.; Afonso, J. Systemic Mapping of High-Level Women’s Volleyball using Social Network Analysis: The Case of Serve (K0), Side-out (KI), Side-out Transition (KII) and Transition (KIII). Int. J. Perform. Anal. Sport 2016, 16, 695–710. [Google Scholar] [CrossRef]
- Laporta, L.; Afonso, J.; Mesquita, I. Interaction network analysis of the six game complexes in high-level volleyball through the use of Eigenvector Centrality. PLoS ONE 2018, 13, e0203348. [Google Scholar] [CrossRef] [PubMed]
- Loureiro, M.; Hurst, M.; Valongo, B.; Nikolaidis, P.; Laporta, L.; Afonso, J. A Comprehensive Mapping of High-Level Men’s Volleyball Gameplay through Social Network Analysis: Analysing Serve, Side-Out, Side-Out Transition and Transition. Int. J. Sports Sci. Med. 2017, 6, 35–41. [Google Scholar] [CrossRef]
- Giatsis, G.; Drikos, S.; Lola, A. Analysis of match report indicators in men’s volleyball Olympics and world championships (2014–2021) depending on the type of final score. Int. J. Sports Sci. Coach. 2022, 18, 874–882. [Google Scholar] [CrossRef]
- Silva, M.; Sattler, T.; Lacerda, D.; João, P.V. Match analysis according to the performance of team rotations in Volleyball. Int. J. Perform. Anal. Sport 2016, 16, 1076–1086. [Google Scholar] [CrossRef]
- Martins, J.B.; Afonso, J.; Mendes, A.; Santos, L.; Mesquita, I. Inter-team variability in game play under critical game scenarios: A study in high-level men. Retos 2022, 43, 1095–1105. [Google Scholar] [CrossRef]
- Rocha, A.C.R.; Laporta, L.; de Lira, C.A.B.; Modenesi, H.; Figueiredo, L.S.; Costa, G.D.C.T. Complex I in male elite volleyball: An interactional analysis according to reception location. Int. J. Perform. Anal. Sport 2022, 22, 77–89. [Google Scholar] [CrossRef]
- González-Silva, J.; Fernández-Echeverría, C.; Conejero, M.; Moreno, M.P. Characteristics of Serve, Reception and Set That Determine the Setting Efficacy in Men’s Volleyball. Front. Psychol. 2020, 11, 222. [Google Scholar] [CrossRef] [PubMed]
- Rocha, A.C.R.; Pedrosa, G.F.; Freire, A.B.; Praça, G.M.; Ugrinowitsch, H.; Castro, H.d.O.; Costa, G.T. Analysis of the setting and predictive factors of the effect of attack according to game ecology: The case of female volleyball. Kinesiology 2020, 52, 217–223. [Google Scholar] [CrossRef]
- Rocha, A.C.R.; Ugrinowitsch, H.; Freire, A.B.; Castro, H.O.; Praça, G.M.; Evangelista, B.F.B.; Costa, G.C.T. Brazilian men’s volleyball: Analysis of attacks carried out from the attack zone. J. Phys. Educ. Sport 2019, 19, 2441–2445. [Google Scholar] [CrossRef]
- Costa, G.C.; Castro, H.O.; Evangelista, B.F.; Malheiros, L.M.; Greco, P.J.; Ugrinowitsch, H. Predicting Factors of Zone 4 Attack in Volleyball. Percept. Mot. Ski. 2017, 124, 621–633. [Google Scholar] [CrossRef] [PubMed]
- Costa, G.C.T.; Afonso, J.; Barbosa, R.V.; Coutinho, P.; Mesquita, I. Predictors of attack efficacy and attack type in high-level Brazilian women’s volleyball. Kinesiology 2014, 46, 242–248. [Google Scholar]
- Conti, G.D.C.T.C.; Castro, H.D.O.C.; Freire, A.B.F.; Evangelista, B.F.E.; Pedrosa, G.F.P.; Ugrinowitsch, H.U.; Praça, G.M.P. High level of Brazilian men’s volleyball: Characterization and difference of predictive factors of back row attack. Motricidade 2018, 14, 58–65. [Google Scholar] [CrossRef]
- Costa, G.D.C.T.; Ceccato, J.S.; Evangelista, B.F.d.B.; Freire, A.B.; de Oliveira, A.S.; Milistetd, M.; Rodrigues, H.D.A.; Ugrinowitsch, H. Tactic determinants of game practiced by middle attacker in men’s volleyball. Rev. Bras. Cineantropometria Desempenho Hum. 2016, 18, 371–379. [Google Scholar] [CrossRef]
- Costa, G.D.C.T.; Maia, M.P.; Capuzzo, J.; Evangelista, B.F.d.B.; Freire, A.B.; Nora, F.G.d.S.A.; Campos, M.H.; Ugrinowitsch, H. Offensive structuring in men’s high-level volleyball: Analysis of the attack zone. Rev. Bras. Cineantropometria Desempenho Hum. 2016, 18, 611–619. [Google Scholar] [CrossRef]
- Costa, G.D.C.T.; Maia, M.P.; Rocha, A.C.R.; Martins, L.R.; Gemente, F.R.F.; Campos, M.H.; Milistetd, M.; Freire, A.B. Association between effect of reception and game procedures in high-level Brazilian volleyball: The case of the women’s “Superliga” champion team. Rev. Bras. Cineantropometria Desempenho Hum. 2017, 19, 663–675. [Google Scholar] [CrossRef]
- Lima, V.d.S.; Rocha, F.B.F.; Diniz, I.B.; García-De-Alcaraz, A.; Palao, J.M.; Costa, G.d.C.T.; Mesquita, I.; Medeiros, A.I.A.; Batista, G.R. Status of Match Analysis Research in Indoor and Beach Volleyball: A bibliometric analysis. Retos 2023, 50, 838–848. [Google Scholar] [CrossRef]
- Silva, M.; Marcelino, R.; Lacerda, D.; João, P.V. Match Analysis in Volleyball: A systematic review. Int. J. Sports Sci. Med. 2016, 5, 35. [Google Scholar]
- Laporta, L.; Afonso, J.; Valongo, B.; Mesquita, I. Using social network analysis to assess play efficacy according to game patterns: A game-centred approach in high-level men’s volleyball. Int. J. Perform. Anal. Sport 2019, 19, 866–877. [Google Scholar] [CrossRef]
- Laporta, L.; Afonso, J.; Mesquita, I. The need for weighting indirect connections between game variables: Social Network Analysis and eigenvector centrality applied to high-level men’s volleyball. Int. J. Perform. Anal. Sport 2018, 18, 1067–1077. [Google Scholar] [CrossRef]
- Moreira, P.E.D.; Barbosa, G.F.; Murta, C.D.C.F.; Morales, J.C.P.; Bredt, S.D.G.T.; Praça, G.M.; Greco, P.J. Network analysis and tactical behaviour in soccer small-sided and conditioned games: Influence of absolute and relative playing areas on different age categories. Int. J. Perform. Anal. Sport 2020, 20, 64–77. [Google Scholar] [CrossRef]
- Praca, G.M.; Clemente, F.M.; de Andrade, A.G.P.; Morales, J.C.P.; Greco, P.J. Network analysis in small-sided and conditioned soccer games: The influence of additional players and playing position. Kinesiology 2017, 49, 185–193. [Google Scholar] [CrossRef]
- Praça, G.M.; e Sousa, R.B.; Bredt, S.d.G.T.; Clemente, F.M.; Teoldo, I.; Castro, H.d.O.; Costa, G.D.C.T.; Moreira, P.E.D. Defensive interactions in soccer small-sided games: An integrated approach between the fundamental tactical principles and the social network analysis. Rev. Bras. Cineantropometria Desempenho Hum. 2018, 20, 422–431. [Google Scholar] [CrossRef]
- Drikos, S.; Barzouka, K.; Balasas, D.G.; Sotiropoulos, K. Effect of quality of opposition on game performance indicators in elite male volleyball. Int. J. Sports Sci. Coach. 2022, 17, 169–177. [Google Scholar] [CrossRef]
- Dutra, L.N.; Ugrinowitsch, H.; Medeiros, A.I.A.; Clemente, F.M.; Damatta, G.B.; Figueiredo, L.S.; Laporta, L.; Costa, G.D.C.T. Is there a setting distribution pattern in high-level men’s volleyball? An ecological approach to the game. J. Phys. Educ. Sport 2021, 21, 2190–2198. [Google Scholar] [CrossRef]
- Martins, J.B.; Mesquita, I.; Mendes, A.; Santos, L.; Afonso, J. Inter-team variability in high-level women’s volleyball from the perspective of Social Network Analysis: An analysis in critical game scenarios. Int. J. Perform. Anal. Sport 2021, 21, 564–578. [Google Scholar] [CrossRef]
- Mercado-Palomino, E.; Millán-Sánchez, A.; Parra-Royón, M.; Benítez, J.; Espa, A.U. Rango de Acción del Colocador como Indicador de Rendimiento en Voleibol Masculino; Universidad De Granada: Granada, Spain, 2022. [Google Scholar]
- Costa, G.D.; Souza, N.P.; Freire, A.B.; Moraes, J.C.; Fonseca, F.D.; Gemente, F.R.; Guimarães, J.D.; Castro, H.D. Analysis of associations and factors predicting the effectiveness of finalization in the female handball of high level. J. Phys. Educ. 2020, 31, e3158. [Google Scholar]
- Araújo, D.; Davids, K.; Bennett, S.J.; Button, C.; Chapman, G. Emergence of sport skills under constraints. In Skill Acquisition in Sport, 1st ed.; Williams, A.M., Hodges, N.J., Eds.; Routledge: London, UK, 2004; Volume 1, pp. 409–433. [Google Scholar]
- Araújo, D.; Hristovski, R.; Seifert, L.; Carvalho, J.; Davids, K. Ecological cognition: Expert decision-making behaviour in sport. Int. Rev. Sport Exerc. Psychol. 2017, 12, 1–25. [Google Scholar] [CrossRef]
- Woods, C.T.; McKeown, I.; O’sullivan, M.; Robertson, S.; Davids, K. Theory to Practice: Performance Preparation Models in Contemporary High-Level Sport Guided by an Ecological Dynamics Framework. Sports Med. Open 2020, 6, 36. [Google Scholar] [CrossRef] [PubMed]
- Fellingham, G.W.; Hinkle, L.J.; Hunter, I. Importance of attack speed in volleyball. J. Quant. Anal. Sports 2013, 9, 87–96. [Google Scholar] [CrossRef]
- Marcelino, R.; Mesquita, I.; Sampaio, J. Effects of quality of opposition and match status on technical and tactical performances in elite volleyball. J. Sports Sci. 2011, 29, 733–741. [Google Scholar] [CrossRef] [PubMed]
- Tabachnick, B.; Fidell, L. Using Multivariate Statistics, 6th ed.; Pearson: London, UK, 2013; Volume 1. [Google Scholar]
- Fleiss, J.L.; Levin, B.; Paik, M.C. Statistical Methods for Rates and Proportions, 3rd ed.; John Wiley & Sons: Hoboken, NJ, USA, 2013; Volume 1. [Google Scholar]
- Bonacich, P. Some unique properties of eigenvector centrality. Soc. Netw. 2007, 29, 555–564. [Google Scholar] [CrossRef]
- Borgatti, S.P. Centrality and network flow. Soc. Netw. 2005, 27, 55–71. [Google Scholar] [CrossRef]
- Newman, M.E.J. Modularity and community structure in networks. Proc. Natl. Acad. Sci. USA 2006, 103, 8577–8582. [Google Scholar] [CrossRef]
- Drikos, S.; Tsoukos, A. Data benchmarking through a longitudinal study in high-level men’s volleyball. Int. J. Perform. Anal. Sport 2018, 18, 470–480. [Google Scholar] [CrossRef]
- Sotiropoulos, K.; Drikos, S.; Barzouka, K. Variations in attack patterns between female and male opposite players in top-level volleyball. Int. J. Sports Sci. Coach. 2021, 17, 400–411. [Google Scholar] [CrossRef]
- Mercado-Palomino, E.; Millán-Sánchez, A.; Parra-Royón, M.; Benítez, J.; Espa, A.U. Setter’s action range as a performance indicator in male volleyball. Rev. Int. Med. Cienc. Act. Fis. Deport. 2022, 22, 169–182. [Google Scholar] [CrossRef]
- Millán-Sánchez, A.; Parra-Royón, M.J.; Benítez, J.M.; Espa, A.U. Ability to Predict Side-Out Performance by the Setter’s Action Range with First Tempo Availability in Top European Male and Female Teams. Int. J. Environ. Res. Public Health 2020, 17, 6326. [Google Scholar] [CrossRef]
- Costa, G.D.C.T.; Evangelista, B.F.d.B.; Maia, M.P.; Ceccato, J.S.; Freire, A.B.; Milistetd, M.; Moraes, J.C.; Ugrinowitsch, H. Volleyball: Analysis of attack performed from the backcourt on men’s Brazilian volleyball superleague (Brazilian championship). Rev. Bras. Cineantropometria Desempenho Hum. 2017, 19, 233–241. [Google Scholar] [CrossRef]
- Costa, G.D.C.; Freire, A.B.; Rocha, A.C.R.; Evangelista, B.F.d.B.; Krahenbuhl, T.; Campos, M.H.; Gentil, P. Association between game procedures and backcourt attack in the brazilian men’s super league. J. Phys. Educ. 2018, 29, 2967. [Google Scholar] [CrossRef][Green Version]
- Denardi, R.A.; Clavijo, F.A.R.; de Oliveira, T.A.C.; Travassos, B.; Tani, G.; Corrêa, U.C. The volleyball setter’s decision-making on attacking. Int. J. Perform. Anal. Sport 2017, 17, 442–457. [Google Scholar] [CrossRef]
- Drikos, S.; Sotiropoulos, K.; Gkreka, S.; Tsakiri, M.; Barzouka, K. Variations in Attack Patterns between Female and Male outside hitters in top-level Volleyball. Int. J. Sports Sci. Coach. 2023, 18, 245–256. [Google Scholar] [CrossRef]
- Mesquita, I.; Palao, J.M.; Marcelino, R.; Afonso, J. Indoor Volleyball and Beach Volleyball. In Routledge Handbook of Sports Performance Analysis, 1st ed.; McGarry, T., O’Donoghue, P., Sampaio, J., Eds.; Routledge: London, UK, 2013; Volume 1, pp. 367–379. [Google Scholar] [CrossRef]
- López, E.; Molina, J.J.; Díaz-Bento, M.S.; Díez-Vega, I. Spike performance in K1: Influence of rotation and reception area on high level men’s volleyball teams. Retos 2023, 48, 213–221. [Google Scholar] [CrossRef]
- Rocha, A.C.R.; Laporta, L.; Modenesi, H.; Vancini, R.L.; Fonseca, F.d.S.; Batista, G.R.; Medeiros, A.I.A.; Campos, M.H.; Dutra, L.N.; de Lira, C.A.B.; et al. Setting distribution analysis in elite-level men’s volleyball: An ecological approach. Res. Soc. Dev. 2021, 10, e47710111994. [Google Scholar] [CrossRef]
Disclaimer/Publisher’s Note: The statements, opinions and data contained in all publications are solely those of the individual author(s) and contributor(s) and not of MDPI and/or the editor(s). MDPI and/or the editor(s) disclaim responsibility for any injury to people or property resulting from any ideas, methods, instructions or products referred to in the content. |
© 2024 by the authors. Licensee MDPI, Basel, Switzerland. This article is an open access article distributed under the terms and conditions of the Creative Commons Attribution (CC BY) license (https://creativecommons.org/licenses/by/4.0/).