Article

Preparation and Properties of Waterborne Polyurethane and SBS Composite-Modified Emulsified Asphalt

School of Transportation and Logistics Engineering, Wuhan University of Technology, Wuhan 430063, China
*
Author to whom correspondence should be addressed.
Appl. Sci. 2024, 14(16), 7288; https://doi.org/10.3390/app14167288
Submission received: 19 July 2024 / Revised: 10 August 2024 / Accepted: 12 August 2024 / Published: 19 August 2024

Abstract

:
To address the issue of insufficient durability of traditional modified emulsified asphalt in the application of cold mix and cold paving anti-skid wear layers, this study utilizes cationic waterborne polyurethane (PU+) for composite modification to enhance adhesion and performance across a range of temperatures. Initially, composite-modified emulsified asphalt samples were prepared with varying dosages of PU+ according to a gradient method. Routine performance tests were conducted on the evaporated residues for analysis. Advanced rheological tests, including temperature sweep (TS), frequency sweep (FS), linear amplitude sweep (LAS), and multi-stress creep recovery (MSCR) tests, were performed using a dynamic shear rheometer (DSR). Surface free energy (SFE) tests were conducted with a fully automated surface tension meter (STM). A comprehensive evaluation of the high-temperature rheological properties, fatigue properties, adhesion properties, and water damage resistance of the modified emulsified asphalt residues was carried out. Chemical changes before and after modification were characterized using Fourier transform infrared spectroscopy (FTIR), and the distribution of polymers in the evaporated residue was observed using fluorescence microscopy (FM). The results demonstrated that cationic waterborne polyurethane significantly enhanced the fatigue and adhesion properties of SBS-modified emulsified asphalt, but it also weakened the water damage resistance of asphalt. MSCR tests revealed that the addition of cationic waterborne polyurethane might reduce the elastic recovery performance of modified asphalt, thereby weakening its resistance to rutting. Among the samples, the modified asphalt with a PU+ content of 6% exhibited good high-temperature shear resistance and elastic recovery performance, demonstrating the best anti-rutting performance.

1. Introduction

The increase in road construction activities correlates with a proportional rise in greenhouse gas emissions, contributing significantly to global warming. To mitigate greenhouse gas emissions, various industries are implementing diverse measures; for example, the road construction industry is striving to control its carbon footprint. One effective measure is the utilization of cold mix asphalt (CMA) in road construction to reduce greenhouse gas emissions.
CMA is produced by mixing emulsified asphalt with unheated aggregates, maintaining a manufacturing temperature range of 0–40 °C. This process eliminates the need for heating and significantly reduces energy consumption [1]. Additionally, the production of CMA requires minimal investment in equipment, facilitating widespread adoption. CMA is particularly suitable for use in remote areas, both for initial construction with 100% original mix and for recycling asphalt pavement using reclaimed asphalt pavement (RAP). The primary advantages of CMA include high cost-effectiveness, environmental friendliness, low emissions, and ease of production.
However, the use of water in CMA preparation and the absence of heating can affect the interaction between the binder and the aggregate, leading to decreased adhesion and various pavement issues. Repeated vehicle loading and environmental factors such as water, temperature, and ultraviolet radiation can cause common pavement failures, including permanent deformation (rutting) at high temperatures, cracking at low temperatures, and fatigue cracking [2,3,4]. Due to its inferior stability and durability compared to hot mix asphalt (HMA), CMA is mainly used for low-grade roads. Researchers are currently exploring various methods to enhance the road performance of CMA.
Emulsified asphalt, a water-based material, relies on the performance of its residue after water evaporation [5]. To enhance the mechanical properties of emulsified asphalt, extensive research has been conducted both domestically and internationally. For instance, adding cement has been explored to improve the performance of emulsified asphalt [6]. However, the interaction mechanism between emulsified asphalt and cement is complex, with factors such as pH and concentration influencing cement hydration, potentially causing instability or cracking of emulsified asphalt [7,8,9].
Polyurethane (PU) has emerged as an asphalt modifier due to its unique molecular structure. Sheng et al. studied the preparation and properties of PU-modified emulsified asphalt and found that an appropriate PU content significantly improved penetration and ductility compared to those of SBS-modified emulsified asphalt, enhancing both high- and low-temperature ductility [10]. However, the production of commonly used PU prepolymers and PU elastomers poses significant environmental and safety risks.
Waterborne polymer emulsions with low environmental impact and self-crosslinking capabilities, such as waterborne epoxy resin (WER), waterborne polyurethane (WPU) [10,11,12], and acrylate emulsions [13,14], represent another class of materials for improving emulsified asphalt performance. Due to the limitations of single modifiers in meeting the traffic and environmental demands of existing asphalt pavements, composite modification technology has gained attention in the modification of emulsified asphalt.
Water-based additives are water-soluble polymer systems stabilized in water through surfactants or by connecting hydrophilic polar groups, resulting in self-emulsification [15,16]. As water evaporates, polymer droplets coalesce, initiating self-crosslinking reactions. This forms an interconnected polymer network, rendering the water-based additive amorphous and highly crosslinked [17], with strong bonding and high strength [18]. These properties make them suitable for use as coating materials [19], composite material adhesives [20], and fiber adhesives [15].
Fu et al. prepared waterborne epoxy resin emulsified asphalt (WEREA) adhesive coatings using polyurethane epoxy resin, finding high early and late strength, ensuring effective bonding of road structural layers and enhancing durability [21]. Liu et al. studied waterborne epoxy resin (WER) and styrene–butadiene rubber (SBR) composite modified emulsified asphalt (WER-SCMEA) fog seal material, demonstrating good water stability and wear resistance [22]. To address the poor low-temperature performance of waterborne epoxy emulsified asphalt (W-EA), Xu et al. used waterborne polyurethane (WPU) as a modifier, finding that adding 10% WPU significantly improved low-temperature crack resistance [23].
Waterborne polyurethane (WPU), abbreviated as PU in this text, uses water as a solvent, offering advantages such as pollution-free production, safety, reliability, good compatibility, and easy modification. Its molecular chain contains numerous amino ester bonds and polyurethane segments, providing excellent physical properties such as high hardness, toughness, wear resistance, and chemical resistance. PU is widely used in coatings, adhesives, leather finishing, and other fields. With stringent global environmental protection requirements, PU, as an environmentally friendly polymer material, has promising development prospects. This study utilizes cationic waterborne polyurethane (WPU+), abbreviated as PU+ in the following text.
Despite its diverse applications, PU is seldom used for preparing composite modified emulsified asphalt. The preparation method for PU and the impact of this material on emulsified asphalt’s performance require further investigation to meet engineering standards. Xu et al. examined the feasibility of using water-based acrylate (WA) and PU as modifiers to enhance the performance of SBR/SBS-modified emulsified asphalt. They found that water cationic acrylate (WCA) provided the best modification for SBS-modified asphalt emulsion, balancing storage stability and high-temperature performance [24]. However, mixing PU with SBS-modified emulsified asphalt caused emulsion breaking, indicating poor storage stability, and no further performance tests were conducted [24].
Given the ease of preparing composite modified asphalt emulsions, SBS-modified emulsified asphalt and PU can be stored separately and mixed on-site. This study posits that despite the poor storage stability of SBS-modified emulsified asphalt with PU emulsion, the potential benefits of PU modification warrant further analysis.
In this study, SBS-modified emulsified asphalt and PU+ emulsion were mixed and stirred according to a dosage gradient. All the content is calculated based on the quality of SBS-modified emulsified asphalt. The emulsion was evaporated immediately after stirring to obtain the residue, which was then analyzed using routine performance tests. Advanced rheological tests, including temperature sweep (TS), frequency sweep (FS), linear amplitude sweep (LAS), and multi-stress creep recovery (MSCR) tests, were performed using a dynamic shear rheometer (DSR). Surface free energy (SFE) tests were conducted using a fully automated surface tension meter (STM). Comprehensive evaluations of the high-temperature rheological properties, fatigue performance, adhesion performance, and water damage resistance of the asphalt were performed. Chemical changes during the modification process were characterized using Fourier transform infrared spectroscopy (FTIR), and polymer distribution in the evaporated residue was observed using fluorescence microscopy (FM). This study aims to explore the feasibility of incorporating cationic waterborne polyurethane (PU+) to enhance the performance of SBS-modified emulsified asphalt, providing an effective modification method for preparing high-performance cold binders.

2. Materials and Methods

2.1. Materials and Their Preparation

2.1.1. Materials

SBS-modified emulsified asphalt is a commercially available product tested according to the procedures specified in the “Test Code for Asphalt and Asphalt Mixtures in Highway Engineering” (JTG E20-2011). The fundamental performance indicators are presented in Table 1. PU+ is a cationic waterborne polyurethane, FS-Y30C, sourced from Anhui Femtosecond Chemical Co., Ltd. (Chizhou, China). The basic properties of PU+ are listed in Table 2.

2.1.2. Preparation and Evaporation Method of Composite-Modified Asphalt Emulsion

A specific quantity of SBS-modified emulsified asphalt is measured, and the composite-modified asphalt emulsion is prepared according to the predetermined amount of modifier, mixing at room temperature (about 25 °C). After preparation, mechanical mixing is performed with a rotational speed set at 400 r/min for a duration of 1 min. The asphalt evaporation residue is obtained using the low-temperature evaporation method specified in ASTM D7497-09.

2.1.3. Technical Roadmap

The technical roadmap is as follows (Figure 1).

2.2. Performance Test Methods

2.2.1. Conventional Performance Test

Four types of modified emulsified asphalt were tested for their conventional properties, including softening point and ductility at 5 °C. These tests were conducted in strict accordance with the “Test Regulations for Asphalt and Asphalt Mixtures in Highway Engineering” (JTG E20-2011).

2.2.2. Temperature Sweep Test

The temperature sweep experiment was conducted using a dynamic shear rheometer (DSR) to determine the dynamic shear modulus ( G * ) and phase angle ( δ ) of high-performance emulsified asphalt residue within the high temperature range of 10–70 °C, with a temperature gradient of 10 °C. Curves of the dynamic shear modulus ( G * ), phase angle ( δ ), and rutting factor ( G * / sin δ ) as functions of temperature were plotted.
In accordance with the testing regulations, the samples for temperature sweep experiments typically include both unaged samples and samples that have undergone artificial short-term aging treatment with an RTFO. However, this study focused on horizontal comparisons and, therefore, did not perform any aging treatments. All samples used for the temperature sweep analysis were placed on parallel plates and had a diameter of 25 mm and a sample thickness of 1 mm. The temperature sweep experiment was conducted at a fixed angular frequency of 10 rad/s.

2.2.3. Frequency Sweep Test

The frequency sweep experiment was performed using a dynamic shear rheometer (DSR) to obtain the dynamic shear modulus ( G * ) and phase angle ( δ ) values of high-performance emulsified asphalt residue over a specified frequency range at different temperatures. Curves of the dynamic shear modulus ( G * ), phase angle ( δ ), and rutting factor ( G * / sin δ ) as functions of frequency were plotted at various temperatures. The test included both unaged samples and samples subjected to artificial short-term aging treatment with an RTFO. The experimental data were also used to plot the master curves of the dynamic shear modulus ( G * ) and phase angle ( δ ) for the modified emulsified asphalt residue.
Considering the actual working temperature range of asphalt pavement and the DSR dynamic shear rheometer’s temperature measurement capabilities, seven temperatures ranging from 10–70 °C in 10 °C increments were selected for the experiments. Continuous sinusoidal alternating loads were applied in strain control mode during the experiment. To ensure that the modified asphalt sample remained within the linear viscoelastic range, the loading strain was first determined by strain sweep test results. Given the DSR’s loading torque range requirements, the frequency scanning range was set from 0.1 to 10 Hz (0.628 to 62.83 rad/s).
To plot the master curves of shear modulus and phase angle for the emulsified asphalt residue, temperature–frequency sweep testing was conducted on the samples. The design of the temperature–frequency sweep program was as follows: Strain control was maintained at 0.3%. The temperature ranged from 10 to 40 °C (using an 8 mm test plate for low temperatures) and from 50 to 70 °C (using a 25 mm test plate for high temperatures) in increments of 10 °C. A frequency range of 0.1 Hz to 10 Hz (0.628 to 62.8 rad/s) was used, taking 21 points within the frequency range.

2.2.4. Linear Amplitude Sweep Test

The linear amplitude sweep (LAS) test evaluates the fatigue resistance of asphalt samples by applying cyclic loads with linearly increasing amplitudes. The LAS test is conducted using a dynamic shear rheometer (DSR) apparatus, utilizing standard parallel plates with a diameter of 8 mm and a plate spacing of 2 mm. The LAS testing method consists of two steps [25], adhering to the AASHTO TP 101-14 specification.
The LAS test allows the quick determination of parameters A and B in the traditional strain-controlled fatigue equation. Parameter A represents the initial fatigue life, which indicates the asphalt binder’s ability to resist fatigue damage before significant modulus reduction occurs. Parameter B represents the rate at which fatigue life decreases with increasing strain amplitude, reflecting the material’s sensitivity to changes in strain level.
Adhesives with strong fatigue resistance exhibit higher values of parameter A and lower absolute values of parameter B [26]. The traditional strain-controlled fatigue equation is defined as Equation (1).
N f = A × γ p B
where
N f is the fatigue life;
γ p is the amplitude of the applied shear strain.
Generally speaking, viscoelastic continuum damage model (VECD) mechanics [27] is used to calculate parameters A and B. In VECD mechanics, the damage evolution of viscoelastic materials is characterized by Schapery’s work potential theory. There are two theoretical foundations for it [28], the first being the VECD method based on PSE (Schapery’s elastic–viscoelastic correspondence principle) [29]; the second method is VECD based on DE (dissipated energy density). The VECD method based on PSE has the advantage of ignoring viscoelastic effects and can effectively quantify the relationship between damage strength (S) and material integrity (C) through equations. Therefore, this study adopted the VECD mechanical method based on PSE for data analysis. Experiments were conducted at 25 °C, and fatigue parameters A and B were calculated using formulas.
Then, the fatigue strength calculate based on the frequency sweep results and amplitude sweep results, as shown in Equation (2) below.
D t i i = 1 N π γ 0 2 C t i C t i 1 α 1 + α t i t i 1 1 1 + α
where
D t is the accumulated damage over time t (dimensionless);
C ( t ) = G t G i n i t i a l ; G * t is the complex modulus at time t;
G * i n i t i a l is the initial value of the complex modulus
γ 0 is the strain (%);
t is the testing time;
α = m 1 and m are the slope of the best-fit line on the logarithmic plot of storage modulus versus frequency.
At the given time t, we recorded the values of D t and C t , which could be fitted into the following equation (Equation (3)):
C t = C 0 C 1 D t C 2
where C0 = 1, while C1 and C2 are curve fitting parameters.
The damage value during destruction corresponds to the maximum peak shear stress, as shown in Equation (4).
D f = C 0 C at peak stress C 1 1 / C 2
Thus, the fatigue equation can be expressed by Equation (5).
N f = A γ max B
where
γ max is the maximum expected strain;
A = f × D f × 1 + 1 C 2 α 1 + 1 C 2 α × π C 1 C 2 α ;
f is the loading frequency, which is 10 Hz here;
B = 2 α .
The steps of the LAS test were as follows.
The LAS test plan consisted of two consecutive types of testing. The first test was a frequency sweep experiment, aimed at obtaining the rheological properties of asphalt materials; the second test was an amplitude sweep experiment, aimed at measuring the damage characteristics of asphalt materials.
The first step was the frequency sweep experiment. During the testing period, a strain load with an amplitude of 0.1% was applied to the emulsified asphalt residue sample. We took 12 points (30, 20, 10, 8, 6, 4, 2, 1, 0.8, 0.6, 0.4, and 0.2 Hz) in the frequency range of 0.2–30 Hz, and we recorded the dynamic shear modulus G * and phase angle δ .
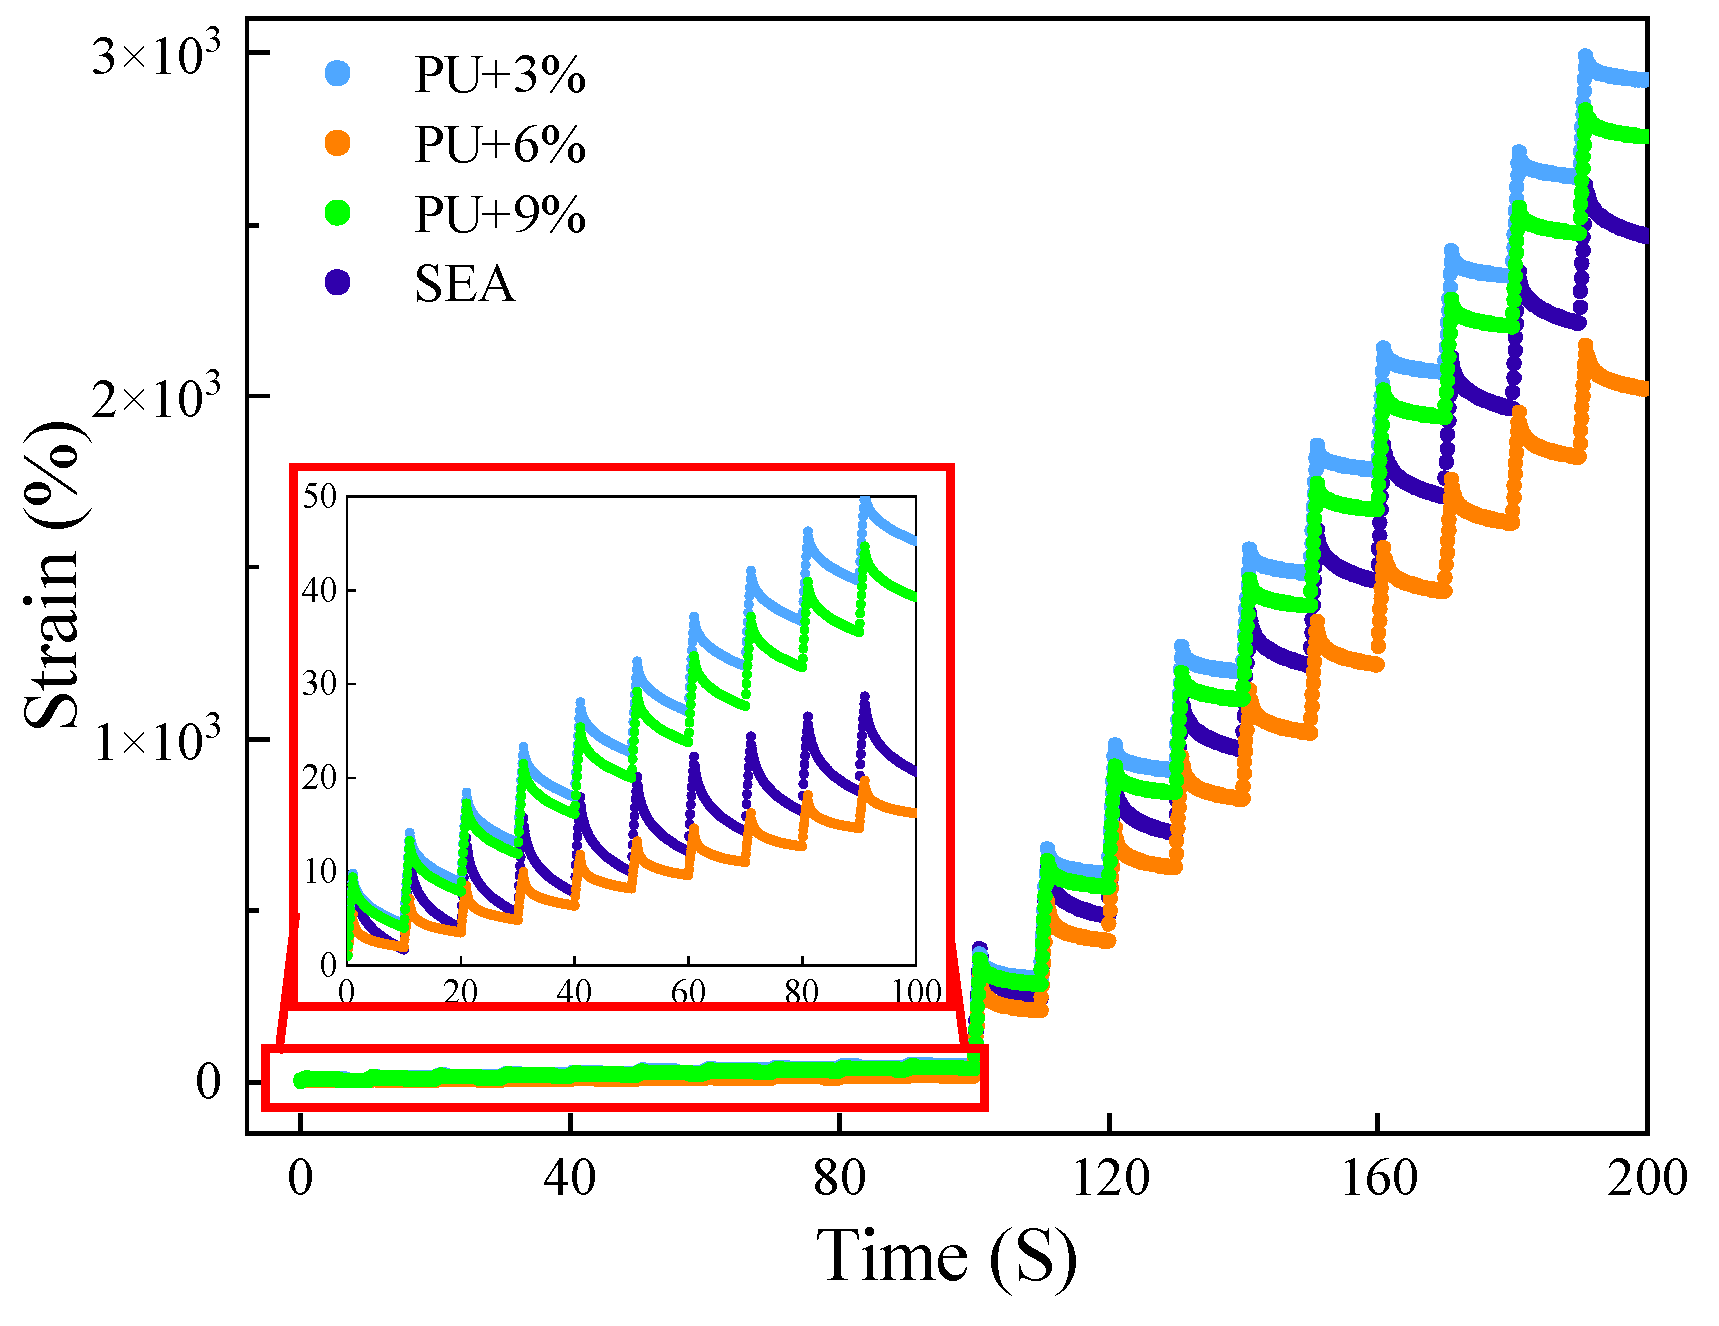
Step two was the amplitude sweep experiment. We applied oscillatory shear to asphalt samples in strain control mode at 25 °C, with a frequency of 10 Hz. We applied continuous oscillatory loading cycles with strain amplitudes increasing linearly from 0% to 30% to accelerate fatigue damage. The loading scheme consisted of 10 s intervals of constant strain amplitude, followed by intervals of increased strain amplitude. We recorded the peak shear strain and peak shear stress every 10 load cycles (1 s), as well as the phase angle and dynamic shear modulus.
An LAS experiment can be used to plot the curve of damage strength (S) and integrity parameter (C). C = 1 indicates that the asphalt specimen is in good condition, while C = 0 indicates that the asphalt specimen is completely destroyed. The faster the C value decreases, the poorer the fatigue resistance. By plotting the variation curves of shear stress and shear strain, the peak values and widths of different specimen curves can be compared. The higher the peak value and the wider the width, the stronger the elastic deformation ability of emulsified asphalt residue. In addition, the predicted fatigue life N f , N f can be calculated, and the smaller it is, the poorer the fatigue resistance of the specimen.

2.2.5. Multi-Stress Creep Recovery Test

Based on AASHTO T 350, multiple stress creep and recovery (MSCR) tests were conducted at 70 °C. Ten creep recovery cycles were conducted at stress levels of 0.1 kPa and 3.2 kPa, respectively. In each testing cycle, a constant load was applied to the specimen for 1 s, followed by a recovery period of 9 s. The average strain recovery rate ( R ) and unrecoverable creep compliance ( J n r ) were calculated to characterize the viscoelastic behavior of asphalt evaporation residue, as shown in Equations (6) and (7).
R = ε 1 ε 10 ε 1 10
J n r = ε 10 / σ 10
In the above equation, ε 1 is the strain at 1 s per cycle, ε 10 is the strain at 10 s per cycle, and σ is the applied shear stress.

2.2.6. Surface Free Energy Test

Surface free energy measures the adhesive properties of materials. The surface energy method first tests the surface energy parameters of single-phase materials, such as asphalt and aggregate, under actual temperature conditions. It then calculates the peeling energy of asphalt–aggregate two-phase materials under water conditions and the adhesion energy under water-free conditions. The absolute value of the ratio of adhesion energy to peeling energy is used as a matching index to evaluate the adhesion between the two materials [30,31,32]. A higher matching index indicates stronger adhesion and better water stability.
Domestic and foreign researchers typically use the absolute value of the ratio of these two parameters as the basic indicator ER for quantifying water stability, as shown in the following formula:
E R = Δ G l s a Δ G l w s a
where
Δ G l s a is the adhesion energy, mJ/m2.
Δ G l w s a is the peeling energy, mJ/m2.
The subscripts s, w, and l, respectively, represent the three material phases of aggregate, water, and asphalt.
Among them, the larger the adhesion energy, the stronger the adhesion between asphalt and aggregate; the greater the peeling energy, the higher the degree of displacement and peeling of the asphalt film by water. Therefore, the larger the compatibility index, the better the match between asphalt and aggregate, and the more ideal the water stability of asphalt mixture [33]. Based on this, some scholars have pointed out that the composition of aggregate gradation determines its specific surface area, and changing the adhesion area between asphalt and aggregate affects adhesion [31]. Therefore, the improved matching index ER1 for aggregate specific surface area is considered. Some scholars have considered the wetting effect of asphalt on aggregates, that is, the prerequisite for asphalt to spread on and wet the surface of aggregates is to overcome its own cohesion [34], and thus substitute the difference between adhesion energy and asphalt internal energy as an improved matching index ER2. The forms of the two are shown in Formulas (9) and (10), respectively.
E R 1 = Δ G d r y a Δ G w e t a
E R 2 = Δ G d r y a Δ G d r y c Δ G w e t a = R s Δ G w e t a
where
Δ G d r y a is the adhesion energy of asphalt, mJ/m2, with the same meaning as Δ G l s a .
Δ G w e t a is the peeling energy of asphalt, mJ/m2, with the same meaning as Δ G l w s a .
Δ G d r y c is the cohesive energy of asphalt, mJ/m2.
Surface free energy, also known as surface energy, measures the adhesive properties of materials. The energy required to separate solids or liquids into new units of surface area under vacuum conditions is called surface energy. This separation can occur within the same homogeneous material, known as cohesive bonding energy (or cohesive energy), or between heterogeneous materials, known as adhesion bonding energy (or adhesion energy). According to the Good–Van Oss–Chaudhury (GVOC) theory, the surface energy component of the material is shown in Formula (11), with the commonly used unit being mJ/m2.
γ = γ L W + γ A B = γ L W + 2 γ + γ
where
γ is the surface energy of the material, abbreviated as surface energy.
γ L W is the non-polar components of the material.
γ A B is the polarity component of the material.
γ + is the polar acid content of the material.
γ is the polar alkali content of the material.
From the perspective of thermodynamic theory, the relationship between the cohesive energy ( Δ G d r y c ) of asphalt and its surface energy is shown in the following formula:
Δ G d r y c = 2 γ = 2 γ L W + 4 γ + γ
The meaning of each parameter in the formula is the same as described above.
The calculation method for the adhesion energy ( Δ G d r y a ) between asphalt and aggregate is shown in the following formula:
Δ G d r y a = Δ G d r y a L W + Δ G d r y a A B = 2 γ l L W γ s L W + 2 γ l + γ s + γ l γ s +
where
Δ G d r y a is the adhesion energy between asphalt and aggregate.
Δ G d r y a L W is the non-polar component of adhesion energy.
Δ G d r y a A B is the polarity component of adhesion energy.
γ s L W , γ s + , γ s is the surface energy component of the aggregate.
γ l L W , γ l + , γ l is the surface energy component of asphalt.
Considering the presence of water, the adhesion energy between asphalt and aggregate is calculated using the following formula:
Δ G l w s a = Δ G l w s a L W + Δ G l w s a A B = 2 γ l L W γ w L W + γ s L W γ w L W γ l L W γ s L W γ w L W + γ w + γ l + γ s γ w + γ w γ l + + γ s + γ w + γ l + γ s γ l γ s +
where
Δ G l w s a is the adhesion energy between asphalt and aggregate in the presence of water, which is the peeling energy mentioned above.
Δ G l w s a L W is the non-polar component of adhesion energy in the presence of water.
Δ G l w s a A B is the polar component of adhesion energy in the presence of water.
γ w L W , γ w + , γ w is the surface energy component of water.
The meanings of the remaining parameters are the same as in Formula (13). The plug-in method for testing the surface energy of asphalt requires selecting three or more types of chemical reagents with known surface energy parameters.
Considering availability in the laboratory and adherence to the above principles, this study selected three non-polar chemical reagents: distilled water, formamide, and glycerol, all with a purity of over 99.9%. The density and surface energy parameters of the reagents are listed in Table 3.

2.2.7. Fourier Transform Infrared Spectroscopy Test

To investigate the effect of waterborne polyurethane on the chemical composition and functional groups of SBS-modified emulsified asphalt, Fourier transform infrared (FTIR) spectroscopy was employed. The FTIR testing was conducted using a Vector 22-type FTIR spectrometer from Bruker, Karlsruhe, Germany. This test aimed to assess the compatibility between waterborne polyurethane and SBS-modified emulsified asphalt with varying contents.
Each sample was prepared by casting a film onto a thin potassium bromide (KBr) plate. The spectrum was collected in the wavenumber range of 4000 cm−1 to 500 cm−1, with a resolution of 4 cm−1. Additionally, ATR-FTIR (Bruker TENSOR 27) was used to distinguish the chemical bond differences between waterborne polyurethane and SBS-modified emulsified asphalt in different zones. The sample was placed on a reflector, and its spectrum was recorded using infrared radiation. The sweep range was set as 600 cm−1 to 4000 cm−1, with a resolution of 4 cm−1. By identifying specific functional groups, the chemical changes during the modification process were characterized.

2.2.8. Fluorescence Microscopy Test

Fluorescence microscopy is a powerful tool for characterizing the internal structure of modified asphalt. In this study, fluorescence microscopy (Nikon Ti2, Nikon, Tokyo, Japan) was used to capture the distribution of modifiers and the internal polymer structure of the evaporated residue of composite-modified emulsified asphalt. Fluorescence microscope images were obtained using a 10× magnification objective lens with a resolution of 2048 pixels.
Fluorescence microscopy provides a detailed visualization of the dispersion and interaction of polymers within the asphalt matrix, which is essential for understanding the modification effects and improving the performance characteristics of the asphalt.

3. Results and Discussion

3.1. Conventional Performance Analysis

The softening point is a critical indicator for evaluating the high-temperature performance of asphalt. Figure 2 illustrates the softening points of four types of asphalt. The softening point of PU+3 was the highest at 73 °C, and the softening point of PU+9 was 71.6 °C. Both of these values were higher than that of standard emulsified asphalt (SEA). The softening point of PU+3 was increased by 5.49% compared to that of SEA, and the softening point of PU+9 was increased by 3.47% compared to that of SEA. The softening point of PU+6 was the lowest at 66 °C, which is 4.62% lower than that of SEA. Based on the softening point data, PU+3 and PU+9 exhibited better high-temperature performance, while PU+6 showed slightly weaker high-temperature performance compared to SEA. However, the difference in softening point values was not significant. Considering that the softening point alone is not a comprehensive indicator of the high-temperature performance of composite-modified emulsified asphalt evaporation residue, a more detailed comparison of high-temperature performance will be conducted in conjunction with further analysis.
Ductility at 5 °C is commonly used to evaluate the low-temperature performance of modified asphalt. Figure 2 also displays the ductility of the four types of asphalt. PU+3 had the highest elongation at 66 cm, which is 8.55% higher than that of SEA. PU+6 had the lowest elongation at 48.2 cm, which is 20.72% lower than that of SEA. PU+9 had an elongation of 52.5 cm, which is 13.65% lower than that of SEA. These results indicated that the ductility of PU+6 and PU+9 was significantly reduced, reflecting their weaker low-temperature performance. Conversely, the ductility of PU+3 was significantly improved compared to that of SEA, demonstrating its good low-temperature performance.

3.2. Temperature Sweep Analysis

The complex shear modulus, phase angle, and rutting factor of three different dosages of PU+ and SEA obtained from temperature sweep analysis are shown in Figure 3, Figure 4, Figure 5, Figure 6, Figure 7 and Figure 8. As the temperature increased, the complex shear modulus and rutting factor of the four types of asphalt gradually decreased, while the phase angle gradually increased. At 60 °C, the phase angle showed a decreasing trend, indicating the weakened shear and deformation resistance of the asphalt.
In the low-temperature range of 10–30 °C, the complex shear modulus and rutting factor of the three dosages of PU+ were significantly higher than those of SEA. Among the three dosages, PU+9 exhibited the highest values. The effect of dosage variation was minimal, and the impact of dosage diminished as the temperature increased. For instance, at 10 °C, the complex shear modulus of PU+6 was increased by 115.16% compared to that of SEA, while that of PU+9 increased was by 130.14%, showing a difference of 14.98% between the two. The rutting factor of PU+6 was increased by 171.88% compared to SEA, and that of PU+9 was increased by 184.34%, with a difference of 12.46% between them. In this temperature range, PU+6 showed the smallest phase angle, while SEA and PU+3 exhibited larger phase angles than the other two.
In the high-temperature range of 50–70 °C, PU+9 exhibited the highest complex shear modulus and rutting factor among the four types of asphalt, although the improvement effect was much less pronounced than at lower temperatures. For example, at 50 °C, the complex shear modulus of PU+9 was increased by 15.33% compared to that of SEA, and the rutting factor was increased by 15.34%. At 70 °C, the complex shear modulus of PU+9 was increased by 13.04% compared to that of SEA, and the rutting factor was increased by 13.21%. PU+6 consistently showed the smallest phase angle in the high-temperature range, while SEA and PU+9 had larger phase angles than the others.
At lower temperatures, the addition of PU+ significantly enhances the shear and deformation resistance of modified emulsified asphalt. The specific content of PU+ does not significantly affect this improvement, and as the temperature increases, the improvement effect gradually weakens. Based on the results of fluorescence microscopy experiments described later, it is evident that at higher temperatures, the large particle polymer formed by SBS and PU+ crosslinking in PU+9 exhibits better shear and deformation resistance than the other three. Across the entire temperature range, PU+6 has the smallest phase angle, indicating that the small-particle SBS polymer and small-particle PU+ polymer densely distributed in the asphalt exhibit excellent elasticity.

3.3. Frequency Sweep Analysis

The main curve of the complex shear modulus of asphalt obtained by frequency sweep is shown in Figure 9, and Figure 10 displays the phase angle of asphalt. At a reference temperature of 60 °C, as the frequency increased, the complex shear moduli of the four types of asphalt gradually increased.
In the low frequency range of 0.01–1 rad/s, PU+6 exhibited the highest complex shear modulus and the smallest phase angle, reflecting its higher hardness and better elasticity, which indicates superior shear resistance and deformation recovery ability. In the frequency range greater than 10 rad/s, the complex shear moduli of PU+3 and PU+9 surpassed those of PU+6 and SEA, with PU+6 still being greater than SEA. Concurrently, the phase angles of PU+3 and PU+9 decreased significantly with increasing frequency, and after 10,000 rad/s, their phase angles approached that of PU+6. In this higher frequency range (>10 rad/s), PU+3 and PU+9 demonstrated better shear resistance.
Based on the results of fluorescence microscopy experiments described later, it is evident that the different forms and structures of polymers in asphalt evaporation residues exhibit varied responses to shear stress at different frequencies. The SBS polymers crosslinked in a network form in SEA show the weakest shear resistance across the entire frequency range. Conversely, SBS in small-particle form and a small amount of PU+ polymer in PU+3 exhibit better shear resistance in the high-frequency range. SBS in the form of small particles combined with more PU+ polymers in PU+6 exhibit better shear resistance in the low-frequency range. Finally, the SBS and PU+ crosslinked polymers in large-particle form in PU+9 demonstrate better shear resistance in the high-frequency range.

3.4. Fatigue Performance Analysis

During the LAS test, asphalt undergoes shear stress as the shear strain increases, making the stress–strain curve indicative of the material’s dependence on strain and the damage characteristics during the shear process [35]. Figure 11 presents the stress–strain curves obtained from the LAS test for four modified asphalt evaporation residues. All three dosages of PU+ exhibited stress–strain curves with significant yield stress and yield strain. Initially, the shear stress increased rapidly with shear strain, then gradually decreased after reaching its maximum value. The maximum shear stress is defined as the yield stress, and the corresponding shear strain is defined as the yield strain.
PU+9 demonstrated the highest yield stress and the fastest increase in shear stress with strain before reaching the yield strain, indicating a strong resistance to deformation. Fluorescence microscopy experiments revealed that the large-particle polymers crosslinked by SBS and PU+ in PU+9 exhibited excellent shear resistance, consistent with previous analysis results. Beyond a strain level of 15%, PU+3 had the highest shear stress, and its yield strain was larger than those of PU+9 and PU+6. Given that the yield stress of PU+3 was close to that of PU+9, further analysis of the material damage characteristic curve (DCC) and fatigue life is required to compare the fatigue performance of PU+3 and PU+9 conclusively.
The stress–strain curve of SEA differed significantly from those of the other three. The SEA curve showed a lower rate of shear stress increase throughout the shear strain range of 0% to 30%, without a distinct yield stress point. Since the maximum shear strain in the standard LAS test is 30%, this study takes 30% as the yield strain of SEA. This characteristic is likely due to the denser and richer SBS polymer network in SEA that remains unaffected by stirring. The strain of the SBS polymer network in SEA increased slowly with stress, reflecting a lower shear stress value. Thus, within the strain range of 10–15%, SEA exhibited greater deformation under the same stress conditions, indicating poor resistance to deformation.
The damage characteristic curve (DCC) based on PSE (Schapery’s elastic–viscoelastic correspondence principle) is shown in Figure 12. It is evident that the DCC of SEA is lower than those of the three dosages of PU+, indicating that SEA had the lowest material integrity at the same damage level and the worst fatigue resistance. PU+3 has the highest DCC, meaning it maintained the highest material integrity at the same damage level, showcasing its superior fatigue resistance. From this analysis, PU+9’s fatigue resistance is better than that of PU+6.
A 35% failure level was used as the material failure standard to calculate and analyze the fatigue life of the four types of asphalt evaporation residues, as shown in Figure 13. PU+3 exhibited the highest fatigue life and the best anti-fatigue performance, while SEA had the lowest fatigue life, nearly an order of magnitude lower than those of the three dosages of PU+, indicating the worst anti-fatigue performance. PU+9 had a higher fatigue life than PU+6, suggesting better anti-fatigue performance. The results of the fatigue life analysis are highly consistent with those of the DCC analysis.

3.5. Multi-Stress Creep Recovery Analysis

As shown in Figure 14, the shear strain of the four types of asphalt was relatively small at a load level of 0.1 kPa, while the shear strain significantly increased at a load level of 3.2 kPa. This indicates that the size of the vehicle load would have a significant impact on road deformation, with heavier vehicles potentially causing deeper deformation. Under a load of 0.1 kPa, the strain of the evaporated residue was relatively small and recovers quickly, exhibiting a high recovery percentage. However, under a load of 3.2 kPa, the strain of the evaporated residue increased sharply, and the recovery rate and percentage decreased rapidly.
At both 0.1 kPa and 3.2 kPa load levels, PU+6 exhibited the lowest strain, indicating its optimal deformation resistance. PU+3 and PU+9 exhibited the highest strain, indicating weaker deformation resistance than SEA. This contradicts the conclusion from the temperature sweep analysis, necessitating further examination from the perspectives of recovery percentage and unrecoverable creep compliance.
Figure 15 shows the recovery percentage (R) values of the four modified emulsified asphalts at load levels of 0.1 kPa and 3.2 kPa. Generally, a higher R indicates a greater proportion of recoverable strain in asphalt, reflecting better elasticity. At a load level of 0.1 kPa, SEA had the highest R, reaching 79.5%, while PU+3 had the lowest R, at 54%. At a load level of 3.2 kPa, SEA’s R was 37.9%, and PU+6’s R was 37.7%. The R values of SEA and PU+6 were similar, with a difference of only 0.53%. PU+3 had the lowest R, at 20%, while PU+9 had a slightly higher R, at 21.9%.
Despite SEA’s weaker deformation resistance, its high elasticity resulted in a larger proportion of recoverable deformation, reflecting a lower strain value in the creep recovery curve than PU+3 and PU+9. Fluorescence microscopy experiments indicated that SBS polymers crosslinked in a network form in SEA had a better ability to recover from deformation and exhibited better elasticity. PU+6 also showed good elasticity and deformation recovery ability, consistent with previous findings where PU+6 exhibited the smallest phase angle.
Figure 16 shows the unrecoverable creep compliance ( J n r ) of the four types of asphalt under load levels of 0.1 kPa and 3.2 kPa. J n r reflects the magnitude of irreversible deformation under a certain load, indicating the material’s resistance to permanent deformation. Asphalt with lower J n r values have stronger resistance to permanent deformation. At both load levels of 0.1 kPa and 3.2 kPa, PU+3 exhibited the highest J n r , while PU+6 exhibited the lowest J n r .
The results showed that PU+6 had the best deformation resistance among the tested asphalts, as it demonstrated the lowest strain and J n r values, along with a relatively high recovery percentage. PU+3 and PU+9, while showing good performance in some areas, generally had higher strain and J n r values, indicating weaker deformation resistance than PU+6 and SEA. This was further confirmed by fluorescence microscopy experiments, which showed that SBS and PU+ polymers in PU+6 were densely distributed in small-particle form, enhancing both shear resistance and deformation recovery abilities, leading to superior deformation resistance and rutting resistance.

3.6. Surface Free Energy Analysis

3.6.1. Experimental Data and Cohesive Energy Analysis

The contact angle data between asphalt and reagents obtained from the experiment are shown in Table 4.
The surface energy parameters of the aggregates used in the experiment are shown in Table 5.
The surface energy parameters of the evaporated residue of composite-modified emulsified asphalt were calculated and are shown in Table 6.
From Table 6, it can be seen that the surface energy parameters of modified emulsified asphalt are mainly non-polar components ( γ L W ), with γ L W much larger than γ A B , indicating that modified emulsified asphalt is a substance dominated by non-polar intermolecular forces, which is consistent with the basic chemical properties of asphalt. From Table 5, it can be seen that the surface energy components of the aggregate are mainly polar alkali components ( γ ), which is different from asphalt with non-polar components ( γ L W ). At the same time, the total surface energy of the aggregate is above 100 mJ/m2, which is consistent with the test results obtained from relevant literature, indicating that the aggregate is a material with high surface energy.
The cohesive energies of four types of composite-modified emulsified asphalt were calculated and shown in Figure 17.
From the graph, it can be seen that at 20 °C, the cohesive energy of the three dosages of PU+ was increased compared to that of SEA. Among them, PU+6 had the highest cohesive energy, with a value of 40.903 mJ/m2, which is 13.15% higher than that of SEA. The SBS polymer crosslinked in a network form in SEA exhibited the worst anti-fracture ability. With the addition of PU+, the anti-fracture ability of asphalt gradually increased. However, the large-particle polymer formed by the crosslinking of SBS and PU+ in PU+9 did not show better cohesive energy than the small-particle SBS and PU+ polymer, indicating its weaker anti-fracture ability. PU+6 exhibited the best fracture resistance.
The cohesive energy results are consistent with the previously discussed performance metrics. The small-particle SBS and PU+ polymer structure in PU+6 not only enhanced its shear and deformation resistance but also significantly improved its fracture resistance. This highlights the effectiveness of the small particle distribution in optimizing the mechanical properties of the asphalt mixture.

3.6.2. Analysis of Adhesion Energy and Compatibility Indicators

The fundamental cause of water damage in asphalt mixtures is the separation of the asphalt film from the aggregate caused by moisture. During this process, the adhesion energy ( Δ G w e t a ) between aggregate and asphalt in the presence of water is usually negative, indicating that water will spontaneously cause asphalt to peel off the surface of the aggregate.
Some researchers suggest using the indicator E R 1 to reflect the water stability of asphalt mixtures. The calculation equation for ER1 is shown in Equation (9). When ER1 is greater than 1, the adhesion energy between asphalt and aggregate in the absence of water is greater than that in the presence of water, indicating better water damage resistance. When ER1 equals 1, it serves as a threshold for evaluating the water sensitivity of asphalt mixtures. The larger the compatibility index, the better the water damage resistance of the asphalt mixture.
Additionally, for a given aggregate surface, asphalt with higher wettability will have better adhesion energy, which is related to the cohesive energy of asphalt and aggregate. The larger the difference ( Δ G d r y a Δ G d r y c ) between them, the stronger the wettability of asphalt. This can be represented by the index ER2, and the calculation method is shown in Equation (10). A higher ER2 value indicates stronger water damage resistance of the mixture.
Figure 18 shows the adhesion energy between four types of asphalt and aggregate. Whether for diabase or limestone, the adhesion energy of the three dosages of PU+ was significantly higher than that of SEA. Among them, PU+3 had the highest adhesion energy, slightly higher than that of PU+6, and PU+6 had a slightly higher adhesion energy than PU+9. For both diabase and limestone, the adhesion energy of PU+3 was increased by 11.49% compared to that of SEA. Additionally, for both diabase and limestone, the adhesion energy of PU+3 was increased by 0.77% compared to that of PU+6 and by 2.12% compared to that of PU+9. This indicates that the addition of PU+ significantly improves the adhesion performance between asphalt and aggregate.
Figure 19 and Figure 20 show the compatibility indicators ER1 and ER2 of four types of asphalt, respectively. For the same aggregate, the ER1 and ER2 of the four types of asphalt exhibited the following patterns:
  • For diabase:
    SEA had the highest ER1 and ER2 among the four types;
    PU+9 had the lowest ER1 and ER2 among the four types;
    PU+6 had the highest ER1 and ER2 among the three dosages of PU+.
  • For limestone:
    SEA had the highest ER1 and ER2 among the four types;
    PU+3 had the lowest ER1 and ER2 among the four types;
    PU+6 had the highest ER1 and ER2 among the three dosages of PU+.
SEA exhibited the best water stability, and the addition of the waterborne polymer PU+ reduced the water stability of asphalt and decreases its resistance to water damage. Among the PU+-modified asphalts, PU+6 showed superior water damage resistance compared to PU+3 and PU+9.

3.7. Fourier Transform Infrared Spectroscopy Analysis

In the FTIR testing of asphalt, solution samples were prepared by dissolving asphalt in carbon tetrachloride and spotting the solution onto KBr disks to form a thin film. After solvent evaporation, a uniform asphalt film was obtained, with the film thickness maintained at about 30 μm. Thin transmission samples can lead to insufficient absorbance, while too thick a film can cause light saturation absorption, making it impossible to obtain spectra.
As shown in Figure 21, the significant absorption peaks of the four types of asphalt are located at 2919 cm−1 and 2850 cm−1, attributed to the C-H symmetric and antisymmetric tensile vibrations of -CH, -CH3, and -CH2 in cycloalkanes and alkanes, respectively. The absorption peaks at 1455 cm−1 and 1373 cm−1 are attributable to the stretching vibration of nitro (-NO2) groups. Comparing and analyzing the spectral curves of three different dosages of PU+ and SEA, the Fourier transform infrared spectra show similar peaks and wave curves, with no significant changes in the position of characteristic absorption peaks and transmittance. This indicates that PU+ did not undergo a chemical reaction with SBS-modified emulsified asphalt during the experimental process, meaning no new chemical bonds or functional groups were generated. Therefore, the addition of modifiers and the preparation of composite emulsified asphalt were primarily a physical mixing process.

3.8. Fluorescence Microscopy Analysis

Figure 22, Figure 23, Figure 24 and Figure 25 show the distribution and crosslinking structure of the modifier in the evaporation residue of four types of modified asphalt. In these images, the black part represents asphalt, the green fluorescent part represents the SBS polymer, and the blue fluorescent part represents the PU+ polymer.
For SEA, the SBS polymer was uniformly distributed as a larger polymer network within the asphalt. Due to the shear effect of stirring during the preparation process, the SBS polymer in PU+3, which originally existed as a network crosslinking structure, transformed into particle form, with most particles being small and more densely distributed. Due to the low content of PU+, there was no obvious blue fluorescent area in PU+3.
In PU+6, the SBS polymer also transformed into particle form due to the shear effect during stirring, but the distribution was less dense than in PU+3. Additionally, small particles of PU+ polymer emitting blue fluorescence appeared in PU+6.
For PU+9, an interesting phenomenon emerged where a portion of the SBS polymer crosslinked with the PU+ polymer to form a new large-particle polymer. This newly formed polymer emitted blue–green fluorescence and did not disperse into smaller particles as PU+3 and PU+6 do when subjected to shear during stirring. This indicates a stronger ability to resist shear failure.

4. Conclusions

This study explores the feasibility of further modifying SBS-modified emulsified asphalt with cationic waterborne polyurethane. The following conclusions are drawn:
  • Physical Mixing: The preparation method of mechanical stirring after mixing did not result in any chemical changes between cationic waterborne polyurethane and SBS-modified emulsified asphalt, indicating that the process involves only physical mixing.
  • Enhanced Shear Modulus and Rutting Coefficient: Experimental results show that the addition of cationic waterborne polyurethane improves the complex shear modulus and rutting coefficient of SBS-modified emulsified asphalt. However, MSCR tests reveal that the addition of cationic waterborne polyurethane may reduce the elastic recovery performance of modified asphalt, thereby weakening its resistance to rutting. Among the samples, the modified asphalt with a PU+ content of 6% exhibited good high-temperature shear resistance and elastic recovery performance, demonstrating the best anti-rutting performance.
  • Improved Fatigue Performance: LAS test results indicate that the addition of cationic waterborne polyurethane can enhance the fatigue performance of modified asphalt.
  • Cohesive Energy and Adhesion: Surface free energy tests show that the addition of cationic waterborne polyurethane improves the cohesive energy and adhesion performance of modified asphalt. However, it also somewhat weakens the water damage resistance of the modified emulsified asphalt.
  • Modification Potential and Future Research: In summary, cationic waterborne polyurethane shows good modification potential for SBS-modified emulsified asphalt.

Author Contributions

Conceptualization, R.C.; formal analysis, W.X.; methodology, W.X.; investigation, R.C. and Y.C.; writing—original draft preparation, R.C. and Y.C.; writing—review and editing, R.C. and Y.C.; supervision, W.X.; project administration, W.X.; funding acquisition, W.X. All authors have read and agreed to the published version of the manuscript.

Funding

This research was supported by the Science and Technology Project of the Jiangxi Provincial Transportation Department (2023H0026).

Institutional Review Board Statement

Not applicable.

Informed Consent Statement

Not applicable.

Data Availability Statement

The original contributions presented in the study are included in the article, further inquiries can be directed to the corresponding author.

Conflicts of Interest

The authors declare no conflicts of interest.

References

  1. Lu, S.M.; Lu, C.; Tseng, K.T.; Chen, F.; Chen, C.L. Energy-saving potential of the industrial sector of Taiwan. Renew. Sustain. Energy Rev. 2013, 21, 674–683. [Google Scholar] [CrossRef]
  2. Ryms, M.; Denda, H.; Jaskuła, P. Thermal stabilization and permanent deformation resistance of LWA/PCM-modified asphalt road surfaces. Constr. Build. Mater. 2017, 142, 328–341. [Google Scholar] [CrossRef]
  3. Luo, X.; Gu, F.; Ling, M.; Lytton, R.L. Review of mechanistic-empirical modeling of top-down cracking in asphalt pavements. Constr. Build. Mater. 2018, 191, 1053–1070. [Google Scholar] [CrossRef]
  4. Kakar, M.R.; Hamzah, M.O.; Valentin, J. A review on moisture damages of hot and warm mix asphalt and related investigations. J. Clean. Prod. 2015, 99, 39–58. [Google Scholar] [CrossRef]
  5. Hu, X.; Lei, Y.; Wang, H.; Jiang, P.; Yang, X.; You, Z. Effect of tack coat dosage and temperature on the interface shear properties of asphalt layers bonded with emulsified asphalt binders. Constr. Build. Mater. 2017, 141, 86–93. [Google Scholar] [CrossRef]
  6. Gómez-Meijide, B.; Pérez, I. Binder–aggregate adhesion and resistance to permanent deformation of bitumen-emulsion-stabilized materials made with construction and demolition waste aggregates. J. Clean. Prod. 2016, 129, 125–133. [Google Scholar] [CrossRef]
  7. Tchoukov, P.; Czarnecki, J.; Dabros, T. Study of water-in-oil thin liquid films: Implications for the stability of petroleum emulsions. Colloids Surf. A Physicochem. Eng. Asp. 2010, 372, 15–21. [Google Scholar] [CrossRef]
  8. Grilli, A.; Graziani, A.; Bocci, M. Compactability and thermal sensitivity of cement–bitumen-treated materials. Road Mater. Pavement Des. 2012, 13, 599–617. [Google Scholar] [CrossRef]
  9. Fang, X.; Winnefeld, F.; Lura, P. Precipitation of anionic emulsifier with ordinary Portland cement. J. Colloid Interface Sci. 2016, 479, 98–105. [Google Scholar] [CrossRef]
  10. Sheng, X.; Wang, M.; Xu, T.; Chen, J. Preparation, properties and modification mechanism of polyurethane modified emulsified asphalt. Constr. Build. Mater. 2018, 189, 375–383. [Google Scholar] [CrossRef]
  11. Carrera, V.; Cuadri, A.A.; García-Morales, M.; Partal, P. The development of polyurethane modified bitumen emulsions for cold mix applications. Mater. Struct. 2015, 48, 3407–3414. [Google Scholar] [CrossRef]
  12. Xiang, Q.; Xiao, F. Applications of epoxy materials in pavement engineering. Constr. Build. Mater. 2020, 235, 117529. [Google Scholar] [CrossRef]
  13. Liu, J.; Zhang, Y. Effect of ethylene-acrylic acid copolymer on flame retardancy and properties of LLDPE/EAA/MH composites. Polym. Degrad. Stab. 2011, 96, 2215–2220. [Google Scholar] [CrossRef]
  14. Scaffaro, R.; La Mantia, F.P.; Canfora, L.; Polacco, G.; Filippi, S.; Magagnini, P. Reactive compatibilization of PA6/LDPE blends with an ethylene–acrylic acid copolymer and a low molar mass bis-oxazoline. Polymer 2003, 44, 6951–6957. [Google Scholar] [CrossRef]
  15. Yuan, X.; Zhu, B.; Cai, X.; Liu, J.; Qiao, K.; Yu, J. Improved interfacial adhesion in carbon fiber/epoxy composites through a waterborne epoxy resin sizing agent. J. Appl. Polym. Sci. 2017, 134, 199. [Google Scholar] [CrossRef]
  16. Zhang, Z.; Huang, Y.; Liao, B.; Cong, G. Studies on particle size of waterborne emulsions derived from epoxy resin. Eur. Polym. J. 2001, 37, 1207–1211. [Google Scholar] [CrossRef]
  17. Behnood, A.; Gharehveran, M.M. Morphology, rheology, and physical properties of polymer-modified asphalt binders. Eur. Polym. J. 2019, 112, 766–791. [Google Scholar] [CrossRef]
  18. Hsieh, T.H.; Kinloch, A.J.; Masania, K.; Taylor, A.C.; Sprenger, S. The mechanisms and mechanics of the toughening of epoxy polymers modified with silica nanoparticles. Polymer 2010, 51, 6284–6294. [Google Scholar] [CrossRef]
  19. Roselli, S.N.; Romagnoli, R.; Deyá, C. The anti-corrosion performance of water-borne paints in long term tests. Prog. Org. Coat. 2017, 109, 172–178. [Google Scholar] [CrossRef]
  20. Zamanian, M.; Mortezaei, M.; Salehnia, B.; Jam, J.E. Fracture toughness of epoxy polymer modified with nanosilica particles: Particle size effect. Eng. Fract. Mech. 2013, 97, 193–206. [Google Scholar] [CrossRef]
  21. Fu, H.; Wang, C.; Niu, L.; Yang, G.; Liu, L. Composition optimisation and performance evaluation of waterborne epoxy resin emulsified asphalt tack coat binder for pavement. Int. J. Pavement Eng. 2022, 23, 4034–4048. [Google Scholar] [CrossRef]
  22. Liu, F.; Zheng, M.; Liu, X.; Ding, X.; Wang, F.; Wang, Q. Performance evaluation of waterborne epoxy resin-SBR composite modified emulsified asphalt fog seal. Constr. Build. Mater. 2021, 301, 124106. [Google Scholar] [CrossRef]
  23. Xu, P.; Wang, Y.; Cheng, P.; Cong, P.; Li, D.; Zhang, Z.; Hui, J.; Ye, M. Toughness modification of waterborne epoxy emulsified asphalt by waterborne polyurethane elastomer. Constr. Build. Mater. 2023, 386, 131547. [Google Scholar] [CrossRef]
  24. Xu, L.; Li, X.; Zong, Q.; Xiao, F. Chemical, morphological and rheological investigations of SBR/SBS modified asphalt emulsions with waterborne acrylate and polyurethane. Constr. Build. Mater. 2021, 272, 121972. [Google Scholar] [CrossRef]
  25. Xu, G.; Wang, H.; Zhu, H. Rheological properties and anti-aging performance of asphalt binder modified with wood lignin. Constr. Build. Mater. 2017, 151, 801–808. [Google Scholar] [CrossRef]
  26. Ameri, M.; Nowbakht, S.; Molayem, M.; Mirabimoghaddam, M.H. A study on fatigue modeling of hot mix asphalt mixtures based on the viscoelastic continuum damage properties of asphalt binder. Constr. Build. Mater. 2016, 106, 243–252. [Google Scholar] [CrossRef]
  27. Park, S.W.; Kim, Y.R.; Schapery, R.A. A viscoelastic continuum damage model and its application to uniaxial behavior of asphalt concrete. Mech. Mater. 1996, 24, 241–255. [Google Scholar] [CrossRef]
  28. Sun, Y.; Wang, W.; Chen, J. Investigating impacts of warm-mix asphalt technologies and high reclaimed asphalt pavement binder content on rutting and fatigue performance of asphalt binder through MSCR and LAS tests. J. Clean. Prod. 2019, 219, 879–893. [Google Scholar] [CrossRef]
  29. Schapery, R.A. Correspondence principles and a generalized J integral for large deformation and fracture analysis of viscoelastic media. Int. J. Fract. 1984, 25, 195–223. [Google Scholar] [CrossRef]
  30. Bhasin, A.; Little, D.N. Application of Microcalorimeter to Characterize Adhesion between Asphalt Binders and Aggregates. J. Mater. Civ. Eng. 2009, 21, 235–243. [Google Scholar] [CrossRef]
  31. Transportation Research Board and National Academies of Sciences, Engineering, and Medicine. Final Report for NCHRP RRD 316: Using Surface Energy Measurements to Select Materials for Asphalt Pavement; The National Academies Press: Washington, DC, USA, 2007. [Google Scholar] [CrossRef]
  32. Xu, W.; Luo, R. Evaluation of interaction between emulsified asphalt and mineral powder using rheology. Constr. Build. Mater. 2022, 318, 125990. [Google Scholar] [CrossRef]
  33. Duan, S.C.; Cui, J.X.; Hu, J.Y.; Han, T.; Chen, Y.; Wang, H.Y.; Ma, T. Research on the adhesion mechanism and compatibility of acrylate composite polyurethane binder-aggregate based on surface free energy theory. Constr. Build. Mater. 2024, 438, 137236. [Google Scholar] [CrossRef]
  34. Bhasin, A.; Little, D.N. Characterization of Aggregate Surface Energy Using the Universal Sorption Device. J. Mater. Civ. Eng. 2007, 19, 634–641. [Google Scholar] [CrossRef]
  35. Singh, D.; Ashish, P.K.; Kataware, A.; Habal, A. Evaluating performance of PPA-and-Elvaloy-modified binder containing WMA additives and lime using MSCR and LAS tests. Mater. Civ. Eng. 2017, 29, 04017064. [Google Scholar] [CrossRef]
Figure 1. Technical roadmap.
Applsci 14 07288 g001
Figure 2. Softening points and ductility of four types of asphalt (5 °C).
Applsci 14 07288 g002
Figure 3. Complex shear moduli of four types of asphalt at 10–30 °C.
Applsci 14 07288 g003
Figure 4. Complex shear moduli of four types of asphalt at 50–70 °C.
Applsci 14 07288 g004
Figure 5. Rutting factors of four types of asphalt at 10–30 °C.
Applsci 14 07288 g005
Figure 6. Rutting factors of four types of asphalt at 50–70 °C.
Applsci 14 07288 g006
Figure 7. Phase angles of four types of asphalt at 10–30 °C.
Applsci 14 07288 g007
Figure 8. Phase angles of four types of asphalt at 50–70 °C.
Applsci 14 07288 g008
Figure 9. Main curves of complex shear modulus for four types of asphalt.
Applsci 14 07288 g009
Figure 10. Main curves of phase angle for four types of asphalt.
Applsci 14 07288 g010
Figure 11. Stress–strain curves of four types of asphalt.
Applsci 14 07288 g011
Figure 12. DCC curves of four types of asphalt.
Applsci 14 07288 g012
Figure 13. Fatigue life curves of four types of asphalt.
Applsci 14 07288 g013
Figure 14. Strain curves of four types of asphalt.
Applsci 14 07288 g014
Figure 15. Recovery percentages of four types of asphalt under 0.1 kPa and 3.2 kPa loads.
Applsci 14 07288 g015
Figure 16. Unrecoverable creep compliance of four types of asphalt under 0.1 kPa and 3.2 kPa loads.
Applsci 14 07288 g016
Figure 17. Cohesive energy of four types of asphalt at 20 °C.
Applsci 14 07288 g017
Figure 18. Adhesion energies of four types of asphalt with diabase and limestone.
Applsci 14 07288 g018
Figure 19. Matching indicators of four types of asphalt with diabase and limestone ER1.
Applsci 14 07288 g019
Figure 20. Compatibility index ER2 of four types of asphalt with diabase and limestone.
Applsci 14 07288 g020
Figure 21. Infrared spectra of four types of asphalt.
Applsci 14 07288 g021
Figure 22. SEA fluorescence microscope image.
Applsci 14 07288 g022
Figure 23. PU+3 fluorescence microscope image.
Applsci 14 07288 g023
Figure 24. PU+6 fluorescence microscope image.
Applsci 14 07288 g024
Figure 25. PU+9 fluorescence microscope image.
Applsci 14 07288 g025
Table 1. Basic properties of SBS modified emulsified asphalt.
Test ProjectUnitTest ValueTest Method
The residue on the sieve (1.18)%0.06T0652
Charge/CationicT0653
Engler viscosity (25 °C)/5.8T0622
Evaporation residue content%65T0651
Storage stability (1 d)%0.5T0655
Storage stability (5 d)%1.5T0655
Evaporation residuePenetration (25 °C)0.1 mm60T0604
Soft point (glycerol)°C72T0606
Ductilitycm66T0605
Table 2. Basic properties of PU+.
Test ProjectUnitPU+
Appearance/Transparent, high glossiness
Solid content%30 ± 1
pH/2.0–6.0
ViscositymPa·s/
Densityg/cm3/
Storage stabilityMonths<6
Table 3. Reagent names and surface energy parameters.
ReagentDensity (g/cm3)Surface Energy Parameter (mJ/m2)
γ L W γ A B γ + γ γ
Distilled water1.00021.80051.00025.50025.50072.800
Formamide1.13439.00019.0002.28039.60058.000
Glycerol1.26134.00030.0003.92057.40064.000
Table 4. Advance contact angles (°) of four types of asphalt with various reagents.
Temperature (°C)AsphaltReagent
FormamideGlycerolDistilled Water
20SEA83.8689.0188.35
PU+382.3988.6083.97
PU+683.3289.4683.54
PU+983.5389.7688.79
Table 5. Aggregate surface energy parameters.
AggregateSurface Energy Parameter (mJ/m2)
γ L W γ A B γ + γ γ
diabase63.8251.063.02216.88114.88
limestone143.221.9030.0023393.68145.12
Table 6. Asphalt surface energy parameters.
AsphaltSurface Energy Parameter (mJ/m2)
γ L W γ A B γ + γ γ
SEA15.4952.5800.14411.54018.075
PU+319.2600.7840.01016.05020.044
PU+618.9661.4860.03217.39520.452
PU+918.4680.4380.00411.03418.906
Disclaimer/Publisher’s Note: The statements, opinions and data contained in all publications are solely those of the individual author(s) and contributor(s) and not of MDPI and/or the editor(s). MDPI and/or the editor(s) disclaim responsibility for any injury to people or property resulting from any ideas, methods, instructions or products referred to in the content.

