Article

Experimentally Aided Operational Virtual Prototyping to Predict Best Clamping Conditions for Face Milling of Large-Size Structures

by
Krzysztof J. Kaliński
,
Marek A. Galewski
*,
Michał R. Mazur
and
Natalia Stawicka-Morawska
Faculty of Mechanical Engineering and Ship Technology, Gdansk University of Technology, 80-233 Gdansk, Poland
*
Author to whom correspondence should be addressed.
Appl. Sci. 2024, 14(16), 7346; https://doi.org/10.3390/app14167346
Submission received: 19 July 2024 / Revised: 10 August 2024 / Accepted: 13 August 2024 / Published: 20 August 2024
(This article belongs to the Special Issue Vibration Problems in Engineering Science)

Abstract

:

Featured Application

Prediction and selection of the clamping conditions of large-size workpieces for the purpose of milling, based on modal tests and milling simulations.

Abstract

Vibrations occurring during milling operations are one of the main issues disturbing the pursuit of better efficiency of milling operations and product quality. Even in the case of a stable cutting process, vibration reduction is still an important goal. One of the possible solutions to obtain it is selection of the favorable conditions for clamping the workpiece to the machine table. In this paper, a method for predicting and selecting the clamping condition of a large-size workpiece for the reduction in vibrations during milling is presented. A modal test of the workpiece is performed first for a selected set of tightening screw settings. Next, one milling pass is performed to obtain reference data which are then used to tune the hybrid computational model. In the subsequent step, milling simulations are performed for a set of tightening variants, and the best one is selected, providing the lowest vibrations, assessed as the root mean square (RMS) of vibration displacements. In this paper, the description of the clamping selection procedure, key elements of the simulation model, and simulation and experimental results obtained for the milling of the test workpiece performed for a set of different clamping conditions are provided. The proposed method accurately predicts not only the best but also the worst clamping conditions.

1. Introduction

During milling operations, the relative vibrations of the tool and the workpiece are the main issues limiting milling efficiency, accuracy, and quality [1,2]. The level of vibrations depends on various factors such as, for example, workpiece material, tool parameters (e.g., length, diameter, cutting insert geometry, and tool wear), milling process parameters (e.g., cutting speed, feed speed, and depth of cutting), dynamic properties of the tool, the milling center and the workpiece, workpiece clamping conditions (which also affect workpiece dynamic properties), and many more [3,4,5].
In the literature, in the context of vibrations occurring during milling, usually self-excited chatter vibrations are recognized as the most significant issue, so various authors concentrate on the development of chatter detection, reduction, and avoidance methods. Some recent, interesting, in-depth reviews on this topic [6,7,8,9] show a large variety of techniques applied to solve the challenges raised by chatter vibration occurrence. However, focusing merely on the self-excited vibrations may lead to the depreciation of other dynamic phenomena such as, for example, forced vibrations [10,11]. Thus, the chatter phenomenon should not be treated as the sole challenge for the development of vibration suppression methods [10]. Of course, chatter must be eliminated, but even in the case of a stable cutting process, vibration reduction is still an important goal [12]. It is also worth noting that most of the methods proposed for milling vibration reduction are developed and tested on rather small details machined in standard CNC centers. Meanwhile, machine tools used for milling large-sized objects and the related process characteristics differ significantly from the conventional ones [10]. This additionally justifies that the dedicated solutions should take into account not only the dynamic properties of the system (represented by its identified poles) but also the harmonic frequencies of time-varying non-stationary excited vibrations of the whole tool–workpiece system [10,13]. The convolution of modal vibration (associated with poles), usually having relatively low frequencies with vibration excited by rotating tools, also plays a significant role [14]. Additionally, due to high costs and low availability of large machining centers for scientific experiments, there is a gap in the development of vibration reduction techniques for milling large workpieces. This applies especially to simple and cheap methods that could be easily implemented in industrial practice.
In this context, an interesting group of possible solutions for vibration reduction are methods dealing with workpiece clamping to the machine table. Some of them concentrate on the design of clamping elements such as, for example, a system of bilateral supports for machining large aircraft engine components [15] or a modular system for flexible clamping of large workpieces [16]. Others, however, try to minimize geometric errors or milling vibrations by optimizing the layout of passive fixtures using, for example, a table with clamping elements acting from the sides on the workpiece and a matrix of supports from the bottom with the actual selection of active (attached to the workpiece) supports optimized using the Genetic Algorithm [17], selection of the supports’ positions for a geometrically complex object (engine block) for surface quality improvement [18], selection of the supports’ positions to increase the static fixture stiffness using various Machine Learning algorithms [19], and optimization of the supports’ positions to minimize deformations of large ship elements using a modified direct stiffness method and improved Particle Swarm Optimization [20]. An interesting set of examples of active and passive methods and devices, mostly for milling thin-walled elements for the aeronautic industry, is included in [21]. Also, in [22], a review of various approaches for fastening thin-walled objects, including large-size ones, is presented. Unfortunately, many of the methods discussed in the literature are supported only by simulations and are not verified by experimental research, especially if they concern large workpieces.
Many of the fixture optimization methods rely on simulations of the workpiece deformations and vibrations or simulations of the milling process, which is why some of them are based on modeling the milling process dynamics along with the physics of elements of the machine–tool–workpiece system [6]. Methods that take into account the dynamic properties of the tool and/or workpiece (for example, in order to tune the Finite Element Method (FEM) model or to determine the dominant frequencies of normal vibration) require the identification of these properties through experimental or operational modal analysis [23]. Because the number of sensors used in experiments is always limited, in some applications, there occurs the problem of how to determine the properties of the model for every point of the machined workpiece without performing a large number of modal tests. One proposed solution to this issue is to interpolate normal modes or modal shapes for positions between the points where they have been identified. Such methods are used, for example, in civil engineering to detect structural damage [24,25] or to optimize the location of sensors used for modal tests in order to minimize errors of modal shape reconstruction and increase the resolution of the FEM mesh [26].
The literature review unveils that there are various developments in preventing geometrical errors (deformations) of the clamped large-size workpieces, but the vibration reduction problem is of less interest. Although a lot of progress has been made in terms of fixture design optimization, proposed methods still have some important limits preventing its wider applications [27]. From this perspective, fixture optimization techniques should be a promising area of research because there is usually no need to modify machine tools nor to involve numerous, sophisticated, and expensive measurement and control equipment. However, the latter does not concern active fixtures or active workpiece support devices.
The problem of searching for optimal conditions for mounting large-sized workpieces on the machine table, while simultaneously ensuring the necessary repeatability of tightening the clamping screws, has been of interest to the authors in recent years. For this purpose, the following was proposed:
-
Estimation of the minimum work of cutting forces in the direction of the cut layer width, using only the experimentally determined frequency response function (FRF) of the workpiece [28];
-
Application of the experimentally determined FRF of the workpiece and simulated plots of nominal cutting forces [29].
In both cases, however, the impact of dynamic changes in the geometry of the cut layer was omitted, which significantly simplified the considerations.
As shown earlier in [30], only computational model simulations of the entire large-size machining process, including the flexible workpiece, the cutting tool, and the dynamics of the cutting process, taking into account the complex vibration state, are reasonable means leading to an effective solution in order to search for the best implementation conditions. However, the previously developed method of Experimentally Aided Operational Virtual Prototyping (EAOVP) has now been significantly improved. And so the following is ascertained:
-
To create a modal model of the workpiece, frequency response functions (FRFs) were determined at excitations in the vicinity of all accelerometers installed along the machined surface.
-
The influence of spindle speed on the dynamic properties of the rotating tool was taken into account. The above results in the fact that, unlike a non-rotating system (mainly characterized by double natural frequency and decoupled modes in two mutually perpendicular planes), now we observe two different frequencies and the corresponding coupled modes of natural vibrations.
-
The assessment of compliance with the computational model of the machining process was made based on the root mean square (RMS) assessment in the most dangerous central zone of the surface, instead of the previously averaged RMS values from all accelerometers.
The motivation for the presented research was to develop a reliable method for predicting and selecting the best clamping conditions during the face milling of large-size structures. The new procedure presented in this paper is based on the modified EAOVP procedure, which was successfully applied in an earlier version to select the optimal spindle speed [30]. The paper includes a description of the new EAOVP procedure, modified for the selection of clamping, key elements of the simulation model, the data and results of the simulation and experimental research, and a description of the time-consuming nature of the method implementation, as well as a discussion of the results and conclusions.

2. Description of the Proposed Method

2.1. Experimentally Aided Operational Virtual Prototyping

The procedure of Experimentally Aided Operational Virtual Prototyping (EAOVP) was described in detail in [30]. However, in [30], this technique was applied for the selection of the best spindle speed for vibration reduction. In this paper, it will be applied to predict and select the best workpiece clamping conditions; thus, some modifications are needed in the procedure (Figure 1). The steps of the modified procedure are as follows:
  • Clamping the workpiece on the machine table with tightening screws set for nominal, standard conditions.
  • Performance of the Experimental Modal Analysis for identifying β = 1 , ,   m o d natural frequencies f β e , dimensionless damping coefficients ζ β e , and the vectors of normal modes ψ β e of the workpiece along the desired tool path. Excitations are applied near each sensor placed on the machined surface.
  • Selection of the dominant natural frequencies and calculation of the interpolated modal shapes along the workpiece according to the planned tool path.
  • Preparation of a hybrid model of the milling process based on the modal model of the machined surface.
  • Determination of the cutting process parameters kdl, μl2, and μl3 (their meaning will be explained in Section 2.2.1) for further simulations, based on the assessment of the compliance of the computational model with the nominal clamping conditions of the workpiece.
  • Selection of the set of the considered clamping conditions.
  • For each of the clamping conditions selected in step 6, the implementation of steps 2, 3, and 4, as well as the simulation of the milling process with the cutting parameters determined in step 5.
  • Selection of the best clamping condition based on the evaluation of RMS values of the simulated relative tool–workpiece displacements.
  • Performance of the real milling process with the selected best clamping condition and resulting evaluation.

2.2. Simulation Model

2.2.1. Cutting Process Dynamics

In order to select the best clamping conditions, simulations of the face milling process are performed. In the considered case, the workpiece is not perfectly rigid, and the tool is a multi-edge milling cutter. The dynamics of the milling process is analyzed using the model (Figure 2) and assumptions described in [30]. The most important of them are as follows:
-
The tool rotates at spindle speed n and the workpiece moves at feed speed vf.
-
Only the tool (modeled as the Rigid Finite Element (RFE) and tool holder (connected with the tool by Spring Damping Element (SDE)) and the workpiece are modeled. Other elements of the milling machine and process dynamics are neglected [1,30].
-
The dynamic properties of the workpiece are taken into account.
-
The proportional and delayed feedback interactions caused by current and previous passes of the cutting edge along the cut layer are included so the effects of internal and external modulation of the layer thickness are accommodated [31].
-
In the conventional contact points of the tool edges with the workpiece, coupling elements (CEs) are located that model the dynamics of the cutting process [31]. The positions of CEs relative to the workpiece change over time as the tool rotates at speed n. The actual position of the cutter edge no. l is described by the immersion angle φl = φl(t). It corresponds to the temporary position of CE no. l. Edges having, at a given time, contact with materials that are called “active”.
Other symbols included in Figure 2 are as follows:
-
γ0—rake angle and α0—clearance angle as elements of the cutting edge geometry,
-
κr—cutting edge angle, and in the presented case, κr = 90°,
-
ap—depth of cutting,
-
Fyl1,Fyl2,Fyl3—forces acting in the direction of, respectively, the nominal cutting speed vc, the cutting layer thickness hl, and current depth of cutting apl,
-
D—tool diameter and milling widths B1 and B2,
-
local rotating coordinate system xr1, xr2, xr3 of the RFE,
-
conventional point S of the tool—workpiece contact [28,30,31] and the non-rotating coordinate system x1, x2, x3 for this point, which moves linearly with respect to the workpiece.
For the temporary point of tool edge—workpiece contact—modeled as CE no. l, a proportional model of the dynamics of the cutting process was adopted [30,31]:
F y l 1 t = k d l a p l t h l t , h l t > 0 a p l t > 0 , 0 , h l t 0 a p l t 0 ,
F y l 2 t = μ l 2 k d l a p l t h l t , h l t > 0 a p l t > 0 , 0 , h l t 0 a p l t 0 ,
F y l 3 t = μ l 3 k d l a p l t h l t , h l t > 0 a p l t > 0 , 0 , h l t 0 a p l t 0 ,
where
a p l t = a p Δ a p l t ,
h l t = h D l t Δ h l t + Δ h l t τ l ,
ap—desired cutting depth,
Δapl(t)—dynamic change in cutting depth for CE no. l,
hDl(t)—desired cutting layer thickness for CE no. l; hDl(t) ≅ fz sin κr cosφl(t),
Δhl(.)—dynamic change in cutting layer thickness for CE no. l,
kdl—average dynamic specific cutting pressure for CE no. l,
μl2, μl3—cutting force ratios for CE no. l, as quotients of forces Fyl2 and Fyl1, and forces Fyl3 and Fyl1,
τl—time delay between the same position of CE no. l and of CE no. l–1,
fz—feed per tooth; fz = vf/(nz),
z—number of milling cutter teeth.
This model also takes into account the effects of the internal and external modulation of the layer thickness and handles the situation when the cutting edge loses contact with the workpiece material.
It is worth noting here that the interaction of the tool and the workpiece may also result in a ploughing force. Unlike cutting force, it does not remove a layer of material but causes local plasticizing. It results from the nose radius rt of assuming a perfectly sharp cutting edge, and in a simplified mathematical description, its value is proportional to the width of the cut layer. However, in the considerations presented in the article, the following arguments led to the of the dynamic model of the cutting process.
  • The influence of the ploughing force is significant when hDl < rt [32]. In the case of inserts of unblunt milling tools, the rt value does not exceed 10 μm, which in the case of the experiment in question (fz = 0.115 mm) causes hDl = fz cos(φl) > rt in the range of (−85°; +85°), so in almost the entire range of possible immersion angles 〈−90°; +90°〉.
  • The ploughing force is important, especially in light of possible non-linearities, at low cutting speeds [33]. In the present experiment, at n = 1300 rpm and D = 44 mm, vc values are estimated to be close to 200 m/min, which fully justifies the omission of the ploughing force.
  • The mentioned plasticizing effect makes the proportionality coefficient necessary to determine the ploughing force problematic and even difficult to estimate, especially in real production conditions.
Due to the above, the authors decided on a more practical approach based on a proportional mechanistic model (in Equations (1)–(3), there is a minimum number of only 3 parameters: kdl, μl2, and μl3) and its validation with the actual machining process by comparing RMS values observed in the time domain during the real and simulated process. Although these three parameters do not have a direct physical interpretation, their accurately adjusted values during the simulation confirm the compliance of the adopted model of the face milling process.
The description of the cutting forces for CE no. l in a 6-DOF space takes the following form [30]:
F l t = F l 0 t D P l t Δ w l t + D O l t Δ w l t τ l ,
where
F l t = c o l ( F y l 1 t , F y l 2 t , F y l 3 t , 0 ,   0 ,   0 ) ,
F l 0 t = c o l ( k d l a p h D l t , μ l 2 k d l a p h D l t , μ l 3 k d l a p h D l t ,   0 ,   0 ,   0 ) ,
D P l t = 0 k d l a p Δ a p l t k d l h D l t 0 μ l 2 k d l a p Δ a p l t μ l 2 k d l h D l t 0 μ l 3 k d l a p Δ a p l t μ l 3 k d l h D l t 0 3 × 3 0 3 × 3 0 3 × 3 ,
D O l t = 0 k d l a p Δ a p l t 0 0 μ l 2 k d l a p Δ a p l t 0 0 μ l 3 k d l a p Δ a p l t 0 0 3 × 3 0 3 × 3 0 3 × 3 ,
Δ w l t = c o l ( q z l t , h l t , a p l t , 0 ,   0 ,   0 ) ,
Δ w l t τ l = c o l ( q z l t τ l , h l t τ l , a p l t τ l , 0 ,   0 ,   0 ) ,
and q z l t —relative displacement of edge tip and workpiece along direction yl1 at instant of time t, and q z l t τ l —relative displacement of edge tip and workpiece along direction yl1 at instant of time tτl.
Relationships (9) and (10) take into consideration the non-linearity being an effect of the dynamic change in the depth of cutting.

2.2.2. Hybrid Model of the Milling Process

The dynamics of the milling process is modeled as a hybrid system (Figure 2) which consists of the modal and structural subsystems connected by coupling elements. The modal subsystem represents a flexible workpiece moving with the feed speed vf. It is described by the vector of its modal coordinates a. Parameters of the modal model are identified during experimental modal tests. For a finite, selected number of normal modes mod, the dynamic properties are defined by the following [30]:
Ω = diag(ω0i)—matrix of angular natural frequencies of the modal subsystem; i = 1, …, mod. Its square is also called the stiffness modal matrix;
Ψ = Ψ 1 Ψ m o d —matrix of the considered mass-normalized normal modes of the modal subsystem; i = 1, …, mod;
Z = d i a g ζ i —matrix of dimensionless damping coefficients (also called modal damping) of the modal subsystem; i = 1, …, mod.
The structural subsystem represents a rotating milling tool. Its behavior is described by the vector of generalized displacements q, in a local Cartesian coordinate system, xr1, xr2, xr3 of the RFE, and subsequently, these displacements are transformed to the immovable coordinate system x1, x2, x3. The movable coordinate system rotates together with the milling tool. Thus dynamic properties of the structural subsystem are defined by inertia M, damping L, stiffness K matrices [30], and additionally, matrices dependent on the effect of the tool rotation, i.e., L ^ r and K ^ r [31] The above results in the fact that the first double natural frequency  f 0  of decoupled transverse vibrations of the non-rotating system will be replaced by two natural frequencies f 01 ,   02 = f 0 ± n 60 , corresponding to the coupled modes of vibrations. The way to define matrices L ^ r and K ^ r , in the case of RFE no. r, is described in Appendix A.
The matrix equation of the dynamics of the non-stationary hybrid model of the milling process in hybrid coordinates is described as follows:
M 0 0 I ξ ¨ + L + L ^ r L ^ r T 0 0 2 Z Ω ξ ˙ + K K ^ r + l = 1 i l T l T D P l ( t ) T l l = 1 i l T l T D P l ( t ) W l ( t ) l = 1 i l W l T ( t ) D P l ( t ) T l Ω 2 + l = 1 i l W l T ( t ) D P l ( t ) W l ( t ) ξ = l = 1 i l T l T F l 0 t + T l T D O l ( t ) w ( t τ l ) l = 1 i l W l T t F l 0 t W l T ( t ) D O l ( t ) w ( t τ l ) ,
where
ξ = q a   —vector of hybrid coordinates of the hybrid system,
Tl—transformation matrix of displacement vector q from the xr1, xr2, xr3 coordinates of the RFE, to the coordinate system yl1, yl2, yl3 of CE no. l [30],
Wl(t)—transformation matrix between the displacement vector in modal coordinates a and displacements in the coordinate system yl1, yl2, yl3 of CE no. l [30],
il—number of “active” CEs.
Equation (13) is used for time domain simulations of the cutting process. When the tool (structural subsystem) and the workpiece (modal subsystem) are in contact with each other, this hybrid model becomes non-stationary and time-varying due to tool rotation, causing a continuous change in the geometric position of the instantaneous contacts of the tool edge with the workpiece. However, contrary to the previous considerations [30], due to the invariance of the position of CE no. l in relation to the rotating system xr1, xr2, xr3 of the RFE, this time the matrix Tl has constant components. The latter significantly reduces the required simulation time. To simulate the hybrid model of the cutting process of the workpiece in accordance with the planned tool path, a computer with the proprietary AMIKRO4 software version 4, developed in FORTRAN using the free MSYS2 MinGW 64-bit toolset, and the free GNU compiler, were used. The results were analyzed using the MATLAB 2017 and 2022 (MathWorks, Natick, MA, USA) package.
To identify the modal model of the flexible workpiece, the matrix of normal modes Ψ, dimensionless damping coefficients Z, and angular natural frequencies Ω of the modal subsystem must be determined. By isolating the modal subsystem, the model size is significantly reduced to a few essential modes. These modes remain unchanged during machining, allowing for identification through Experimental Modal Analysis (EMA) on the workpiece installed on the milling machine table. It must be noted, that in the case of large or complex workpieces, different dominant vibration modes can be observed in various zones of the milled surface. Thus, it is needed to perform EMA for a set of points distributed on the structure, especially on the machined surface. The dominant modes may be identified based on the frequency response function (FRF) and a chosen modal identification method.

2.2.3. Normal Mode Interpolation

During milling, the tool moves along the workpiece, moving through successive areas where different vibration modes dominate. Thanks to modal analysis, according to the EAOVP procedure, the modal properties of the workpiece are known. However, they are identified only for areas close to the accelerometers’ locations. For the purposes of simulation using hybrid models, it is needed to provide modal parameters for each simulation point. This means that for points between the known positions of sparsely distributed sensors, normal modes must also be determined. To solve this problem, it is proposed to adapt the technique of linear interpolation of normal modes clearly described in [30]. For a position lying between locations where normal mode no. i, i = 1 ,   , m o d , has been identified (i.e., between the sensor positions for which a FRF has been calculated), the appropriate value of this normal mode component is calculated by the following formula (Figure 3):
Ψ i ξ t = Ψ i j + ξ   t ξ j ξ j + 1 ξ j Ψ i , j + 1 Ψ i j .
This means that in (13), the matrix of transformation W l t becomes not only time- but also position-dependent and takes the following form:
W l t , ξ t = Θ l t 3 × 3 0 3 × 3 0 3 × 3 Θ l t 3 × 3 C W Ψ ^ ξ t ,
where
Θ l t = cos φ l sin φ l 0 sin φ l cos φ l 0 0 0 1
Here, there is a matrix of directional cosines between the axes yl1, yl2, yl3 of CE no. l and the axes of immovable coordinate system x1, x2, x3 (Figure 2).
C W = c o l 0 ,   0 ,   1 ,   0 ,   0 ,   0 ,
Ψ ^ ξ t = Ψ 1 j + ξ t ξ j ξ j + 1 ξ j Ψ 1 , j + 1 Ψ 1 j Ψ i j + ξ t ξ j ξ j + 1 ξ j Ψ i , j + 1 Ψ i j Ψ m o d , j + ξ t ξ j ξ j + 1 ξ j Ψ m o d , j + 1 Ψ m o d , j T .
Using the same approach, extrapolation is also possible for points beyond the outermost sensor positions.
In order to obtain an interpolated modal model along the workpiece in accordance with the planned tool path, the original proprietary software written in C was used, as well as the commercial FEGRAPH version 14 package (vMACH Engineering GmbH, Markt Indersdorf, Germany).

2.3. Method Summary

The improved EAOVP method meets the serious need to simulate computational models of the entire large-size machining process, including the flexible workpiece, cutting tool, and cutting process dynamics, as well as taking into account the complex vibration state. This method, compared to previous elaborations, has now been significantly improved. The above concerns the following:
-
Creating a modal model of the workpiece by determining the FRF with excitations in the vicinity of all accelerometers installed along the machined surface;
-
Taking into account the influence of spindle speed on the dynamic properties of the rotating tool. Unlike the non-rotating system (characterized by double natural frequency and decoupled modes in two mutually perpendicular planes), two different frequencies and the corresponding coupled natural modes are observed now;
-
Assessment of compliance of the computational model of the machining process based on the root mean square (RMS) in the most dangerous zone of the central surface, and not previously averaged RMS values for the entire milling pass.
This modified method provides a new quality in the simulation of a non-stationary model of the hybrid milling process because it definitely guarantees better accuracy in predicting the best clamping conditions for large-sized workpieces.

3. Results

3.1. The Workpiece and Milling Process Setup for the Experimental Research

The workpiece selected for experimental research had external dimensions of 2092 × 1116 × 540 mm and was made of STW22 03M steel (Figure 4). The mechanical properties of this type of steel are [34]: yield strength Rp0.2 = 170–360 MPa, tensile strength Rm = 440 MPa, and elongation A = 22–28%. Its chemical composition is up to 0.12% of C, up to 0.6% of Mn, up to 0.045% of P, and up to 0.045% of S. The workpiece was clamped on a table of the MIKROMAT 20V (VEB Mikromat, Dresden, Germany) portal machining center. Despite very similar geometry and physical properties, the tested workpiece was different from the one described in [28,30]. Moreover, the supporting structure’s scheme (number of secondary supports and their positions) has been different as well. In Figure 4, only the adjustable screws are indicated. The remaining 10 supports of the workpiece were not marked to maintain the clarity of the figure. The tightening torques of those secondary supports were not changed during experiments.
Although the tested workpiece is not a typical thin-walled element, its dominant forms of natural vibrations with frequencies in the 100–500 Hz band are observed in the vicinity of the surface to be processed in the face milling process. Moreover, the method of mounting it on the machine table using mounting screws that cause different values of the tightening torques of these screws results in a change in the parameters of the modal model of the workpiece, in various, but repeatable, mounting variants. The above, combined with the unchanged model of cutting process dynamics, has a significant impact on the level of tool–workpiece vibrations in the face milling process.
For the milled surface (length 2092 mm, width 58 mm), full face milling was performed from left to right (i.e., from the side of accelerometer A1 to A5). The milling tool was Sandvik R390-044C4-11M060 (Sandvik AB, Stockholm, Sweden) having a diameter of ϕ44 mm, with four indexable inserts, R390-11 T3 08M-PM 1130 having a corner radius of 0.8 mm, a helix angle of the main cutting edge of 12°, and a cutting edge angle of κr = 90°. For all of the passes, spindle speed was set to n = 1300 rpm and feed speed was vf = 600 mm/min. The nominal cutting depth was ap = 1 mm. Such a significant value of the tool’s rotational speed actually justifies the advisability of taking into account the influence of the spinning effect on the dynamic properties of the structural subsystem.
The measurement points were distributed along the milled surface on the inner side of the workpiece. Five IEPE DJB A/120/V 75g (DJB Instruments, Suffolk, UK) accelerometers were used. For impact modal tests, the PCB 086C03 (PCB Piezotronics Inc., Depew, NY, USA) modal hammer was used. The sampling frequency for all signals was 10 kHz. Signals were acquired using a real-time NI (National Instruments, Austin, TX, USA) PXI 8861 controller with PXI 4496 dynamic signal acquisition card running proprietary developed measurement and analysis software in NI LabView RT environment.
At first, the fastening screws were screwed with a torque of 90 Nm. This setting, which was a standard according to the normal manufacturing scheme of the production company for this workpiece, was later treated as a reference for selecting simulation parameters and, later, for the evaluation of the simulations and milling experiments. For this setting, modal tests for each sensor location were carried out, and later, the milling process was performed. Then, after each modal test for a different screw setting, milling operations were performed in order to compare its results with simulations to evaluate the method. In practical application, only modal tests for different screw settings are needed to acquire data (modal parameters) for the simulation model, and no milling must be performed except one milling operation for a nominal clamping setting.

3.2. Experimental Modal Analysis

In order to determine the dominant natural vibration frequencies for different fixing conditions and to select the best one, modal tests were performed for different support configurations. A total of five tightening torque tests (50…130 Nm) of the fastening screws (I–IV) were carried out. For a selected setting, all screws were tightened with the same torque measured by a dynamometric spanner. Frequency response functions (Figure 5) were obtained for each setting and for each accelerometer mounting point no. j (Figure 3). Excitation (impact) was applied near each sensor. Thus, in the case of the selected support configuration, the FRF for point A1 was obtained with the excitation applied close to A1, for point A2—with the excitation applied close to A2, and so on (Figure 4). This reproduces milling conditions, as during real milling, the main source of workpiece excitation is cutting forces occurring in the actual location of the tool, which moves along the workpiece as the process advances. For identification, a polyreference Least Squares Complex Frequency Domain (p-LSCFD) method ([31,35]) was used, and six dominant natural frequencies in a range up to 500 Hz and modal damping coefficients were identified (Table 1).

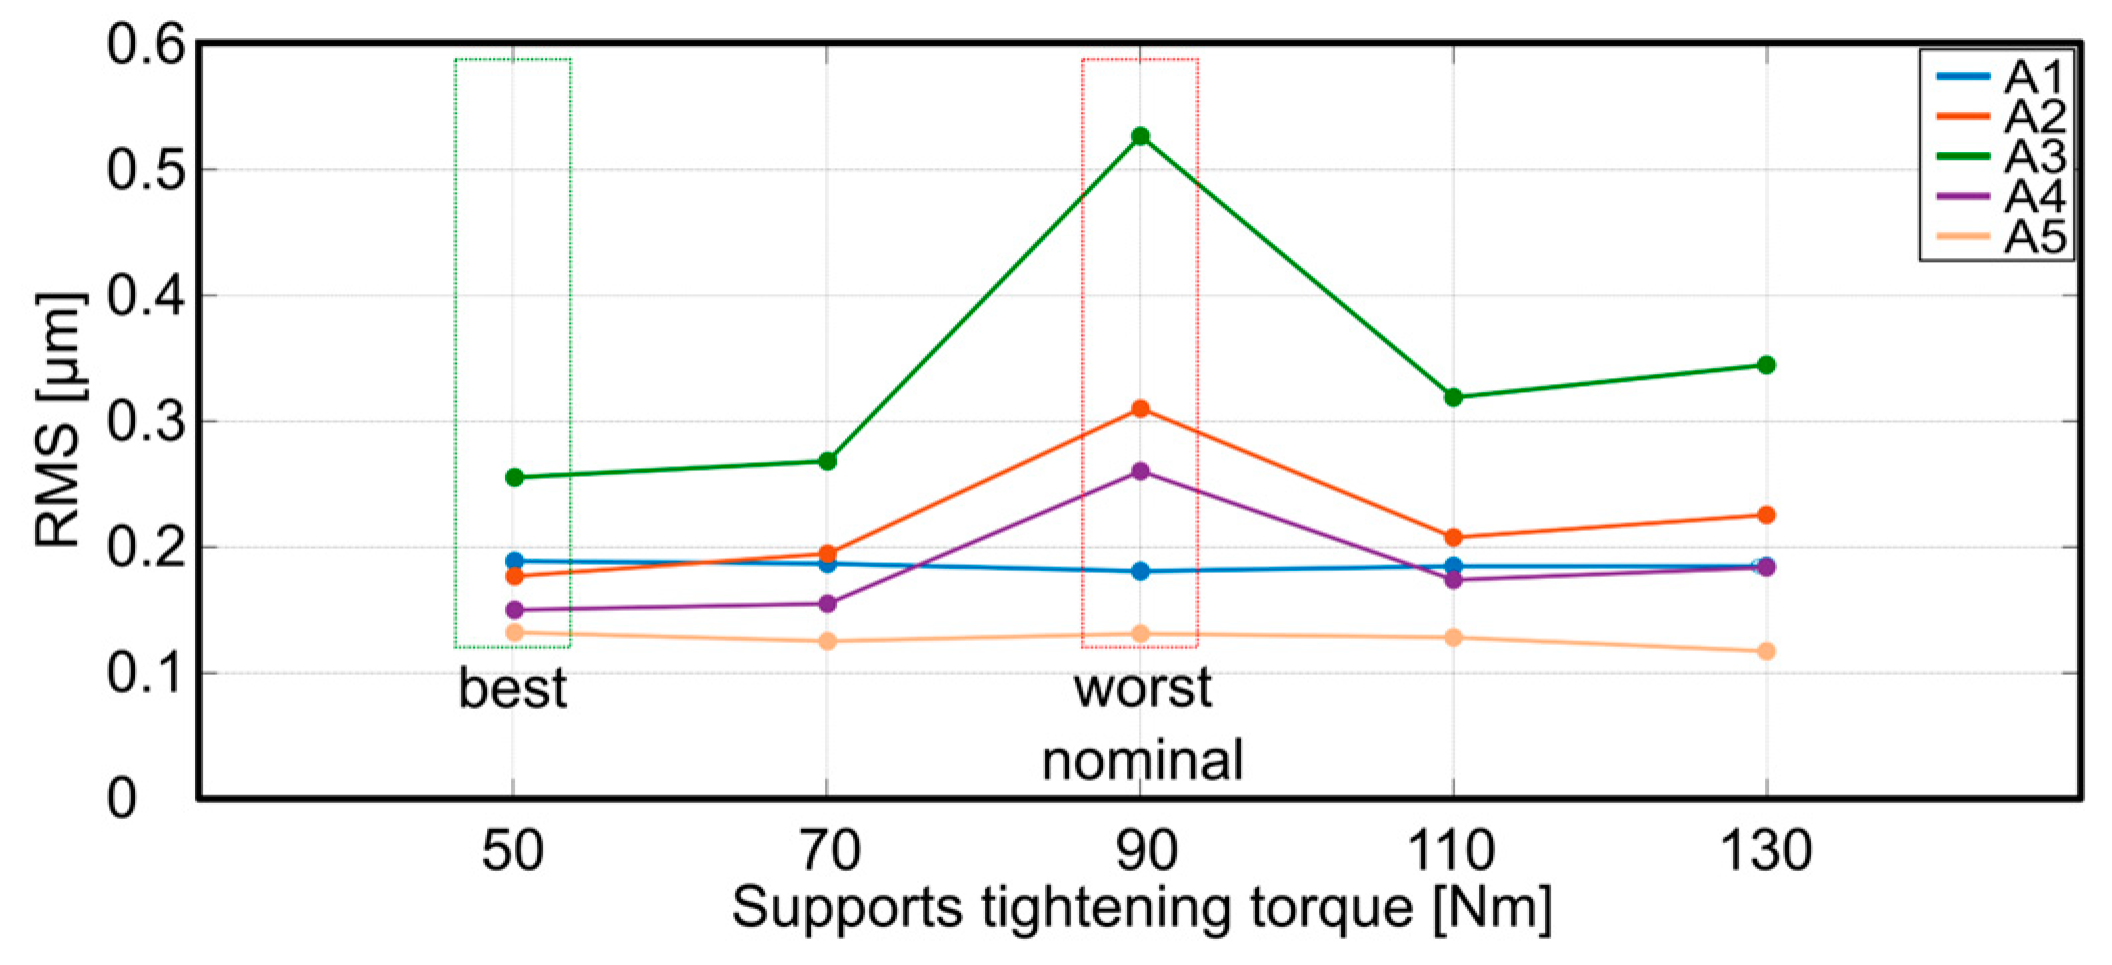
3.3. Clamping Screw Tightening Torque Selection

In order to prepare a hybrid simulation model, for the purpose of clamping screw tightening torque selection, the parameters of this model must be determined. It is achieved by performing simulations for a nominal clamping condition and searching for the set of parameters kdl, μl2, and μl3 that provide a good agreement between simulation and real cutting results, which is to say, a similar level of vibration expressed as the RMS of displacements. For the presented experimental case, such compliance was achieved for kdl = 5800 N/mm2, μl2 = 0.4, and μl3 = 0.66.
At the nominal clamping condition, the screw tightening torque of 90 Nm was selected. Next, using these parameters, a series of simulations for screw settings of 50, 70, 110, and 130 Nm were performed. For each setting, the appropriate dominant natural frequencies, modal damping coefficients (Table 1), and accompanying normal modes identified by EMA were applied in the simulation model for the selected settings. The results of the simulations are presented in Figure 6 and Figure 7 and Table 2. The RMS relative vibration displacements between the tool and the workpiece for point S are calculated for selected time intervals. The selection will be justified and explained in the next section of the paper.
According to the EAOVP procedure, simulation results should allow for the selection of the best clamping condition for vibration reduction. The results predict that setting the clamping screws with the torque of 50 Nm should result in the lowest vibration during milling, and setting them with the torque of 70, 90, or 110 Nm should result in a high level of vibration. For the selected workpiece, vibration in its middle part is the highest; thus, it is most important to reduce vibrations in this part. Taking this into account, it is apparent that a setting of 90 Nm should be treated as the worst, and 50 Nm as the best one.

3.4. Experimental Milling Result

The most important goal of the EAOVP method is to accurately predict the best clamping conditions for a workpiece, based on the observation of its behavior during standard clamping (Figure 1). Nevertheless, to further demonstrate the advantages of the proposed method, the experimental results for other clamping cases are also presented.
For the workpiece described earlier in Section 3.1, the full face milling of the selected surface was performed, and vibration acceleration was measured in five points (Figure 4b). The acquired signals were later converted to displacements by its double integration. A high-pass ideal filter (cut-off frequency set to 25 Hz) was applied to remove bias and low-frequency trends from the signal. The experimental results for three selected clamping conditions are presented in Figure 8. However, Table 3 and Figure 9 present the RMS values of vibration displacements in the surroundings of individual accelerometers, for all variants of clamping the workpiece.
It must be underlined that the RMS values for simulations and experiments are not direct equivalents. During simulations, vibration displacements are calculated for point S, along the x3 direction (Figure 2). This point moves during milling with the tool, so that data regarding the actual position of the tool center are obtained at each time step. Meanwhile, during the real milling experiments, vibrations are measured by sensors placed at the workpiece in fixed positions. The tool passes over these positions. In order to make the results of the simulation and experiments comparable, only 20 s fragments of the signals around the sensor positions were used for RMS calculations for both simulation and experimental data. These time intervals are marked with yellow lines in Figure 6 and Figure 8. For example, a simulation time interval of 20–40 s approximately corresponds to the position of sensor A1 during real milling. A time interval of 45–65 corresponds to the position of sensor A2 and so on.

3.5. Time Consumption of the EAOVP Method Implemented in Practice

In order to estimate the time consumption resulting from the implementation of the EAOVP method, the relevant production standards of technological times were applied [36]. So let us analyze again the process of face milling of the surface of the large workpiece on the MIKROMAT 20V portal machining center, where one pass (i.e., full milling) is performed along the examined surface (see Section 3.1). The times needed to complete the individual steps should be determined in accordance with the diagram presented earlier (Figure 1). However, it should be emphasized that the routine processing of a specific product is based on measuring equipment integrated at the implementation site and does not require taking into account the time of a previously prepared simulation program. And so, the steps are as follows:
-
Step 1—Clamping the workpiece on the machine table with tightening screws set for standard conditions (i.e., 90 Nm), and requires 1 min.
-
Step 2—Performance of the Experimental Modal Analysis for identifying six natural frequencies, dimensionless damping coefficients, and accompanying vectors of normal modes of the workpiece along the desired tool path, and requires 5 min.
-
Step 3—Obtaining an interpolated modal model along the workpiece according to the planned tool path, using a laptop equipped with an Intel Core i7-6700HQ 2.60 GHz processor and 32 GB RAM (Intel, Santa Clara, CA, USA), and requires 15 min.
-
Step 4—Preparing a hybrid model of the milling process based on the modal model of the machined surface does not require time. The appropriate computational model and simulation program have already been prepared.
-
Step 5—Determination of the cutting process parameters kdl, μl2, and μl3 for further simulations, based on the assessment of the compliance of the computational model with the actual behavior of the workpiece in nominal clamping conditions (i.e., 90 Nm), and requires one actual milling (main time 3.5 min) plus one vibration measurement (5 min) and performance of max. five simulations. Using a laptop similar to step 3, each simulation takes 2.5 min for a total of 3.5 + 5 + 5 × 2.5 = 21 min.
-
Step 6—Selecting a set of mounting conditions to consider does not require time.
-
Step 7—For the four clamping conditions selected in step 6, implementing steps 1, 2, 3, and 4 and simulating the milling process with the cutting parameters specified in step 5 requires 4 x (1 min + 5 min + 15 min + 2.5 min) = 94 min.
-
Step 8—Selecting the best clamping condition based on the evaluation of the RMS value of the relative tool–workpiece displacements takes only 1 min.
-
Step 9—Performing the actual milling process with the best clamping conditions selected requires 3.5 min (main time of one milling pass), and the result evaluation requires 5 min.
As a result, we obtain a total time consumption resulting from the implementation of the EAOVP method of about 150 min.
In the case of standard machining, without implementing the EAOVP method, the full milling pass would have to be repeated six times (for each clamping condition), and the only source of knowledge would be the measurement of vibrations during each pass. Based on the measuring equipment already integrated on site, the standard time consumption would be 6 × (main time of 1 milling pass 3.5 min + clamping condition adjustment 1 min + vibration measurement 5 min) = approx. 60 min.

4. Discussion

The experimental results show that clamping the workpiece with the screw’s tightening torque set to 50 Nm provides the best results from the point of view of vibration level reduction. At the same time, for the case when screws were tightened with a torque of 90 Nm, the vibration level was the highest. This means that the proposed method is able to accurately predict both the best and the worst clamping conditions. This is especially true for the middle part of the workpiece. For the external zones of the workpiece, the results are only apparently inconsistent. For zones around sensors A1 and A5, vibration levels are very similar for each screw setting. For A1, the relative difference between the mean value and the RMS results for each screw setting is less than 2%, and for A5, it is less than 6%. For comparison, in the middle of the workpiece, for sensor A3, it is 35%. This means that for external workpiece zones vibration levels are eventually almost the same for any clamping screw settings. This confirms that in the case of the considered workpiece, it is important to focus on reducing vibrations in its middle part. Reduction in the vibrations in external zones is less important.
Comparison of the calculated times shows that the implementation of the EAOVP method results in approximately 2.5 times greater time consumption, with respect to standard processing. For this reason, it may seem unattractive from the point of view of its application. However, it should be remembered that standard machining requires a much larger number (six) of actual milling passes, usually impossible due to the limited machining allowance. The EAOVP method significantly reduces this number of passes only to two, i.e., the standard and the best one. Drastically reducing the number of passes during machining significantly limits the wear of cutting tools and reduces the amount of material removed.

5. Conclusions

The considerations presented in the article showed that the proposed EAOVP method correctly predicts not only the best but also the worst clamping conditions for the considered workpiece. The above was confirmed by a comparison of RMS values simulated and measured during the actual milling process.
Apart from the obtained results, there are two important advantages of the method. Firstly, during simulation, it is not necessary to create a model of the workpiece in the Finite Element Method convention, which shortens the time needed to prepare data for simulation. Secondly, to perform Experimental Modal Analysis in its minimal version, only a modal hammer, one accelerometer, and a two-channel data acquisition card would be necessary which significantly reduces the costs of measurement equipment, especially compared to methods requiring full modal identification and tuning of the FEM model of the entire processed object.
The disadvantage of the proposed method is the need to prepare a hybrid computational model and software simulating the milling process. Despite the unquestionable solid scientific and technical fundamentals, this is not an easy workshop method, and its implementation is quite time-consuming. It requires special substantive preparation as well as advanced professional knowledge and practical skills. Nevertheless, the key feature of the method is the precise prediction of the best and at the same time the worst, variant of clamping the workpiece on the machine table.

Author Contributions

Conceptualization, K.J.K.; methodology, K.J.K.; software, K.J.K., M.A.G. and M.R.M.; investigation, K.J.K., M.A.G., M.R.M. and N.S.-M.; data curation, M.A.G. and M.R.M.; writing—original draft preparation, K.J.K. and M.A.G.; writing—review and editing, K.J.K. and M.A.G.; visualization, M.A.G.; supervision, K.J.K. All authors have read and agreed to the published version of the manuscript.

Funding

This research received no external funding.

Institutional Review Board Statement

Not applicable.

Informed Consent Statement

Not applicable.

Data Availability Statement

The data presented in this study are available upon reasonable request from the corresponding author.

Acknowledgments

Experimental investigations on the MIKROMAT 20V portal machining center were performed thanks to cooperation with the PHS HYDROTOR Inc. in Tuchola, Poland.

Conflicts of Interest

The authors declare no conflicts of interest.

Appendix A

1. The matrix of gyroscopic effects of RFE nr r, whose Cartesian coordinate axes xr1, xr2, xr3 are central principal axes of inertia:
L ^ r = m 1 0 0 0 1 0 0 0 1 0 x r 3 x r 2 x r 3 0 x r 1 x r 2   x r 1 0 0 ω 0 ω 0 0 0 0 0 1 0 0 0 x r 3 x r 2 0 1 0 x r 3 0 x r 1 0 0 1 x r 2 x r 1 0 d m = ω m 0 1 0 x r 3 0 x r 1 1 0 0 0 x r 3 x r 2 0 0 0 0 0 0 x r 3 0 0 0 x r 3 2 x r 2 x r 3 0 x r 3 0 x r 3 2 0 x r 1 x r 3 x r 1 x r 2 0 x r 3 x r 1 x r 3 0 d m = ω   0 m 0 S 12 0 S 23 m 0 0 0 S 12 S 13 0 0 0 0 0 0 S 12 0 0 0 J 12 D 23 0 S 12 0 J 12 0 D 13 S 23 S 13 0 D 23 D 13 0 = S 12 = S 23 = S 13 = 0 D 13 = D 23 = 0 ω   0 m 0 0 0 0 m 0 0 0 0 0 0 0 0 0 0 0 0 0 0 0 J 12 0 0 0 0 J 12 0 0 0 0 0 0 0 0 ,
where m —mass of the RFE,   S 12 —static moment of inertia with respect to the plane x r 1 x r 2 of the RFE,   S 13 —static moment of inertia with respect to the plane x r 1 x r 3 of the RFE,   S 23 —static moment of inertia with respect to the plane x r 2 x r 3 of the RFE,   J 12 —mass moment of inertia with respect to the plane x r 1 x r 2 of the RFE,   D 13 —deviation moment of inertia with respect to the plane x r 1 x r 3 of the RFE,   D 23 —deviation moment of inertia with respect to the plane x r 2 x r 3 of the RFE, and ω —angular velocity around the xr3 axis of the RFE.
2. The matrix dependent on the square of angular velocities of RFE nr r, whose Cartesian coordinate axes xr1, xr2, xr3 are the central principal axes of inertia:
K ^ r = m 1 0 0 0 1 0 0 0 1 0 x r 3 x r 2 x r 3 0 x r 1 x r 2   x r 1 0 ω 2 0 0 0 ω 2 0 0 0 0 1 0 0 0 1 0 0 0 1 0 x r 3 x r 2 x r 3 0 x r 1 x r 2 x r 1 0 d m = ω 2 m 1 0 0 0 x r 3 x r 2 0 1 0 x r 3 0 x r 1 0 0 0 0 0 0 0 x r 3 0 x r 3 2 0 x r 1 x r 3 x r 3 0 0 0 x r 3 2 x r 2 x r 3 x r 2 x r 1 0 x r 1 x r 3 x r 2 x r 3 x r 1 2 + x r 2 2 d m = ω 2   m 0 0 0 S 12 S 13 0 m 0 S 12 0 S 23 0 0 0 0 0 0 0 S 12 0 J 12 0 D 13 S 12 0 0 0 J 12 D 23 S 13 S 23 0 D 13 D 23 J 3 = S 12 = S 23 = S 13 = 0 D 13 = D 23 = 0 ω 2   d i a g m , m , 0 ,   J 12 ,   J 12 ,   J 3 ,
where J 3 is the mass moment of inertia with respect to the x r 3 axis of the RFE.

References

  1. Fei, J.; Xu, F.; Lin, B.; Huang, T. State of the art in milling process of the flexible workpiece. Int. J. Adv. Manuf. Technol. 2020, 109, 1695–1725. [Google Scholar] [CrossRef]
  2. Hao, X.; Li, Y.; Zhao, Z.; Liu, C. Dynamic machining process planning incorporating in-process workpiece deformation data for large-size aircraft structural parts. Int. J. Comput. Integr. Manuf. 2019, 32, 136–147. [Google Scholar] [CrossRef]
  3. Xu, C.; Dou, J.; Chai, Y.; Li, H.; Shi, Z.; Xu, J. The relationships between cutting parameters, tool wear, cutting force and vibration. Adv. Mech. Eng. 2018, 1, 10. [Google Scholar] [CrossRef]
  4. Guo, M.; Ye, Y.; Jiang, X.; Wu, C. Comprehensive effect of multi-parameters on vibration in high-speed precision milling. Int. J. Adv. Manuf. Technol. 2020, 108, 2187–2195. [Google Scholar] [CrossRef]
  5. Attia, H.; Sadek, A.; Altintas, Y.; Matsubara, A.; Umbrello, D.; Wegener, K.; Eisseler, R.; Ducobu, F.; Ghadbeigi, H. Physics based models for characterization of machining performance—A critical review. CIRP J. Manuf. Sci. Technol. 2024, 51, 161–189. [Google Scholar] [CrossRef]
  6. Zhu, L.; Liu, C. Recent progress of chatter prediction, detection and suppression in milling. Mech. Syst. Signal Process. 2020, 143, 106840. [Google Scholar] [CrossRef]
  7. Wang, W.K.; Wan, M.; Zhang, W.H.; Yang, Y. Chatter detection methods in the machining processes: A review. J. Manuf. Process. 2022, 77, 240–259. [Google Scholar] [CrossRef]
  8. Basit, A.; Khan, N.B.; Ali, S.; Muhammad, R.; Abduvalieva, D.; Ijaz Khan, M.I.; Jameel, M. Chatter detection and suppression in machining processes: A comprehensive analysis. Int. J. Interact. Des. Manuf. 2024, 1–21. [Google Scholar] [CrossRef]
  9. Navarro-Devia, J.H.; Chen, Y.; Dao, D.V.; Li, H. Chatter detection in milling processes—A review on signal processing and condition classification. Int. J. Adv. Manuf. Technol. 2023, 125, 3943–3980. [Google Scholar] [CrossRef]
  10. Uriarte, L.; Zatarain, M.; Axinte, D.; Yague-Fabra, J.; Ihlenfeldt, S.; Eguia, J.; Olarra, A. Machine tools for large parts. CIRP Ann. Manuf. Technol. 2013, 62, 731–750. [Google Scholar] [CrossRef]
  11. Totis, G.; Insperger, T.; Sortino, M.; Stépán, G. Symmetry breaking in milling dynamics. Int. J. Mach. Tools Manuf. 2019, 139, 37–59. [Google Scholar] [CrossRef]
  12. Yan, B.; Hao, Y.; Zhu, L.; Liu, C. Towards high milling accuracy of turbine blades: A review. Mech. Syst. Signal Process. 2022, 170, 108727. [Google Scholar] [CrossRef]
  13. Urbikain, G.; Campa, F.-J.; Zulaika, J.-J.; López de Lacalle, L.-N.; Alonso, M.-A.; Collado, V. Preventing chatter vibrations in heavy-duty turning operations in large horizontal lathes. J. Sound Vib. 2015, 340, 317–330. [Google Scholar] [CrossRef]
  14. Wu, J.; Tang, X.; Peng, F.; Yan, R.; Xin, S. A novel mode coupling mechanism for predicting low-frequency chatter in robotic milling by providing a vibration feedback perspective. Mech. Syst. Signal Process. 2024, 216, 111424. [Google Scholar] [CrossRef]
  15. Zheng, Y.; Wu, D.; Wang, H.; Liang, J.; Liu, X. Machining fixture and deformation control of aero-engine thin-walled casing. Int. J. Adv. Manuf. Technol. 2023, 129, 5601–5614. [Google Scholar] [CrossRef]
  16. Möhring, H.-C.; Gessler, W.; König, A.; Nguyen, L.T.; Nguyen, Q.P. Modular intelligent fixture system for flexible clamping of large parts. J. Mach. Eng. 2017, 17, 29–39. [Google Scholar] [CrossRef]
  17. Liu, Y.; Guan, S.; Zhao, H.; Liu, W.; Duan, L.; Sha, T. Evolutionary Design of Machining Fixture Layout for Thin-Walled Structure. Math. Probl. Eng. 2022, 2022, 521696. [Google Scholar] [CrossRef]
  18. Li, G.; Du, S.; Huang, D.; Zhao, C.; Deng, Y. Elastic mechanics-based fixturing scheme optimization of variable stiffness structure workpieces for surface quality improvement. Precis. Eng. 2019, 56, 343–363. [Google Scholar] [CrossRef]
  19. Feng, Q.; Maier, W.; Stehle, T.; Möhring, H.-C. Optimization of a clamping concept based on machine learning. Prod. Eng. 2022, 16, 9–22. [Google Scholar] [CrossRef]
  20. Liu, C.; Zheng, Y.; Wang, J.; Jin, K.; Yu, J.; Li, J. Fixture layout optimization for large thin-walled parts based on improved particle swarm optimization algorithm. Int. J. Adv. Manuf. Technol. 2024, 132, 3579–3592. [Google Scholar] [CrossRef]
  21. Möhring, H.C.; Wiederkehr, P.; Gonzalo, O.; Kolar, P. Lecture Notes in Production Engineering: Intelligent Fixtures for the Manufacturing of Low Rigidity Components; Springer: Cham, Switzerland, 2018. [Google Scholar] [CrossRef]
  22. Wu, G.; Li, G.; Pan, W.; Raja, I.; Wang, X.; Ding, S. A state-of-art review on chatter and geometric errors in thin-wall machining processes. J. Manuf. Process. 2021, 68, 454–480. [Google Scholar] [CrossRef]
  23. Kaliński, K.J.; Galewski, M.A.; Mazur, M.R.; Morawska, N. A technique of experiment aided virtual prototyping to obtain the best spindle speed during face milling of large-size structures. Meccanica 2021, 56, 825–840. [Google Scholar] [CrossRef]
  24. Kao, C.-Y.; Chen, X.-Z.; Jan, C.J.; Hung, S.L. Locating damage to structures using incomplete measurements. J. Civ. Struct. Health Monit. 2016, 6, 817–838. [Google Scholar] [CrossRef]
  25. Jarosińska, M.; Berczyński, S. Changes in Frequency and Mode Shapes Due to Damage in Steel–Concrete Composite Beam. Materials 2021, 14, 6232. [Google Scholar] [CrossRef] [PubMed]
  26. Martarella de Souza Mello, F.; Pereira, J.L.J.; Gomes, G.F. Multi-objective sensor placement optimization in SHM systems with Kriging-based mode shape interpolation. J. Sound Vib. 2024, 568, 118050. [Google Scholar] [CrossRef]
  27. Müller, G.; Rödel, L.; Krebs, J. Automated Fixture Planning in Milling Processes: A Systematic Literature Review. In Proceedings of the 2023 IEEE International Conference on Industrial Engineering and Engineering Management (IEEM), Singapore, 18–21 December 2023. [Google Scholar] [CrossRef]
  28. Kaliński, K.J.; Stawicka-Morawska, N.; Galewski, M.A.; Mazur, M.R. A method of predicting the best conditions for large-size workpiece clamping to reduce vibration in the face milling process. Sci. Rep. 2021, 11, 20773. [Google Scholar] [CrossRef]
  29. Kaliński, K.J.; Galewski, M.A.; Stawicka-Morawska, N.; Jemielniak, K.; Mazur, M.R. The clamping selection method to reduce the vibration of large-size workpieces during the face milling process. Bull. Pol. Acad. Sci.—Tech. Sci. 2024, 72, e148840. [Google Scholar] [CrossRef]
  30. Kaliński, K.J.; Galewski, M.A.; Mazur, M.R.; Stawicka-Morawska, N. An Experimentally Aided Operational Virtual Prototyping to Obtain the Best Spindle Speed during Face Milling of Large-Size Structures. Materials 2021, 14, 6562. [Google Scholar] [CrossRef]
  31. Kaliński, K.J. A Surveillance of Dynamic Processes in Mechanical Systems; The Publication of Gdansk University of Technology: Gdansk, Poland, 2012. (In Polish) [Google Scholar]
  32. Yoon, H.S.; Ehmann, K.F. Dynamics and stability of micro-cutting operations. Int. J. Mech. Sci. 2016, 115–116, 81–92. [Google Scholar] [CrossRef]
  33. Altintas, Y.; Chan, P.K. In–process detection and suppression of chatter in milling. Int. J. Mach. Tools Manuf. 1992, 32, 329–347. [Google Scholar] [CrossRef]
  34. 10111:2008; Continuously Hot Rolled Low Carbon Steel Sheet and Strip For Cold Forming. Technical Delivery Conditions. European Standards: Plzen, Czech Republic, 2008.
  35. Heylen, W.; Lammens, S.; Sas, P. Modal Analysis Theory and Testing; KU Leuven: Leuven, Belgium, 2007. [Google Scholar]
  36. Feld, M. Fundamentals of Designing Technological Processes of Typical Machine Parts; The Scientific and Technical Publication: Warsaw, Poland, 2000. (In Polish) [Google Scholar]
Figure 1. A scheme of the EAOVP with linear interpolation of the vibration shapes for selecting the best clamping conditions.
Applsci 14 07346 g001
Figure 2. A scheme of a face milling of a flexible workpiece.
Applsci 14 07346 g002
Figure 3. Linear interpolation of the normal mode component Ψ i ξ .
Applsci 14 07346 g003
Figure 4. Tested workpiece shown: (a) clamped on the machine tool table and (b) as a simplified scheme with accelerometers (A1–A5) and adjustable fastening screw (I–IV) locations indicated.
Applsci 14 07346 g004
Figure 5. Workpiece amplitude gains of frequency response functions (FRFs) and coherences for screw tightening torques: (a) 50 Nm, (b) 70 Nm, (c) 90 Nm, (d) 110 Nm, and (e) 130 Nm.
Applsci 14 07346 g005
Figure 6. Simulated relative displacements between the tool and the workpiece for point S (Figure 2) during full milling for selected screw settings.
Applsci 14 07346 g006
Figure 7. The simulated RMS values of relative vibration displacements between the tool and the workpiece for point S (Figure 2).
Applsci 14 07346 g007
Figure 8. Workpiece displacements during full milling for screw setting: (a) 50 Nm, (b) 90 Nm, and (c) 130 Nm.
Applsci 14 07346 g008
Figure 9. The measured RMS values of vibration displacements in the surroundings of individual accelerometers during full milling of the surface for different clamping conditions.
Applsci 14 07346 g009
Table 1. Identified natural frequencies and modal damping coefficients.
Tightening Torque [Nm]Mode
123456
Frequency [Hz]50187.36230.91245.68324.68371.00423.41
Modal damping [%]1.663.042.911.571.481.35
Frequency [Hz]70186.71233.54249.81323.15374.03426.08
Modal damping [%]2.073.463.160.981.021.68
Frequency [Hz]90187.84234.70251.43323.75377.47422.26
Modal damping [%]1.553.852.551.981.162.79
Frequency [Hz]110187.80235.49255.49326.04377.99421.72
Modal damping [%]1.033.442.421.661.392.78
Frequency [Hz]130186.35235.96249.44325.23380.11423.88
Modal damping [%]2.264.172.920.761.162.35
In the EAOMA method, the computational model of the workpiece is created on the basis of modal tests of the real object. No other abstract computational model (e.g., the FEA model) is created that would require validation. Hence, the only way to assess the accuracy of the model of the workpiece itself is the coherence function, which determines the repeatability of individual modal tests, with identical conditions of mounting the workpiece and identical ways of excitation and recording of measurement signals. Such conditions have been met; modal model parameters were identified in the range where the coherence function was >0.9.
Table 2. The RMS values of relative vibration displacements between the tool and the workpiece for point S (Figure 2) for time intervals equivalent to the surroundings of individual accelerometers during full milling of the surface for different clamping conditions. The best results are shown in bold, and the worst results are underlined; * marks the case used as a criterion of compliance of the computational model.
Tightening Torque [Nm]Time Interval for RMS Calculation [s]
20–4045–6595–115145–165170–190
RMS   of   Displacements   [ μ m]
500.1560.1850.3610.2530.206
700.1930.2530.4900.3250.239
90 (nominal)0.1710.246* 0.5280.3460.228
1100.1860.2400.4690.3090.228
1300.1830.2310.4540.3070.232
Table 3. The measured RMS values of vibration displacements in the surroundings of individual accelerometers during full milling of the surface for different clamping conditions. The best results are shown in bold, and the worst results are underlined; * marks the case used as a criterion of compliance of the computational model.
Tightening Torque [Nm]Sensor
A1A2A3A4A5
RMS   of   Displacements   [ μ m]
500.1880.1760.2550.1490.131
700.1860.1940.2680.1540.124
900.1800.310* 0.5280.2600.130
1100.1840.2070.3190.1730.127
1300.1840.2250.3450.1830.116
Disclaimer/Publisher’s Note: The statements, opinions and data contained in all publications are solely those of the individual author(s) and contributor(s) and not of MDPI and/or the editor(s). MDPI and/or the editor(s) disclaim responsibility for any injury to people or property resulting from any ideas, methods, instructions or products referred to in the content.

