Article

Improved Simplified Engineering Fault Displacement Hazard Evaluation Method for On-Fault Sites

by
Tamás János Katona
Faculty of Engineering and Information Technology, University of Pécs, 7622 Pécs, Hungary
Appl. Sci. 2024, 14(18), 8399; https://doi.org/10.3390/app14188399
Submission received: 8 August 2024 / Revised: 14 September 2024 / Accepted: 15 September 2024 / Published: 18 September 2024
(This article belongs to the Special Issue New Challenges in Seismic Hazard Assessment)

Abstract

:
The safety of high-potential risk facilities concerned with fault displacement hazards is a complex technical issue, especially if the fault is revealed beneath the facility during the operation. Applying simple conservative engineering hazard evaluation methods is rational if an urgent decision should be made to continue operation or implement protective measures. Engineering methods are being published for strike-slip on-fault sites and structures. Their crucial point is to estimate the probability of the rupture at the site intersection and consider the displacement distribution over the rupture length relative to the site’s on-fault location. It is shown in the paper that strict geometrical relations between the site location, length and initial point of the rupture determine whether the principal fault displacement intersects the site. The paper considers these geometrical parameters as independent random variables and applies a screening of ruptures contributing to the hazard. Magnitude- and on-fault coordinate-dependent empirical relations have been analysed and selected to evaluate the site displacements. The procedure resulted in realistic but conservative hazard curves for different on-fault site locations using data from the Paks site in Hungary. The results were compared to those obtained by the conservative engineering method for the same site and some published analyses.

1. Introduction

Vulnerability and safety of critical infrastructure, such as long gas pipelines, bridges or high-potential risk facilities including nuclear power plants and dams, concerning fault displacement hazard is a significant engineering and design issue associated with high economic risks and enhanced social sensitivity. This is especially true if the susceptibility of fault displacement hazard is revealed during the operation of the hazardous facility. For example, cases are reported for the nuclear power plants in [1,2,3,4,5] and the dam in [6].
Different methods have been developed for evaluating hazards. These methods are rather case-oriented and correspond to the traditions and routines of industries.
In the case of pipeline design and safety evaluation, the state of the art is presented, for example, in [7,8,9]. Traditionally, the design practice is based on the simple deterministic approach to identifying the maximum considered earthquake and calculating the displacement using empirical scaling correlations. More recently, probabilistic fault displacement hazard analysis (PFDHA) has been proposed to account for the uncertainties in the expected magnitude of displacements, e.g., [7,10]. A similar approach was followed by the transport industry; see [11,12].
Regarding the state of the art, fault displacement hazard analysis has been published for four nuclear sites. While presenting methodologies and cases in nuclear practice, the history of investigations into potential sites for new facilities and operating plants should be considered. This will highlight the motivation for developing simple engineering fault displacement hazard methodologies.
Generally, the probabilistic approach is preferred in nuclear applications, since it provides hazard characterisation that complies with the definition of design basis and probabilistic evaluation of safety metrics. Unlike other industries, an essential feature of the nuclear practice is considering the hazard up to the very low annual exceedance frequencies of 10−4/a to 10−7/a.
Probabilistic fault displacement hazard analysis was first developed to assess hazards from numerous normal active faults that affect the site of the proposed repository for high-level nuclear wastes at Yucca Mountain, Nevada. A rather specific methodology has been applied to the Yucca-Mountain Project [13] to characterise fault displacement potential for PFDHA. This analysis was part of the most extensive Probabilistic Seismic Hazard Analysis (SSHAC Level 4; see in [14]), which began in 1994 and still is not considered as completed [15].
Another nuclear site investigation and fault displacement hazard evaluation case was the PFDHA study performed for the new plant at Krško, Slovenia [16,17].
Time pressure plays a much lesser role in the case of a site investigation for a new facility (especially for the repository) than in operating a potentially hazardous facility (nuclear power plants, dams or gas pipelines).
A well-documented and accessible probabilistic distributed fault displacement hazard study has been carried out for the Diablo Canyon Power Plant (DCPP) due to the identified 2008 Shoreline Fault [2]. The urgency of completing the hazard evaluation was related to safety issues and regulatory requirements but stimulated by the need to prolong the operational license. A tailor-made probabilistic method has been applied to select the characteristic earthquake based on the update of Probabilistic Seismic Hazard Analysis (PSHA).
Regarding the U.S. nuclear practice, a high-level American Nuclear Society document guides the investigation and evaluation of fault displacement hazards [18] and prefers probabilistic methods.
Like [18], high-level comprehensive guidance has been developed for the Japanese nuclear industry, including fault displacement hazard investigation, evaluation methods and plant responses [19]. Besides PFDHA, this document acknowledges the implementation of deterministic numerical simulation of fault rupture and rupture propagation. The papers [20,21,22] are examples of numerical rupture simulation, fragility evaluation and probabilistic safety analysis for fault displacement hazards.
The fault displacement hazard issue for the nuclear site and the related international and national requirements and guidelines for the hazard evaluation and safety assessment are reviewed by the experts of the International Atomic Energy Agency (IAEA) [23]. Recognising the lack of documented case histories on PFDHA in the scientific and engineering literature, the IAEA in TECDOC–1987 [24] provides specific guidelines for PFDHA applications based on the three case studies above (Yucca Mountain, Diablo Canyon and Krško site). Reference [23] documents a PFDHA benchmark analysis that consists of example applications made for a fictive site close to the Futagawa Fault System (i.e., the case for distributed fault displacement hazard) to identify the most critical aspects in the PFDHA models and demonstrate the analyses for understanding model differences.
Based on the brief presentation of the state of the art and industrial practices, there is a strong tendency to use the PFDHA methods developed in [25,26]. These methods require highly qualified experts and sufficient empirical data [27]. All existing applications of PFDHA methods are unique in that they are strongly influenced by the site’s seismotectonic features, data availability and time. Although advanced fault displacement hazard analysis methods exist, simplified, conservative engineering hazard evaluation methods are often needed if an urgent decision should be made on the continuation of operation or implementation of protective measures, which are urgently needed. This is particularly true when the fault’s activity is revealed during the operation, and the fault to be analysed is just below the site or crosses the critical infrastructure [1,2,3,6]. The development and application of simple conservative hazard evaluation methods could also be motivated by insufficient data for sophisticated analysis.
That is exactly the situation in the case of the Nuclear Power Plant Paks, Hungary site.
The description of the neotectonics of the Pannonian Basin and the site vicinity area is given in [28,29]. The paleoseismic investigations are documented in [30]. Briefly, the N-W end of an accurately mapped 27.9 km fault crosses the site, revealing a late-Pleistocene activity. In the trench, 20 ka old liquefaction-induced ground failure could be identified, indicating several earthquakes with magnitude M w 4.5 and a recurrence time of 1 ka. There are no historical or instrumental records of earthquakes in the site’s vicinity area; neither the micro-seismic monitoring indicates activity nor the GPS monitoring shows a deformation tendency. According to the international and national nuclear safety regulations, if the Quaternary activity of the faults at the site’s vicinity is suspected, the fault displacement hazard should be investigated and evaluated. The empirical evidence of the fault activity has been sufficient for the susception of hazard, but more is needed to perform a state-of-the-art probabilistic hazard evaluation. It is believed that the judgement of even the best experts and the use of sophisticated methods will not compensate for the lack of data. Since the site was the object of nearly continuous investigations during the last 30 years, a radical increase in evidence could not be expected from more site investigations. These circumstances motivated the research aiming to develop simple and conservative engineering hazard evaluation methods.
The first attempt [4] has been made based on the Probabilistic Seismic Hazard Analysis for the site, which has been updated and reviewed by independent experts several times during the last 30 years. The seismic hazard disaggregation has been considered to define earthquakes’ contribution to the hazard at fixed annual probability levels and their distribution in distance bins. The displacements were calculated by magnitude−displacement scaling correlations. It should be noted that the middle part of the Pannonian Basin is characterised as an area of diffuse seismicity. Since distance bins do not comply with the fault geometry, two options have been considered: (1) accounting for the distance bin that coincides with the site; and (2) considering all distance bins having essential contributions to the site’s seismic hazard. The next effort was developing a method that followed the logic of PFDHA; however, the parameters of the fault activity were defined by the weighting of parameters of area sources of the PSHA (maximum magnitude, the rate of the minimum magnitude and the slope of the Gutenberg–Richter distribution) [5]. Since the considered fault is just below the plant, the principal displacement was calculated using the procedure in [26].
Since the site is located above the mapped fault line, the length of ruptures and their distances to the site should be accounted for in calculating the probability of rupture–site intersection. Several publications have addressed engineering methods for hazard analysis when the fault crosses the pipeline [31,32], but no one is used for nuclear sites. The hazard evaluation studies for pipelines crossing a fault consider mainly uniform rupture distribution on the fault plane with size depending on the magnitude and create a probability geometrical distribution function. This concept was followed in [5], resulting in a more conservative hazard curve than in [4], despite expectations. These disadvantages of the simplified hazard evaluation methods in [4,5] motivated the improvements presented in this paper.
The paper presents first the sources of unnecessary conservatism in the methods for evaluating the fault displacement hazard of on-fault sites. It recognises that the displacement at the site depends in a complex manner on the geometrical relations between the site location on the fault line and the length and initial point of the rupture relative to the site. The length and initial point of the rupture can be considered independent random variables. In the paper, this interrelationship was investigated.
Based on these considerations, a screening procedure was developed to identify ruptures crossing the site. This procedure is based on accurate geometrical limitations accounting for the mapped fault length, the relative position of the rupture ends relative to the fault end, the rupture length and the site location. The rupture length and the coordinate of rupture initiation are considered random variables. This results in a realistic estimation of the site intersection.
Finally, the site displacement has been calculated accounting for the position of the rupture relative to the site. Several models exist for the displacement distributions of strike-slip faults, e.g., [26] and most recently [33]. The elliptical on-fault displacement distribution relationships in [26] have been considered in selecting the adequate displacement description that accounts for all geometrical circumstances (coordinate of the site and position of the rupture to the site).
To demonstrate the effectiveness of the introduced improvements in the simplified hazard evaluation, site location-dependent hazard curves have been developed using the study data performed for Hungary’s Nuclear Power Plant Paks site. The Paks site-specific data necessary for calculations are cited in the text.
The hazard curves obtained by the improved evaluation procedure compared to those calculated by the conservative method in [5] justify the effectiveness of improvements and the avoidance of over-conservatism. The proposed improved engineering fault displacement hazard evaluation method in the paper represents the actual state of the research initiated by the Paks Nuclear Power Plant case and allows the resolution of the related safety issue of the Paks Nuclear Power Plant.

2. Development of the Improved, Simplified Hazard Evaluation Method

2.1. Sources of Conservatism of Simplified Fault Displacement Hazard Evaluation Methods

The fault displacement hazard for strike-slip faults can be evaluated as proposed in [26,34]. The geometry and the geometrical variables are shown in Figure 1a. The evaluation results in rate ν D D 0 x y z at which displacement D on the fault exceeds a specified amount D 0 at the site with coordinates x and y and size z shown as follows:
ν D D 0 x y z = α m 0 m , s f m , s m , s P s r 0 m × r P D 0 z , s r 0 × P D D 0 l / L , m , D 0 f R r d r d m d s ,
where ν D D 0 x y z is the annual rate of exceedance; x , y are the coordinates of the site area, and z denotes the site dimension; The α m 0 × f m , s m , s is the rate of the earthquake with magnitude m, where α m 0 is the rate of events with magnitude m m 0 and f m , s m , s is the bivariate probability density function for magnitude m and distance from the end of the fault s; L is the rupture length, and l is the length on the fault where the closest distance from the site r is measured; P s r 0 m is the probability of non-zero surface movement due to the earthquake with magnitude m that can be calculated by the correlations of [35,36,37]; the term P D 0 z , s r 0 is the conditional probability of non-zero surface movement at the site of area z 2 at distance r from the fault; P D D 0 l / L , m , D 0 is the probability of D D 0 if the rupture caused by the earthquake with magnitude m causes a rupture with l/L regarding the site.
The geometry is simplified, when the site is on the mapped fault line, as shown in Figure 1b. Since the site is on the fault line, f R r reduces to the delta function, f R r = δ r = 0 .
The simplified engineering hazard evaluation methods, published in [4,5] and also several other studies, e.g., [2], assume that f m , s m , s = f m × f ( s ) .
α m 0 and f m are obtained from the Gutenberg−Richter relation. The following total probabilities are calculated:
  • The total probability of non-zero surface displacement P s r 0 , which depends on the magnitude distribution:
P s r 0 = m 0 m u f m × P s r 0 m d m ,
where m u is the maximum probable magnitude for the source;
  • The total probability that the rupture with length L caused by an earthquake with magnitude m and initiating at coordinate x i = s crosses the site;
    In [5] and [31], simple geometrical considerations are made for the distribution of the fault ruptures along the total fault line and the probability of crossing the site.
    For example, in [5], the probability of crossing the site is proportional to the rupture length relative to the fault length;
  • The most important simplification assigning the average displacement along the entire rupture length L. Thus, the exact position of the rupture relative to the site, l / L , can be neglected.
  • Thus, the total probability of the average displacement D a v e D 0 is calculated via:
    P D D 0 = m 0 m u f m P D a v e D 0 m , D 0 d m
    using empirical magnitude scaling relations D a v e = D a v e ( m ) and its inverse m = D a v e 1 ( D a v e ) and the density function f m .
The methods following the concept above are over-conservative, since they do not consider the points as follows:
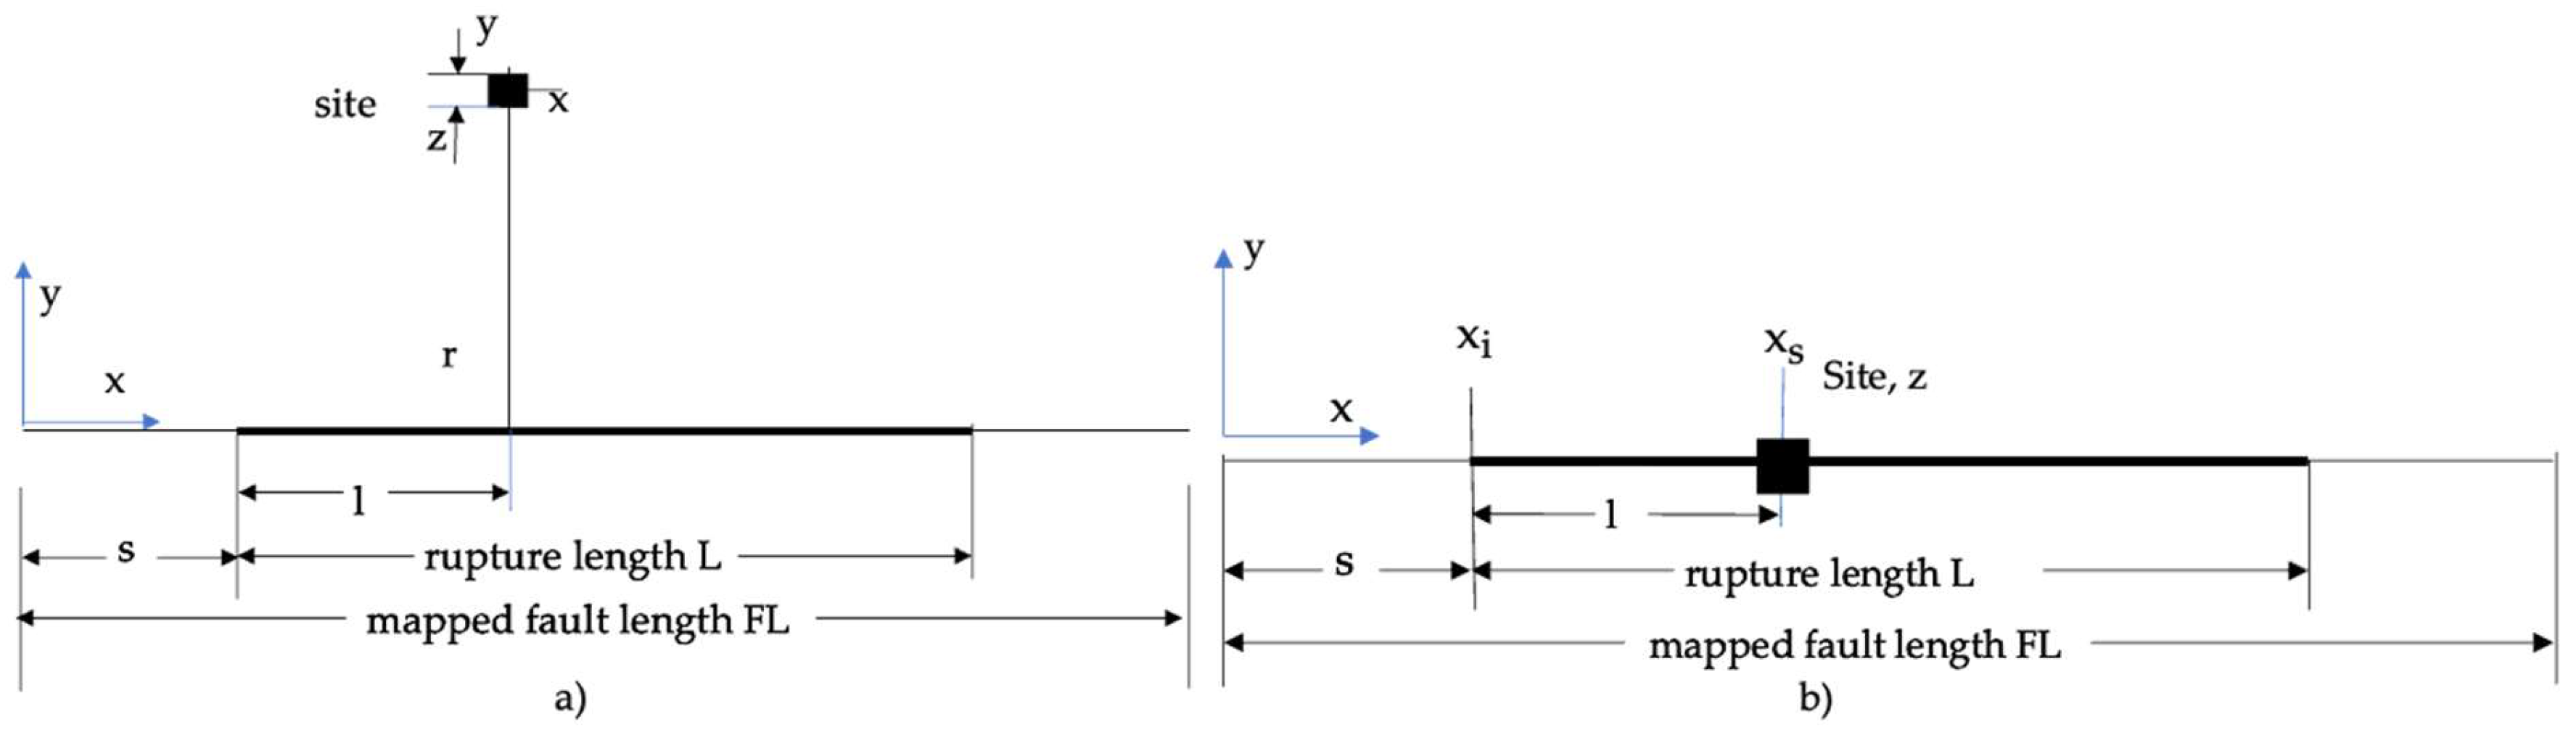
  • The position of the site on the fault line;
  • The position of the starting point of the rupture concerning the site;
  • Whether all rupture lengths cross the site;
  • The displacement distribution along the fault.
Remarks 1 to 3 relate to the site and faults’ geometrical configuration.
Although the assumption of a uniform displacement distribution along the entire rupture length is reasonable, it results in an essential overestimation of the surface displacement for the sites close to the fault ends. Thus, the issue pointed out in remark 4 above should be resolved.

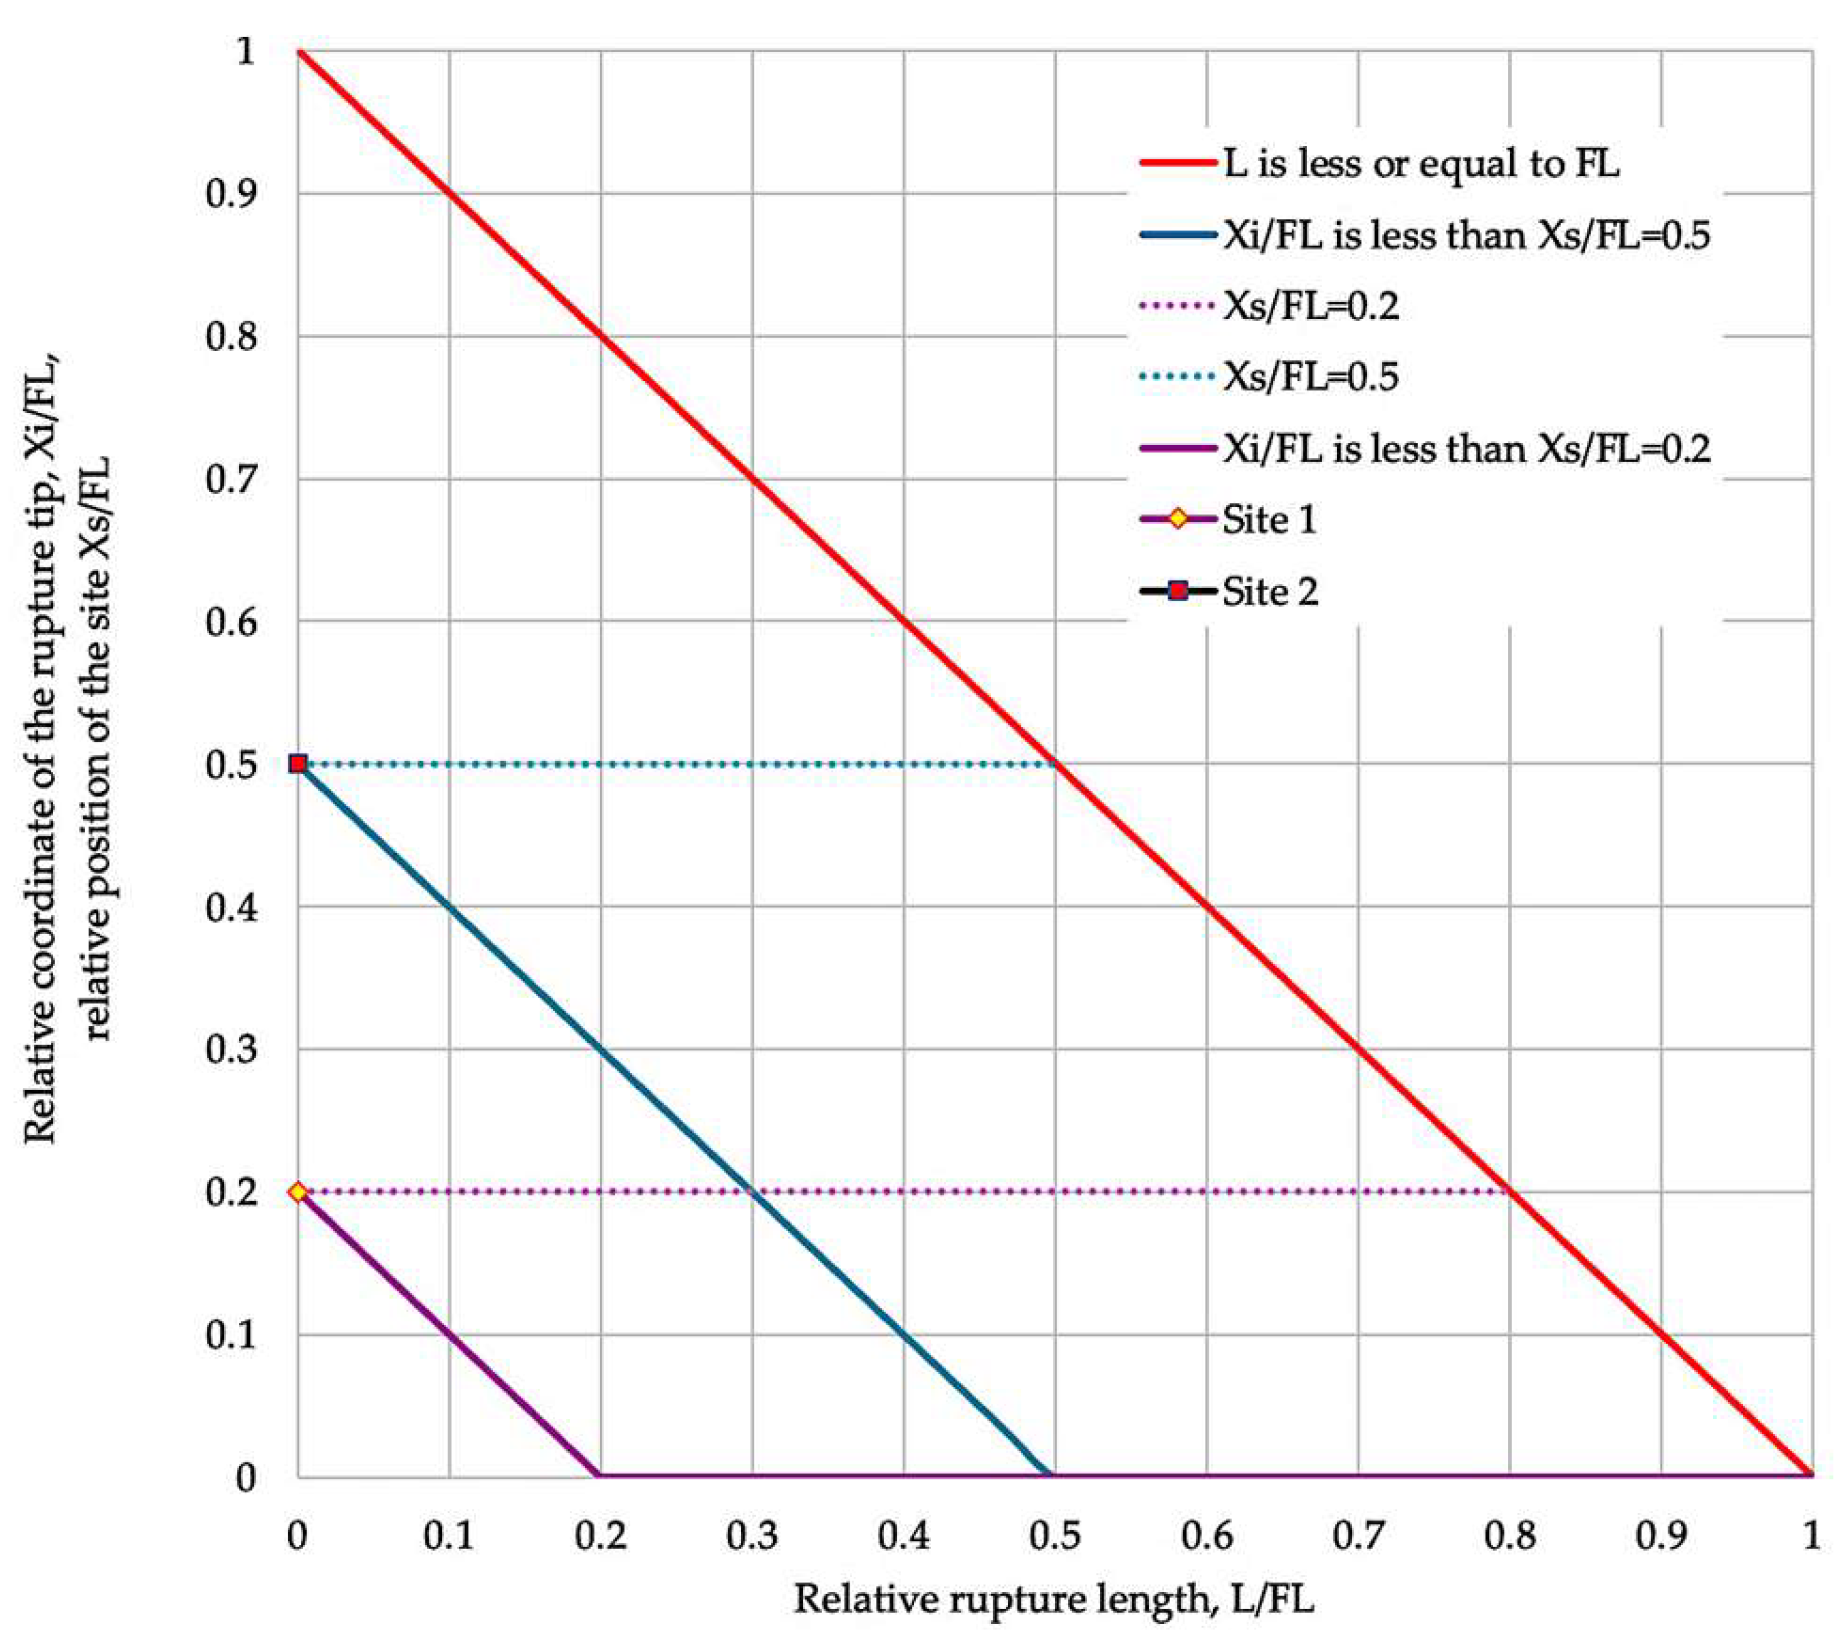
2.2. Geometrical Conditions for the Sites on the Mapped Fault Line

The displacement at the site should be calculated by accounting for the probability that the rupture crosses the site, depending on two random variables x i and L (Figure 1a). The simplest assumption is the uniform distribution of the initiation coordinate of the ruptures along the fault length x i with uniform probability density function f x i = 1 / F L . However, apparent geometrical limitations should be considered, since x i and L are not independent. At any site position x s , these are limitations of the range of random variables x i and L, which are mutually dependent within the fault length FL.
This is illustrated in Figure 2.
Let us fix the mapped rupture length FL and the site’s coordinate x s . In Figure 2a, x s = 1 / 3 F L , and in Figure 2b, x s = 1 / 2 F L . The starting point, x i , and rupture length, L, vary in Figure 2. For illustration purposes, elliptical displacement distribution is assumed along the rupture length; however, the values are used only for illustrating the physical picture. The lengths and coordinates in Figure 2 are normalised to the fault length, FL. The displacements are normalised to the maximum displacement at l = 0.5 × FL.
Consequently, while evaluating the surface displacement at the site, those ruptures should be accounted for, for which the following geometrical conditions hold:
  • The rupture should start below the site’s coordinate, x i < x s (ruptures illustrated by red dotted curve do not cause displacements at the site; Figure 2a);
  • Those ruptures contribute to the site displacement that crosses the site, that is, x i + L > x s or L > ( x s x i ) l (see the solid lines in Figure 2a,b). The ruptures, illustrated by the dotted lines and shorter ones, do not cause displacements at the site;
  • Ruptures with x i + L F L are realistic only. The actual rupture with length L should fit inside the fault length FL.
Figure 3 displays the geometrical conditions listed above.
Those ruptures contribute to the site hazard, which complies with the geometrical conditions. The number of ruptures contributing to the site hazard is zero if the x i x s . The number contributing to the site hazard is the largest if the site is in the middle of the fault since x i , which in this case can vary in 0 x i x s = 0.5 × F L . In this case, 50% of all possible ruptures should be considered, the length of which is L > 1 / 2 × F L . The ratio of the area of the parallelogram to the total area of the triangle 1-0-1 is 0.5. If the site is at x s / F L = 1 / 6 , the maximum number of the ruptures to be considered is initiated at 0 x i x s = 0.2 × F L and the maximum number of ruptures to be considered is ~32% of all possibles.
Table 1 and Table 2 show examples of screening out ruptures that do not comply with the geometrical limitations. These are indicated by “FALSE”.
Table 1 shows the case where the site is in the middle of the mapped fault length, x s / F L = 0.5 and s = x i = 0 . The last column of Table 1 shows the result of the screening if x i / F L = 0.25 .
Table 2 illustrates the case where x s / F L = 0.25 × F L and x i = 0 , and the last column shows the result of the screening for x i = 0.1 × F L .
The first two columns in Table 1 and Table 2 are data taken from the case study for the Paks site in Hungary [5].
As seen in Table 1 and Table 2, the dependence of whether a rupture contributes to the hazard is a complex function of x s , x i , L and F L .
In [5], the ratio of the rupture length to the mapped fault length is assumed for the conditional probability of the rupture intersecting the site, P i n t e r s e c t i n g   t h e   s i t e L = L / F L , and the total probability for intersecting the site is calculated as P i n t e r s e c t s   t h e   s i t e = i P i n t e r s e c t s   t h e   s i t e L i P L i m i P m i .
The summation is over the elementary intervals within m 0 ,   m u . It means that all ruptures in the interval L m i n ( m 0 ) ,   L m a x ( m u ) are accounted for. Compared to this, the above screening procedure reduces the number of ruptures crossing the site due to the geometrical limitations.
Consequently, the conditional probability for intersecting the site is less than P ( x i ,   x s , L ,   F L ) P i n t e r s e c t i n g   t h e   s i t e L = L / F L , which will be shown below.

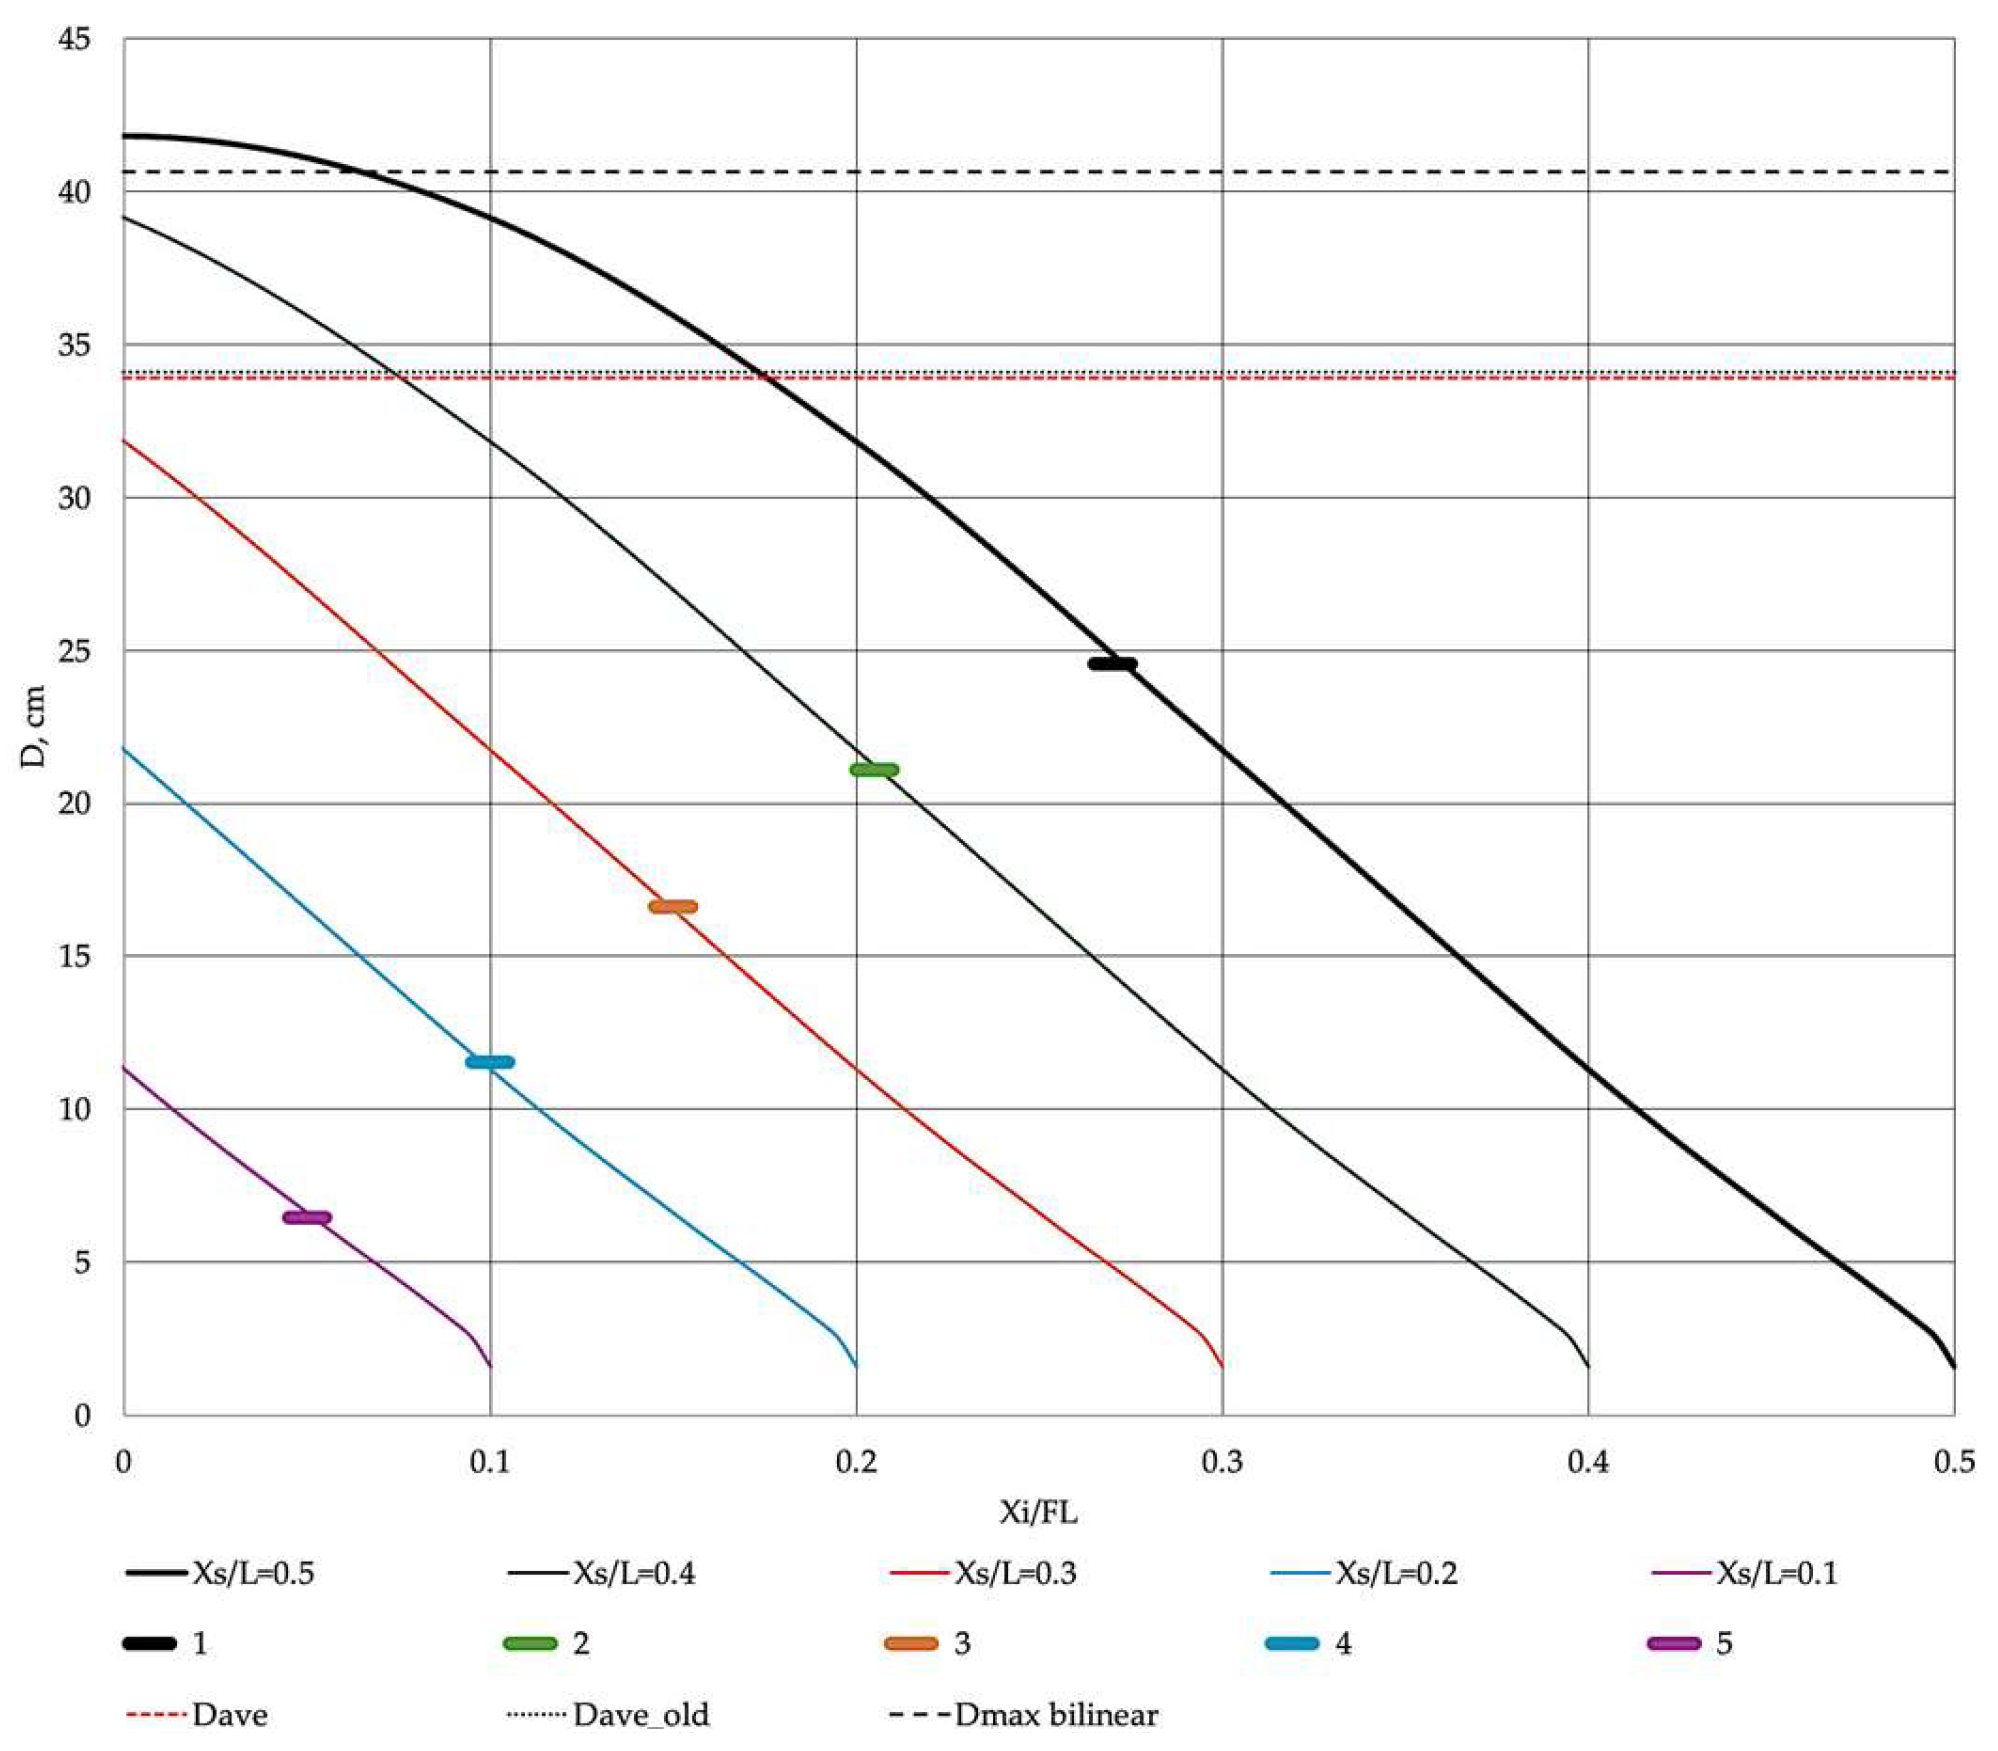
2.3. Consideration of the Displacement Distribution−On-Fault Distance Ratio, l/L

In the engineering hazard evaluations for on-fault sites, the displacement distribution along the rupture is neglected, and the average displacement is considered along the entire rupture length, e.g., in [4,5,31]. For the average displacement, empirical scaling relations can be used, as published for example in [35]:
log D a v e = a + b × m ± ε
where a = −6.32, b = 0.90, and the standard deviation ε = 0.28 in log units. In [5], the weighted average of six empirical scaling relations is applied to evaluate displacements.
The paper [26] provides three empirical equations for the dependence of the displacements on the variable l/L (Figure 1). These are bilinear, quadratic, elliptical and trigonometrical functions versus l/L scaled on the magnitude, m. The elliptical and trigonometrical relations have the form:
ln D = a × m + b × x * l / L + c ,
For the elliptical model, a = 1.7927, b = 3.3041 and c = −11.2192 are constants, and x * l / L x * x s x i ) / L is as follows [26]:
x * l / L = x * ( x s x i L ) = 1 0.5 2 × l L 0.5 2 = 1 0.5 2 × ( x s x i ) L 0.5 2 .
For the trigonometrical relation, x * l / L = sin π l / L , the constants a = 1.7940, b = 3.1036 and c = −11.0 hold [27]. Both relations have a standard deviation on l n ( D ) equal to 1.1348. It means l n D ~ N μ , σ 2 ,   μ ( m ,   i / L ) , the newest research results regarding this distribution see in [33]. Our calculations define the hazard curve for the mean displacement versus the magnitude.
Equation (6) also includes the geometrical limiting conditions since ( 1 0.5 2 × l / L 0.5 2 ) 1 0.5 2 × ( x s x i ) / L 0.5 2 0 , i.e., L l or L ( x s x i ) that means the site should be located on the rupture. This is identical to the geometrical limiting condition 2 above. However, the limitations x i < x s and x i + L F L are not considered.
Considering all distribution forms, the displacements in the range of [ 0 ; ~ L / 3 ) are significantly smaller than the maximum, which is also valid for the range ( ~ 2 L / 3 ; L ] . The comparison of the empirical bilinear, quadratic, elliptical and trigonometrical functions for ln D = F ( m , l / L ) shows that the elliptical and trigonometrical functions result in approximately identical distribution. In contrast, the bilinear seems to be slightly more conservative. The quadratic polynomial relation versus l / L does not have a maximum at l / L = 0.5 mid-point of the rupture, which should be evident from physical considerations. The paper [26] also proposes bilinear, quadratic or elliptical empirical relations for the normalised displacements D / D a v e that reveal the same features as the distribution of D. Based on the comparison of numerical examples and the latest research results in [33], the elliptical distributions expressed by Equations (5) and (6) are preferred in the calculations below. The pragmatic reason for the selection is the easy-to-use analytical expression of x * that also complies with geometrical limitations.
As in [5], the use of a conservative weighted average scaling relation for displacement evaluation neglecting the dependence of the displacements on the site location, the distance from the end of the rupture to the site’s position and the distance from the end of the rupture to the initiating point of the rupture results in essential conservatism, which is demonstrated in Figure 4.
Here, the displacement distributions versus relative coordinate x i / F L were calculated by Equations (5) and (6) for the magnitude of 6.5 and for the relative site locations x s / F L equal to 0.5 (mid fault), 0.4, 0.3, 0.2 and 0.1 separately. The numbers 1–5 indicate the expected displacements that are defined assuming a uniform distribution of x i along [ 0 ; x s ). The average displacement given by Equation (4) is also plotted in Figure 4. The black dotted line is the displacement value used in [5]. The black dashed line is the maximum displacement according to the bilinear distribution [26].

2.4. The Improved Hazard Evaluation Procedure

Based on the considerations above, the simplified engineering surface displacement hazard evaluation method in [5] could be improved by better estimating the probability that a rupture crosses the site and the displacement distribution along the rupture.
The surface displacement hazard is calculated for the fault with an accurately mapped length of 27.9 km for the sites at x s = 0.1 × F L , x s = 0.3 × F , and x s = 0.5 × F L .
The steps of an improved hazard evaluation procedure are as follows.

2.4.1. Characterisation of the Fault Activity, i.e., the Definitions of α m 0 and f m

In the case of the Paks site, the Gutenberg−Richter relation associated with the fault and developed based on seismotectonic source models has the following parameters: α m 0 = 0.81 , m 0 = 3.5 , the maximum magnitude, m u = 6.7 , β = 2.455 and
α ( m ) = α ( m 0 ) × e x p ( β m ) e x p ( β m u ) e x p β m 0 ) e x p ( β m u (
m u = 6.7 is in line with the fault length magnitude correlation of [36]. However, in the case of the Paks fault, the maximum magnitude that could be obtained using the area of the fault plane indicates that the value of 6.7 is an overestimation (the fault length is 27.9 km, and the seismogenic depth is 9 to 12 km).

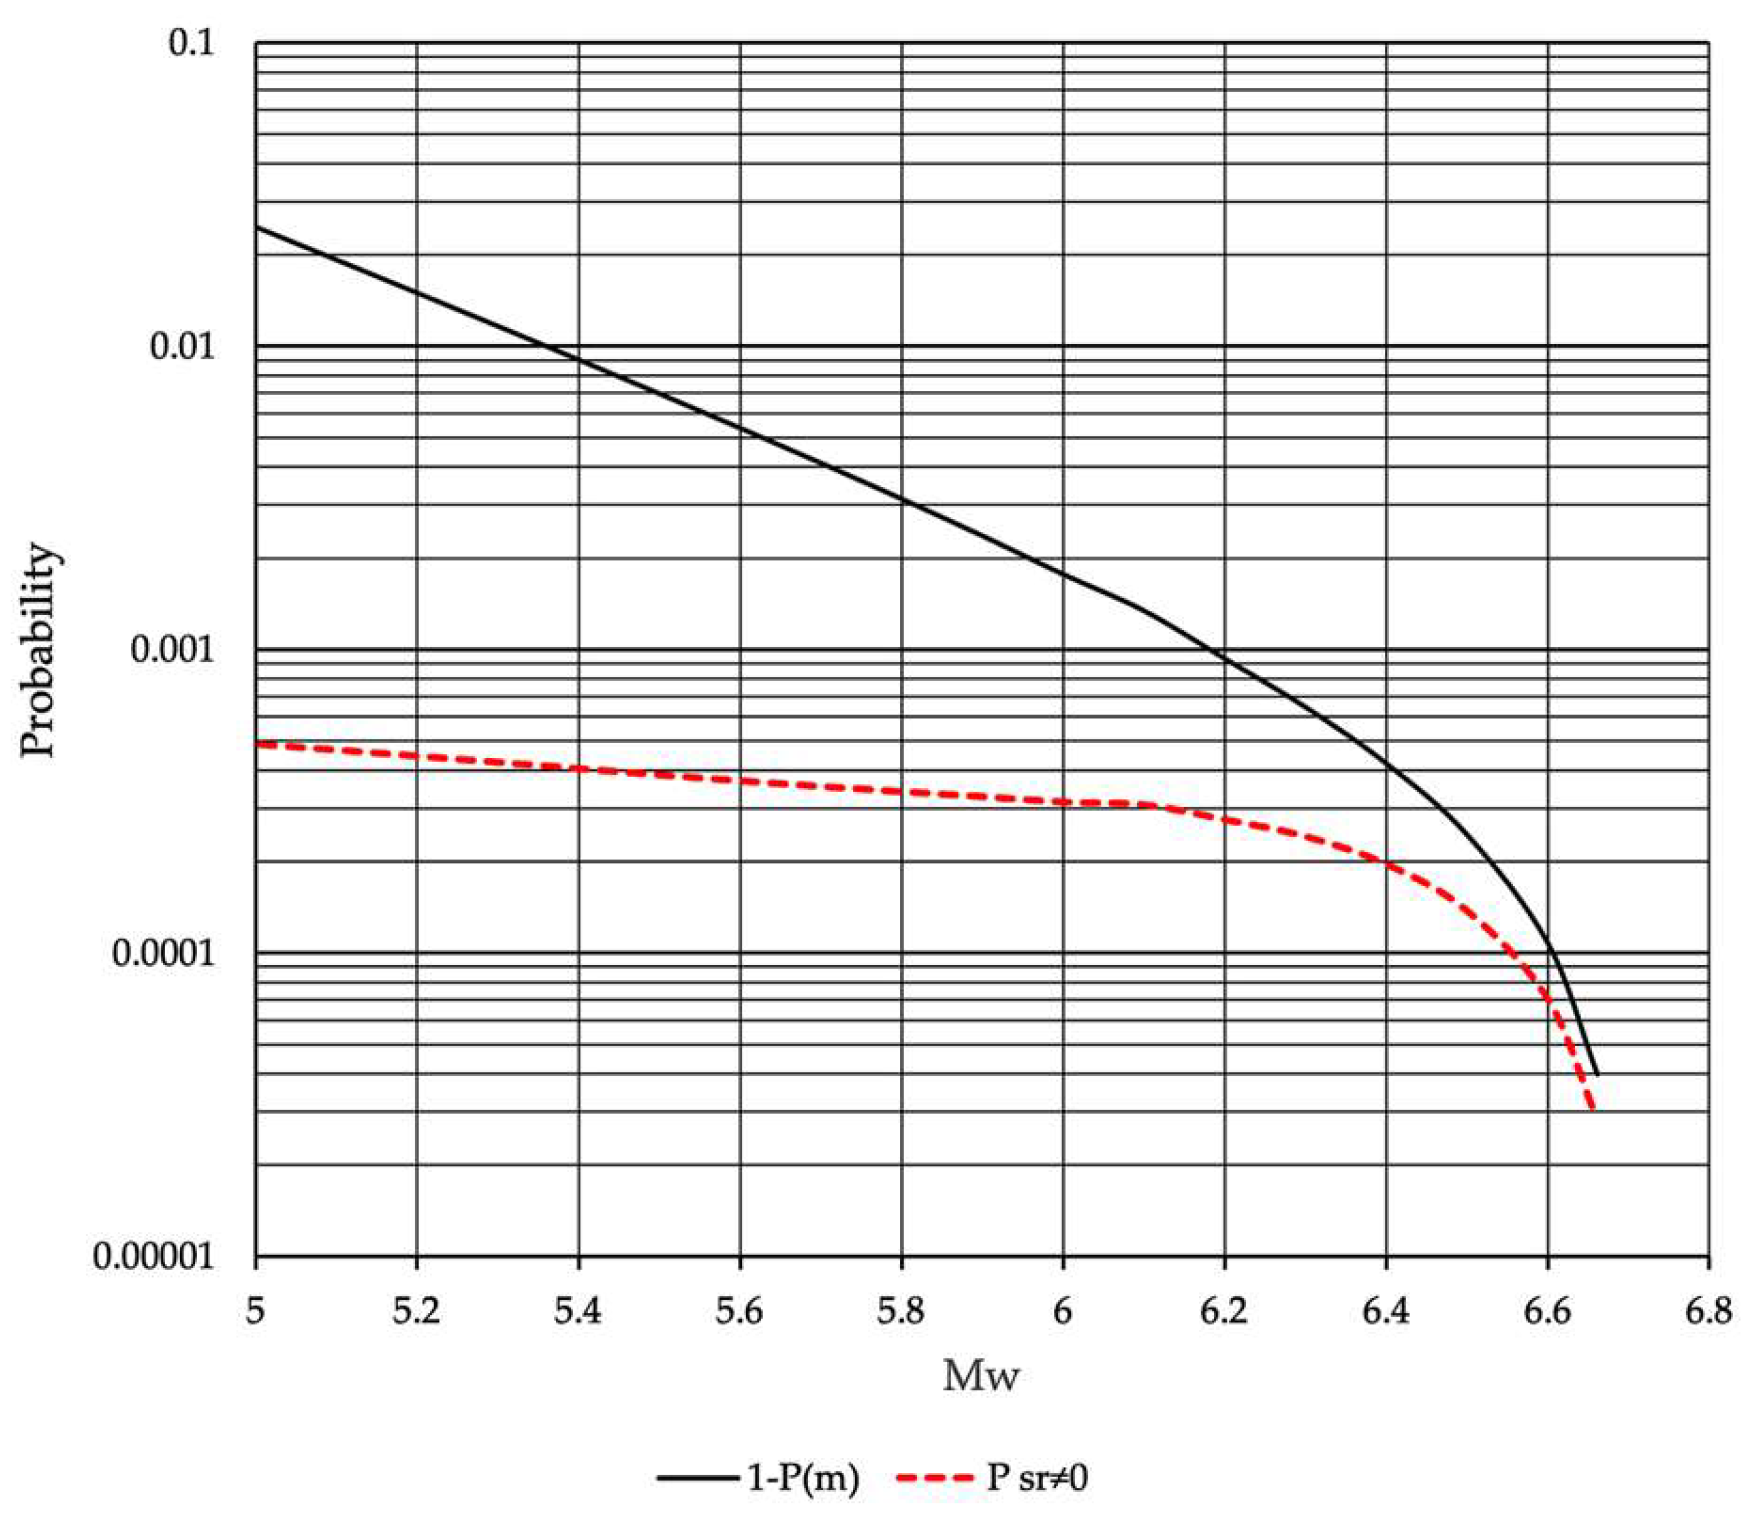
2.4.2. Calculation of the Total Probability of the Non-Zero Surface Rupture

This is performed by the equation:
P s r 0 = m 0 m u f m m × P s r 0 m d m ,
where the conditional probability P s r 0 m j is defined in [5] as the weighted average of the empirical relations by [37,38,39]. Figure 5 shows the magnitude exceedance probability ( 1 P m ) and the probability of the non-zero surface rupture versus the magnitude.

2.4.3. Screening of the Probability That the Ruptures Intersect the Site

For the magnitudes m j in the magnitude interval [ m m i n ,   m u ] , calculate the rupture length, L j , using the empirical scaling relation for the rupture length L j = L ( m j ) , where m m i n is a reasonable established minimum magnitude where displacement can be expected; in our case, m m i n = 4.5 . The empirical correlation in [39] is preferred in the case studied, since it reproduces the mapped fault length of 27.9 km for the ultimate magnitude m u = 6.7 .
Select those ruptures, for which the geometrical relations x i < x s , x i + L > x s and x i + L F L hold; see Table 1 and Table 2 as examples. Note that x s and F L are fixed values, L j is fixed corresponding to m j , and the x i is a random variable within [ 0 , F L ] .

2.4.4. Calculation of the Displacements at the Site Location x s

At all m j , for each screened-in pair of x i and L j , calculate the displacements at the site location x s by Equations (5) and (6) using m j and x * ( x s x i ) / L j .

2.4.5. Calculation of the Expected Displacements at the Site Location x s

For all m j , calculate the expected displacements at the site location x s , assuming x i is uniformly distributed over, i.e., P x = x i / F L in 0 , x i . The expected displacement value is the arithmetic mean of displacements at different screened-in x i -s.

2.4.6. Calculation of the Annual Exceedance Rate (AER) ν ( D D 0 )

The calculation is based on Equations (7) and (8), assuming the probability P ( x i 0 , x s = x s / F L .

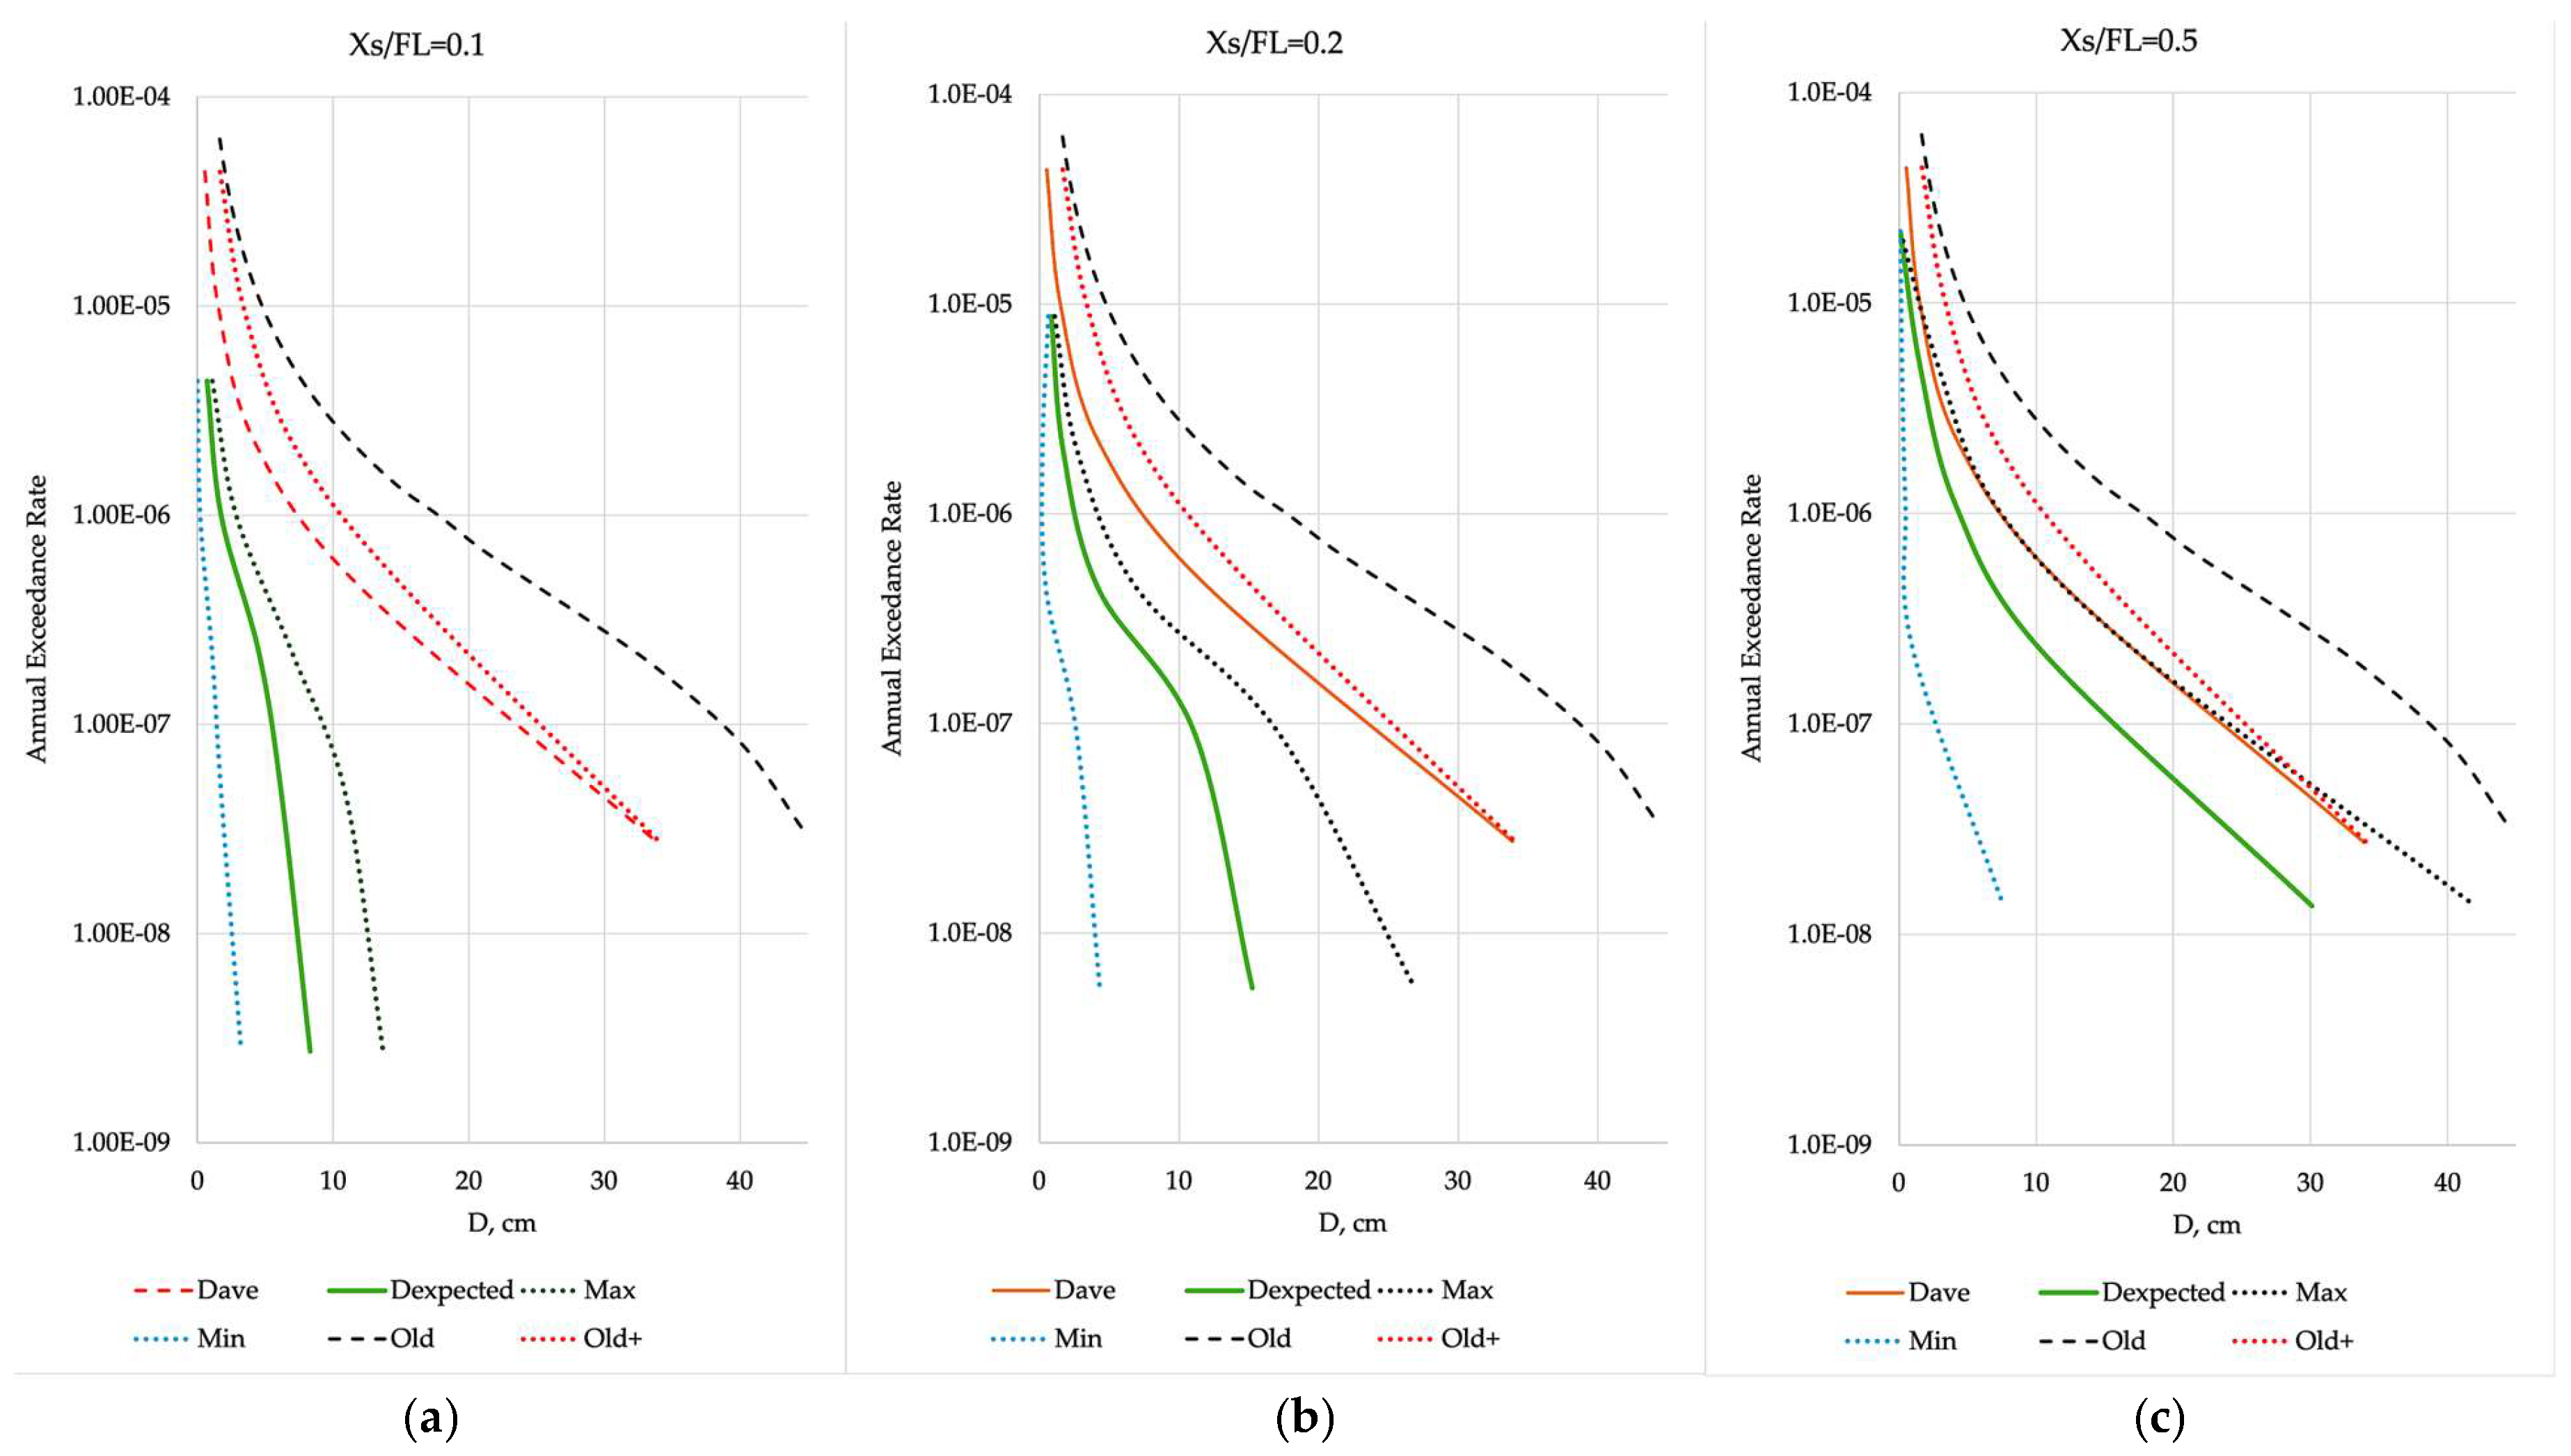
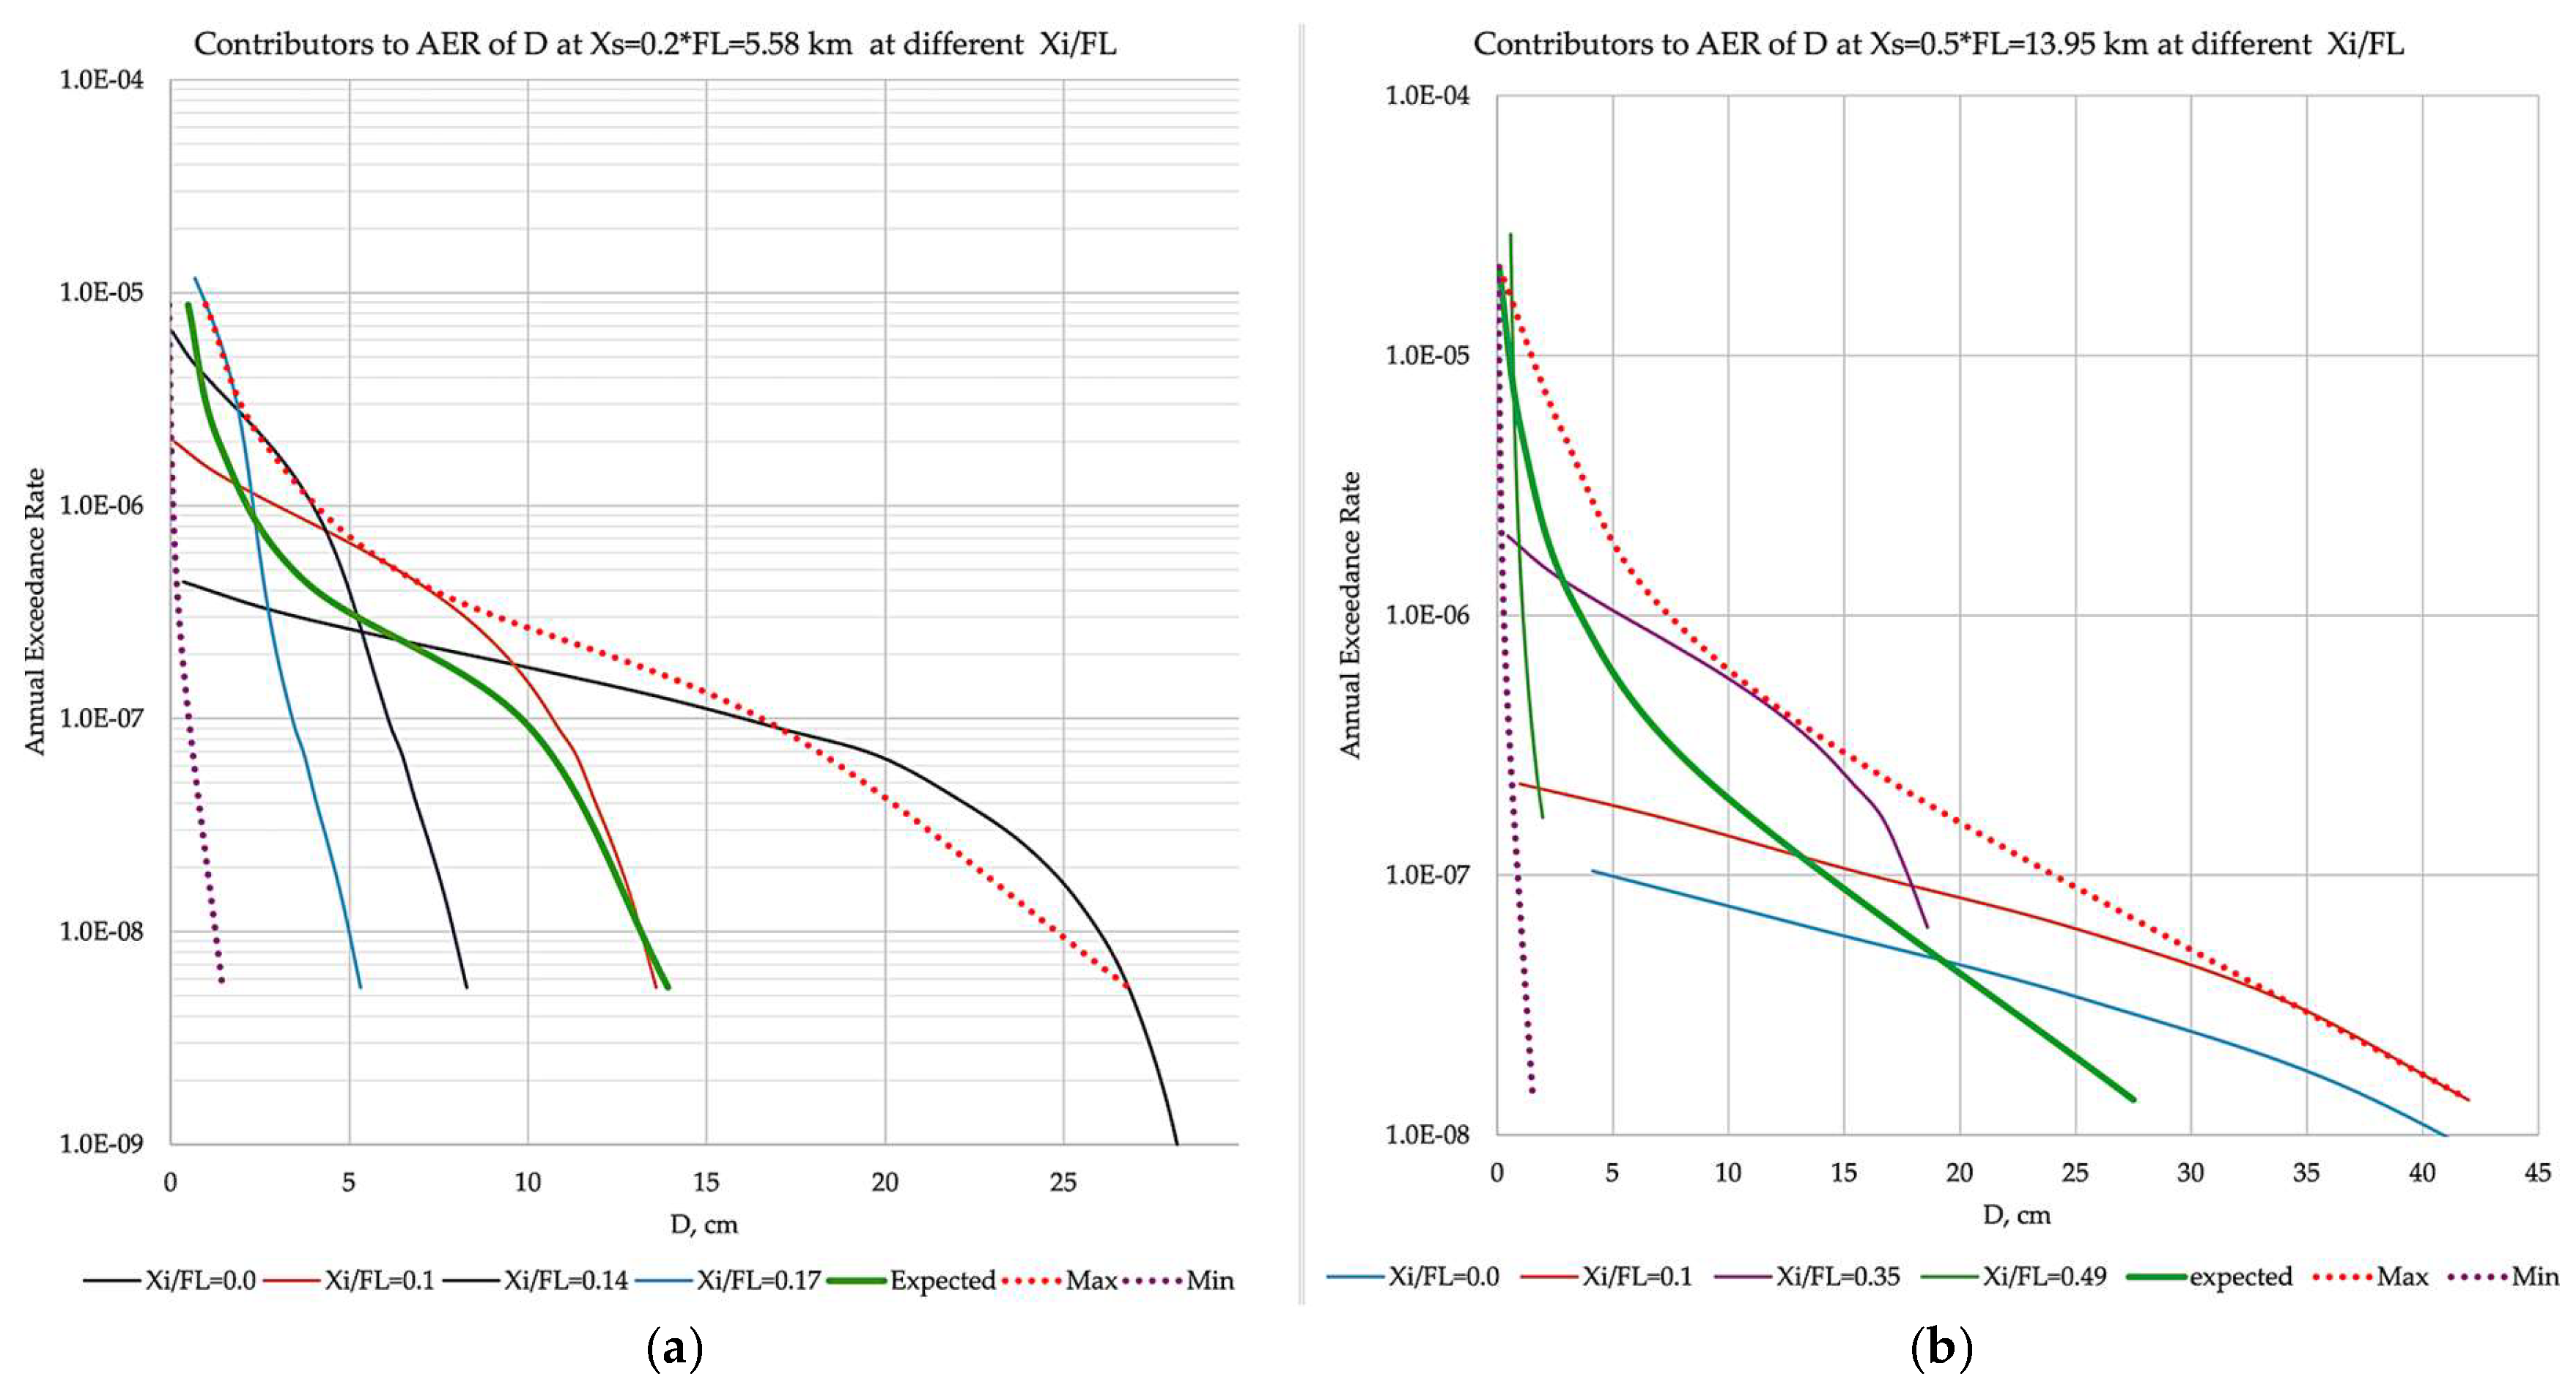
3. Evaluation of the Hazard Curves for Different On-Fault Site Positions

The hazard evaluation procedure results in the hazard curves or AER curves for the sites at x s = 0.1 × F L , x s = 0.3 × F L and x s = 0.5 × F L selected for numerical example as shown in Figure 6. The green lines are the AER curves for the expected site displacements. The dotted black and green lines are the AER curves for the maximum and minimum values contributing to the hazard. The red dashed line corresponds to the case where the displacement at the site is equal to the average one per Equation (4) with the annual rate of magnitudes according to Equation (7). The black dashed line is the hazard curve obtained by the conservative method in [5]. The red dotted lines (Old+) are the hazard curve obtained by method in [5] but with the same probability of site intersection as in case of Dave.

4. Discussion of the Results

4.1. Analysis of the Results

In Figure 6, the hazard’s dependence on the site’s distance from the end of the fault is apparent. The resulting hazard curves at x s = 0.1 × F L , x s = 0.3 × F L and x s = 0.5 × F L complied with the physical considerations. The closer the site was to the middle of the mapped fault, the higher the displacement hazard was.
It is remarkable that in the case of x s = 0.5 × F L , the most significant contributor to the hazard (Max–dotted black line) was practically equal to the curve obtained for D a v e per Equation (4) and with an annual rate per Equation (7). This can be considered as an empirical justification of the procedure proposed.
The hazard curve overestimation obtained by the conservative method in [5] had two essential causes: The dominating cause of over-conservatism was the overestimation of the number of ruptures that intersect the site. The weighted average of six magnitude-displacement scaling relations was slightly more conservative as D a v e per Equation (4) (see Figure 4).
It is also remarkable that the method in [5] provides about the same hazard estimation as it is defined assuming D a v e per Equation (4) along the rupture if the intersection probability is calculated according to the procedure in Section 2 above; the red dashed (Dave), the black dashed (Old) and red dotted lines (Old+) were compared. It means that scaling the average displacement versus magnitude is a better estimation for any site position than scaling the displacement per magnitude and associating it to the site with the probability of intersection, which is equal to the ratio of the rupture length (also scaled to the magnitude) to the mapped length of the fault.
The basic question for the operators/owners of critical, high-potential-risk facilities is whether the fault displacement hazard is significant for safety. The significance should be assessed at the hazard level prescribed by the regulations and an analysis of the consequences of surface displacements or engineering judgment. In the case of nuclear power plants, as discussed in [3,4,5], the hazard can be screened out if the hazard effects at an annual exceedance rate of 10−7/a are negligible for the integrity of the plant structures. Generally, it is assumed that the hazard can be neglected if the surface displacement is less or about 10 cm at 10−7/a. If the hazard is recognised at an operating nuclear power plant, the best estimate displacement can be used to evaluate the safety significance. The mean value of the probability density function for the displacement at the level of 10−7/a should be defined, and the uncertainty should be estimated and considered.
It should be proven that the values indicated as “expected” are point estimates of the mean displacements at any hazard level, and the maximum and minimum values could be considered the interval where the displacements are likely to fall.
Figure 7 shows the annual exceedance rates for displacements at x s / F L = 0.2 and x s / F L = 0.5 calculated for ruptures with different x i in the range of 0 x i x s . These are the possible contributors to the site hazard. The ruptures with x i = 0 and x i = x s are the two extremes contributing to the hazard, giving the largest and smallest possible displacements. The green lines refer to the expected displacement AER, and the dotted lines indicate the AER curves of the maximum and minimum contributors to the displacement hazard. Thus, the minimum and maximum curves bound the possible contributors, including the physically possible largest and lowest contributors with x i = 0 and x i = x s , respectively. A minor exception is in the case of x s / F L = 0.2 , in the interval 10−7/a to 5 × 10⁻⁸/a where the contribution to the hazard rupture with x i = 0 slightly exceeds the predicted maximum curve.
The benefit of the improvements of the simple engineering evaluation of fault displacement hazard is the realistic consideration of cases where the site is close to the S-W end of the fault in the case of lack of data on the fault activity. Figure 8 shows the example of the Paks site in Hungary obtained by simplified engineering methods developed via step-by-step implemented improvements.
In [4], compensating for the lack of data on fault activity, a hazard evaluation method has been developed based on the magnitude-distance disaggregation of the seismic hazard that was evaluated by Probabilistic Seismic Hazard Analysis. It should be noted that the middle part of the Pannonian Basin is characterised as an area of diffuse seismicity. Since distance bins do not comply with the fault geometry, two options have been considered: (1) accounting for the distance bin that coincides with the site; and (2) considering all distance bins having essential contributions to the site seismic hazard. These estimates are indicated in Figure 8 by continuous lines.
It was recognised that the fault geometry, the site’s on-fault position and the probability that the rupture intersects the site should be accounted for even in the simple engineering hazard evaluation method. In [5], an attempt has been made to account for all these aspects strictly conservatively. In Figure 8, the black dashed line is the hazard curve calculated by this conservative method.
In trying to evaluate the conservativeness of the procedure in [5], a need for improvements in the method has been recognised. First, the ruptures contributing to the site displacement should be precisely identified, considering the position of the rupture relative to the site and the on-fault position of the rupture. The improved method results in a realistic estimation of the hazard levels 10−4/a to 10−7/a, which are interesting for the safety of hazardous facilities like nuclear power plants. The advantage of the improvements is less expressed but is not negligible for the sites located in the middle of the mapped fault.

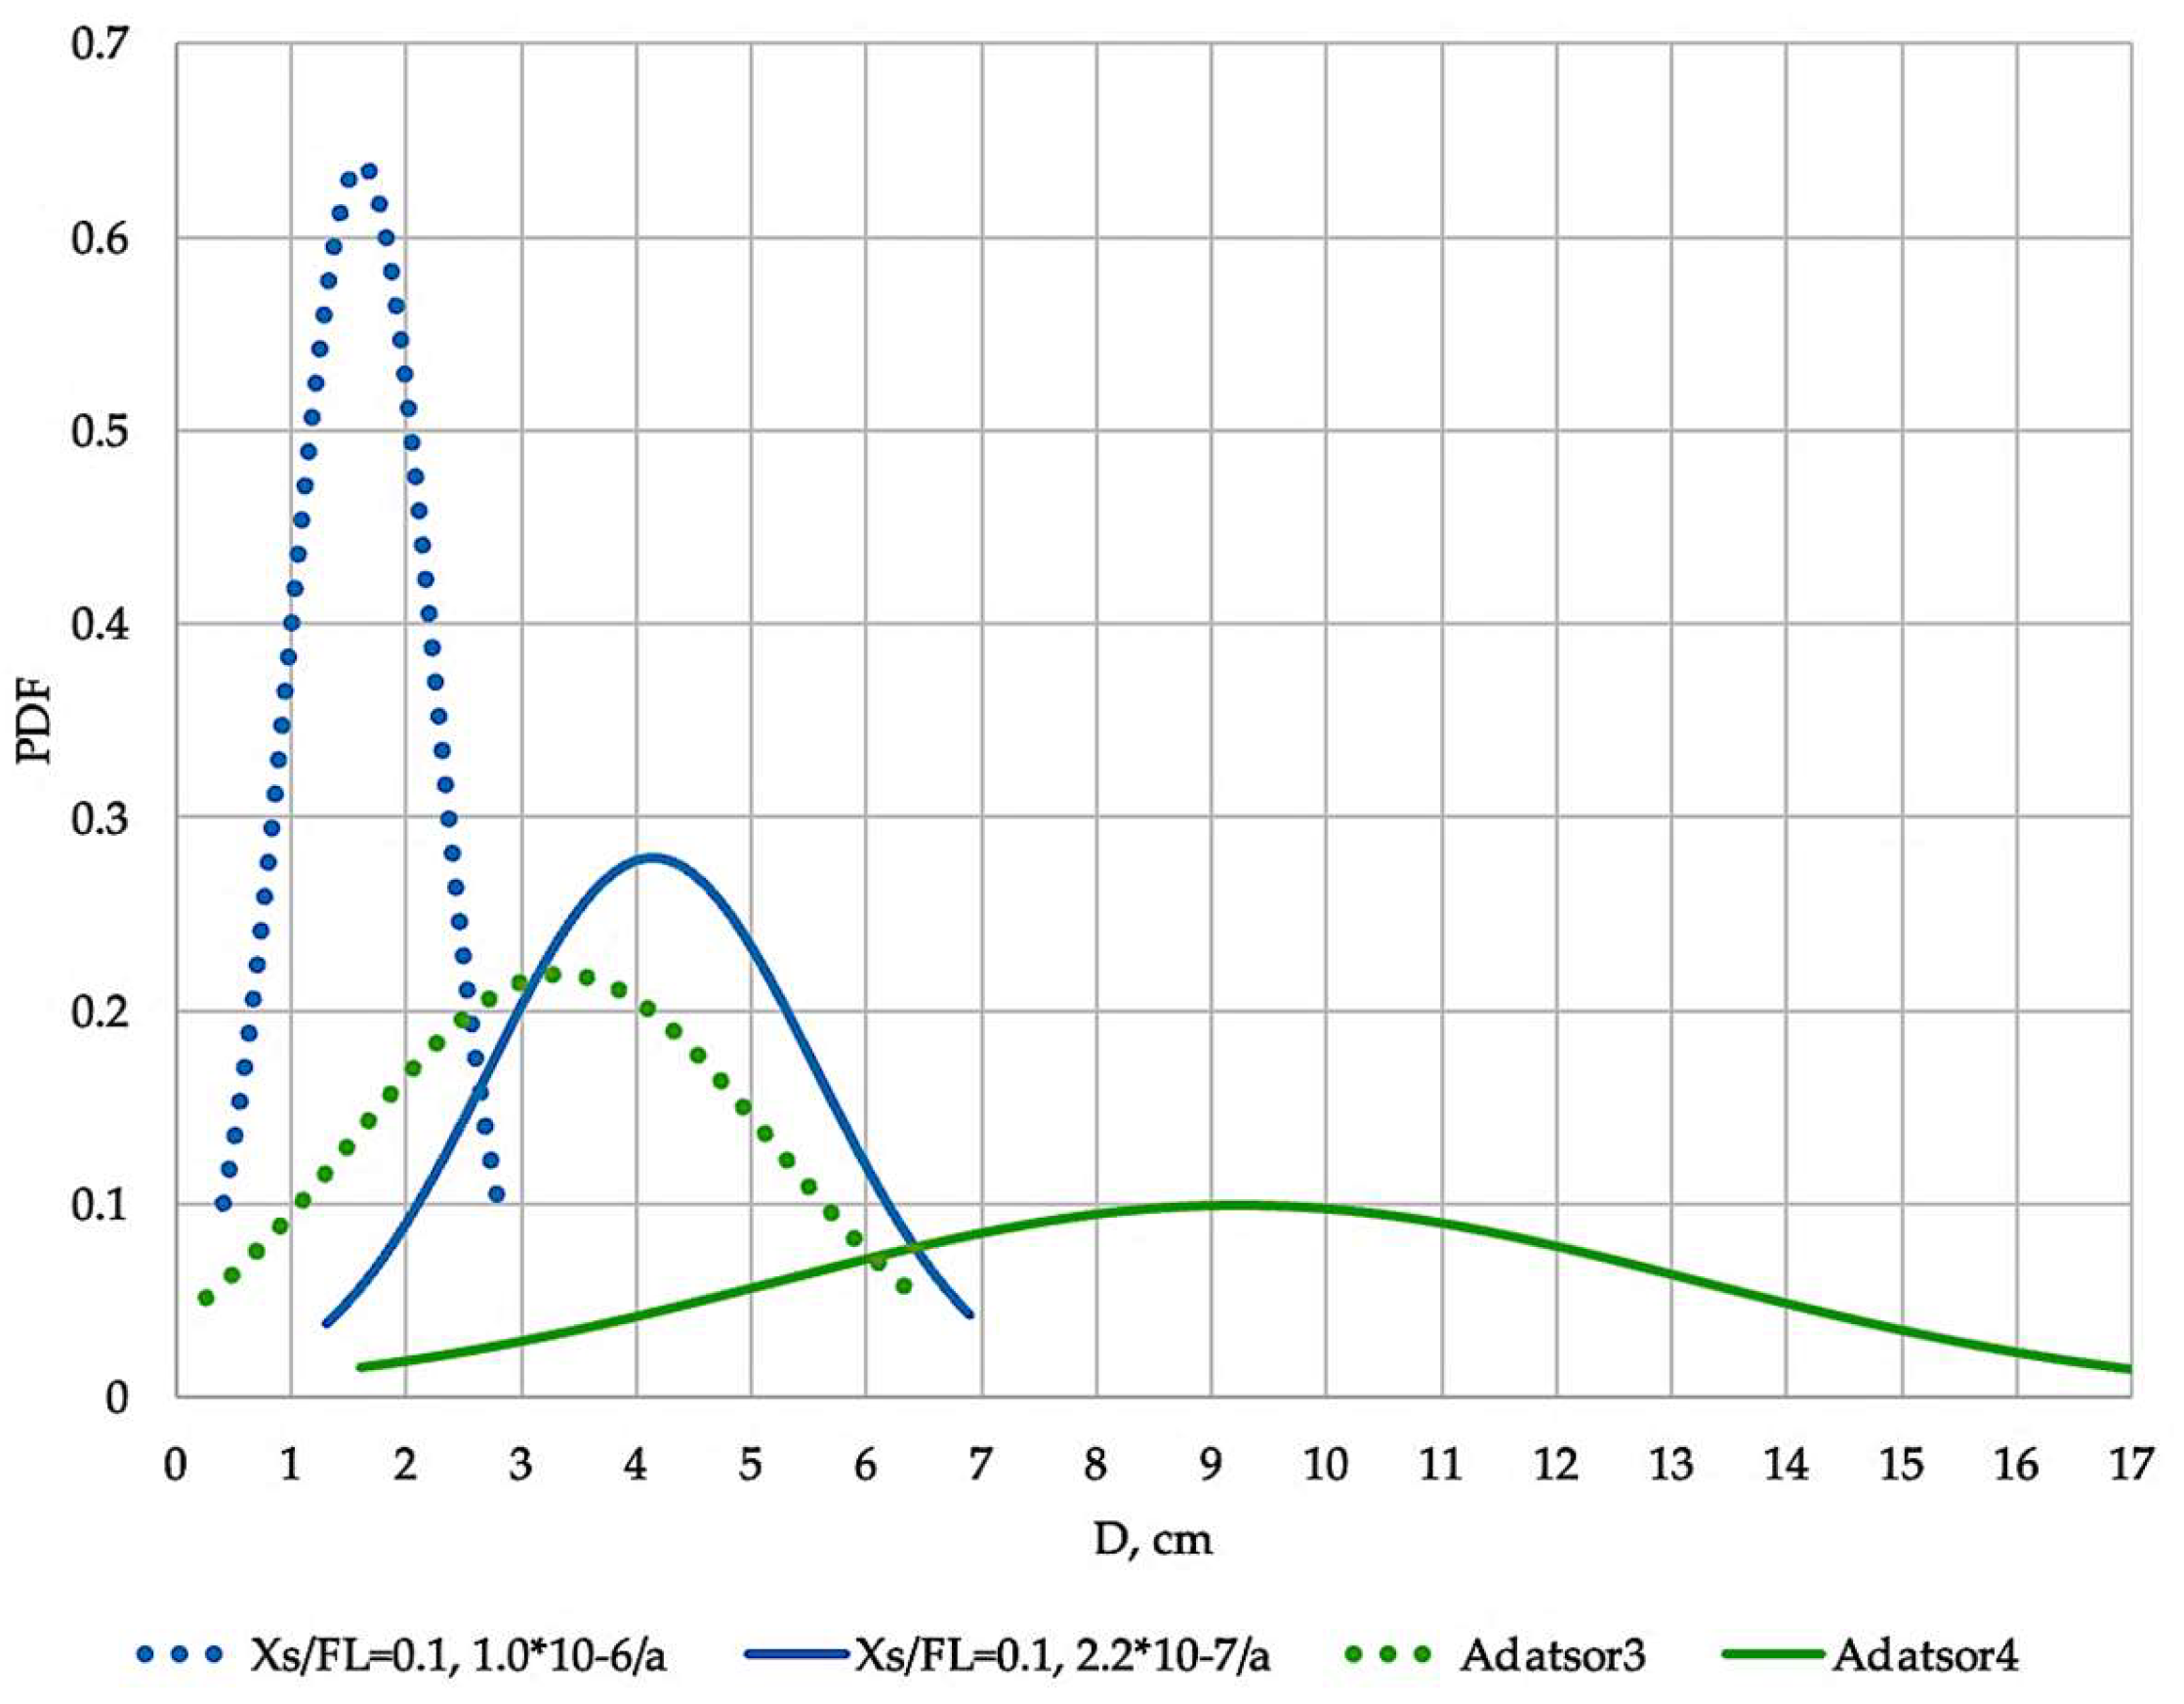
4.2. Consideration for Validation of the Method

4.2.1. Possible Elements of the Validation of the Methodology

Table 3 summarises the elements of the validation procedure. The validation should focus on the new elements of the methodology compared to the other already implemented methodologies. These are the definitions of the fault parameters based on the parameters of the PSHA models, the screening method for the ruptures affecting the site and the calculation of the probability of intersections.
The most crucial element of all methods is the use of scaling correlations. These are validated by the data. In our case, the PSHA modelling was validated by the seismic catalogue and related to the seismic hazard information.
The entire hazard evaluation procedure is a prediction, an intellectual construct that could be validated posteriorly. It should be noted that only the consensus of the technically informed community can now verify the validity of our prediction that a natural event assessed with 10−7/a will happen in the coming 50–60 years (in the case of a new reactor).

4.2.2. Checking the Self-Consistency

The fundamental question is what percentage of the random displacement values are likely to fall into the interval between the minimum and maximum values (min-max interval) and whether the value that can be taken at a given level from the “expected” AER curves is an unbiased estimation of the mean displacement. In the studied case, the probability density function is not defined a priori.
First, investigate the percentage of displacements within the calculated minimum and maximum values interval. Since the negative displacements do not make sense, a truncated normal distribution or a lognormal distribution is a reasonable assumption. However, assuming normal distribution X ~ N ( μ , σ 2 ) with σ μ , X is rarely negative. Therefore, as a first assumption, the normal distribution is used with the expected value for the mean μ and half of the difference between the expected and maximum values for σ . Figure 9 shows the density functions calculated for site position cases at x s / F L = 0.1 and x s / F L = 0.5 and for the ~10−6/a and ~10−7/a levels. The parameters of the density functions are shown in Table 4.
Setting z = ( D D e x p e c t e d ) / σ = 1.96 for the standard normal distribution, it can be concluded that more than the 95% of possible values fall within the calculated minimum and maximum interval except the case at x s / F L = 0.5 and a level of ~10−6/a, where more than 90% but slightly less than 95% of values fall in the min−max interval ( z = 1.69 for D m i n = 0.26   c m , but z = 2 for D m a x = 7   c m ). Consequently, if the decision on the safety significance should be made using the mean displacement and the min−max interval at a 10−7/a hazard level, the expected value and the maximum and minimum values calculated by the proposed improved engineering hazard evaluation method are of high confidence.

5. Conclusions

The presented research and the earlier efforts in [2,3,4,5] aimed to assess the safety relevance of the fault displacement hazard due to the fault beneath the plant that is presumably reactivated during the Late Pleistocene period. Apart from the PSHA developed for the site located in an area with diffuse seismicity, the accurately mapped geometry of the fault, the seismogenic depth and a guess for the magnitude of 20 ka old the events could be accounted for the development of a case-specific hazard evaluation method.
The presented research aimed to eliminate the conservativeness of the earlier method versions. The definition of the fault parameters based on the parameters of the PSHA models was already published in [5]. The new methodological elements are the screening method for the ruptures affecting the site, the calculation of the probability of intersections and the position of the initial point of the rupture as well as the length of the rupture relative to the site on-fault location.
The improved engineering fault displacement hazard evaluation method represents the current state of the research, which was initiated by the Paks Nuclear Power Plant case. This method allows for a realistic estimation of hazard levels ranging from 10−4/a to 10−7/a, which are crucial for ensuring the safety of the nuclear power plant.
The research related to the fault displacement hazard issue for the Paks site was satisfactorily resolved and completed. However, it will continue in several directions.
The assurance regarding the negligibility of the fault displacement hazard at the Paks site could be increased in the future, considering the latest research effort in evaluating the paleoseismic manifestations of fault activity, e.g., [40,41,42,43], especially the results of assessing source parameters and neotectonic implications in low-to-moderate seismicity regions, as seen in [44]. These aspects of the fault displacement issue have not been considered in the recent paper, but they could be part of the following safety review of the Paks NPP.
The validation of the proposed methodology and all other fault displacement hazard evaluation methods depends on the accumulation of empirical evidence. The databases of observations and data evaluation achievements have great importance, e.g., [45].
Progress in developing methodologies for evaluating the fragility of nuclear power plant structures and other critical infrastructure should be considered in the future, e.g., [46].
The thorough methodology validation and investigation of methods for considering the site’s soft soil conditions in the surface displacement hazard evaluation are direct continuations of the research presented in the paper. It should be acknowledged that the proposed improved fault displacement hazard evaluation is simple and conservative but not universal. Nevertheless, its use could be beneficial in many cases.
The proposed simple conservative method’s value can be demonstrated by considering simplicity, engineering and urgency.
The preference for simplified and conservative engineering methods is always based on the time factor and sometimes on the expenses. However, it is important to note that these methods can often lead to significant cost savings in the long run.
Decision-making regarding the safety and operation of hazardous facilities is complex, and engineers are contributing to the decision; their ethical imperative is to provide a solid technical basis for the decisions in the shortest time possible. In the case of the Fukushima Dai-ichi plant, TEPCO’s delay in enforcing the tsunami embankment with the excuse of performing a more sophisticated tsunami hazard evaluation led to tragic consequences [47]. A safety improvement based on a simple conservative guess would cost much less than the whole plant’s loss, not to mention the losses to the entire Japanese nuclear industry, the affected population and the economy.
Urgency is a practical issue. It could be associated with engineering research, but it is difficult to dictate to science. Urgency in scientific research and cognition appears concerning climate change and the development of COVID-19 vaccination.
The word “engineering” is attributed in the title to distinguish engineering research and solutions from scientific ones. Engineering methods are applications of scientifically derived principles to solve problems in practical situations. Engineering research does not desire to find universal truths, but it aims to find ideas and techniques for problem-solving that are valid in specific but not all circumstances [48]. On the other hand, the severe accidents of engineered structures (Chernobyl and Fukushima reactor accidents, the Seveso disaster or lately, the Baltimore Bridge collapse and several other fatal cases) oblige the designers and operators of hazardous facilities to minimise the harm to people and the environment due to their facilities and activities. The law and regulation and the ethics of engineering require this responsible attitude.
Even if the proposed method is not universal or applicable under specific circumstances, the concept and approach to solving a complex hazard evaluation problem deserve attention.

Funding

This research received no external funding.

Institutional Review Board Statement

Not applicable.

Informed Consent Statement

Not applicable.

Data Availability Statement

The original contributions presented in the study are included in the article; further inquiries can be directed to the corresponding author.

Conflicts of Interest

The authors declare no conflicts of interest.

References

  1. World Nuclear News, Tsuruga 2 Sits on Active Fault, NRA Concludes, 26 March 2015. Available online: https://www.world-nuclear-news.org/RS-Tsuruga-2-sits-on-active-fault-NRA-concludes-2603155.html (accessed on 7 December 2023).
  2. U.S. Nuclear Regulatory Commission (NRC). Confirmatory Analysis of Seismic Hazard at Diablo Canyon Power Plant from the Shoreline Fault Zone, Research Information Letter (RIL) 12-01, September, ML 121230035. 2012. Available online: https://www.nrc.gov/docs/ML1212/ML121230035.pdf (accessed on 7 August 2024).
  3. Katona, T.J. Safety of Nuclear Power Plants with Respect to the Fault Displacement Hazard. Appl. Sci. 2020, 10, 3624. [Google Scholar] [CrossRef]
  4. Katona, T.J.; Tóth, L.; Győri, E. Fault Displacement Hazard Analysis Based on Probabilistic Seismic Hazard Analysis for Specific Nuclear Sites. Appl. Sci. 2021, 11, 7162. [Google Scholar] [CrossRef]
  5. Katona, T.J. Conservative Evaluation of Fault Displacement Hazard for a Nuclear Site in Case of Insufficient Data on the Fault Activity. Geosciences 2024, 14, 158. [Google Scholar] [CrossRef]
  6. Testa, A.; Boncio, P.; Pace, B.; Mirabella, F.; Pauselli, C.; Ercoli, M.; Auciello, E.; Visini, F.; Baize, S. Probabilistic Fault Displacement Hazard Analysis in Extensional Settings: Application to a Strategic Dam and Methodological Implications. Available online: https://ssrn.com/abstract=4693228 (accessed on 7 August 2024).
  7. Thompson, S.; Madugo, C.; Lewandowski, N.; Lindvall, S.; Ingemansson, B.; Ketabdar, M. Fault displacement hazard analysis methods and strategies for pipelines. In Proceedings of the 11th National Conference in Earthquake Engineering, Earthquake Engineering Research Institute, Los Angeles, CA, USA, 25–29 June 2018. [Google Scholar]
  8. Thompson, S. Fault Displacement Hazard Characterization for OpenSRA, California Energy Commission, 2021. Available online: https://peer.berkeley.edu/sites/default/files/cec_fault_displacement_hazard_report_final-draft_2021-02-26_web.pdf (accessed on 7 August 2024).
  9. Jonathan, B.; Norman, A.; Jennie, W.-L.; Largent, M. Performance-Based Earthquake Engineering Assessment Tool for Gas Storage and Pipeline Systems, California Energy Commission, 2020, Publication Number: CEC-500-2024-038. Available online: https://www.energy.ca.gov/sites/default/files/2024-05/CEC-500-2024-038.pdf (accessed on 7 August 2024).
  10. Triantafyllaki, A.; Loukidis, D.; Papanastasiou, P. Design of offshore gas pipelines against active tectonic fault movement. Soil Dyn. Earthq. Eng. 2023, 166, 107702. [Google Scholar] [CrossRef]
  11. Fault Hazard Analysis and Mitigation Guidelines, TECHNICAL MEMORANDUM, TM 2.10.6 Prepared by Parsons Brinckerhoff (Fletcher Waggoner and Kevin Coppersmith), California High-Speed Train Project, 2014. Available online: https://hsr.ca.gov/wp-content/uploads/docs/programs/eir_memos/Proj_Guidelines_TM2_10_6R01.pdf (accessed on 7 August 2024).
  12. Li, F.; Hsiao, E.; Lifton, Z.; Hull, A. A Simplified Probabilistic Fault Displacement Hazard Analysis Procedure: Application to the Seattle Fault Zone, Washington, USA. In Proceedings of the 6th International Conference on Earthquake Geotechnical Engineering, Christchurch, New Zealand, 1–4 November 2015; Available online: https://www.issmge.org/uploads/publications/59/60/179.00_Li.pdf (accessed on 7 August 2024).
  13. Stepp, J.C.; Wong, I.; Whitney, J.; Quittmeyer, R.; Abrahamson, N.; Toro, G.; Robert, Y.; Kevin, C.; Jean, S.; Tim, S. Probabilistic Seismic Hazard Analyses for Ground Motions and Fault Displacement at Yucca Mountain, Nevada. Earthq. Spectra 2001, 17, 113–151. [Google Scholar] [CrossRef]
  14. U.S. NRC NUREG/CR-6372, Volume 1 Recommendations for Probabilistic Seismic Hazard Analysis: Guidance on Uncertainty and Use of Experts: Main Report. Available online: https://www.nrc.gov/reading-rm/doc-collections/nuregs/contract/cr6372/vol1/index.html (accessed on 7 August 2024).
  15. Faulds, J.E.; Koehler, R.D.; Smith, K.D.; Kreemer, C.; Hammond, W.C.; de Polol, C.M.; Kent, G. Preliminary Scoping Report of Previous Geologic, Paleoseismic, Seismic, and Geodetic Studies at Yucca Mountain, Nevada: Implications for Understanding Seismic Hazards at the Proposed High-Level Nuclear Waste Repository, 2020. Available online: https://anp.nv.gov/uploadedFiles/nucwastenvgov/content/HotTopics/NBMG_Preliminary_Scoping_Report_2020_Final-ADA.pdf (accessed on 7 August 2024).
  16. Rizzo, P.C. Technical Report, Probabilistic Fault Displacement Hazard Analysis, Krško East and West Sites, Proposed Krško 2 Nuclear Power Plant, Krško, Slovenia, 1st ed.; Paul, C., Ed.; Rizzo Associates, Inc.: Pittsburgh, PA, USA, 2013. [Google Scholar]
  17. Quittmeyer, R.C. Probabilistic Fault Displacement Hazard Analysis for Regulatory Decision-Making: A Case-Study for Krško. In Proceedings of the International Topical Meeting on Probabilistic Safety Assessment and Analysis (PSA 2017), Pittsburgh, PA, USA, 24–28 September 2017; Curran Associates, Inc.: Red Hook, NY, USA, 2017; Volume I, pp. 182–192. [Google Scholar]
  18. ANSI-ANS-2.30-2015; Criteria for Assessing Tectonic Surface Fault Rupture and Deformation at Nuclear Facilities. American Nuclear Society: La Grange Park, IL, USA, 2015. Available online: https://webstore.ansi.org/standards/ansi/ansians302015 (accessed on 12 May 2021).
  19. JANSI-FDE-03 rev.1. Assessment Methods for Nuclear Power Plant against Fault Displacement, (Provisional Translation of Main Text), September 2013, On-Site Fault Assessment Method Review Committee, Japan Nuclear Safety Institute. Available online: http://www.genanshin.jp/archive/sitefault/data/JANSI-FDE-03r1.pdf (accessed on 29 September 2014).
  20. Sawada, M.; Haba, K.; Fujita, K.; Ichimura, T.; Hori, M. “Simulation of Surface Fault Displacement Using a Multiscale Finite Element Method” Transactions; SMiRT-26: Berlin/Potsdam, Germany, 2022; Division IV. [Google Scholar]
  21. Ryusuke, H.; Yoshinori, M.; Toshiaki, S.; Ayumi, Y.; Hideaki, T.; Yuji, N.; Katsumi, E. “Development of The Methodology for Fault Displacement Fragility Evaluation” Transactions; SMiRT-25: Charlotte, NC, USA, 2019; Division VII. [Google Scholar]
  22. Haraguchi, R.; Tanaka, F.; Ebisawa, K.; Sakai, T.; Tsutsumi, H.; Yuyama, A.; Sato, K.; Mihara, Y.; Nikaido, Y.; Yoshida, S. Development of fault displacement PRA methodology and its application to a hypothetical NPP. Nucl. Eng. Des. 2020, 361, 110433. [Google Scholar] [CrossRef]
  23. Valentini, A.; Fukushima, Y.; Contri, P.; Ono, M.; Sakai, T.; Thompson, S.C.; Viallet, E.; Annaka, T.; Chen, R.; Moss, R.E.S.; et al. Probabilistic fault displacement hazard assessment (PFDHA) for nuclear installations according to IAEA safety standards. Bull. Seismol. Soc. Am. 2021, 111, 2661–2672. [Google Scholar] [CrossRef]
  24. IAEA-TECDOC-1987; An Introduction to Probabilistic Fault Displacement Hazard Analysis in Site Evaluation for Existing Nuclear Installations. International Atomic Energy Agency: Vienna, Austria, 2021.
  25. Youngs, R.R.; Arabasz, W.J.; Anderson, R.E.; Ramelli, A.R.; Ake, J.P.; Slemmons, D.B.; McCalpin, J.P.; Doser, D.I.; Fridrich, C.J.; Swan, F.H., III; et al. A Methodology for Probabilistic Fault Displacement Hazard Analysis 517 (PFDHA). Earthq. Spectra 2003, 19, 191–219. [Google Scholar] [CrossRef]
  26. Petersen, M.D.; Dawson, T.E.; Chen, R.; Cao, T.; Wills, C.J.; Schwartz, D.P.; Frankel, A.D. Fault displacement hazard for strike-slip faults. Bull. Seismol. Soc. Am. 2011, 101, 805–825. [Google Scholar] [CrossRef]
  27. Coppersmith, K.J.; Youngs, R.R. Data needs for probabilistic fault displacement hazard analysis. J. Geodyn. 2000, 29, 329–343. [Google Scholar] [CrossRef]
  28. Koroknai, B.; Wórum, G.; Tóth, T.; Koroknai, Z.; Fekete-Németh, V.; Kovács, G. Geological Deformations In The Pannonian Basin During The Neotectonic Phase: New Insights From The Latest Regional Mapping in Hungary. Earth-Sci. Rev. 2020, 211, 103411. [Google Scholar] [CrossRef]
  29. Hortváth, F.; Koroknai, B.; Tóth, T.; Wórum, G.; Konrád Gy Kádi, Z.; Kudó, I.; Hámori, Z.; Filipszki, P.; Németh, V.; Szántó, É.; et al. A “Kapos-vonal” középső szakaszának szerkezeti-mélyföldtani viszonyai és neotektonikai jellegei a legújabb geofizikai vizsgálatok tükrében. “Structural-geological and neotectonic features of the middle portion of the Kapos line based on the results of latest geophysical research”. Földtani Közlöny 2019, 149, 327–350. [Google Scholar] [CrossRef]
  30. Konrád, G.; Sebe, K.; Halász, A. Traces of late quaternary seismic activity in aeolian sand in the dunaszentgyörgy–harta fault zone, hungary|Késő negyedidőszaki szeizmikus aktivitás nyomai futóhomokban, a Dunaszentgyörgy–Hartai-vetőzónában. Földtani Közlöny 2021, 151, 179. [Google Scholar] [CrossRef]
  31. Melissianos, V.E.; Vamvatsikos, D.; Gantes, C.J. Performance Assessment of Buried Pipelines at Fault Crossings. Earthq. Spectra 2017, 33, 201–218. [Google Scholar] [CrossRef]
  32. Melissianos, V.E.; Danciu, L.; Vamvatsikos, D.; Basili, R. Fault displacement hazard estimation at lifeline–fault crossings: A simplified approach for engineering applications. Bull Earthq. Eng. 2023, 21, 4821–4849. [Google Scholar] [CrossRef]
  33. Chiou, B.S.J.; Chen, R.; Thomas, K.; Milliner, C.W.D.; Dawson, T.E.; Petersen, M.D. Surface Fault Displacement Models for Strike-Slip Faults; Report GIRS-2022-07; University of California: Los Angeles, CA, USA, 2023; p. 186. [Google Scholar] [CrossRef]
  34. Chen, R.; Petersen, M.D. Improved Implementation of Rupture Location Uncertainty in Fault Displacement Hazard Assessment. Bull. Seismol. Soc. Am. 2019, 109, 2132–2137. [Google Scholar] [CrossRef]
  35. Wells, D.L.; Coppersmith, K.J. New Empirical Relationships Among Magnitude, Rupture Length, Rupture Width, Rupture Area, and Surface Displacement. Bull. Seismol. Soc. Am. 1994, 84, 974. [Google Scholar] [CrossRef]
  36. Leonard, M. Self-Consistent Earthquake Fault-Scaling Relations: Update and Extension to Stable Continental Strike-Slip Faults. Bull. Seismol. Soc. Am. 2014, 104, 2953–2965. [Google Scholar] [CrossRef]
  37. Takao, M.; Tsuchiyama, J.; Annaka, T.; Kurit, T. Application of probabilistic fault displacement hazard analysis in Japan. J. Jpn. Assoc. Earthq. Eng. 2013, 13, 17–36. [Google Scholar] [CrossRef]
  38. Pizza, M.; Ferrario, M.F.; Thomas, F.; Tringali, G.; Livio, F. Likelihood of Primary Surface Faulting: Updating of Empirical Regressions. Bull. Seismol. Soc. Am. 2023, 113, 2106–2118. [Google Scholar] [CrossRef]
  39. Wells, D.L.; Coppersmith, K.J. Likelihood of surface rupture as a function of magnitude (abs.). Seismol. Res. Lett. 1993, 64, 54. [Google Scholar]
  40. Coffey, G.L.; Rollins, C.; Van Dissen, R.J.; Rhoades, D.A.; Gerstenberger, M.C.; Litchfield, N.J.; Thingbaijam, K.K.S. Paleoseismic Earthquake Recurrence Interval Derivation for the 2022 Revision of the New Zealand National Seismic Hazard Model. Seismol. Res. Lett. 2023, 95, 78–94. [Google Scholar] [CrossRef]
  41. Kamali, Z.; Nazari, H.; Rashidi, A.; Heyhat, M.R.; Khatib, M.M.; Derakhshani, R. Seismotectonics, Geomorphology and Paleoseismology of the Doroud Fault, a Source of Seismic Hazard in Zagros. Appl. Sci. 2023, 13, 3747. [Google Scholar] [CrossRef]
  42. Scott, C.; Kottke, A.; Madugo, C.; Arrowsmith, J.R.; Adam, R.; Zuckerman, M. Tectonic Landform and Lithologic Age Impact Uncertainties in Fault Displacement Hazard Models. Geophys. Res. Lett. 2024, 51, e2024GL109145. [Google Scholar] [CrossRef]
  43. Zaccagnino, D.; Telesca, L.; Doglioni, C. Scaling properties of seismicity and faulting. Earth Planet. Sci. Lett. 2022, 584, 117511. [Google Scholar] [CrossRef]
  44. Saikia, U.; David, D.M. Source parameter and tectonic implications of small earthquakes originating in South India. Phys. Earth Planet. Inter. 2024, 354, 107235. [Google Scholar] [CrossRef]
  45. Sarmiento, A.; Madugo, D.; Shen, A.; Dawson, T.; Madugo, C.; Thompson, S.; Bozorgnia, Y.; Baize, S.; Boncio, P.; Kottke, A.; et al. Database for the Fault Displacement Hazard Initiative Project. Earthq. Spectra 2024, 87552930241262766. [Google Scholar] [CrossRef]
  46. Urlainis, A.; Ornai, D.; Levy, R.; Vilnay, O.; Shohet, I.M. Loss and damage assessment in critical infrastructures due to extreme events. Saf. Sci. 2022, 147, 105587. [Google Scholar] [CrossRef]
  47. Michael, D. Three Nuclear Disasters and a Hurricane: Some Reflections on Engineering Ethics. J. Appl. Ethics Philos. 2012, 4, 1–10. [Google Scholar]
  48. McLaughlin, D. Engineering, Judgement and Engineering Judgement: A Proposed Definition. In Engineering and Philosophy. Philosophy of Engineering and Technology; Pirtle, Z., Tomblin, D., Madhavan, G., Eds.; Springer: Cham, Switzerland, 2021; Volume 37. [Google Scholar] [CrossRef]
Figure 1. Geometrical arrangement for off-fault sites (a) and on-fault sites (b) cases. Definitions of variables were used for characterising the rupture, position of the rupture along the mapped length of the fault, position of the site and the distance from the end of the fault to the initiating point of the rupture. The explanations are given on the drawings.
Applsci 14 08399 g001
Figure 2. Ruptures that contribute to the fault displacement hazard at a site located x s = 1 / 3 F L (a) and at x s = 1 / 2 F L (b).
Applsci 14 08399 g002
Figure 3. Plot of the geometrical relations between x i , x s , L and FL.
Applsci 14 08399 g003
Figure 4. Distribution of displacements versus relative coordinate x i / F L for a magnitude of 6.5 and the relative site locations x s / F L equal to 0.5, 0.38, 0.3, 0.2 and 0.1 separately. Numbers 1–5 indicate the expected displacements. The red dotted line is the average displacement given by Equation (4). The black dotted line is the displacement value used in [4]. The black dashed line is the maximum displacement according to the bilinear distribution.
Applsci 14 08399 g004
Figure 5. The conditional probability for magnitude exceedance (1-P(m)) and the probability of the non-zero surface rupture versus the magnitude.
Applsci 14 08399 g005
Figure 6. Hazard curves for the sites at x s = 0.1 × F L (a), x s = 0.3 × F L (b) and x s = 0.5 × F L (c). The green lines are the hazard curves for the expected site displacements. The dotted black and blue lines (Max and Min) represent the maximum and minimum curves contributing to the hazard. The red dashed lines (Dave) are the hazard curves obtained by Equation (4), neglecting the site position to the rupture. The black dashed lines (Old) are the hazard curves obtained by the method in [5]. The red dotted lines (Old+) are the hazard curves obtained by the method in [4] but with the same probability of site intersection as in the case of Dave.
Applsci 14 08399 g006
Figure 7. The AER curves of the contribution to the site hazard ruptures in the range of 0 x i x s for the site positions x s / F L = 0.2 (a) and x s / F L = 0.5 (b). The green lines refer to the AER of the expected displacement, and the dotted lines indicate the obtained maximum and minimum displacement AER curves.
Applsci 14 08399 g007
Figure 8. Estimates of the hazard curve for the Paks site showing the progress in developing simplified engineering hazard evaluation methods. The dashed green line is the result of the improved method, the continuous lines are the results of [3], the dashed black lines are the results of [4], and the dashed red line is the curve obtained by Equations (4) and (7).
Applsci 14 08399 g008
Figure 9. The displacement density functions calculated for site position cases at x s / F L = 0.1 and x s / F L = 0.5 and for the ~10−6/a, and ~10−7/a levels within the min−max interval.
Applsci 14 08399 g009
Table 1. Screening the contributing to the displacement hazard ruptures for a site at the middle of mapped fault length, depending on s = x i .
m1-P (m)L, kmxi = 0, xs = 0.5 × FL = 13.95 kmxi = 0.25 × FL, xs = 0.5 × FL
L If
xs > xi
0 If
xi + L < xs
0 If
xi + L > FL
TRUE If
All > 0
5.50.006964475.65.600FALSEFALSE
5.60.005364136.56.500FALSEFALSE
5.70.004112217.47.400FALSETRUE
5.80.003132868.58.500FALSETRUE
5.90.002366729.89.800FALSETRUE
60.0017673911.211.200FALSETRUE
6.10.0013404212.912.900FALSETRUE
6.20.0009317714.814.814.814.8TRUETRUE
6.30.0006448517171717TRUETRUE
6.40.0004204019.519.519.519.5TRUETRUE
6.50.0002448122.422.422.422.4TRUEFALSE
6.60.0001074525.725.725.725.7TRUEFALSE
6.7 0.0000400027.927.927.927.9TRUEFALSE
Table 2. Screening the contributing to the displacement hazard ruptures for a site at the x s / F L = 0.25 × F L of mapped fault length depending on the s = x i .
m1-P (m)L, kmxi = 0, xs = 0.25 × FL = 6.975 kmxi = 0.1 × FL, xs = 0.25 × FL
L If
xs > xi
0 If
xi + L < xs
0 If
xi + L > FL
TRUE
If All > 0
5.50.006964475.65.600FALSETRUE
5.60.005364136.56.500FALSETRUE
5.70.004112217.47.47.47.4TRUETRUE
5.80.003132868.58.58.58.5TRUETRUE
5.90.002366729.89.89.89.8TRUETRUE
60.0017673911.211.211.211.2TRUETRUE
6.10.0013404212.912.912.912.9TRUETRUE
6.20.0009317714.814.814.814.8TRUETRUE
6.30.0006448517171717TRUETRUE
6.40.0004204019.519.519.519.5TRUETRUE
6.50.0002448122.422.422.422.4TRUETRUE
6.60.0001074525.725.725.725.7TRUEFALSE
6.70.0000400027.927.927.927.9TRUEFALSE
Table 3. Elements of the validation.
Elements of the Validation of the Proposed Methodology
1Comparison with reference analysis or standardsThe number of published studies is limited, and the seismotectonic conditions radically differ from the Paks case.
Apart from the author’s studies, the only research on the fault displacement hazard for a site in the entire region (countries, Slovakia, Slovenia, Hungary) was made for a new Krško site in Slovenia [16,17]. The Krško site is at the periphery of the Pannonia Basin, significantly more active than the central part of the Basin. Contrary to the Paks site, specific empirical indications of fault displacements could be identified, e.g., characteristic stratigraphic horizons could be identified contrary to the Paks case.
Principal compliance could be stated by comparing some essential steps of the analysis process and the results for the Krško and Paks sites.
2Checking the self-confidenceIt is demonstrated below.
3A systematic assessment of the factors influencing the results and the effects of different modelling options.This is an inherent part of the methodology.
4Comparison of results achieved with other validated methods.Another study for the same site does not exist.
Therefore, in the future, either the recent method should be applied to a site analysed by another method and compared, assuming the other method is validated, or other methods qualified as proven should be used for the Paks site. For example, the use of the Caltrans method [12] seems to be feasible.
5Comparison with evidence and theoretical considerations on the neotectonics of the areaThe predicted hazard aligns with the evidence regarding the Pannonian Basin’s seismicity and surface fault displacement hazards.
Table 4. Parameters of the normal distribution density for selected site positions and hazard levels.
x s / F L   =   0.1 x s / F L   =   0.5
Hazard Level1.0 × 10−6/a2.19 × 10−7/a1.1 × 10−6/a2.25 × 10−7/a
D m i n 0.10 cm0.26 cm0.26 cm0.63 cm
D m a x 2.85 cm7.0 cm6.99 cm17.13 cm
μ 1.58 cm4.14 cm3.35 cm9.23 cm
σ 0.625 cm1.43 cm1.825 cm4.0 cm
Disclaimer/Publisher’s Note: The statements, opinions and data contained in all publications are solely those of the individual author(s) and contributor(s) and not of MDPI and/or the editor(s). MDPI and/or the editor(s) disclaim responsibility for any injury to people or property resulting from any ideas, methods, instructions or products referred to in the content.

