Abstract
Steel structures are vulnerable to fire due to the degradation of their mechanical properties at high temperatures, making it necessary to protect them when exposed to high temperatures. This paper presents the results of an experimental research work to characterise the mechanical properties of gypsum-based fire-resistant mortars with and without nano and micro silica particles by destructive and non-destructive tests at ambient temperature. Five compositions were studied: one commercial composition was used as a reference and four were developed in the laboratory. Two were based on gypsum with perlite or vermiculite, and the other two included nano and micro silica particles. Twenty specimens underwent ultrasonic pulse velocity, flexural, and compression tests, while five specimens were tested by the impulse excitation of vibration. Young’s modulus, shear modulus, and Poisson’s ratio were assessed by non-destructive tests, and the flexural and compression strengths were assessed by destructive tests. Additional tests included density and porosity assessments, thermogravimetric analysis, X-ray diffraction, and scanning electron microscopy. Results indicated that adding nano and micro silica particles posed challenges to the mechanical and physical properties. Despite this, vermiculite compositions showcased superior or similar properties to the commercial composition, while perlite compositions exhibited slightly lower properties.
1. Introduction
Widely used in structural design for their many valuable benefits, such as high strength, low weight, ductility, fast construction, and sustainability, steel members are nonetheless highly vulnerable to fire [1,2,3]. When heated, steel undergoes a rapid degradation of strength and elastic modulus, which may lead to a fast and uncontrolled collapse; therefore, it needs to use a fire protection system to decrease the heating rate of the steel members, consequently reducing material property loss and complying with existing standards [4,5]. In the general context of fire safety, the critical temperature for such members is generally regarded to range from 450 to 550 °C; in other words, it is the range of temperature at which the structural steel’s design resistance equals the design effect of accidental actions [6,7].
According to EN 1993-1-2 [8], the heating rate of steel members depends, beyond the fire’s characteristics, upon the material’s surface/volume ratio and its thermal and mechanical behaviour. This is explained by: (i) heat is transferred from molecule to molecule; therefore, heat spread is decreased as the material’s contact area reduces and its thickness increases; (ii) thermal conductivity, specific heat, and specific weight directly affect the heat transfer process as the velocity of heating is directly proportional to the first and inversely proportional to the specific heat and weight; and (iii) the material has to resist thermal actions and plastic deformations, as much as possible, to ensure the stability and homogeneity needed to perform its expected insulating function during the fire event. In previous research [9], a large group of mortars was developed and studied, aiming to select the ones with the best thermal behaviour and compare them with the best commercial composition (C). The specimens were subjected to two types of tests: (i) an experimental test to analyse the influence of expanded perlite’s and expanded vermiculite’s grain size on the thermal performance of laboratory-developed mortars and (ii) an experimental programme of tests carried out on steel square section S355 columns protected by the mortars in the study, under an ISO 834 fire condition and subjected to a preload of 50% of the design value of the load-bearing capacity of the columns at ambient temperature (ULS) [9]. In the end, the best-developed mortar compositions were selected: gypsum as a binder and expanded perlite or vermiculite as aggregates.
The main advantage of adding these two minerals is their good insulation properties owing to their highly porous nature. However, due to their porous and lightweight nature, their addition drastically modifies the mortar’s mechanical characteristics, reducing its compressive and flexural strengths compared to plain cement/gypsum mortars [10].
Several studies [11,12,13,14,15,16] have shown that the addition of nanomaterials, including nano silica, can improve the mechanical properties of cementitious materials. Despite the knowledge of nano silica in cement-based compositions, its addition to gypsum-based mortars is still poorly understood. Therefore, it is important to study the materials mentioned above to understand their importance and effect on the composition of passive fire protection mortars. Some previous studies have followed the statements mentioned above:
Laím et al. [11] concluded that gypsum-based mortars have better thermal properties than cement. However, it has low strength and poor toughness; moreover, when perlite or vermiculite is added as aggregates, the thermal properties increase, but the mortar’s mechanical properties decrease even more.
Mo et al. [10] studied the effects of expanded vermiculite in cement-based mortar. Three types of compositions were produced, one of them constituted by cement and sand, and the other two by different amounts of vermiculite added into the cement/sand solution, always with equal water-to-cement ratios. Compressive tests were carried out, and it was observed that the cement/sand mortar had a strength value 99% higher than that of the composition with the smallest amount of vermiculite and 173% higher than that of the composition with the highest amount of aggregate.
Köksal et al. [17] evaluated the effect of expanded vermiculite on the properties of lightweight mortar. Three different compositions were produced, and it was expected that the ones with a higher amount of aggregate would lead to lower velocities due to the high amount of air inside the voids. The results confirmed this: the composition with the lower content of vermiculite had a velocity around 11% and 21% higher than the other two, respectively.
The same authors also assessed the combined effect of silica fume and expanded vermiculite on the properties of lightweight mortars [18], developing twelve compositions, each with different contents of cement to vermiculite. Through ultrasonic pulse velocity tests and flexural and compression tests, it was clear that samples with smaller quantities of vermiculite presented enhanced strengths and homogeneity.
Köksal et al. [17,18] confirmed the conclusions of Gencel et al. [19]; they studied the replacement of natural sand with expanded vermiculite in mortars, developing compositions with different contents of binder and expanded vermiculite, and submitting the specimens to ultrasonic pulse velocity tests. The compositions without vermiculite added had an ultrasonic pulse velocity of 2800 m/s; the 15% vermiculite by weight composition had a velocity of 2660 m/s, and the 30% vermiculite by weight composition had a velocity of 2330 m/s. Hasanabadi et al. [20] assessed the influence of the introduction of expanded perlite and paraffin into cement-based compositions. Nine cubic samples were tested under compression at 28 days of age. It was concluded that the addition of lightweight aggregates leads to a decrease of about 60% in the compression strength of the compositions.
Gomes et al. [21] studied mortar compositions’ mineralogical and mechanical properties. They found that plain gypsum mortar had a mean Young’s modulus of 4.006 GPa, flexural strength of 2.48 MPa, and compressive strength of 4.75 MPa. Babu et al. [22] obtained similar results for plain gypsum reference mortar. Sánchez-Aparicio et al. [23] developed a high-fired plain gypsum mortar with Young’s modulus ranging from 2.21 to 4.28 GPa and compressive strength ranging from 3.57 to 4.53 MPa.
Rahmanian [24] compared two gypsum panels with moduli of 1.57 and 2.37 GPa. Laím et al. [11] found that adding nano and micro silica to cementitious materials decreases porosity, increases durability, activates pozzolanic reactions, and improves microstructure by reducing portlandite crystal size. Synthesising the above information, (i) the use of vermiculite and/or perlite as lightweight aggregates of fire-proof mortars improves the thermal insulation of gypsum-based mortars; however, it reduces their mechanical properties, and (ii) the effects of the addition of nano and micro silica particles on cement-based mortars are already well known; however, the behaviour of gypsum-based mortars is unknown.
In this context, experimental work has been carried out at the University of Coimbra to characterise the mechanical properties of gypsum-based mortars but with the addition of nano and micro silica particles because they improve thermal performance.
2. Materials and Methods
2.1. Materials and Compositions
Based on a previous experimental campaign [9], it was possible to identify two laboratory-developed mortars with the best thermal performances (P and V) and the best commercial passive fire protection used as the reference composition (C). With the addition of nano and micro silica, two other compositions were developed: P.NMS and V.NMS. The following materials were used in the compositions of the mortars: commercial passive protection solution (CPPS), gypsum powder (GP), expanded vermiculite (EV), expanded perlite (EP), silica microparticles with an average diameter of 1000 nm (MS), silica nanoparticles with an average diameter of 200 nm (NS), and water (W). Vermiculite (V) and perlite (P) were used as fillers in the powder form. The particle size of these raw materials was assessed using a particle size test (specification LNEC E 195-1966), revealing that the particle sizes ranged from 0.025 mm to 0.400 mm. Silica micro and nanoparticles were synthesised in the laboratory according to the procedure described by Vaz-Ramos et al. [25]. Table 1 presents the composition of the mortars in volume.

Table 1.
Composition of the selected mortars: amount of materials in volume (%).
2.2. Experimental Programme
The experimental programme included four different tests (non-destructive and destructive tests) to characterise the mortars’ mechanical properties: (i) an ultrasonic pulse velocity (UPV) test and (ii) an impulse excitation of vibration (IEV) test, as non-destructive tests, and (iii) flexural (FL) and (iv) compression (CP) tests, as destructive tests. Complementary tests were used to assess the density and porosity, as well as thermogravimetric analysis, X-ray diffraction, and scanning electron microscopy.
The non-destructive programme characterised the Young’s modulus, shear modulus, and Poisson’s ratio of the mortars through UPV and IEV tests. Two specimens followed each standard recommendation: a 160 mm × 40 mm × 40 mm specimen was used in the UPV tests and a 200 mm × 100 mm × 20 mm specimen in the IEV tests. The flexural and compression strengths of the mortars were determined using destructive tests. According to standard recommendations, a 160 mm × 40 mm × 40 mm specimen was subjected to the flexural test. After its collapse, it was divided into two 80 mm × 40 mm × 40 mm halves and subjected to a compression test. Three specimens were tested for each series to obtain a better correlation of the results.
2.3. Preparation of the Specimens
The specimen preparation procedure followed the recommendations of EN 12390 [26] and EN 1015-11 [27] standards from flexural and compression tests, respectively. The procedure adopted in the fabrication of the mortars was as follows:
- The raw materials were weighed and placed inside a mixer container.
- Then, the mixer was operated for 5 min at a slow speed (136 rotations per minute). At the same time, the corresponding amount of water was added with a constant flow rate to guarantee the homogeneous addition of water to the whole mortar. Previously, the NMS activation was required. For this purpose, 2.4 g of NMS particles were placed in a 45 millilitres water solution and subjected to ultrasounds for twelve hours using Retsh equipment.
- After this procedure, the mortar was manually kneaded with a spatula to remove parts of the mortar that were on the walls of the container and thus homogenise the mixture, which was then returned to the container for another 2 min.
- The mortar was then placed inside the mould.
A total of five specimens were cast in a 200 mm × 100 mm × 20 mm steel mould and a 160 mm × 40 mm × 40 mm steel mould. The mixtures were placed inside the mould, compacted by manual vibration, and the upper faces were cleaned up and flattened. Forty-eight hours post-casting, the specimens were demoulded and subjected to a curing process within a laboratory setting, characterised by controlled conditions featuring a temperature of 25 °C and relative humidity (RH) of 55%, which persisted until the specimens reached an age of six months. All mixtures were produced on the same day to mitigate the potential influence of temperature and humidity on the properties of each mortar composition. The specimens were subjected to experimental tests after six months of age. For complementary SEM analysis (Hitachi SU3800), care was taken to polish the samples with fine paper to avoid filling the pores with particles. To obtain clear images and proceed to the analysis, the samples were coated with a 4 nm layer of gold, as the granules are nonconductive in a vacuum.
2.4. Experimental Testing System and Procedure
2.4.1. Complementary Tests
Density and Porosity Measurements
The density and porosity of the mortars were measured according to ASTM C20-00 [28] and ISO/DIS 15901-1 [29]. For density determination, a precision scale with 0.01 g accuracy and an electronic pachymeter with 0.01 mm resolution were used. Porosity was assessed using Mercury Intrusion Porosimetry (MIP), with a contact angle of 140°, a surface tension of 480 mN/m, and a pressure range from 0.5 to 3300 psi.
Thermogravimetric Analysis (TGA)
Thermogravimetric Analysis (TGA) was conducted to measure the mass loss as a function of temperature. Powder samples were heated from room temperature to 1000 °C at a rate of 10 °C/min in an air atmosphere using a NETZSCH TG 209F1 Libra apparatus (NETZSCH-Gerätebau GmbH (Wittelsbacherstraße 42 95100 Selb Germany)).
X-ray Diffraction (XRD) and Scanning Electron Microscopy (SEM)
Crystalline phases were identified using X-ray diffraction (XRD) with a Philips X’Pert–MPD diffractometer. The analysis employed cobalt (Kα1 = 1.78897 Å) radiation, with a step size of 0.025° and a dwell time of 2 s per step over a 2θ range of 4° to 100°. The morphology and microstructure of the mortars were examined using a HITACHI SU3800 Scanning Electron Microscope (Toranomon Hills Business Tower 1-17-1 Toranomon, Minato-ku, Tokyo 105-6409, Japan).
2.4.2. Non-Destructive Tests
The UPV tests collected the propagation velocities of the compression and shear waves by inducing the specimen to repetitive pulses with a pulse generator. The tests were carried out according to ASTM D 2845-05 [30] recommendations, and Pundit Lab equipment was used. The IEV tests were carried out using PICO equipment according to ASTM E 1876-01 [31] standard recommendations.
The experimental test involved inducing manual excitation by a singular strike by an impulse (in this case, a steel sphere glued to the end of a flexible polymer rod) to obtain the specimens’ mechanical resonant frequencies. Both tests had the same objective: to determine the specimens’ dynamic properties. The properties were calculated through normalised equations defined in both standards.
The elastic constants determined by the UPV test method are ultrasonic since the pulse frequencies are above the audible range. Therefore, they may differ from those determined by other dynamic methods. These two different dynamic tests were carried out redundantly for more accurate results.
Ultrasonic Pulse Velocity Test
Under the aforementioned standard recommendations, the experimental testing system setup is represented in Figure 1.
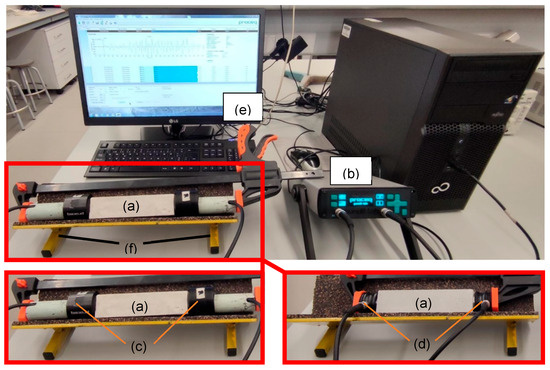
Figure 1.
UPV test setup: (a) specimen, (b) pulse generator and display unit, (c) longitudinal wave transducer, (d) shear wave transducer, (e) computer and (f) support system.
It consisted of a 160 mm × 40 mm × 40 mm specimen (a); a pulse generator (b) to apply pulses with variable widths repeatedly on the specimen; two types of transducers, a 54 kHz capacity (c) for determining the P waves (longitudinal or primary waves, Vp) and a 1 MHz capacity (d) to determine the S waves (shear or secondary waves, Vs), both consisting of a transmitter that converts electrical pulses into mechanical pulses and a receiver that converts mechanical pulses into electrical pulses; a computer (e) that contains the equipment’s software which displays the on-time readings, the graph and its parameters; and supports (f) to accommodate the specimen in the correct position. It is important to note that the energy transmission between the transducer element and test specimen was improved by lapping the surfaces of the face plates to make them smooth, flat, and parallel, and by coupling the transducer element to the face plate using a thin layer of Vaseline gel and a coupling medium.
Impulse Excitation of Vibration Test
The IEV test method is appropriate for determining the moduli of elastic, homogeneous, and isotropic materials. The specimen’s dimensions differ from those of the other tests due to its standard recommendation, which indicates a minimum ratio of width to thickness of five. This ratio minimises experimental difficulties during shear modulus measurement. The experimental testing system consisted of a 200 mm × 100 mm × 20 mm mortar specimen, an impulser, a piezoelectric transducer with an 8 kHz frequency range to detect and transport the frequency waves, an electronic system to amplify, read and analyse signals received, a computer to display the waves that determine the frequencies and two supports: support for the longitudinal frequency measurement and the torsional frequency measurement. The first support system consisted of two supports spaced by 0.224L (L being the specimen’s length) from the borders. The second support system consisted of a cross-shaped support at the specimen’s length and width midpoint. The transducer location was set appropriately to measure the desired vibration mode following the standard recommendation. Special care was taken to ensure that the transducer’s location remained similar within multiple readings as well as the force used on the impulser.
2.4.3. Destructive Tests
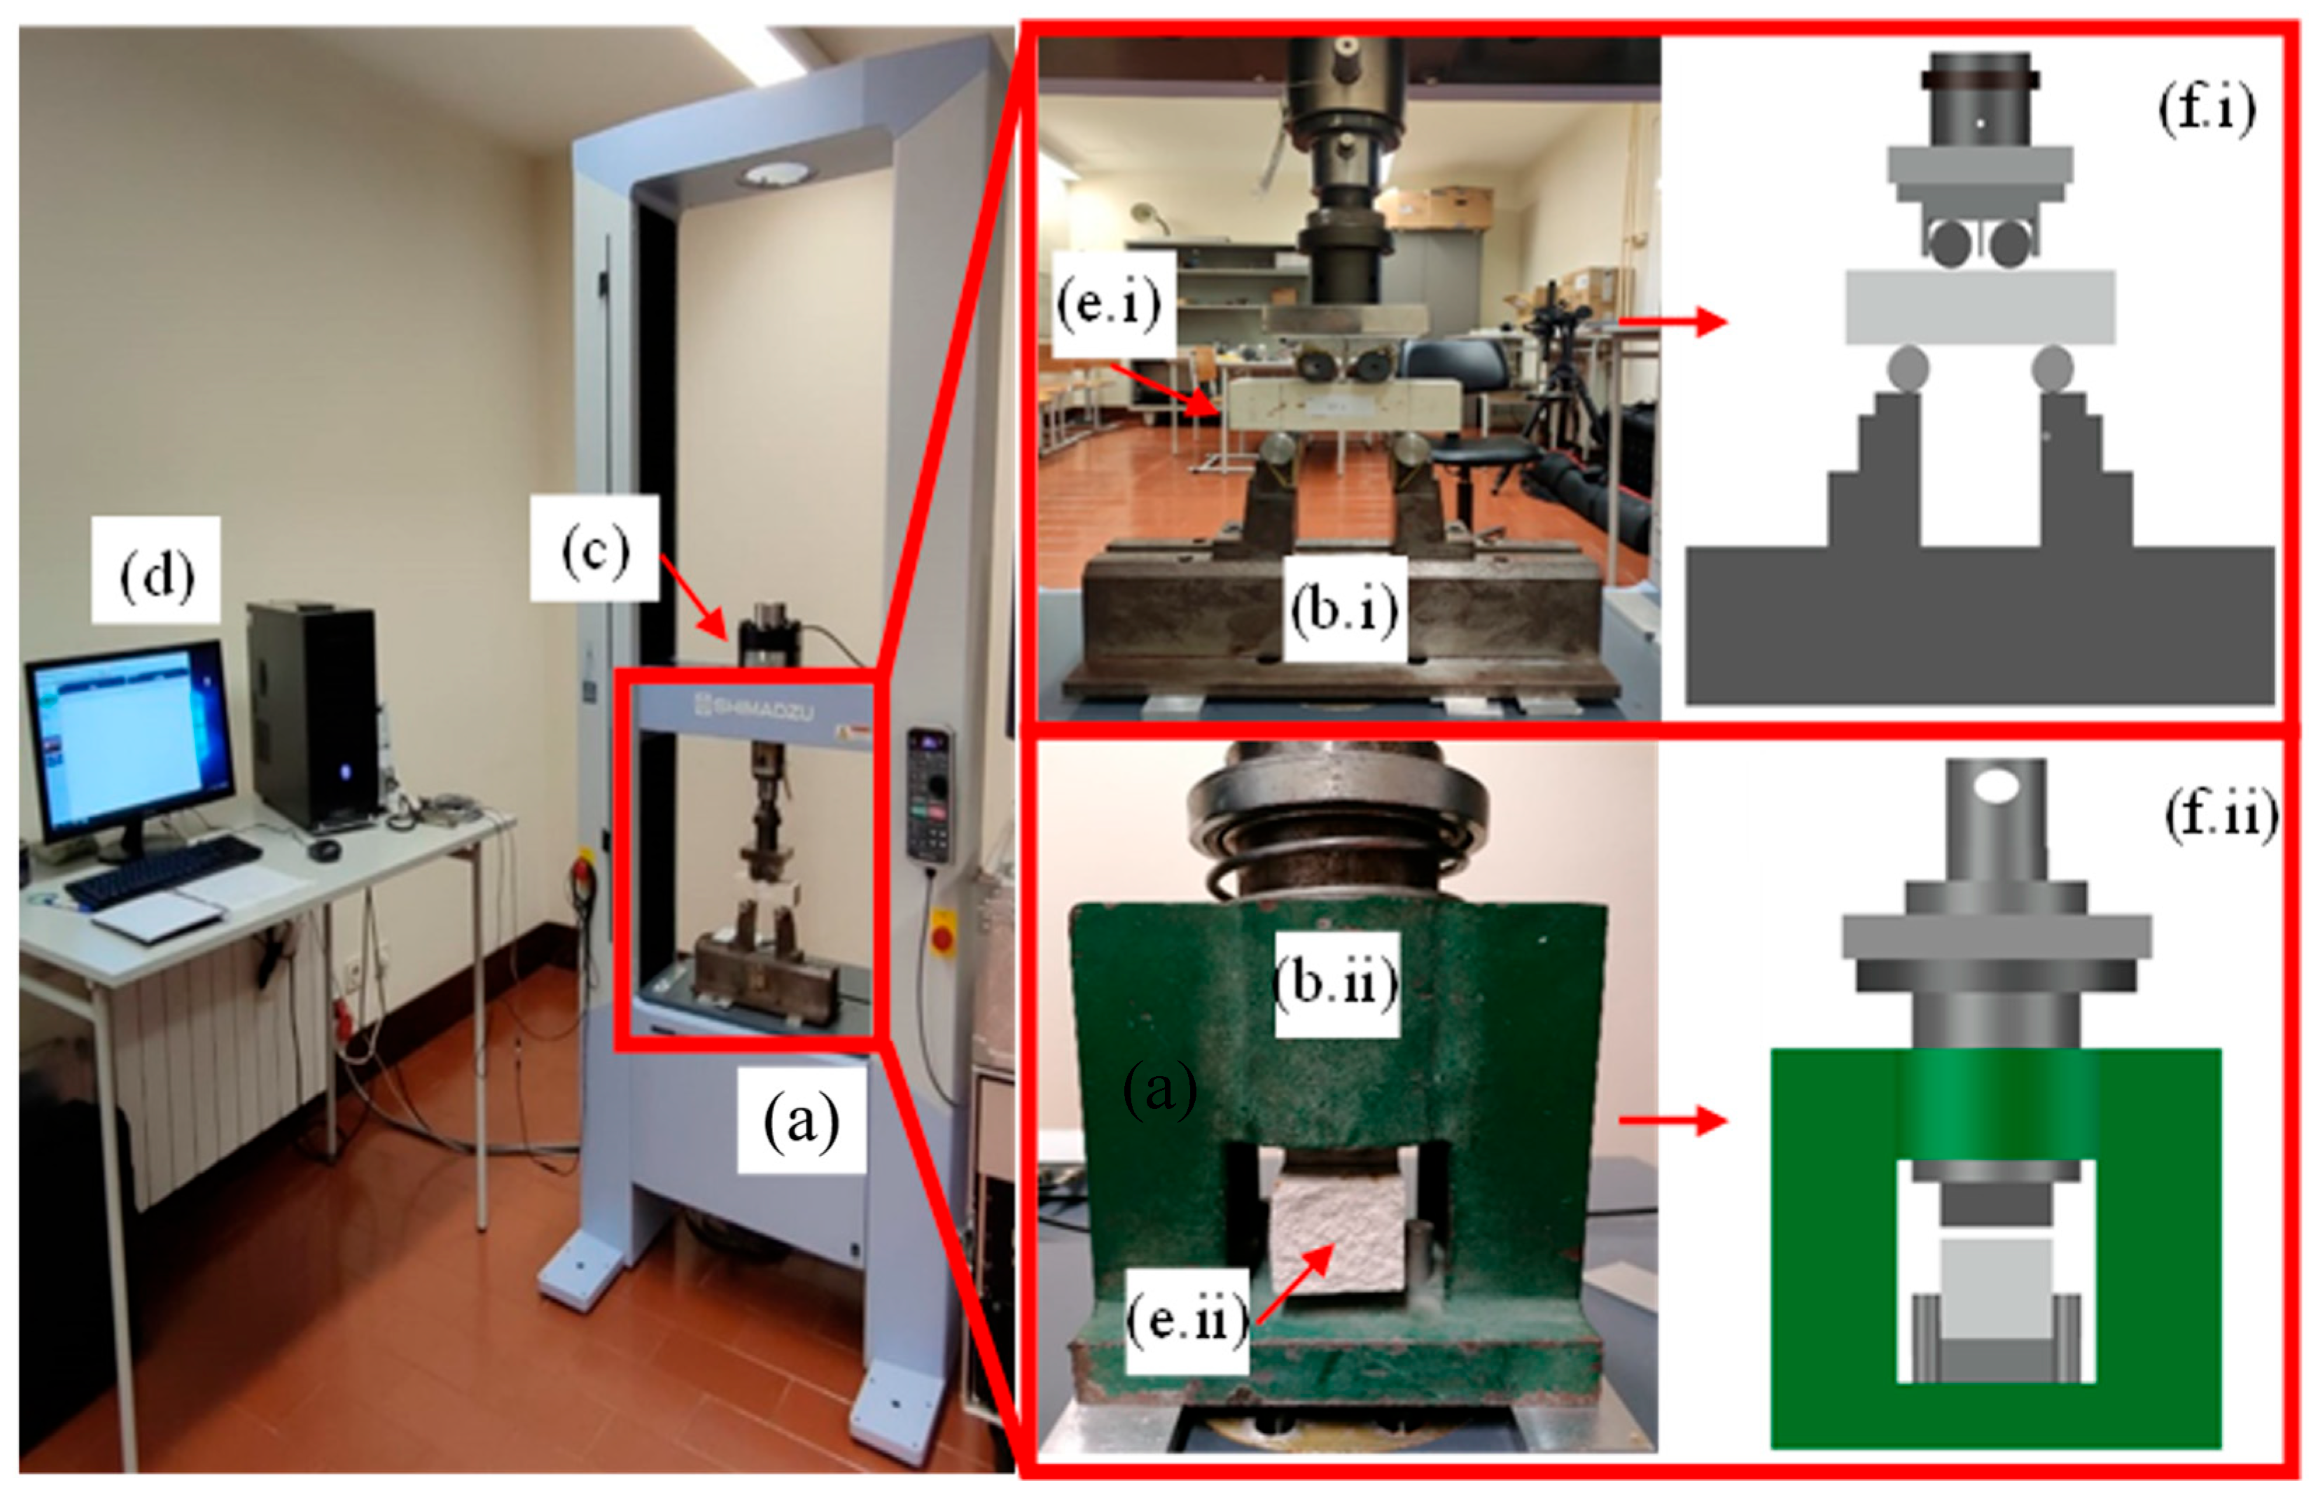
Destructive tests were performed using a SHIMADZU Autograph AGS-X 100 kN compression-tensile machine. The flexural test followed the European standard EN 12390-5 [26] and the compression test EN 1015-11 [27]. A constant displacement of 0.001 mm/s was applied to the specimen, and the computer registered the force (N) needed to generate this displacement. The test ended when no greater load could be sustained (collapse). The maximum loads recorded are the outputs needed to determine the flexural and compression strengths, following normalised equations’ respective standards. The experimental testing system (Figure 2) consisted of a compression-tensile machine of 100 kN capacity (a), two types of support systems (b.i and b.ii) for each test, a load cell (c), a computer (d) equipped with the machine’s software for data acquisition, and 160 mm × 40 mm × 40 mm (e.i) and 80 mm × 40 mm × 40 mm (e.ii) test specimens in the flexural and compression tests, respectively. In addition, a schematic representation of both support systems (f.i and f.ii) is shown for better visualisation.
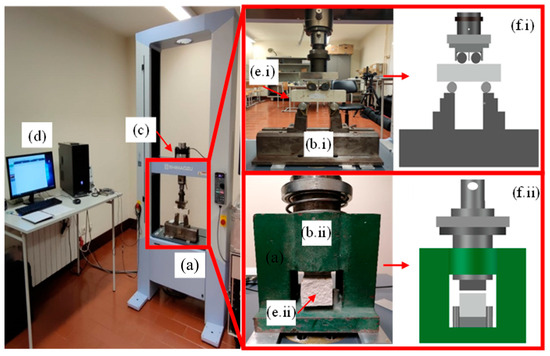
Figure 2.
Schematic representation of the experimental test setup for both destructive tests: (a) machine “SHIMADZU”; (b.i) flexural test support system, (b.ii) compression test support system, (c) load cell; (d) computer, (e.i) flexural and (e.ii) compression test specimens and, (f.i) flexural and (f.ii) compression support system representation.
Flexural Test
The support system consisted of two supporting rollers (at the bottom) and two upper rollers, equally dividing the load applied by the machine. Three rollers, including the two upper rollers, could rotate freely around their axes and were inclined in a plane normal to the longitudinal axis of the test specimen. These support conditions reduce the friction forces between the rollers and the specimen. The distance between the outer rollers was 120 mm and the distance between the inner rollers was 40 mm. The specimens’ surfaces were cleaned up to eliminate other particles and avoid additional friction resistance. Before and during the procedure, all vertical planes of the supports were parallel, while the specimen’s and the load cell’s geometric centres were aligned.
Compression Test
The support system was defined by a hollow steel rectangular box (160 mm × 120 mm × 215 mm) opened on two parallel sides and equipped with a 40 mm square section piston on the top, pushed by the load cell that transferred the load as pressure to the specimen. The tests were carried out on each half of the specimens subsequent to the breakage after the flexural test. All surfaces were cleaned up to avoid additional friction resistance, the specimen’s and piston’s geometric centres were aligned, and the load was applied to the specimen’s face cast against the face of the mould.
3. Results and Discussion
3.1. Complementary Tests
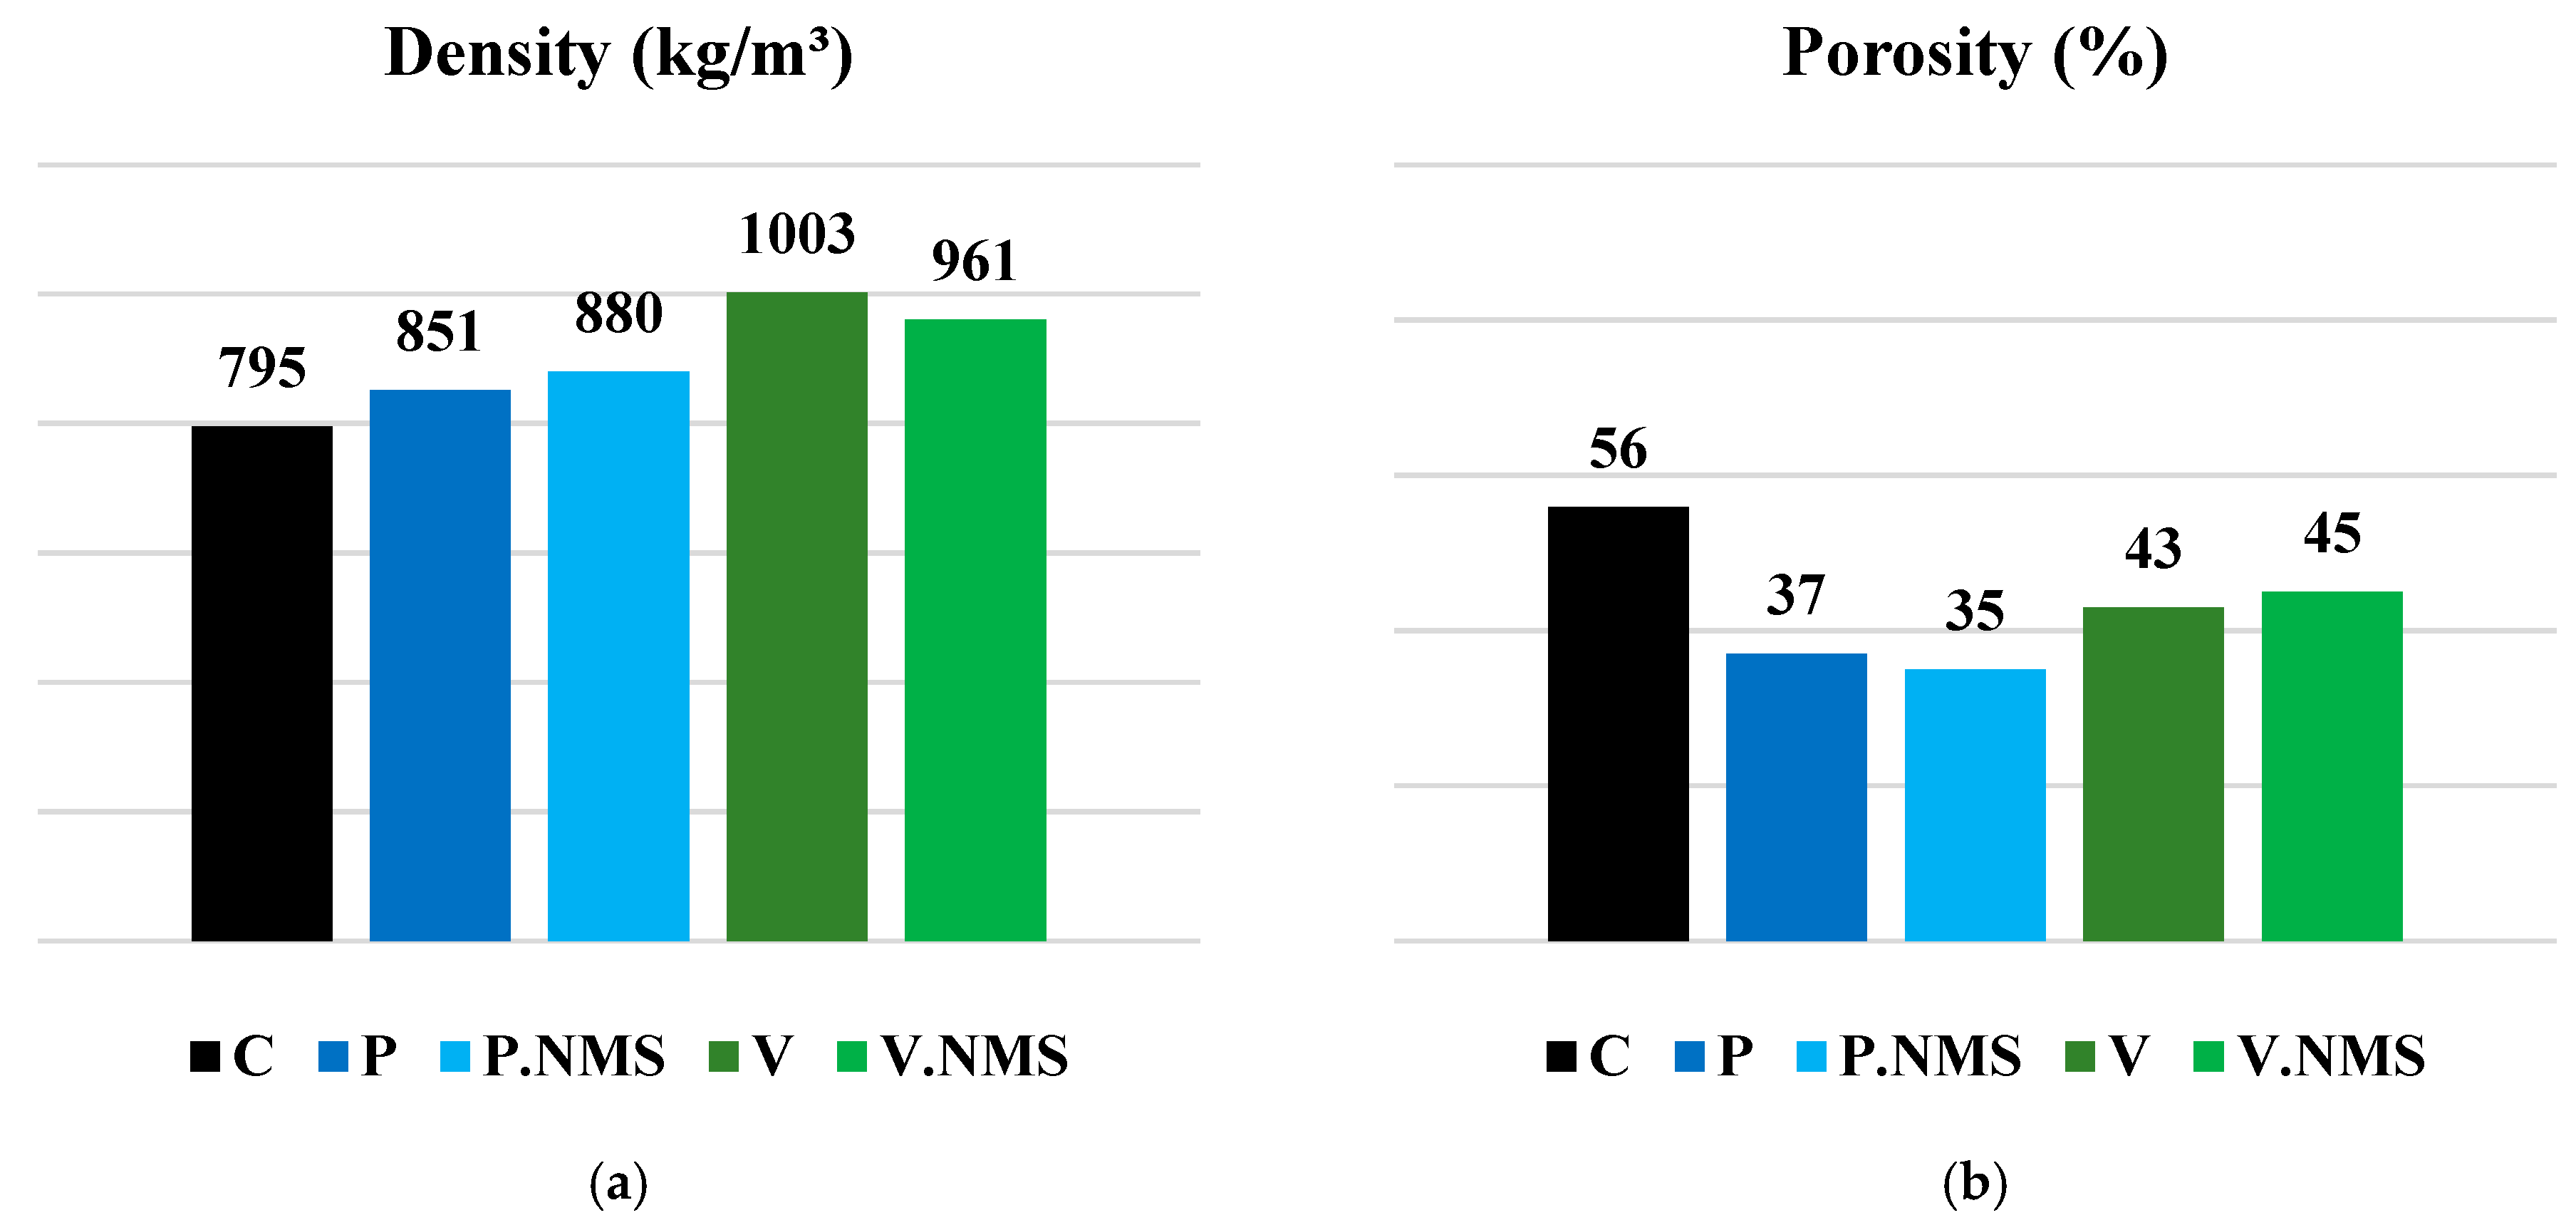
The density and porosity test results are shown in Figure 3. Notable variations between the densities were observed. The commercial solution had the lowest density, about 7%, 10%, 21% and 17% lower than P, P.NMS, V and V.NMS, respectively. The differences in densities between the developed mortars were due to two factors: (i) EV has a higher apparent density than EP because they have maximum values of 192 kg/m3 [32] and 100 kg/m3 [33], respectively, and (ii) different amounts of binder in the compositions.

Figure 3.
Average composition: (a) density and (b) porosity.
Concerning the porosity rates, mortar C stands out as the one having the highest porosity, about 51%, 60%, 30% and 24% higher than those of P, P.NMS, V and V.NMS, respectively. The sizes of EP and EV particles led to a notable difference in the mortars’ porosities.
As shown in Table 1, about 50% of EP particles have a size of 0.090 mm, while about 65% of EV’s have a size between 1.400 and 1.000 mm; thus, the P and P.NMS groups present the lowest values of porosity.
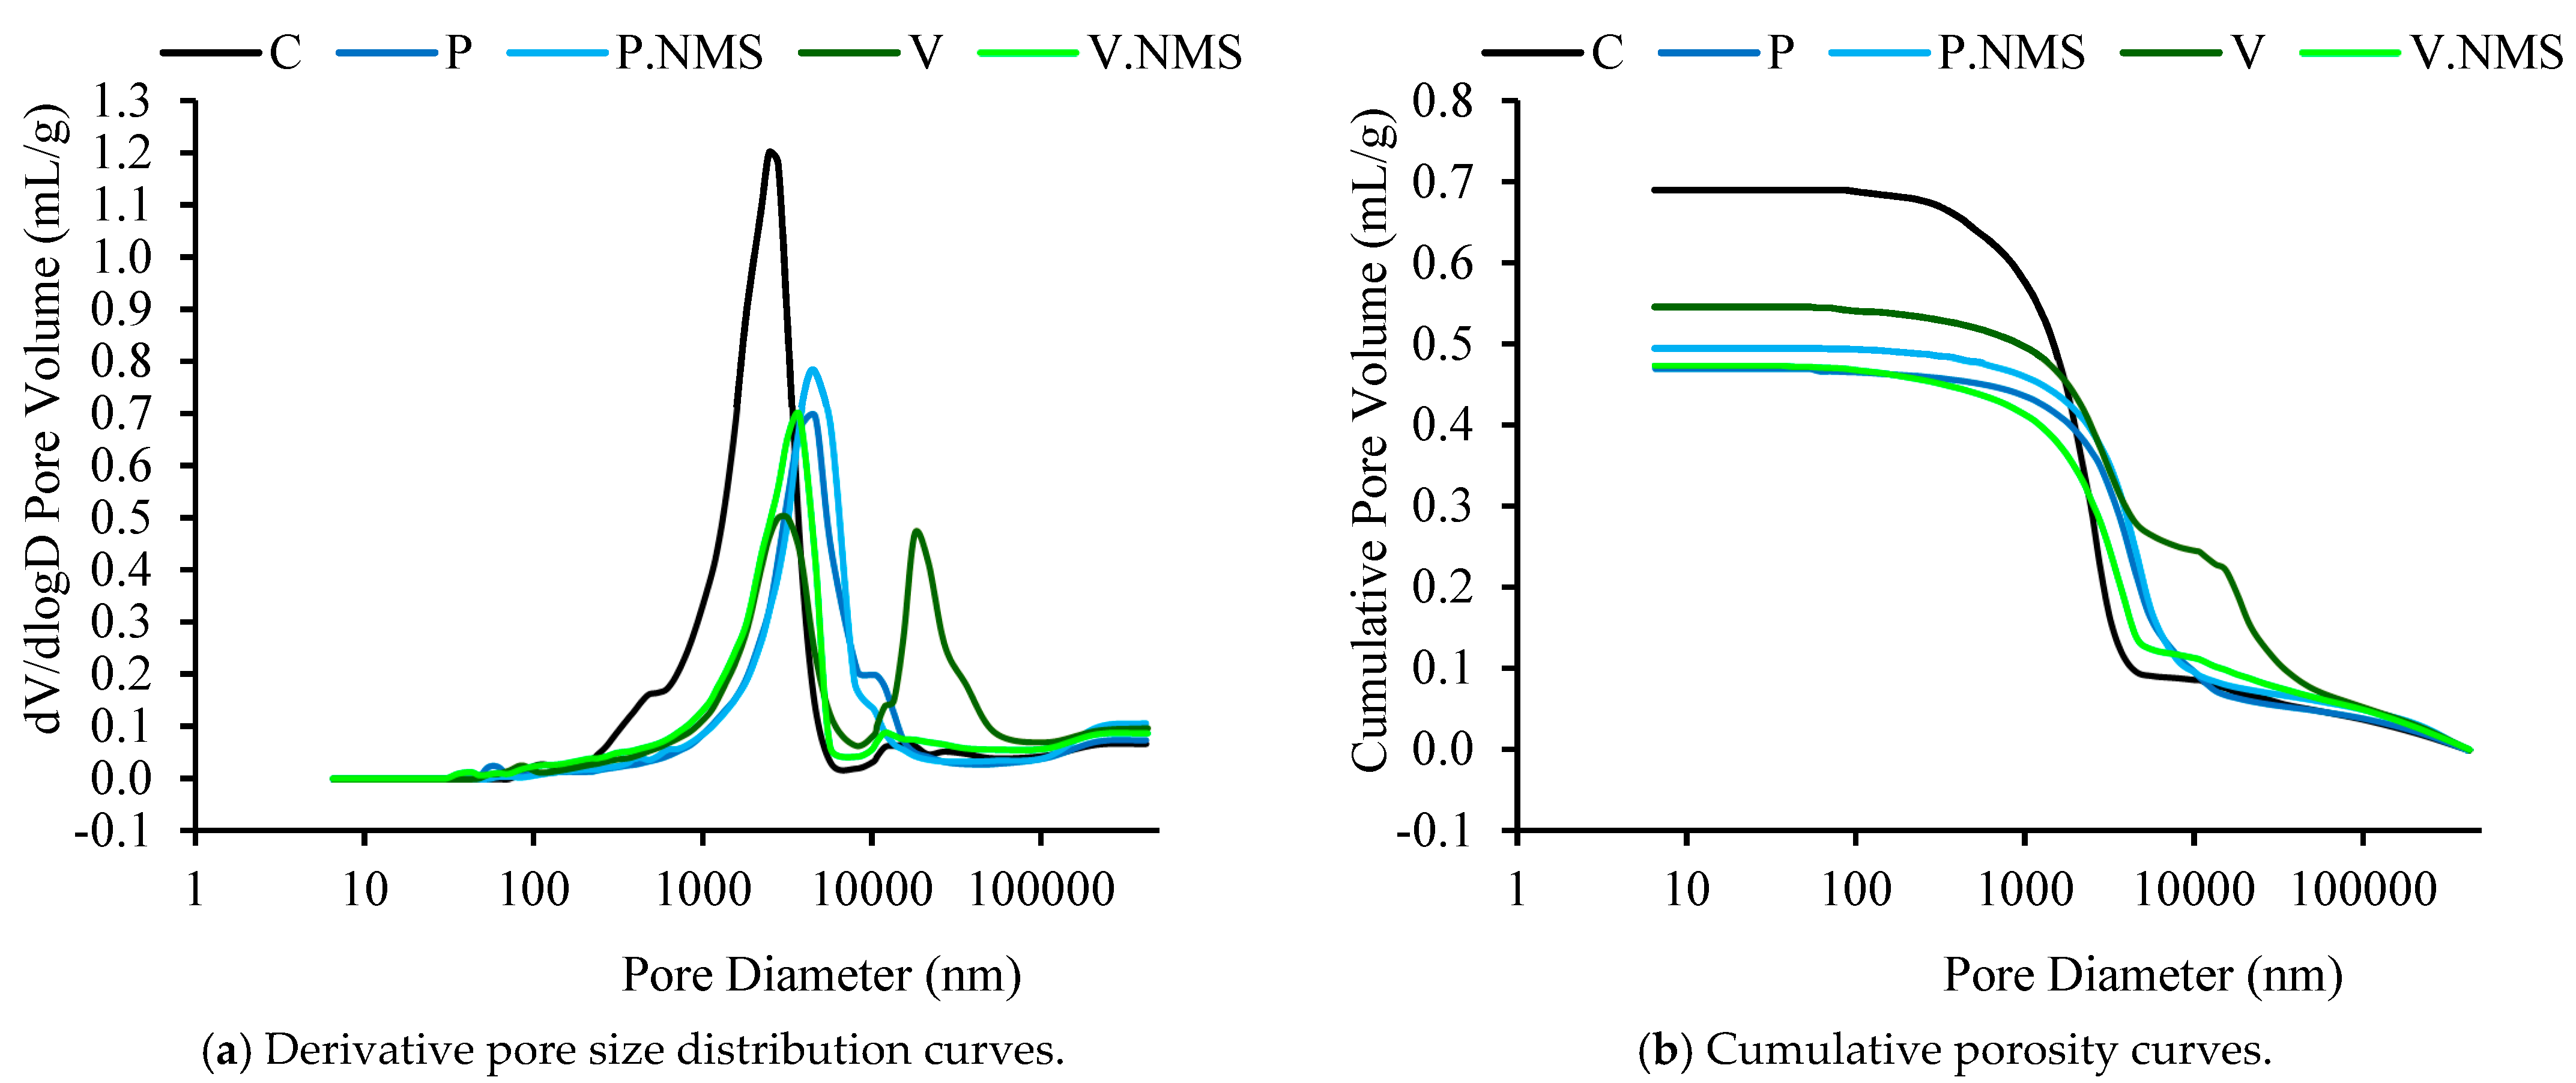
From the MIP tests, as used in other scientific studies [34,35,36], it was possible to evaluate the pore size distribution and dimensions in gypsum matrices with different compositions (Figure 4). In this study, it was observed that the peak of the pore size distribution curve was very similar for the compositions P, P.NMS, and VNMS (approximately 4200 nm). In contrast, the commercial composition exhibited a peak around 2500 nm, while composition V showed two distinct peaks, one at 3000 nm and another at 18,000 nm. It is also noted that the micro and nano silica had a favourable effect on composition V, as it eliminated one of the peaks, contributing to a more homogeneous pore distribution.
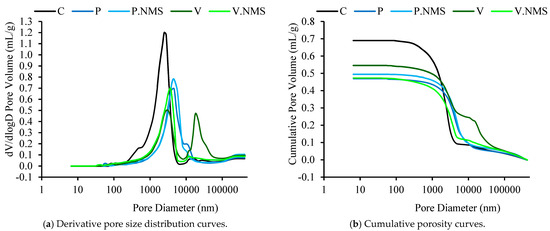
Figure 4.
MIP testing result curves (V denotes the intruded mercury or pore volume and d denotes the calculated equivalent pore diameter).
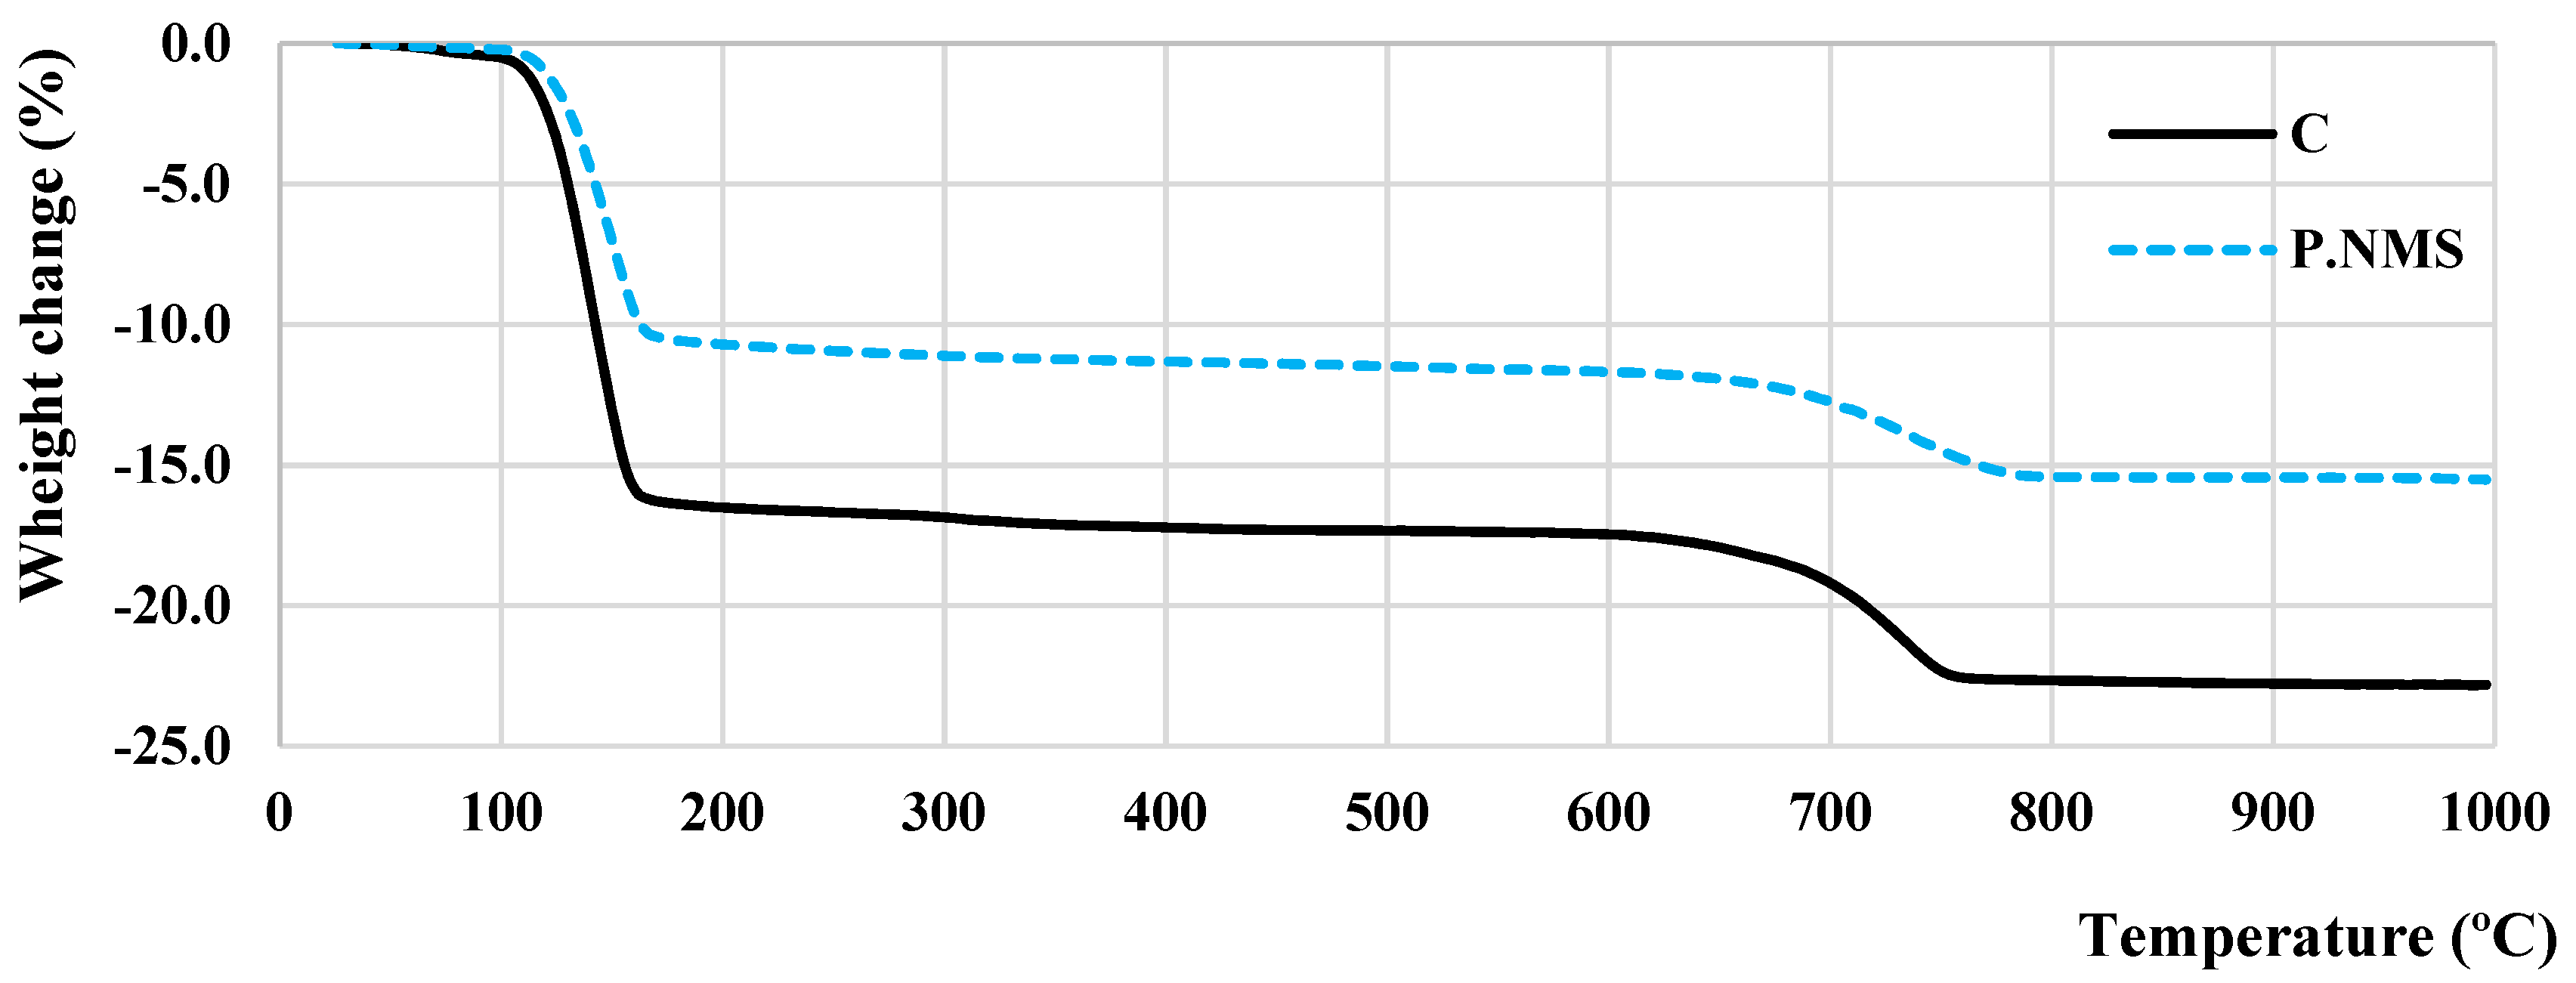
The mass loss with increasing temperature was analysed by TGA (Figure 5). Only commercial solutions and compositions with the best thermal behaviour (P.NMS) [9] were tested.
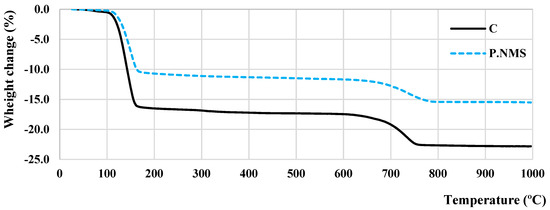
Figure 5.
TGA data of C and P.NMS compositions.
The TGA curves are similar, with two clearly separated mass-loss steps, although a difference in the magnitude of mass loss is observed. Based on the sample composition, between 100 and 250 °C, two-step dehydration of calcium sulphate dihydrate occurs, while above 600 °C, the decomposition of calcium carbonate takes place (CaCO3 → CaO + CO2). Gypsum dehydration generally occurs within the temperature range of 80–250 °C, depending on the heating rate and composition of the gypsum. This process occurs in two stages: (i) the first dehydration occurs between 80 and 150 °C (CaSO4·2H2O → CaSO4·1/2H2O), and (ii) the second, complete dehydration occurs (CaSO4·1/2H2O → CaSO4) between 150 and 250 °C [37,38,39]. P.NMS lost 10.4% and 15.5% of its initial weight at 170 °C and 1000 °C, respectively, while C lost 15.9% and 22.8% at 170 °C and 1000 °C, respectively.
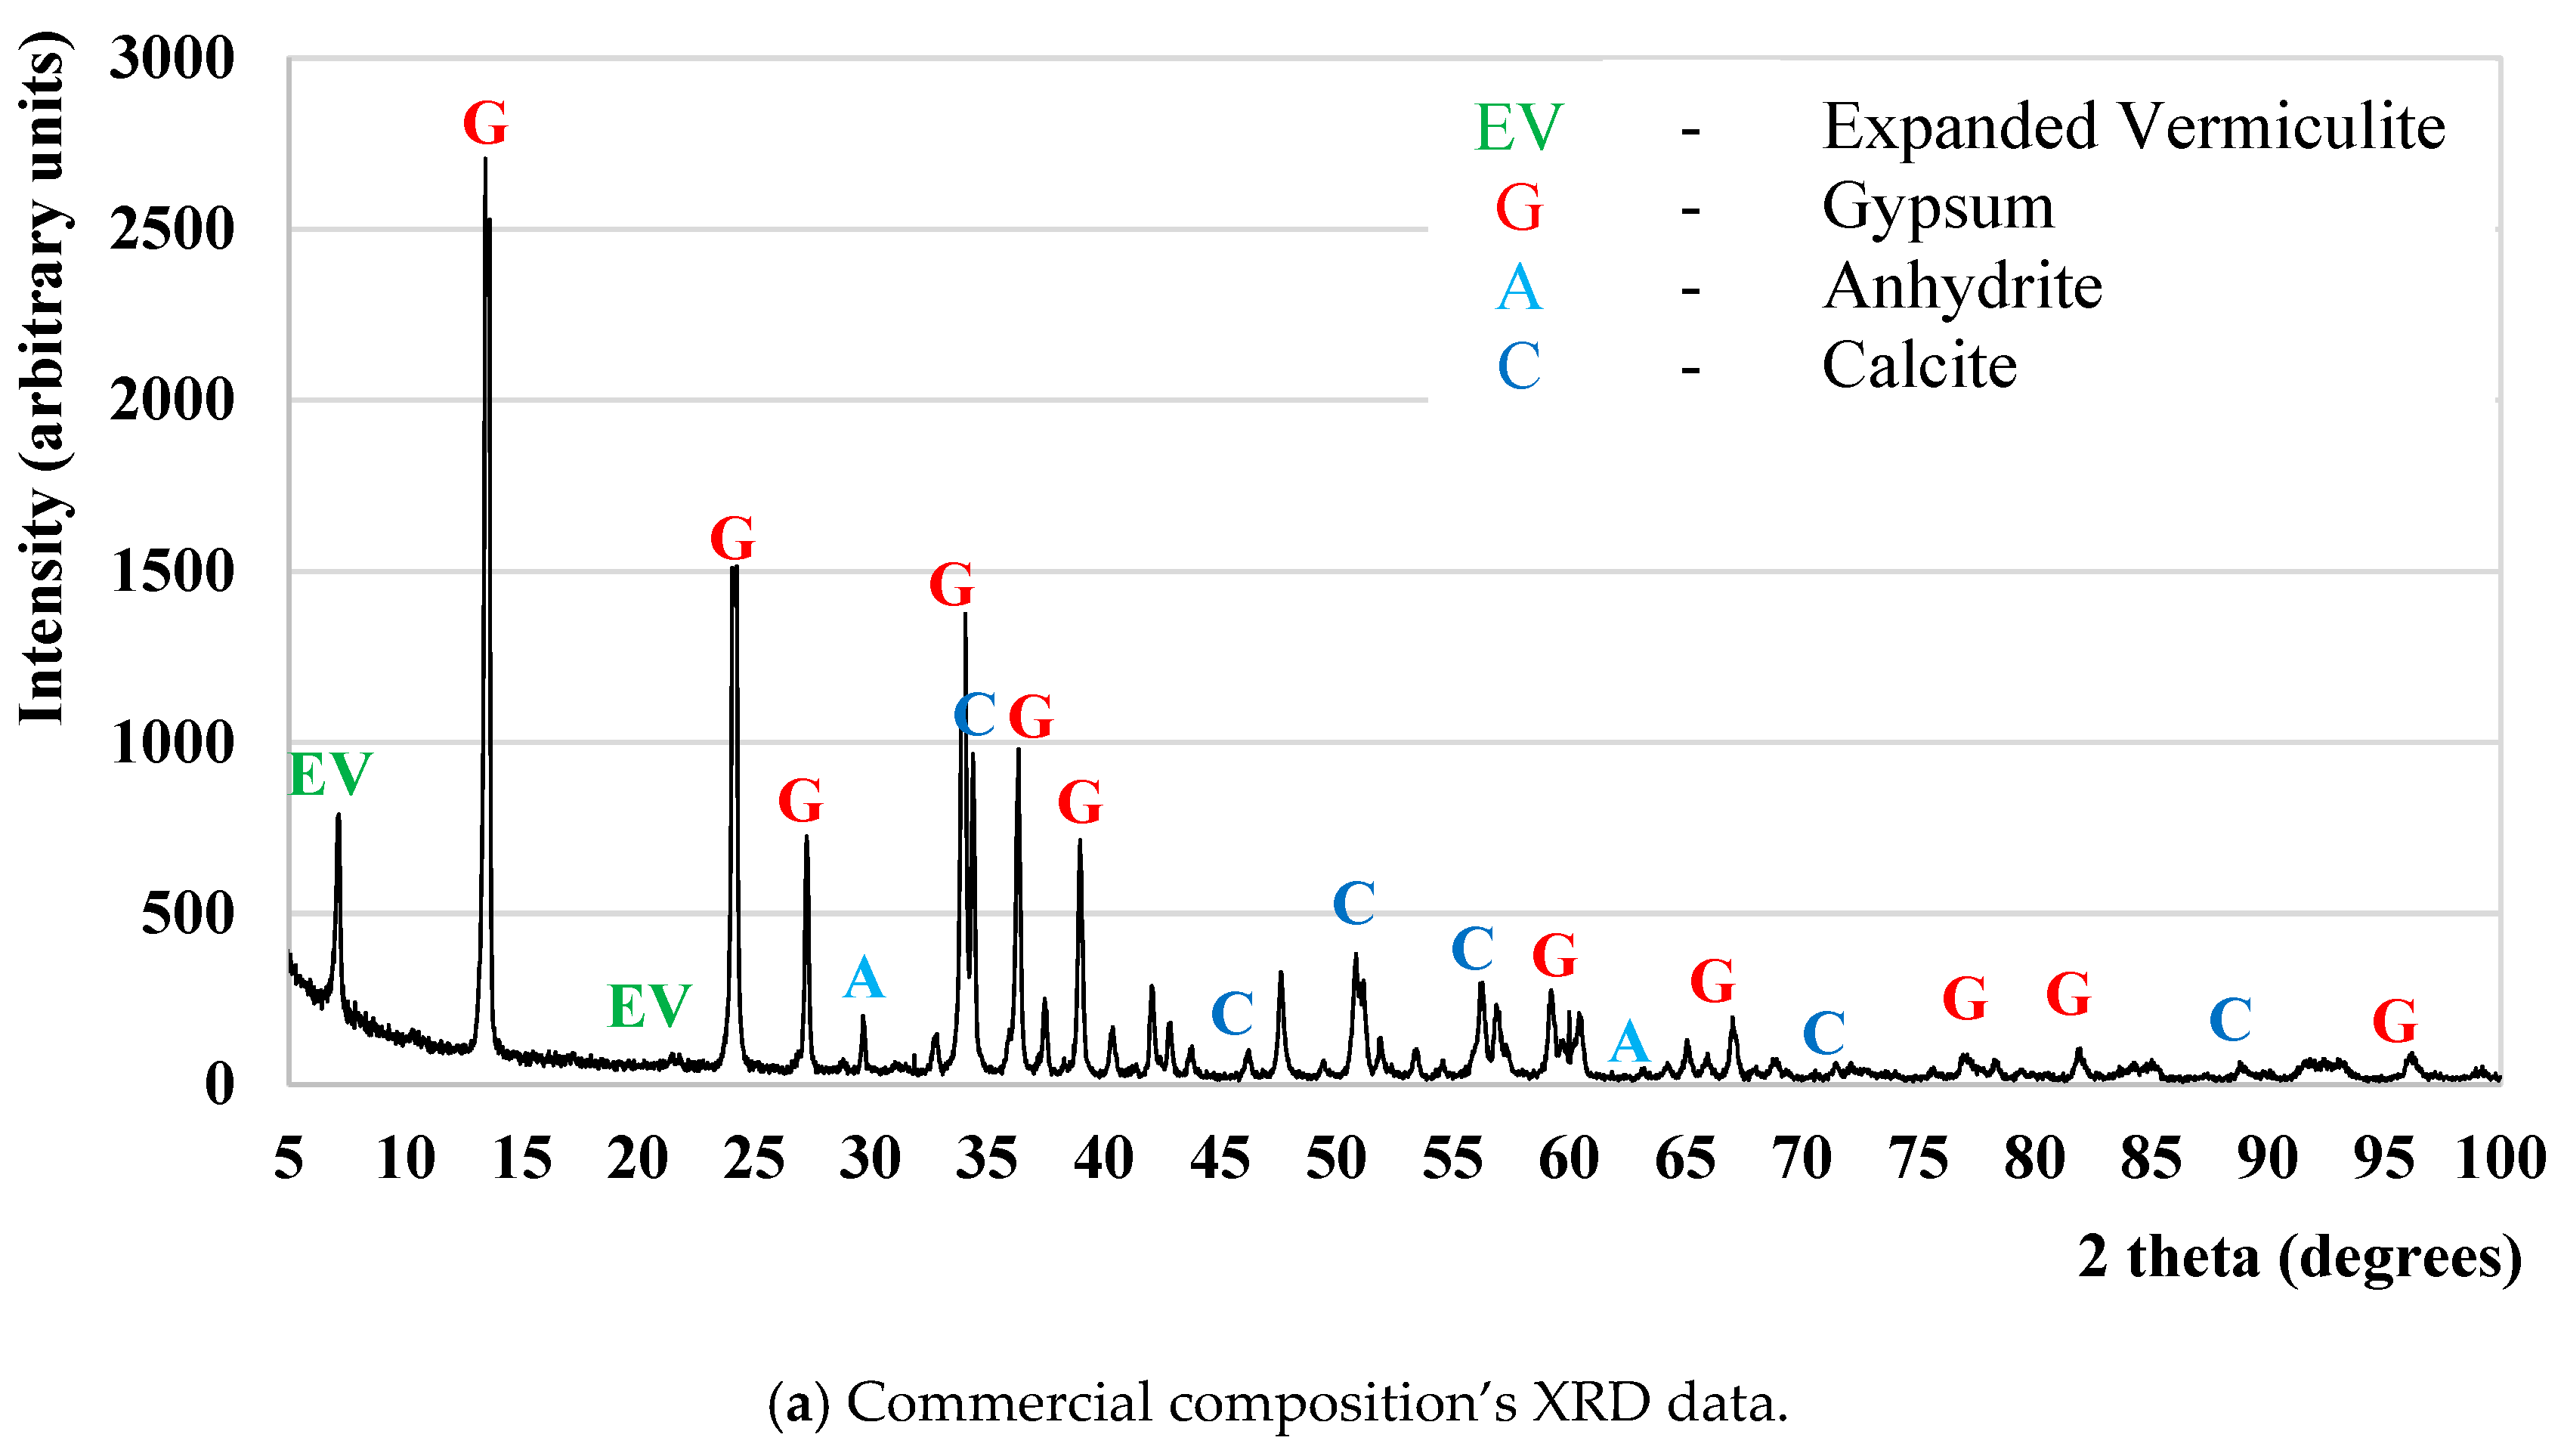
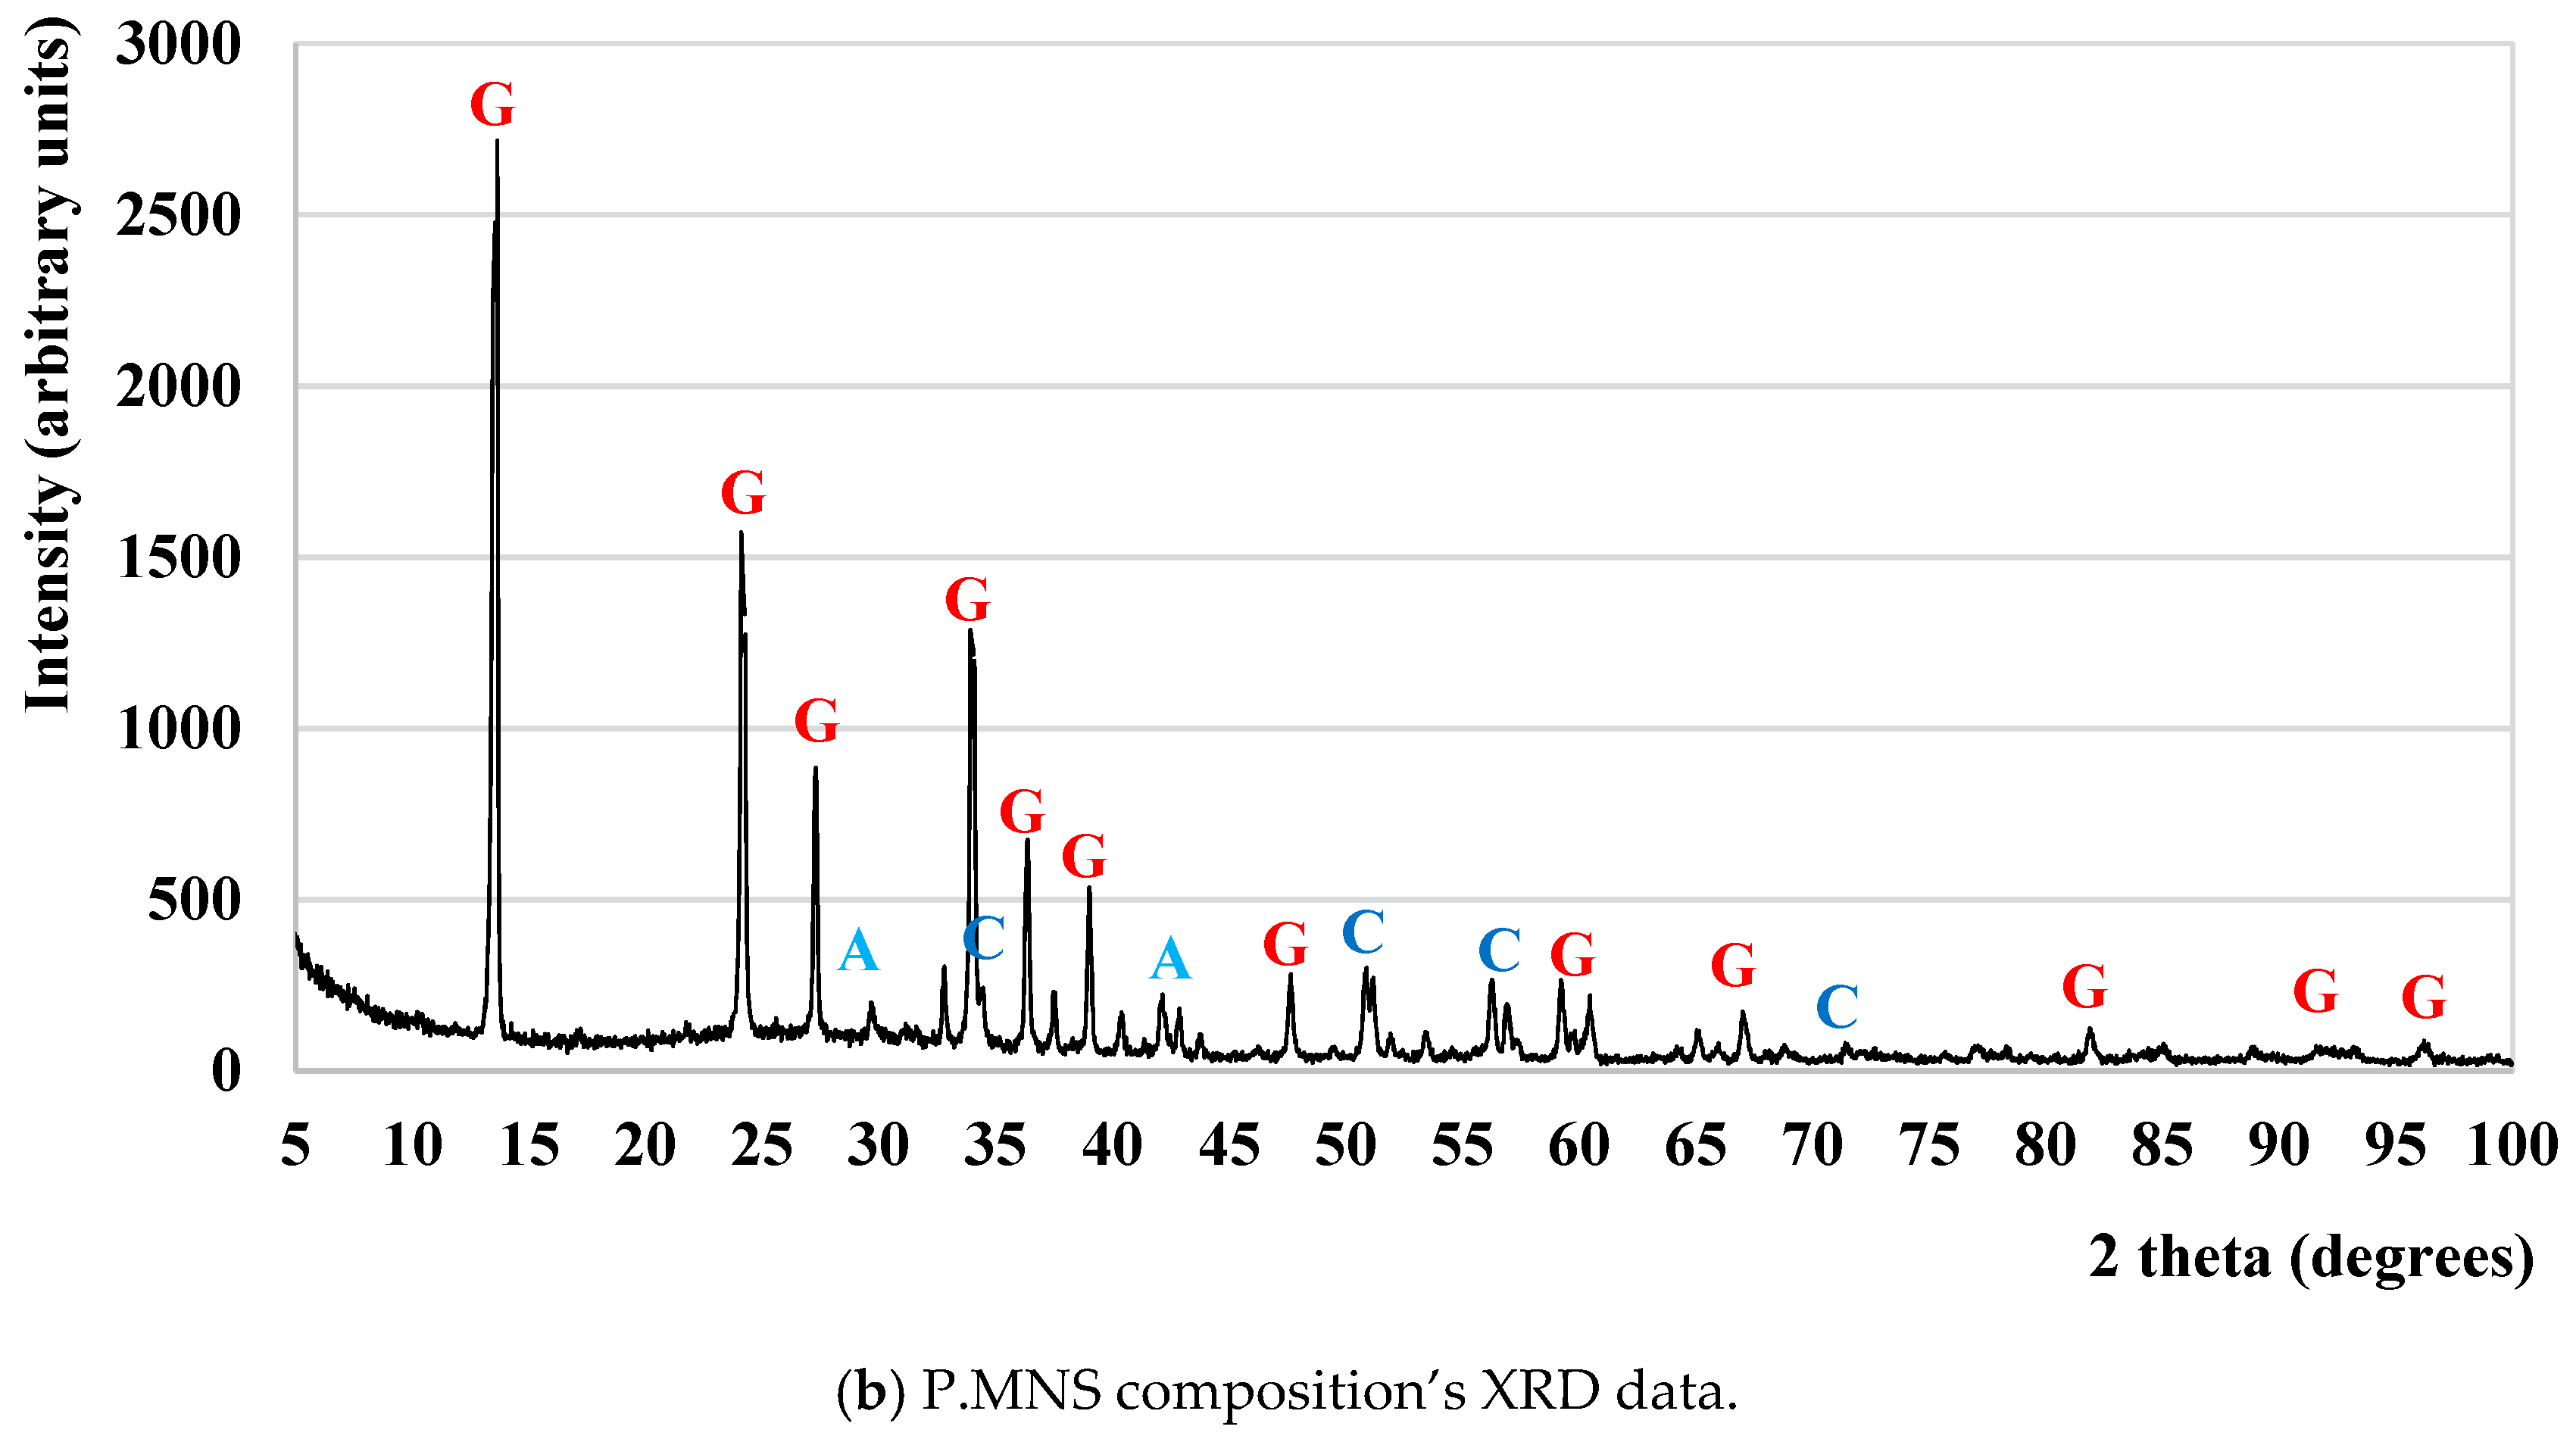
The XRD test was carried out to better understand the crystalline phases of the commercial and P.MNS compositions, and the results are shown in Figure 6.
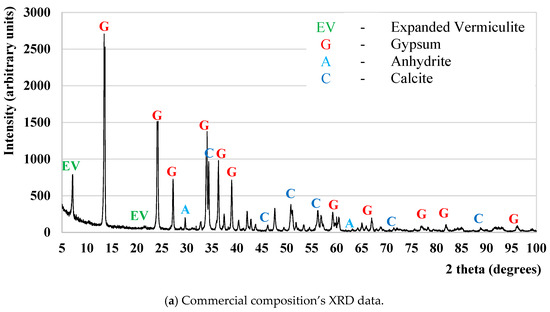
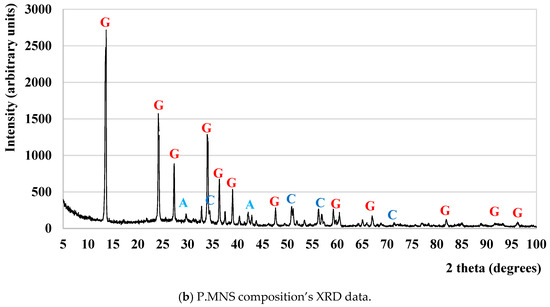
Figure 6.
XRD test results for (a) commercial and (b) P.MNS compositions.
By assessing XRD and TGA results, it was determined that the commercial composition is made mainly from gypsum, about 70%, with the remaining 30% being EP, EV and other unknown materials. The XRD results (Figure 6) show that both compositions (C and P.NMS) present similar gypsum crystalline phases [21,24,38].
Furthermore, the P.NMS results indicate the existence of an amorphous phase between 15° and 45° 2 theta, which is a characteristic of EP [39,40]. Adding perlite and vermiculite in their expanded forms decreases the weight loss of gypsum-based mortar due to their insulating properties, as previously mentioned [39,40,41,42,43].
However, this situation could only be seen in P.NMS, as the weight loss of C is similar to the weight loss of pure gypsum, according to the literature. In conclusion, in both cases, the first peak is due to the gypsum’s dehydration, and the second peak is due to the decomposition of calcium carbonate and the evaporation of sulphate phases. Furthermore, the difference in weight loss is due to the percentage of the content of insulating aggregates, EP and/or EV, in the composition. SEM images of the mortars are shown in Figure 7.
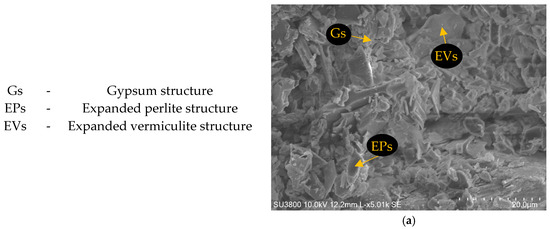
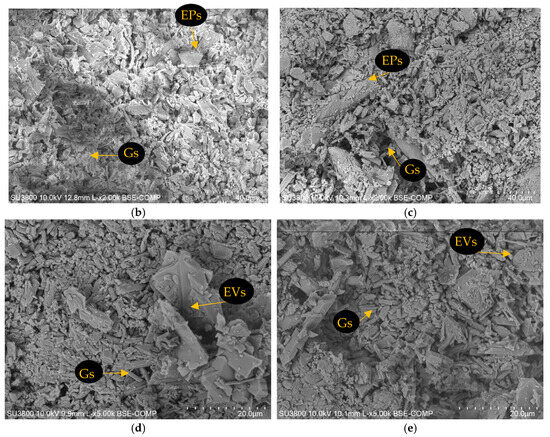
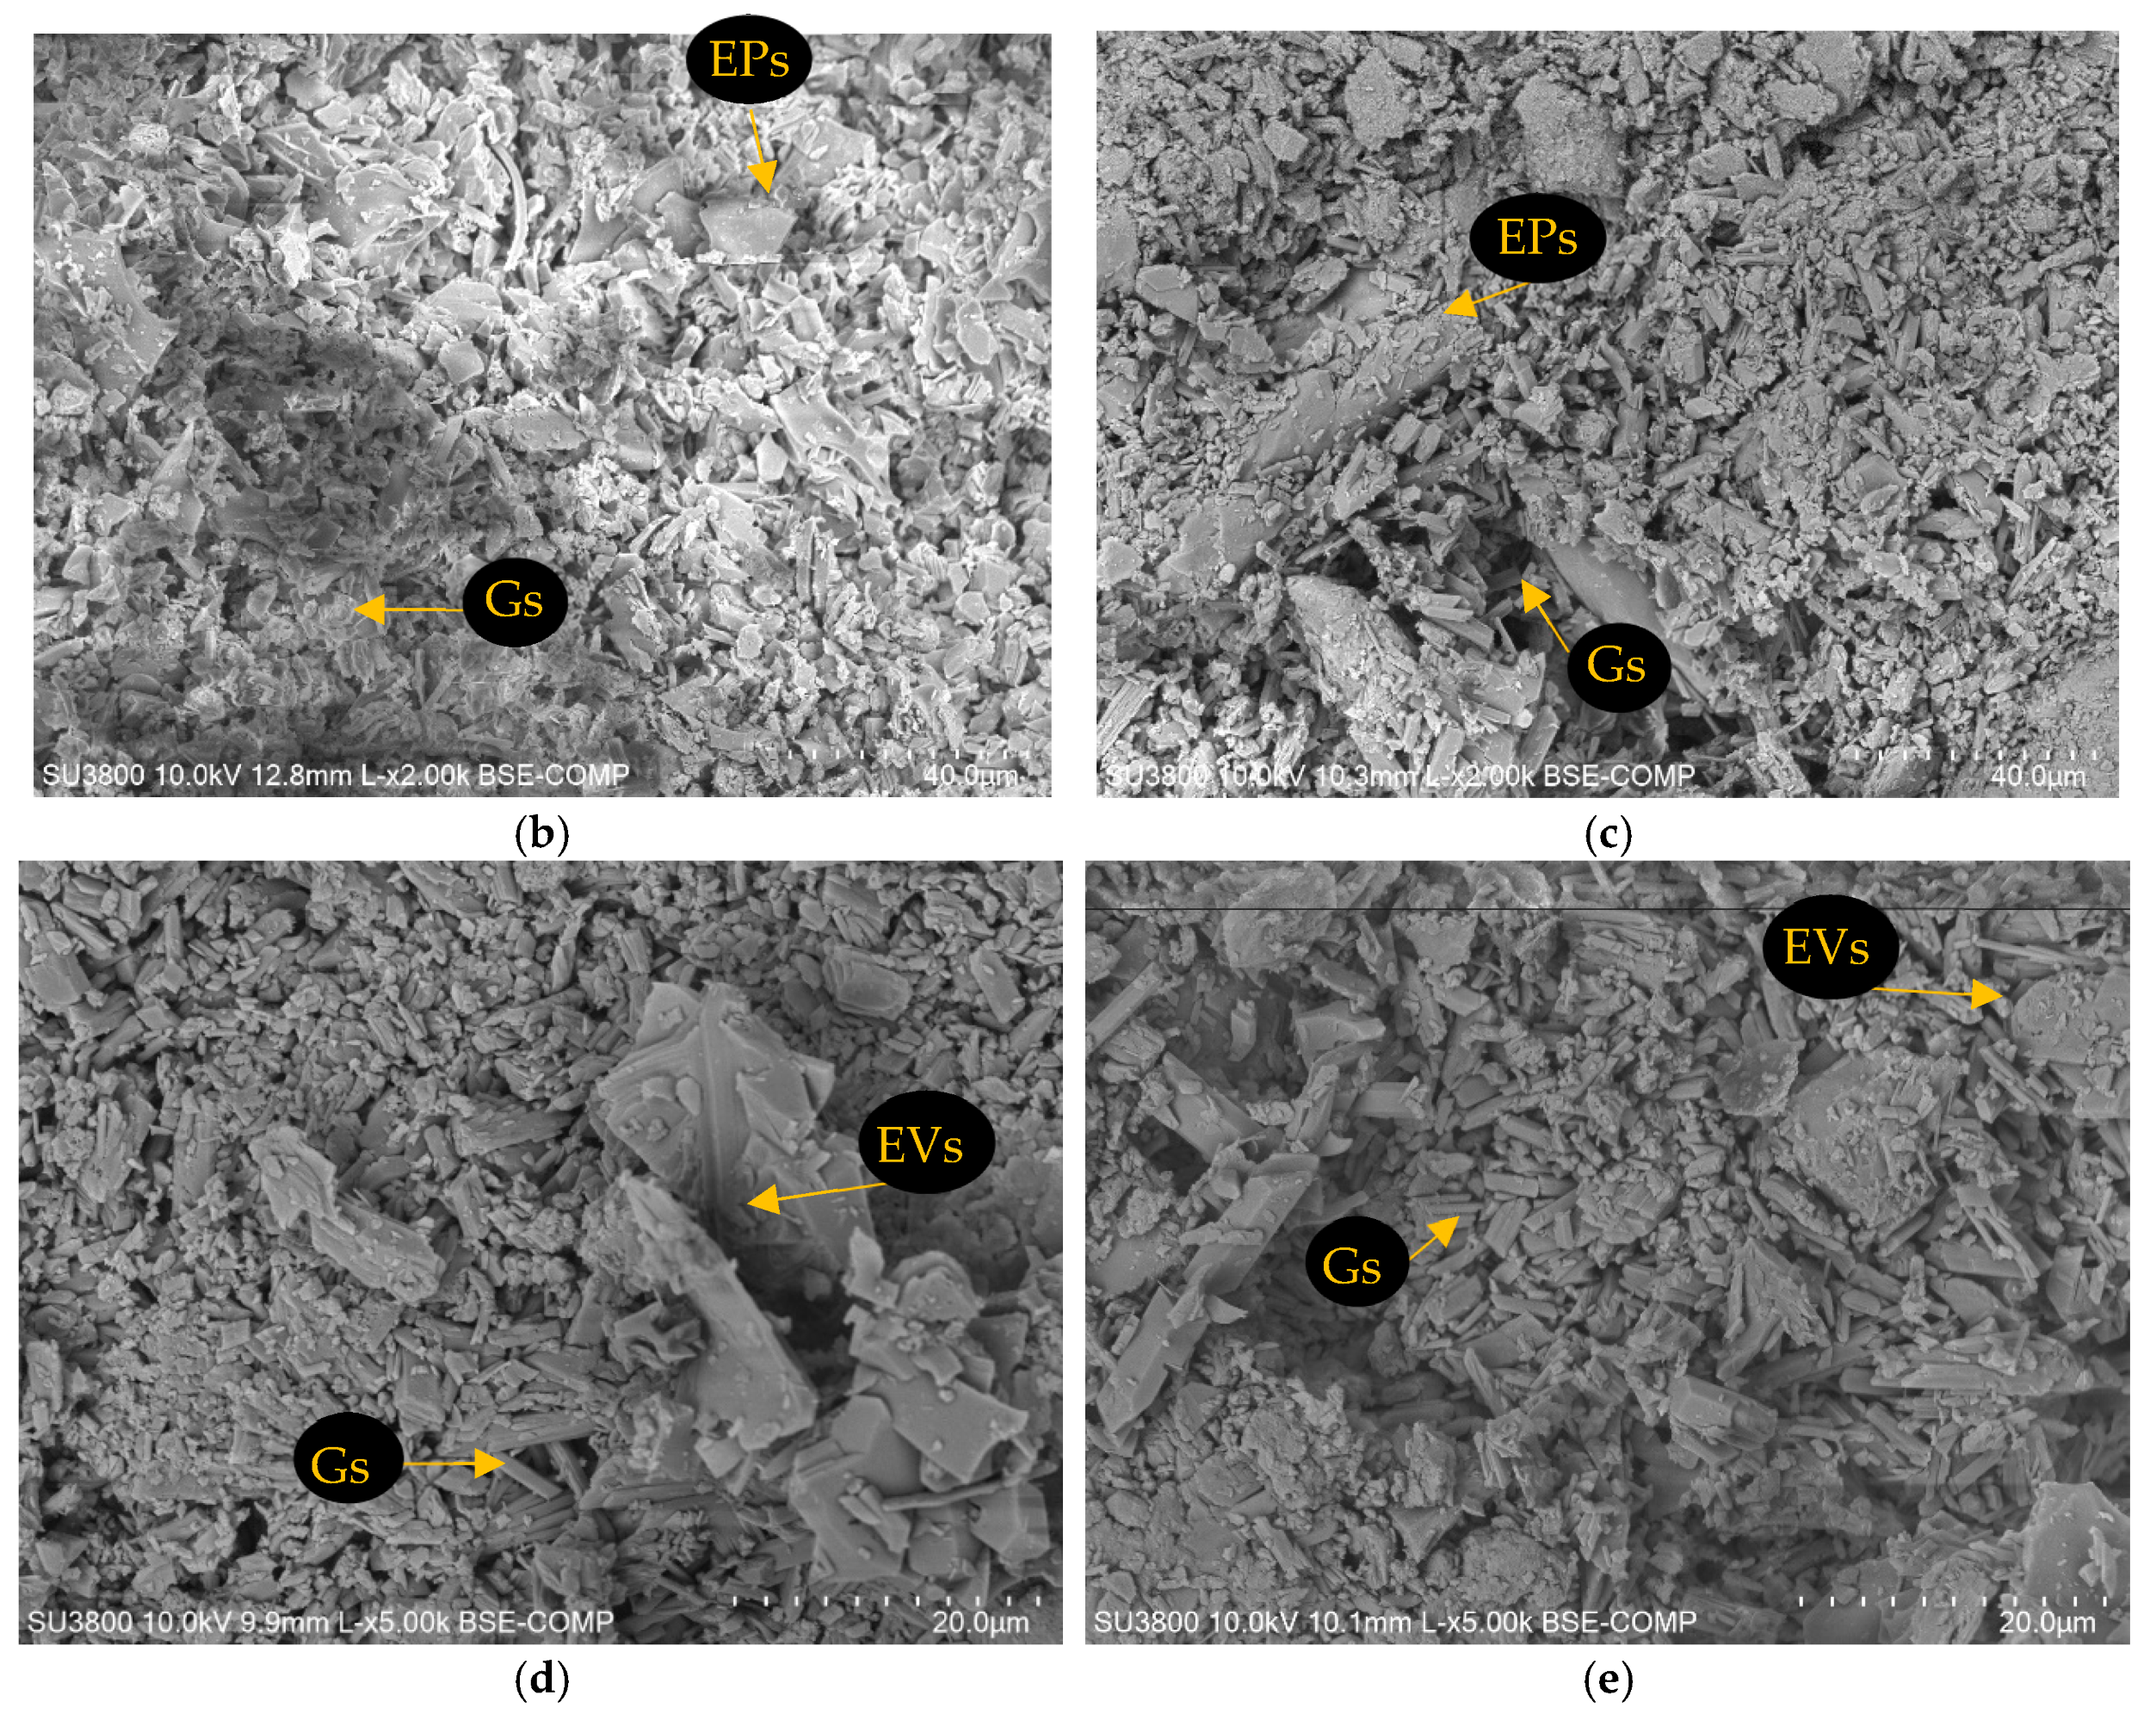
Figure 7.
SEM images of various compositions: (a) C, (b) P, (c) P.NMS, (d) V, and (e) V.NMS.
SEM analysis shows a common type of structure between the compositions due to the similarity of materials used and the visualisation of different porosities in the compositions: C presents a higher percentage of voids.
The gypsum is formed mainly by prismatic shaped crystal structures, with an average length of 4 µm to 6 µm, in accordance with the literature [37,43]. EP and EV show a lamellar shape with different lengths, but are always longer than the gypsum structures. The structure formation and distribution follow several previous studies [20,33,43,44]. Due to the reduced quantity of NMS, SEM analysis did not show its particles.
3.2. Non-Destructive Tests
3.2.1. Ultrasonic Pulse Velocity Test
After the experimental procedure, it was possible to obtain the propagation velocities of longitudinal and shear waves (Vp and Vs, respectively) using the following equations: Young’s modulus (E), the shear modulus (G) and Poisson’s ratio (μ) were determined:
E = [ρ Vs2 (3 Vp2 – 4 Vs2)]/(Vp2 − Vs2)
G = ρ Vs2
μ = (Vp2 – 2 Vs2)/[2 (Vp2 − Vs2)]
The specimens’ mechanical properties obtained by the UPV tests are shown in Table 2.
Table 2.
Ultrasonic pulse velocity test results.
3.2.2. Impulse Excitation of Vibration Test
After the experimental procedure and frequency readings, the Young’s modulus was determined using the following equation:
where m stands for the mass of the bar (g), b for the width of the bar (mm), L for the length of the bar (mm), t for the thickness of the bar (mm), ff for the fundamental resonant frequency of bar in flexure (Hz) and T1 for the correction factor for the fundamental flexural mode to account for finite thickness of bar and Poisson’s ratio. The dynamic shear modulus was obtained through the following equation:
where ft stands for the fundamental resonant frequency of the bar in torsion (Hz), and B and A are only dependent on the specimen’s dimensions. Finally, Poisson’s ratio is given by Equation (6), and the IEV test results are shown in Table 3.
E = 0.9465 (m ff2/b) (L3/t3) T1
G = 4 L m ft2 [B/(1 + A)]/b t
E/G = 2 (1 + μ)
Table 3.
Impulse excitation of vibration test results.
3.2.3. Discussion of the Tests Results
By assessing the non-destructive test results, it was possible to compare the mechanical properties of the developed mortars. In addition, it allowed for the evaluation of the binder and aggregate influence and the addition of nano and micro silica particles.
Figure 8 presents the correlation between the velocities and frequencies and the content of the binder for each composition. As shown in Figure 8, the results obtained from the non-destructive tests show that the velocities/frequencies increase as the binder content increases. Analysing the results of the mortars developed in the laboratory, V has the highest amount of binder, and it has the highest values of velocities and frequencies, while P.NMS has the lowest values.
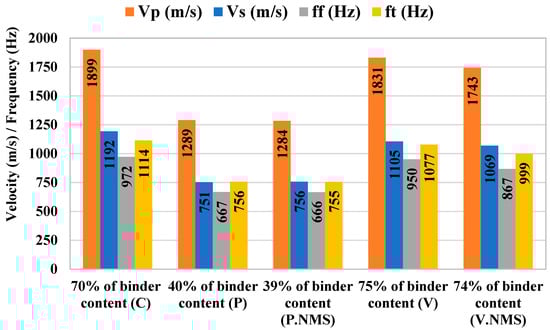
Figure 8.
UPV velocities (m/s) and IEV (Hz) frequencies as functions of binder content.
Comparing the values of velocities and frequencies between EP and EV when increasing 1% of binder in the composition, V showed a 6.4% average increase in its properties compared to V.NMS.
However, no considerable differences were observed between P and P.NMS. P and P.NMS had results within a similar range of values, and V had Vp, Vs, ff and ft only 5%, 3%, 10% and 8% higher than V.NMS’, respectively.
Table 4 shows the average property values for each mortar from the UPV and IEV tests.
Table 4.
Average properties result from non-destructive tests.
The Poisson’s ratio directly influences the compression and flexural strengths, as it is proportional to Young’s modulus and the shear modulus (Equation (6)).
The Poisson’s ratio values presented in Table 4 vary between 0.18 and 0.23, and agree with the values presented by different authors [23,24], in which the Poisson’s ratio values vary between 0.19 and 0.34. Still, in Table 4, it can be seen that the V and V.NMS groups had the highest range of average values of E and G.
V stands out as the composition with the highest mechanical properties values as its Young’s modulus was 119%, 125% and 5% higher than P.NMS, P and V.NMS values, respectively, and its shear modulus was 121%, 127% and 4% higher, respectively.
The average values of E and G presented in Table 5 are in accordance with the literature review [21,23,24], with E values between 1.573–4.282 GPa and G values between 0.655–1.205 GPa.
Table 5.
Developed mortars’ non-destructive test results to commercial composition ratios.
As verified by the results obtained in the non-destructive tests, in which the velocities/frequencies increase as the binder content increases (Figure 8), the mechanical properties (E and G) also increase as the binder content increases. Table 5 summarises the relationship between the mechanical parameters of the developed mortars and the commercial composition.
The assessment of Table 5 allowed us to conclude that the developed mortars showed two distinct characteristics: (i) the P and P.NMS groups have E and G average values in the range of 50% lower than the commercial composition, and (ii) the V and V.NMS groups show clearly enhanced E and G average values when compared to C’s. The enhanced results of the V and V.NMS groups are due to the use of 75% and 74% binder content, respectively. Establishing a linear regression between the average values of E and G reveals a strong correlation, as evidenced by a Pearson’s correlation coefficient of 0.9992. This correlation implies that compositions V, V.NMS, C, P.NMS, and P are likely to show the highest compressive and flexural strength values, respectively.
3.3. Destructive Tests
3.3.1. Flexural Test
In a four-support flexural test, the flexural strength is given by the following equation:
where fct,fl stands for the flexural strength (MPa), F for the maximum load (N), L for the distance between the support rollers (mm), b for the width of the bar (mm), and t for the thickness of the bar (mm). The specimens’ maximum load and flexural strength values are shown in Table 6.
fct,fl = F L/b t2
Table 6.
Flexural test results.
3.3.2. Compression Test
For example, in the flexural test procedure, when the collapse of the specimen occurs, the maximum load is registered. The compression strength is given by the following equation:
where fct,c is the compression strength, F is the maximum load registered, and d is the piston’s square section steel plate dimension. The specimens’ maximum load and compression strength values are shown in Table 7.
fct,c = F/d2
Table 7.
Compression test results.
3.3.3. Discussion of the Test Results
From the results obtained in the destructive tests (Table 6 and Table 7), it appears that the highest mechanical strengths correspond to groups V and V.NMS, which present aggregate contents of 25% and 24%, respectively, while the P and P.NMS groups have aggregate contents of 50% and 49%, respectively. The assessment of the developed mortars’ destructive test results allowed to observe a decrease in the flexural and compression strengths when higher amounts of aggregates were added. Furthermore, in most of the results obtained, the addition of nano and micro silica particles caused a decrease in flexural and compressive strength.
In cement-based concrete, the mechanical strength can be enhanced by incorporating fly ash or silica fume. Fly ash contributes to long-term strength through pozzolanic reactions, while silica fume improves early strength and densification due to its high reactivity and fine particle size [45,46,47].
Similarly, for gypsum-based mortars, it was anticipated that the introduction of nano and micro silica particles would improve the microstructure by filling the pores in the matrix and promoting pozzolanic reactions during gypsum hydration. This process would theoretically result in increased density, better adhesion within the matrix, and consequently, enhanced mechanical strength. However, the experimental results indicated otherwise, showing a decrease in mechanical strength. This outcome may be attributed to the inadequate distribution of silica particles within the gypsum matrix, leading to the formation of agglomerates. These agglomerates create weak zones in the microstructure, reducing cohesion and ultimately compromising the mechanical strength. Furthermore, the high reactivity and specific surface area of the particles might alter the water-to-gypsum ratio, potentially interfering with the hydration process and promoting the formation of microcracks, which further degrades the material’s mechanical properties.
Experimental studies on mortars carried out by different authors [21,22,23] indicate that with an increase in the number of aggregates with low mechanical strength or an increase in the water/binder ratio increases, the lower their mechanical strength values will be. The reviewed literature agrees with the results obtained from flexural and compression tests. Table 8 summarises each mortar’s strengths and the relationship between the developed mortar’s and the commercial composition’s strengths.
Table 8.
Developed mortars’ destructive test results and comparison ratios to the commercial compositions.
Showing the best performance among the developed mortars, V had flexural and compressive strengths 9% and 13% higher than V.NMS’, 129% and 206% higher than P’s, and 152% and 182% higher than P.NMS’, respectively. When comparing the commercial composition with the developed mortars, the V and V.NMS groups had enhanced flexural strengths and decreased compression strengths; however, the results are within a similar range of values.
The results shown in Table 8 are in accordance with the non-destructive test results, as the highest velocities/frequencies are seen in V and the lowest in P.NMS. C and V stand out as the compositions with the best mechanical behaviours; however, passive fire protection mortars’ mechanical strengths are not limited by a minimum value, according to EN 13279-1 [48]; hence, only thermal requirements should be complied with.
To assess data reliability, various linear regressions were conducted. It was observed that the flexural strength shows a strong correlation with both the Young’s modulus and shear modulus of the mortars, with Pearson correlation coefficients of 0.9955 and 0.9920, respectively.
Similarly, there was a strong correlation between the compressive strengths of the mortars and their corresponding Young’s and shear moduli, with coefficients of 0.9579 and 0.9669, respectively. Although the correlation between the flexural strength and compressive strength was not as pronounced, a correlation coefficient of 0.9429 was still observed.
4. Conclusions
The aim of this paper was to conduct a comprehensive mechanical characterisation of gypsum-based mortars designed for passive fire protection. Testing involved five distinct compositions, including one commercially available variant, to assess the impact of varying binder and aggregate quantities, as well as the introduction of nano and micro silica particles, on mortar mechanical behaviour through both non-destructive and destructive tests. Additionally, physical characterisation tests were conducted on the specimens. The following encouraging conclusions emerged from this study:
- -
- Non-destructive testing revealed that the developed mortars exhibited uniform and homogeneous matrices;
- -
- It was observed that higher binder dosages and lower aggregate dosages led to increased velocities/frequencies in non-destructive tests, correlating with higher mechanical strength and improved physical properties;
- -
- The addition of short amounts of nano and micro silica particles in the mortars posed challenges to the mechanical and physical properties of such mortars;
- -
- Compositions incorporating vermiculite demonstrated superior or comparable mechanical properties to the commercial composition, underscoring the potential for innovative material formulations. Conversely, compositions featuring perlite exhibited slightly lower mechanical properties compared to the commercial variant, yet this observation presents an opportunity for further optimisation;
- -
- Notably, the study found a strong correlation between the mechanical properties studied (flexural and compression strength) and the physical properties (Young’s modulus of elasticity and shear modulus) of the developed mortars, indicating robust material performance;
- -
- These insights highlight the potential for continued advancements in mortar development for enhanced fire protection, paving the way for more resilient and reliable construction materials in the future.
Based on the results obtained and given that compositions with different types of aggregates were used, further experimental tests will be conducted, taking into consideration the following parameters: (i) examining the distribution and dispersion of nano and micro silica particles within the gypsum paste; (ii) testing different water-to-binder (W/B) ratios to optimise both the hydration process and the mechanical strength of the mortar; (iii) assessing the compatibility and reactivity of these nano and micro silica particles with gypsum; and (iv) evaluating the effectiveness of various methods for incorporating the nano and micro silica particles into gypsum mortars.
Author Contributions
Conception and design of the study: H.C., L.V., A.R., A.S. and L.L.; Acquisition of data: H.C., L.V., A.R. and E.M. Analysis and/or interpretation of data: H.C., L.V., A.R., A.S., L.L. and E.M. Drafting the manuscript: H.C. and E.M. Revising the manuscript: L.V., A.R., A.S. and L.L. Project administration and Funding acquisition, A.S. All authors have read and agreed to the published version of the manuscript.
Funding
PTDC/ECI-EGC/31850/2017 (NANOFIRE–Thermal and Mechanical behaviour of Nano Cements and their application in steel construction as fire protection). FCT/MCTES through national funds (PIDDAC) under the R&D Unit Institute for Sustainability and Innovation in Structural Engineering (ISISE), under reference UIDB/04029/2020 (doi.org/10.54499/UIDB/04029/2020), and under the Associate Laboratory Advanced Production and Intelligent Systems ARISE under reference LA/P/0112/2020.
Institutional Review Board Statement
Not applicable.
Informed Consent Statement
Not applicable.
Data Availability Statement
The data presented in this study are available upon request from the corresponding author due to further ongoing studies.
Acknowledgments
The authors gratefully acknowledge the Portuguese Foundation for Science and Technology (FCT) for its support under the framework of research project PTDC/ECI-EGC/31850/2017 (NANOFIRE–Thermal and Mechanical behaviour of Nano Cements and their application in steel construction as fire protection) and also to the University of Coimbra (UC) for their support under the Scientific Employment Stimulus Programme given to the first author, as well as to the European Regional Development Fund, the European Social Fund, and European Structural and Investment Funds. This work was also financed by FEDER funds through the Competitivity Factors Operational Programme–COMPETE and by national funds through FCT within the scope of the project POCI-01-0145-FEDER-007633 and the Regional Operational Programme CENTRO2020 within the scope of the project CENTRO-01-0145-FEDER-000006. This work was still partly financed by the FCT/MCTES through national funds (PIDDAC) under the R&D Unit Institute for Sustainability and Innovation in Structural Engineering (ISISE), under reference UIDB/04029/2020 (doi.org/10.54499/UIDB/04029/2020), and under the Associate Laboratory Advanced Production and Intelligent Systems ARISE under reference LA/P/0112/2020.
Conflicts of Interest
The authors declare no conflicts of interest.
Abbreviations
| B | Binder |
| C | Commercial passive protection composition used as reference mortar |
| CPPS | Commercial passive protection solution |
| CP | Compression |
| Ca2+ | Calcium ion |
| CaCO3 | Calcium carbonate (calcite) |
| CaSO4 | Calcium sulphate (anhydrite) |
| CaSO4·2H2O | Calcium sulphate dihydrate (Gypsum) |
| CaSO4·1/2H2O | Calcium sulphate hemihydrate |
| C-S-H | Calcium silicate hydrate |
| CO2 | Carbon dioxide |
| E | Young’s modulus |
| EP | Expanded perlite |
| EV | Expanded vermiculite |
| FL | Flexural |
| G | Shear modulus |
| GP | Gypsum powder |
| IEV | Impulse excitation of vibration |
| MS | Micro particles of silica |
| nano-Al2O3 | Aluminium Oxide Nanoparticles |
| nano-Fe2O3 | Iron Oxide Nanoparticles |
| nano-SiO2 | Silicon Oxide Nanoparticles |
| NMS | Nano and micro particles of silica |
| NS | Nano particles of silica |
| P | Developed gypsum mortar with perlite |
| P.NMS | Developed gypsum mortar with perlite, nano and micro silica particles |
| SD | Standard deviation |
| SEM | Scanning electron microscopy |
| SiO2 | Silicon dioxide |
| TGA | Thermo gravimetric analysis |
| UPV | Ultrasonic pulse velocity |
| V | Developed gypsum mortar with vermiculite |
| V/B | Vermiculite to binder ratio |
| V.NMS | Developed gypsum mortar with vermiculite, nano and micro silica particles |
| W | Water |
| W/GP | Water gypsum ratio in weight % |
| XRD | X-ray diffraction |
| Notation | |
| ρ | Density |
| μ | Poisson’s ratio |
| fct,c | Compression strength |
| fct,fl | Flexural strength |
| ff | Fundamental resonant frequency of bar in flexure |
| ft | Fundamental resonant frequency of bar in torsion |
| Vp | Pulse-propagation velocity of the compression wave |
| Vs | Pulse-propagation velocity of the shear wave |
References
- Eckelman, M.J.; Brown, C.; Troup, L.N.; Wang, L.; Webster, M.D.; Hajjar, J.F. Life cycle energy and environmental benefits of novel design-for-deconstruction structural systems in steel buildings. Build. Environ. 2018, 143, 421–430. [Google Scholar] [CrossRef]
- Shi, G.; Ban, H.; Shi, Y.; Wang, Y. Overview of research progress for high strength steel structures. Eng. Mech. 2012, 30, 1–13. [Google Scholar] [CrossRef]
- Gervásio, H.; Simões da Silva, L. A Sustentabilidade do aço, Construção Metálica e Mista V; CMM: Lisboa, Portugal, 2005; pp. 719–730. [Google Scholar]
- Santiago, A.; Simões da Silva, L.; Vaz, G.; Vila Real, P.; Gameiro Lopes, A. Experimental investigation of the behaviour of a steel sub-frame under a natural fire. Int. J. Steel Compos. Struct. 2008, 8, 243–264. [Google Scholar] [CrossRef]
- Ryou, J.; Kim, H. New approach for delaying the internal temperature rise of fire resistant mortar made with coated aggregate. Constr. Build. Mater. 2017, 149, 76–90. [Google Scholar] [CrossRef]
- Couto, C.; Real, P.V. The influence of imperfections in the critical temperature of I-section steel members. J. Constr. Steel Res. 2021, 179, 106540. [Google Scholar] [CrossRef]
- Laím, L.; Santiago, A.; Caetano, H.; Craveiro, H.D.; Shahbazian, A. Numerical analysis and structural fire design of protected SHS steel columns with thermally enhanced gypsum-based mortars. J. Build. Eng. 2022, 54, 104629. [Google Scholar] [CrossRef]
- EN 1993-1-2-2005; Eurocode 3: Design of Steel Structures. Part 1.2: General Rules—Structural Fire Design. European Committee for Standardization (CEN): Brussels, Belgium, 2005.
- Caetano, H.; Laím, L.; Santiago, A.; Durães, L.; Shahbazian, A. Development of Passive Fire Protection Mortars. Appl. Sci. 2022, 12, 2093. [Google Scholar] [CrossRef]
- Mo, K.H.; Lee, H.J.; Liu, M.Y.J.; Ling, T. Incorporation of expanded vermiculite lightweight aggregate in cement mortar. Constr. Build. Mater. 2018, 179, 302–306. [Google Scholar] [CrossRef]
- Laím, L.; Caetano, H.; Santiago, A. Review: Effects of nanoparticles in cementitious construction materials at ambient and high temperatures. J. Build. Eng. 2021, 35, 102008. [Google Scholar] [CrossRef]
- Nuaklong, P.; Boonchoo, N.; Jongvivatsakul, P.; Charinpanitkul, T.; Sukontasukkul, P. Hybrid effect of carbon nanotubes and polypropylene fibres on mechanical properties and fire resistance of cement mortar. Constr. Build. Mater. 2020, 275, 122189. [Google Scholar] [CrossRef]
- Irshidat, M.; Al-Saleh, M.H. Thermal performance and fire resistance of nanoclay modified cementitious materials. Constr. Build. Mater. 2017, 159, 213–219. [Google Scholar] [CrossRef]
- Gomes, M.G.; Flores-Colen, I.; Pedroso, M. Thermal conductivity measurement of thermal insulating mortars with EPS and silica aerogel by steady-state and transient methods. Constr. Build. Mater. 2018, 172, 696–705. [Google Scholar] [CrossRef]
- Farzadnia, N.; Ali, A.A.A.; Demirboga, R.; Anwar, M.P. Effect of halloysite nanoclay on mechanical properties, thermal behaviour and microstructure of cement mortars. Cem. Concr. Res. 2013, 48, 97–104. [Google Scholar] [CrossRef]
- Oltulu, M.; Şahin, R. Effect of nano-SiO2, nano-Al2O3 and nano-Fe2O3 powders on compressive strengths and capillary water absorption of cement mortar containing fly ash: A comparative study. Energy Build. 2012, 58, 292–301. [Google Scholar] [CrossRef]
- Köksal, F.; Serrano-López, M.A.; Şahin, M.; Gencel, O.; López-Colina, C. Combined effect of steel fibre and expanded vermiculite on properties of lightweight mortar at elevated temperatures. Mater. Struct. 2015, 48, 2083–2092. [Google Scholar] [CrossRef]
- Köksal, F.; Gencel, O.; Kaya, M. Combined effect of silica fume and expanded vermiculite on properties of lightweight mortars at ambient and elevated temperatures. Constr. Build. Mater. 2015, 88, 175–187. [Google Scholar] [CrossRef]
- Gencel, O.; Gholampour, A.; Tokay, H.; Ozbakkaloglu, T. Replacement of Natural Sand with Expanded Vermiculite in Fly Ash-Based Geopolymer Mortars. Appl. Sci. 2021, 11, 1917. [Google Scholar] [CrossRef]
- Hasanabadi, S.; Sadrameli, S.M.; Sami, S. Preparation, characterisation and thermal properties of surface modifed expanded perlite/paraffin as a form stable phase change composite in concrete. J. Therm. Anal. Calorim. 2021, 144, 61–69. [Google Scholar] [CrossRef]
- Santos, T.; Gomes, M.I.; Silva, A.S.; Ferraz, E.; Faria, P. Comparison of mineralogical, mechanical and hygroscopic characteristic of earthen, gypsum and cement-based plasters. Constr. Build. Mater. 2020, 254, 119222. [Google Scholar] [CrossRef]
- Babu, K.S.; Ratnam, C. Mechanical and thermophysical behaviour of hemp fibre reinforced gypsum composites. Mater. Today Proc. 2020, 44, 2245–2249. [Google Scholar] [CrossRef]
- Mayo-Corrochano, C.; Sánchez-Aparicio, L.J.; Aira, J.; Sanz-Arauz, D.; Moreno, E.; Melo, J.P. Assessment of the elastic properties of high-fired gypsum using the digital image correlation method. Constr. Build. Mater. 2022, 317, 125945. [Google Scholar] [CrossRef]
- Rahmanian, I. Thermal and Mechanical Properties of Gypsum Boards and Their Influences on Fire Resistance of Gypsum Board Based Systems. Ph.D. Thesis, University of Manchester, Manchester, UK, 2011. [Google Scholar]
- Vaz-Ramos, J.; Santiago, A.; Portugal, A.; Durães, L. Synthesis of silica nanoparticles to enhance the fire resistance of cement mortars. Fire Res. 2019, 3, 44–48. [Google Scholar] [CrossRef]
- EN 12390-5; Testing Hardened Concrete. Part 5: Flexural Strength of Test Specimens. European Committee for Standardization (CEN): Brussels, Belgium, 2019.
- EN 1015; Methods of Test for Mortar for Masonry. Part 11: Determination of Flexural and Compressive Strength of Hardened Mortar. European Committee for Standardization (CEN): Brussels, Belgium, 2020.
- ASTM C20-00; Standard Test Methods for Apparent Porosity, Water Absorption, Apparent Specific Gravity, and Bulk Density of Burned Refractory Brick and Shapes by Boiling Water. ASTM International: West Conshohocken, PA, USA, 2020.
- ISO/DIS 15901-1; Evaluation of Pore Size Distribution and Porosity of Solid Materials by Mercury Porosimetry and Gas Adsorption, Part 1: Mercury Porosimetry. International Organization for Standardization (ISO): Geneva, Switzerland, 2014.
- ASTM D 2845-05; Standard Test Method for Laboratory Determination of Pulse Velocities and Ultrasonic Elastic Constants of Rock. ASTM International: West Conshohocken, PA, USA, 2005.
- ASTM E 1876-01; Standard Test Method for Dynamic Young’s Modulus, Shear Modulus, and Poisson’s Ratio by Impulse Excitation of Vibration. ASTM International: West Conshohocken, PA, USA, 2002.
- Ugarte, J.F.O.; Sampaio, J.A.; França, S.C.A. Chapter 38: Vermiculite. In Industrial Rocks and Minerals, 2nd ed.; CETEM: Yecla, Spain, 2008. [Google Scholar]
- Filho, S.H.S.; Vinaches, P.; Pergher, S.B.C. Structural characterisation of expanded perlite. Perspect. Erechim 2017, 41, 81–87. [Google Scholar]
- He, R.; Lu, N. Hydration, fresh, mechanical, and freeze-thaw properties of cement mortar incorporated with polymeric microspheres. Adv. Compos. Hybrid Mater. 2024, 7, 92. [Google Scholar] [CrossRef]
- Luo, D.; Zhou, M.; Li, F.; Niu, D. Chloride ion transport in coral aggregate concrete subjected to coupled erosion by sulfate and chloride salts in drying-wetting cycles. J. Mater. Res. Technol. 2024, 30, 3251–3267. [Google Scholar] [CrossRef]
- He, R.; Nantung, T.; Olek, J.; Lu, N. Field study of the dielectric constant of concrete: A parameter less sensitive to environmental variations than electrical resistivity. J. Build. Eng. 2023, 74, 106938. [Google Scholar] [CrossRef]
- Kondratieva, N.; Barre, M.; Goutenoire, F.; Sanytsky, M. Study of modified gypsum binder. Constr. Build. Mater. 2017, 149, 535–542. [Google Scholar] [CrossRef]
- Azdarpour, A.; Karaei, M.A.; Hamidi, H.; Mohammadian, E.; Honarvar, B. CO2 sequestration through direct aqueous mineral carbonation of red gypsum. Petroleum 2018, 4, 398–407. [Google Scholar] [CrossRef]
- Essabir, H.; Raji, M.; Nekhlaoui, S.; Hassani, I.A.; Essassi, M.; Rodrigue, D.; Bouhfid, R.; Qaiss, A. Utilisation of volcanic amorphous aluminosilicate rocks (perlite) as alternative materials in lightweight composites. Compos. Part B 2019, 165, 47–54. [Google Scholar] [CrossRef]
- Mucahit, S. Influence of expanded vermiculite on physical properties and thermal conductivity of clay bricks. Ceram. Int. 2014, 41, 2819–2827. [Google Scholar] [CrossRef]
- ElNemr, A. Generating water/binder ratio -to- strength curves for cement mortar used in Masonry walls. Constr. Build. Mater. 2020, 233, 117249. [Google Scholar] [CrossRef]
- Cabuk, M.; Yesil, T.A.; Yavuz, M.; Unal, H.I. Colloidal and viscoelastic properties of expanded perlite dispersions. J. Intell. Mater. Syst. Struct. 2018, 29, 32–40. [Google Scholar] [CrossRef]
- Wang, Z.; Xia, Z. Rigid polyurethane/expanded vermiculite/ melamine phenyl phosphate composite foams with good flame retardant and mechanical properties. e-Polymers 2019, 19, 563–573. [Google Scholar] [CrossRef]
- Oliveira, M. Study of the Degradation of 18th Century Alabaster Sculptures through Accelerated Aging on Test Samples; CeROArt: Micheroux, Belgium, 2022. [Google Scholar] [CrossRef]
- Wang, L.; Jin, M.; Guo, F.; Wang, Y.; Tang, S. Pore Structural and Fractal Analysis of the Influence of Fly Ash and Silica Fume on the Mechanical Property and Abrasion Resistance of Concrete. Fractals 2021, 29, 2140003. [Google Scholar] [CrossRef]
- Wang, L.; Jin, M.; Wu, Y.; Zhou, Y.; Tang, S. Hydration, shrinkage, pore structure and fractal dimension of silica fume modified low heat Portland cement-based materials. Constr. Build. Mater. 2021, 272, 121952. [Google Scholar] [CrossRef]
- Liao, Y.; Wang, S.; Wang, K.; Al Qunaynah, S.; Wan, S.; Yuan, Z.; Xu, P.; Tang, S. A study on the hydration of calcium aluminate cement pastes containing silica fume using non-contact electrical resistivity measurement. J. Mater. Res. Technol. 2023, 24, 8135–8149. [Google Scholar] [CrossRef]
- EN 13279-1; Gypsum Binders and Gypsum Plasters. Part 1: Definitions and Requirements. European Committee for Standardization (CEN): Brussels, Belgium, 2005.


Disclaimer/Publisher’s Note: The statements, opinions and data contained in all publications are solely those of the individual author(s) and contributor(s) and not of MDPI and/or the editor(s). MDPI and/or the editor(s) disclaim responsibility for any injury to people or property resulting from any ideas, methods, instructions or products referred to in the content. |
© 2024 by the authors. Licensee MDPI, Basel, Switzerland. This article is an open access article distributed under the terms and conditions of the Creative Commons Attribution (CC BY) license (https://creativecommons.org/licenses/by/4.0/).