Imaging and Optical Emission Spectroscopy of Surface Dielectric Barrier Discharge (SDBD) Plasma Generated Using Reactors with Planar and Cylindrical Electrodes


Abstract
:Featured Application
Abstract

1. Introduction
2. Experimental Setup and Methods
3. Results
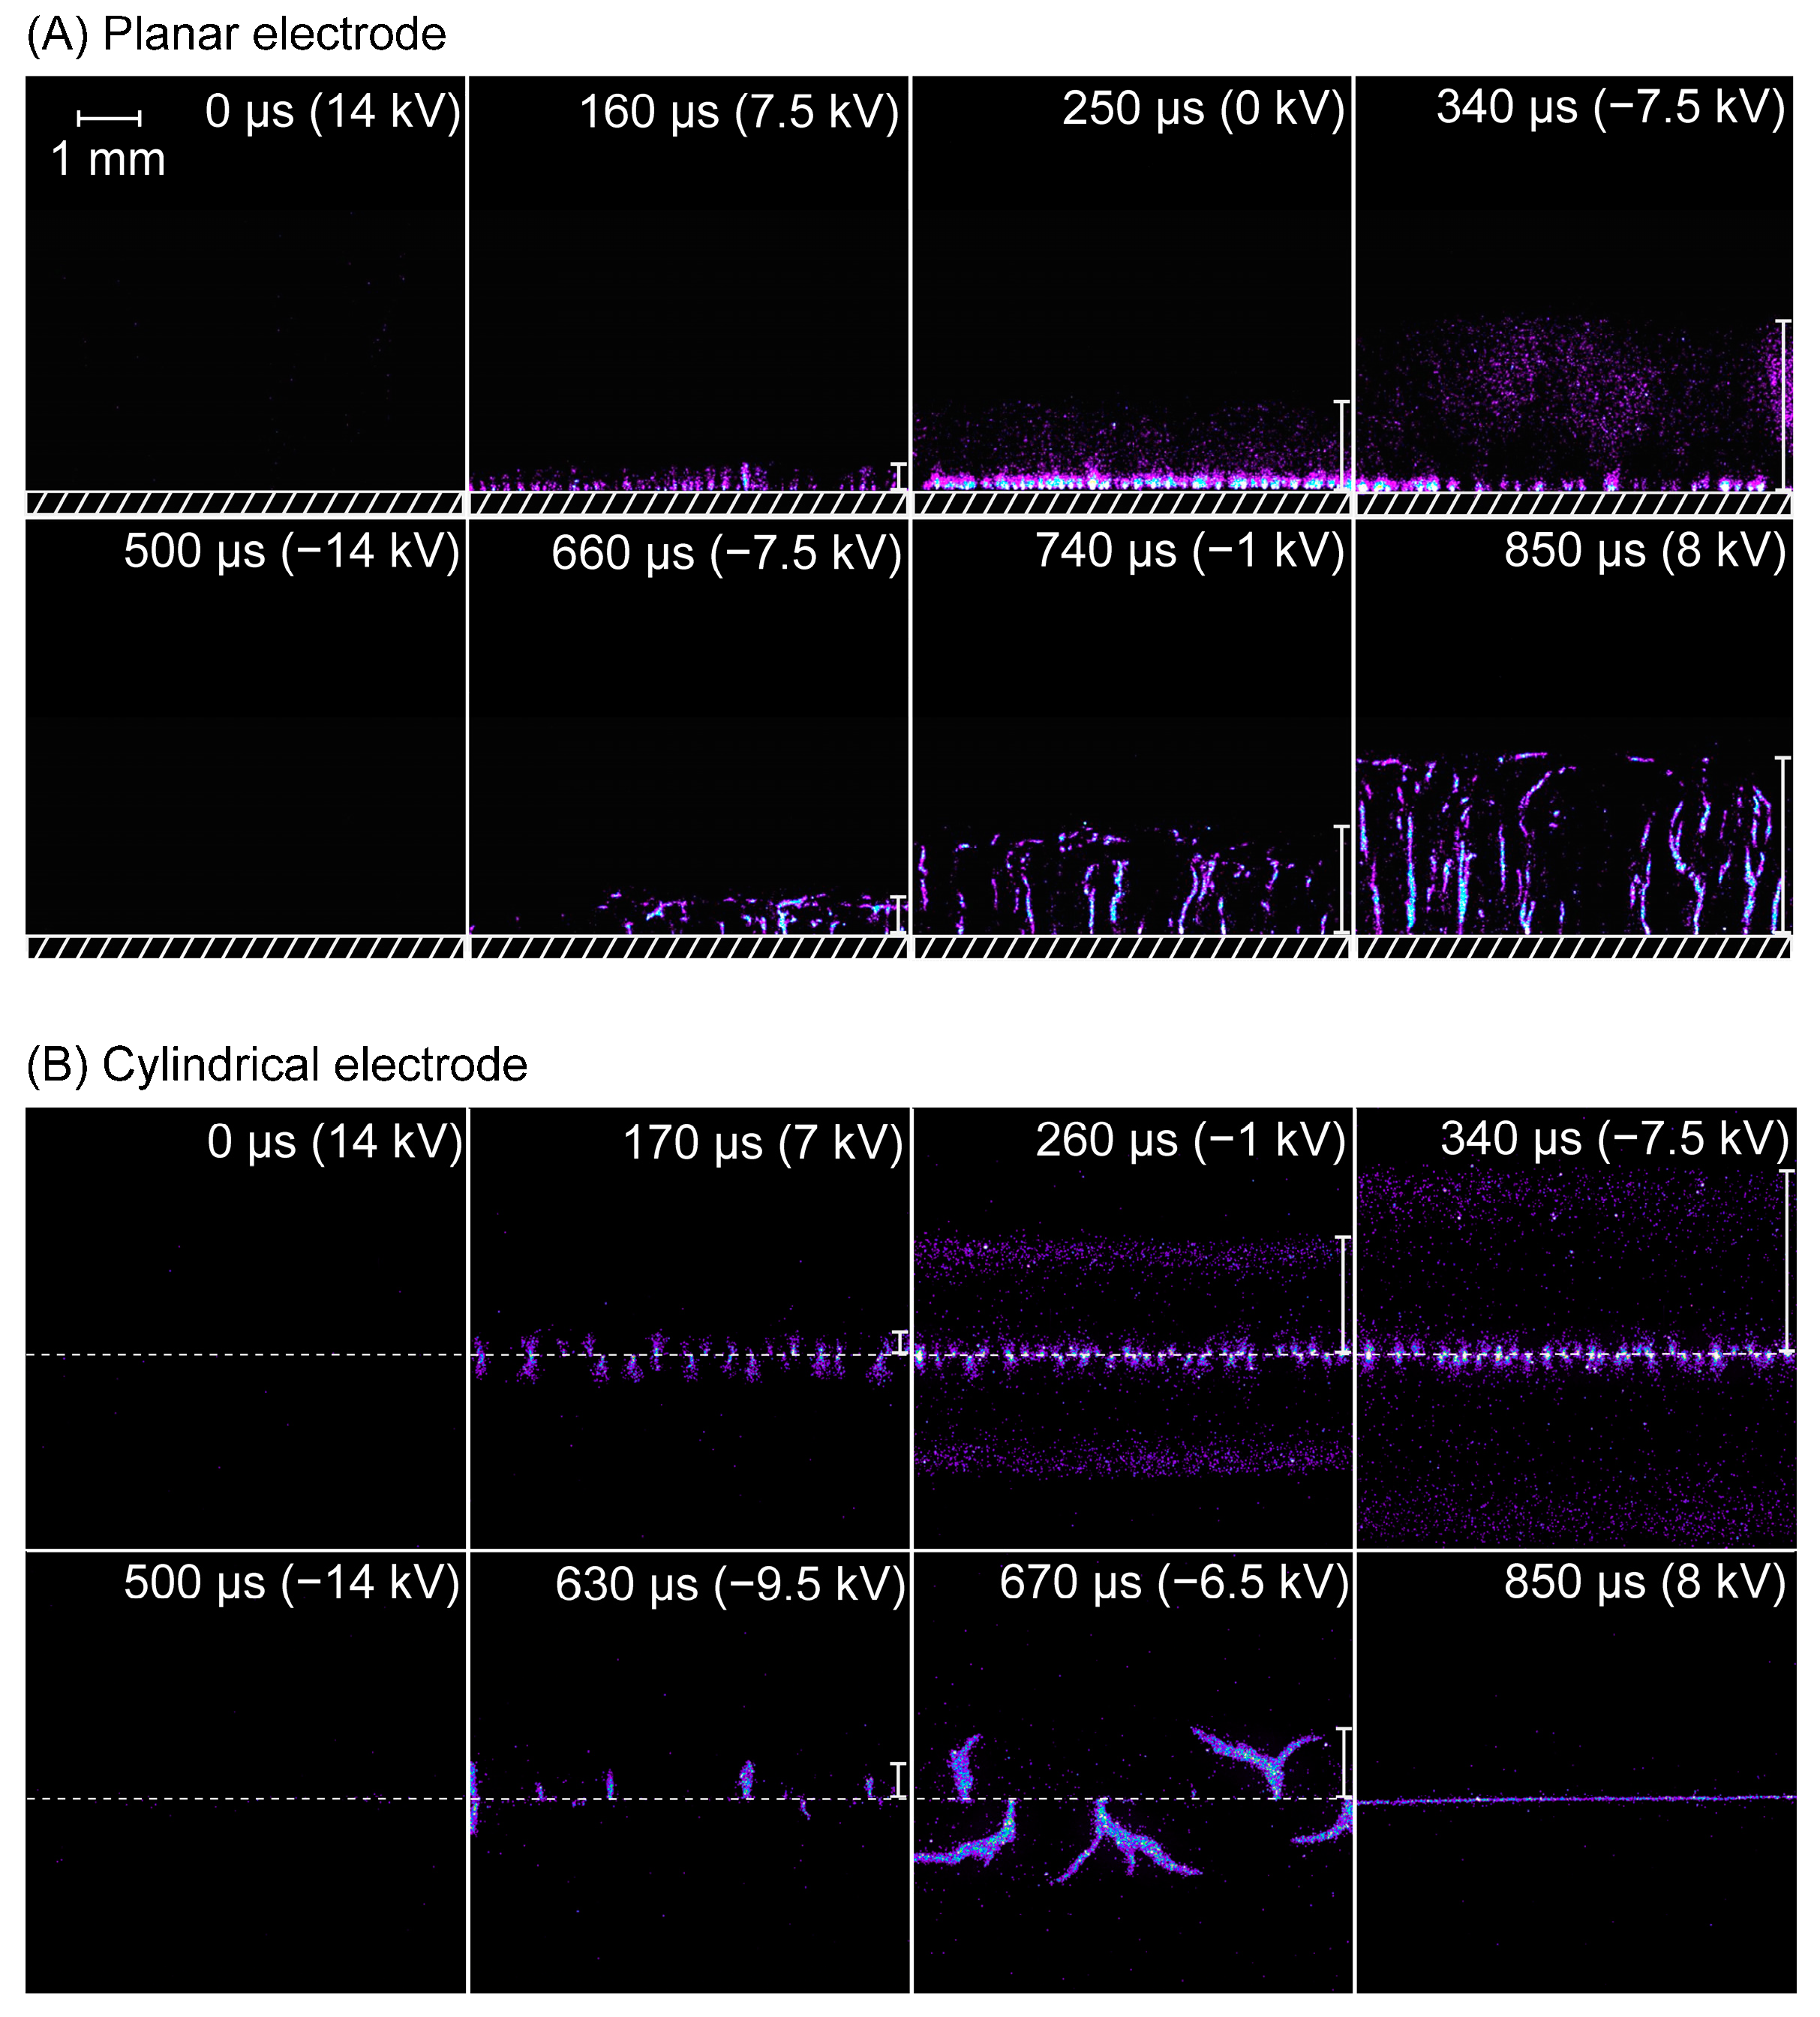
3.1. Plasma Imaging
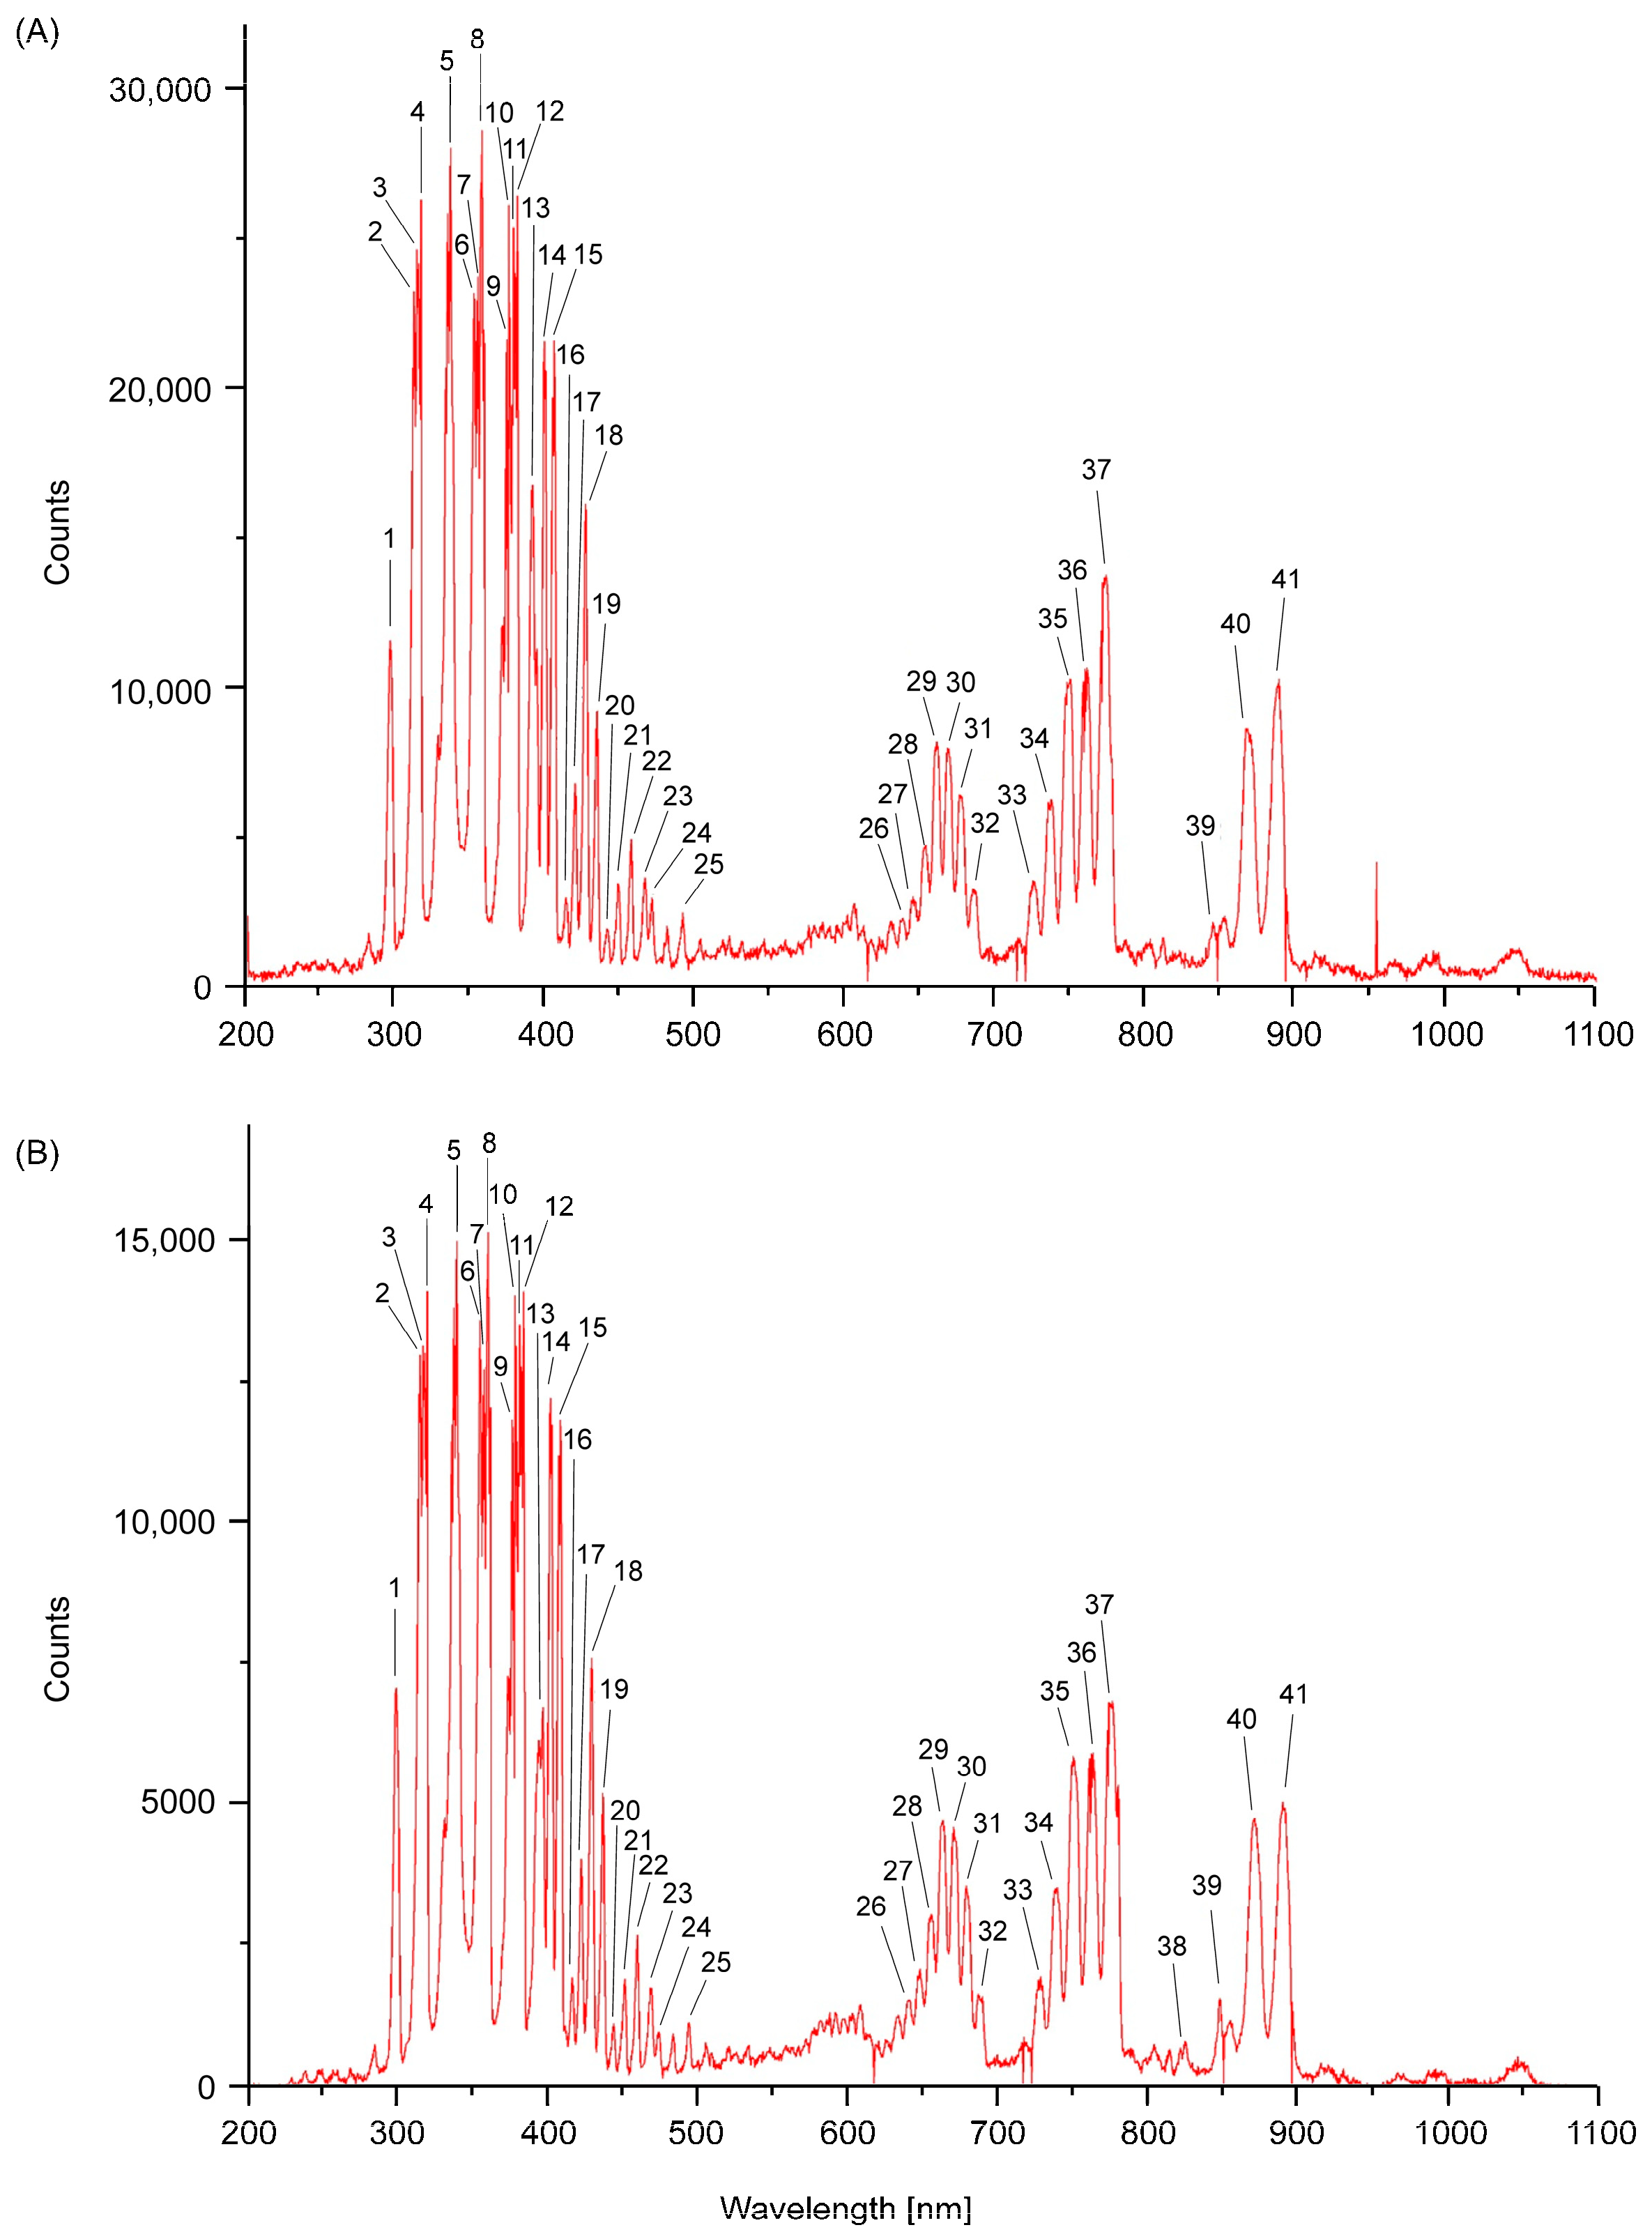
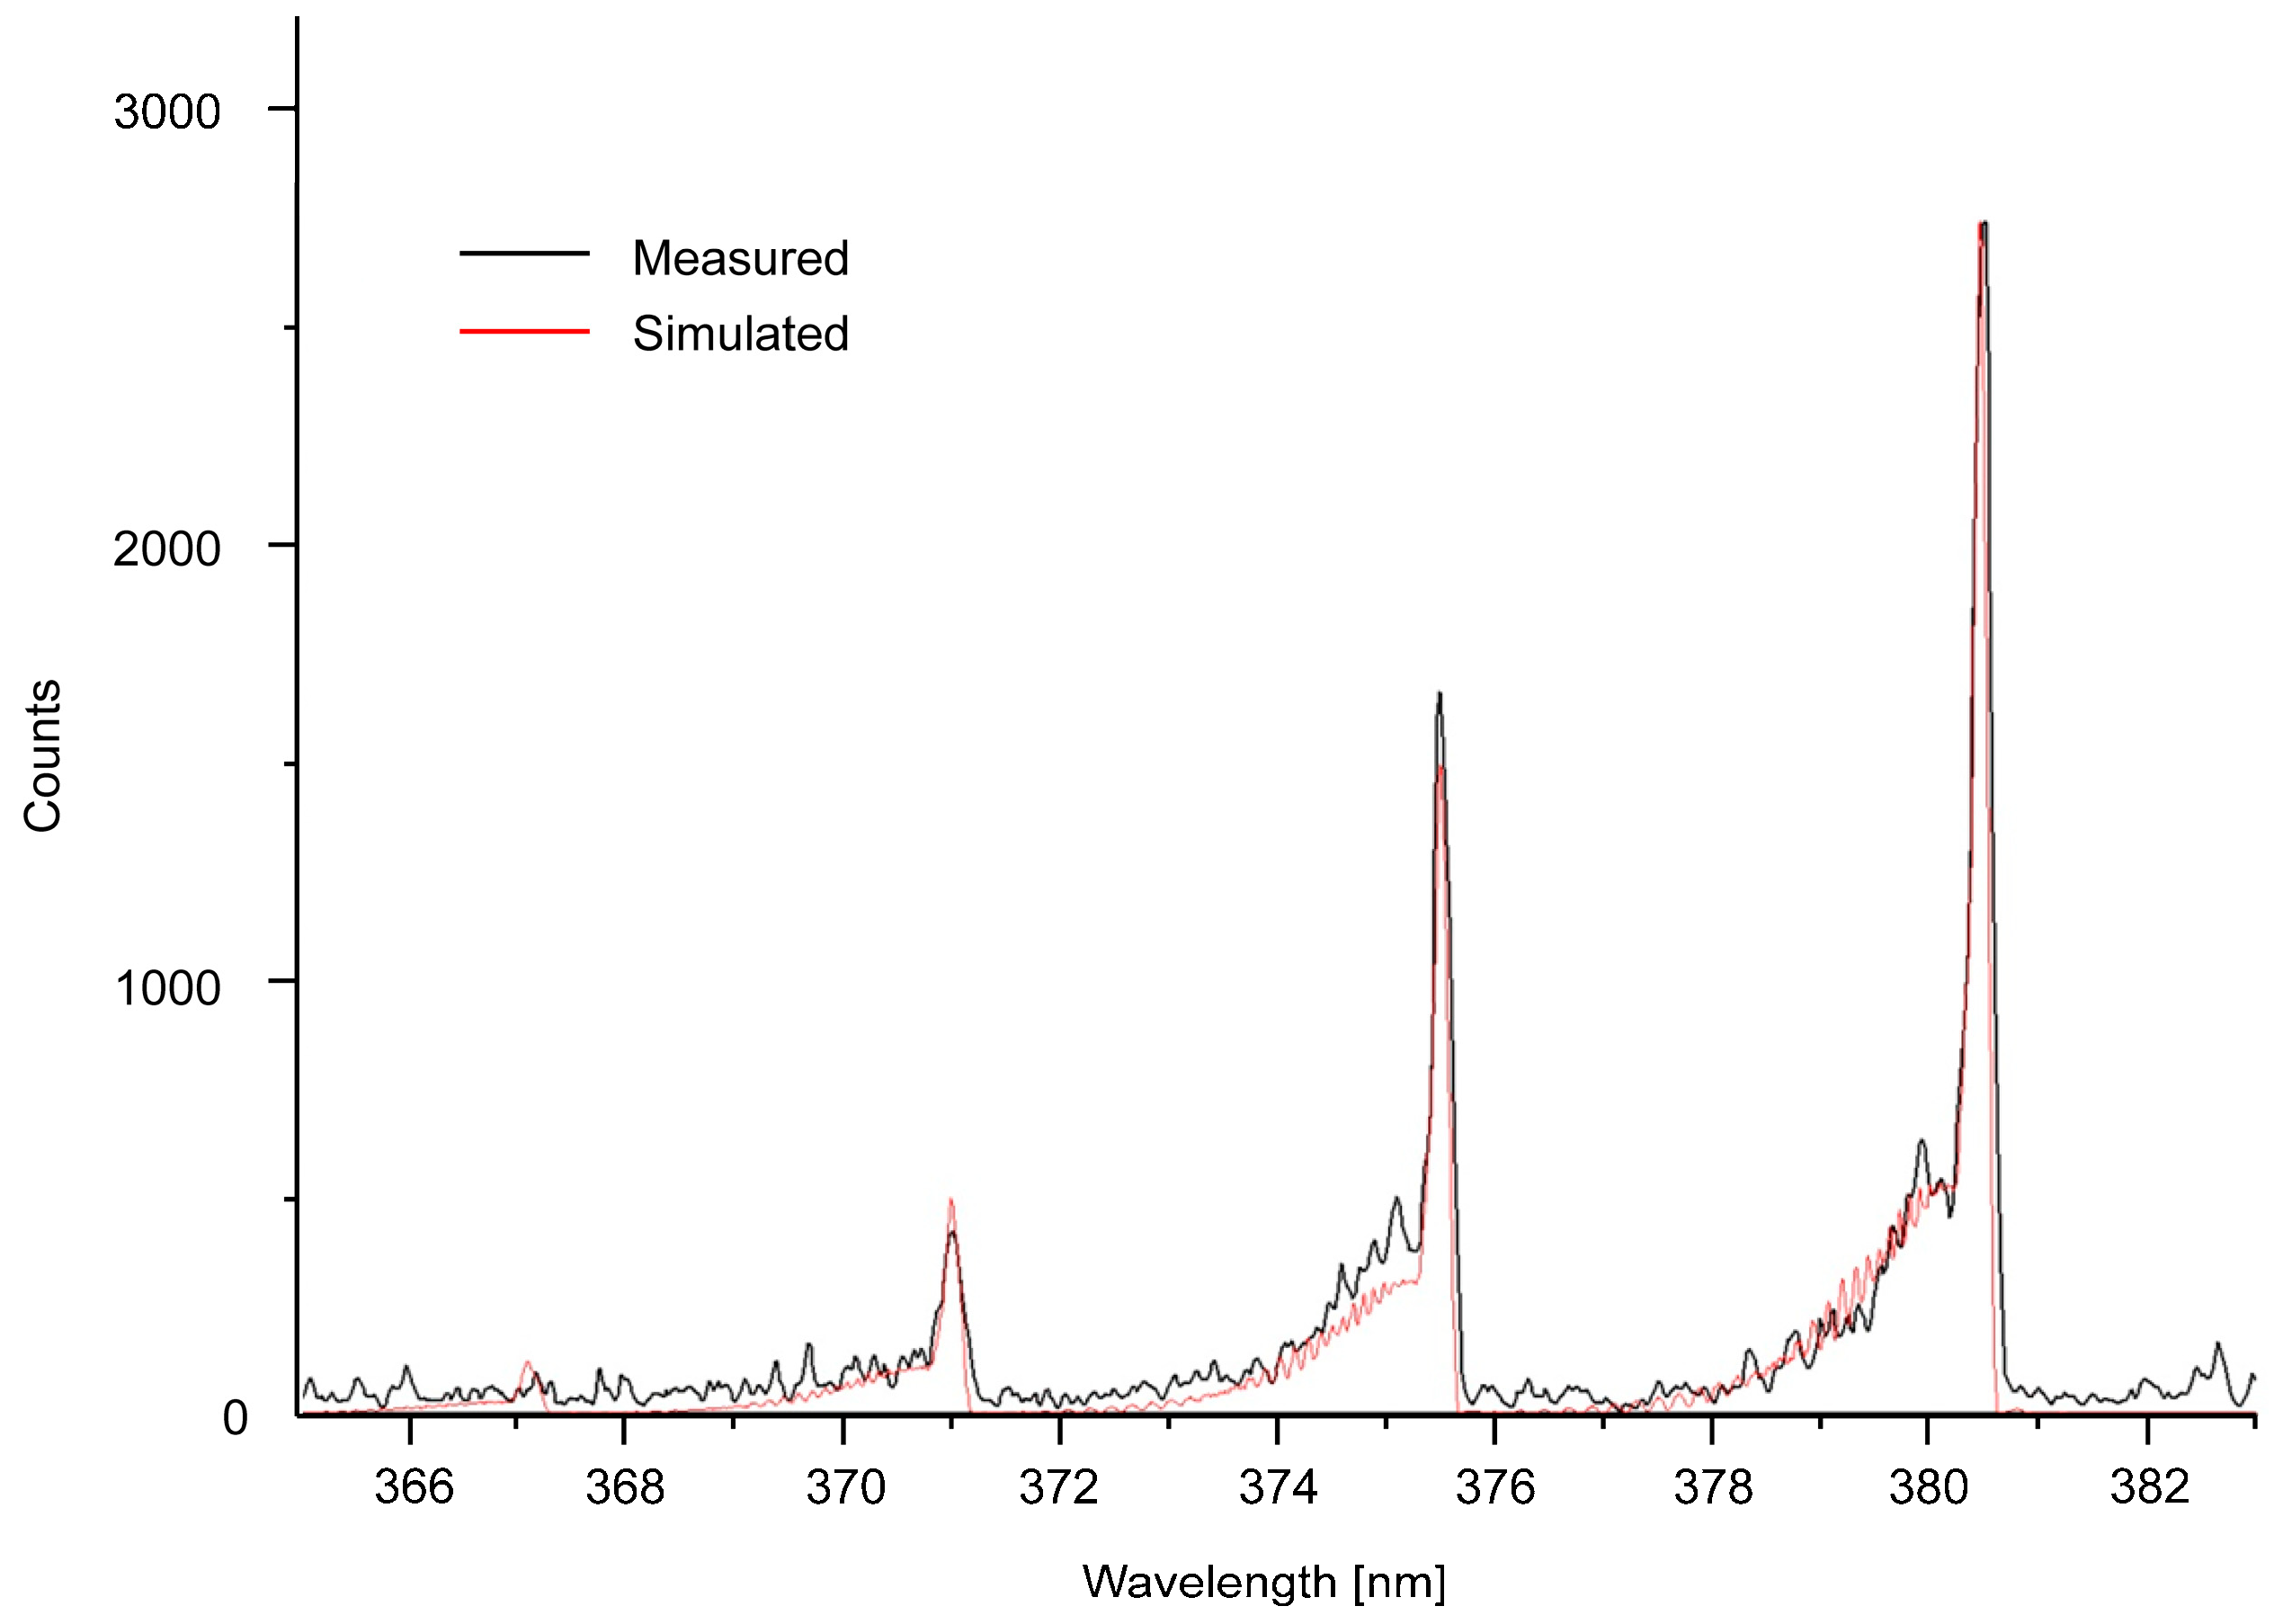
3.2. Plasma Optical Emission Spectroscopy
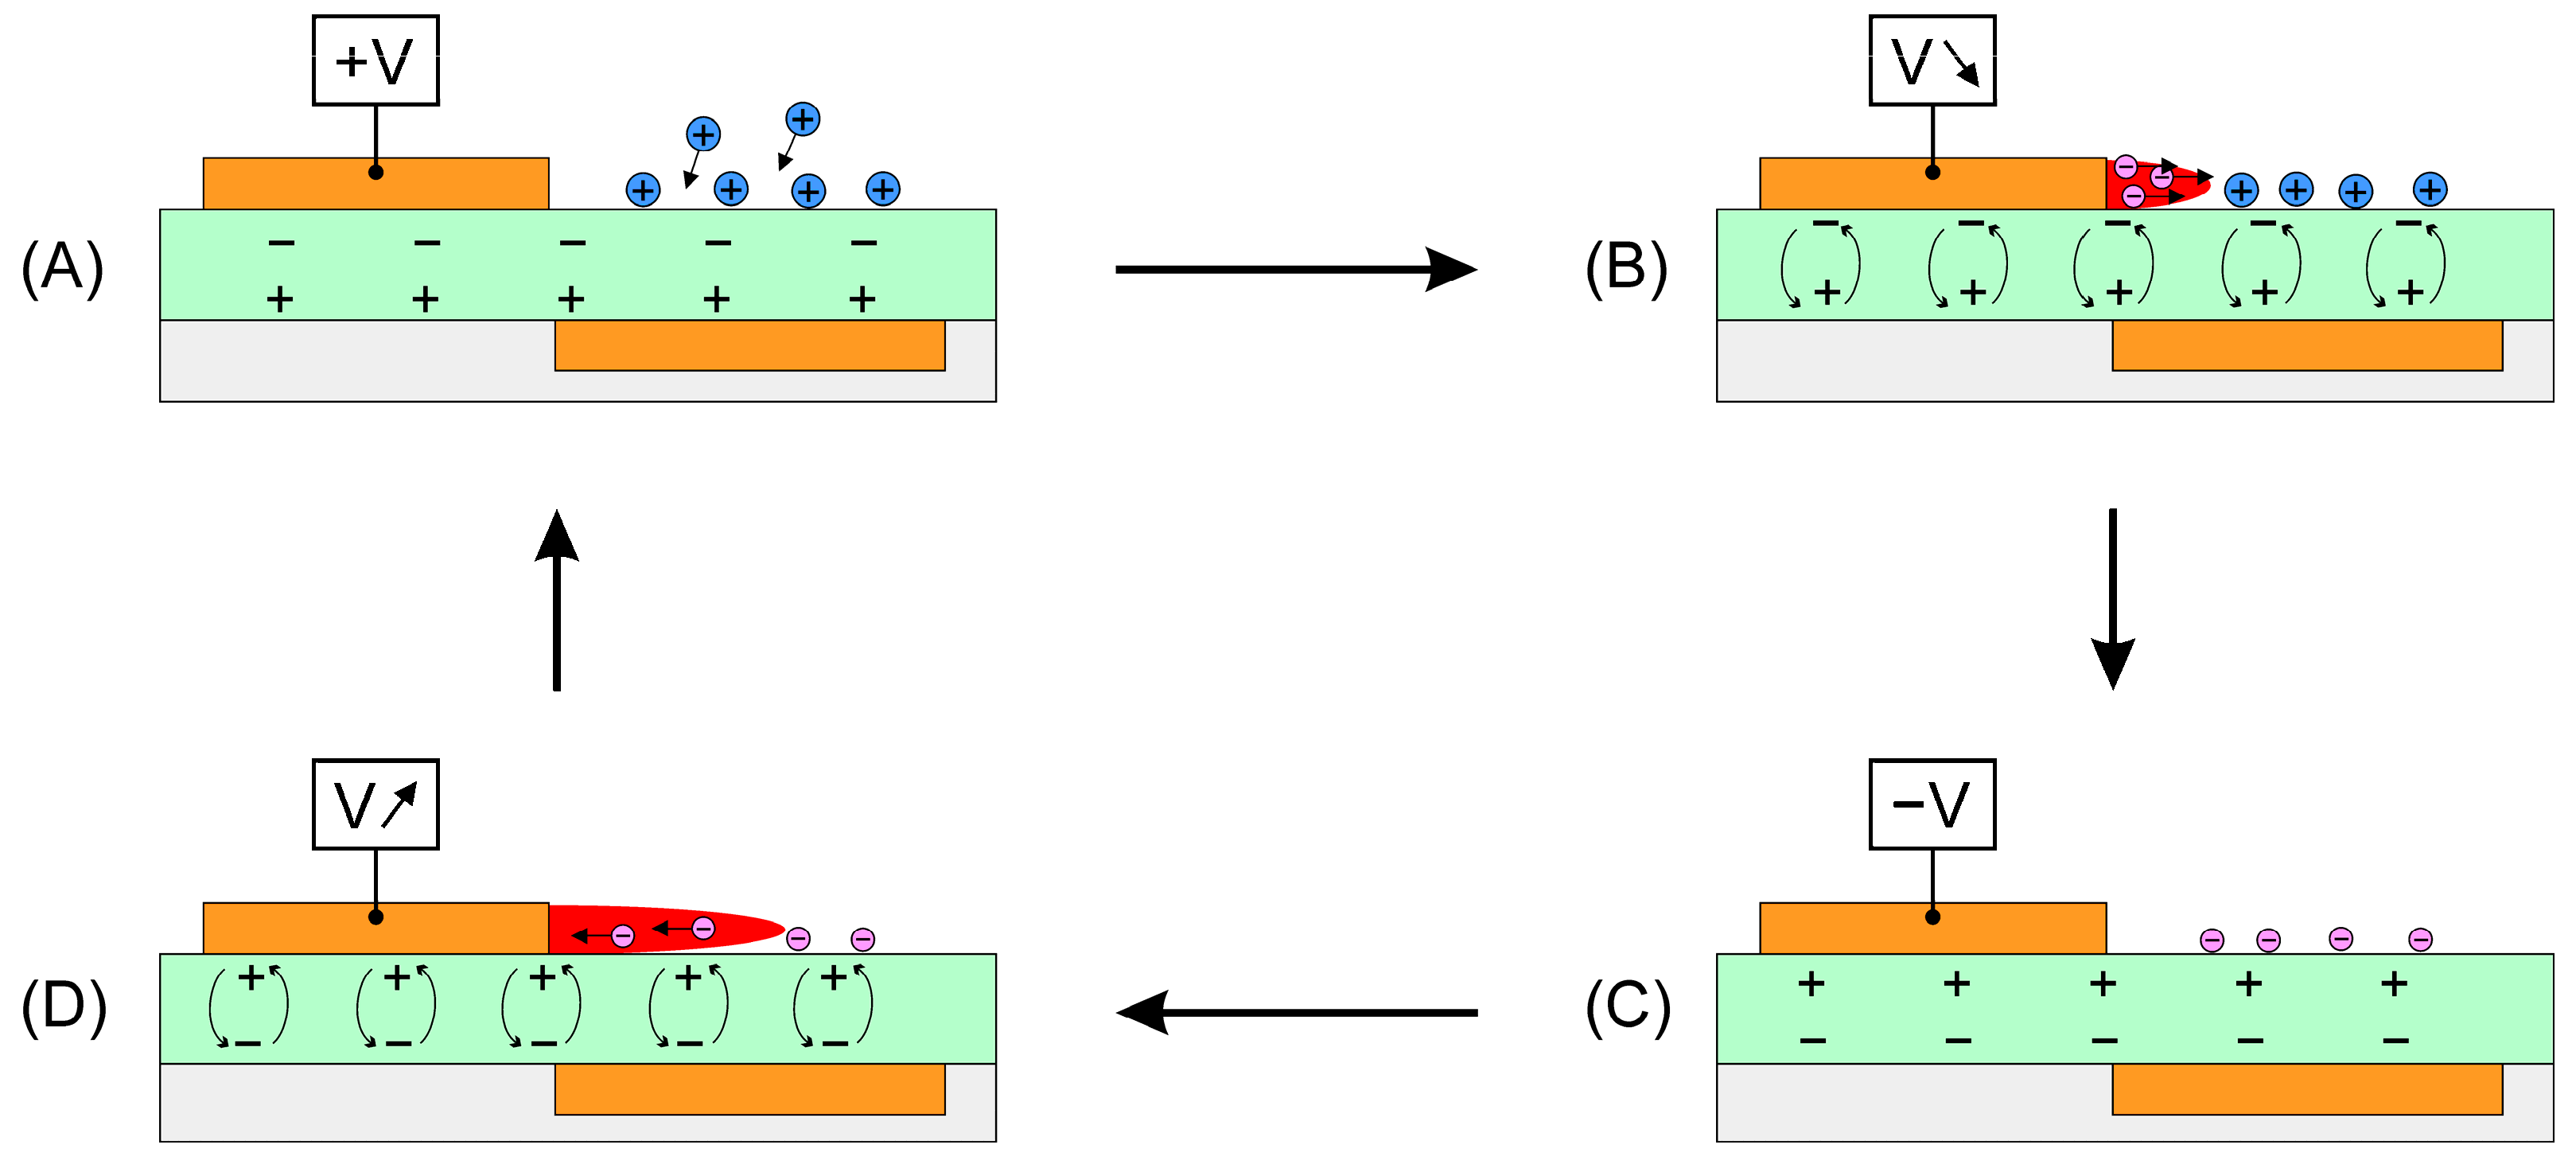
4. Discussion
5. Conclusions
- There are differences in plasma morphology, particularly in the evolution of pseudo-Trichel plumes during the falling half-cycle of the voltage waveform and formation of positive streamers during the rising half-cycle;
- Both positive streamers and plasma plumes are more intense in the planar electrode configuration, while the cylindrical electrode significantly suppresses streamer formation;
- The plasma front velocity remains approximately constant for both reactor types and discharge modes;
- The emission spectrum of the SDBD plasma is dominated by the first and second positive nitrogen bands;
- Despite morphological differences, the plasma thermodynamic properties (rotation, translation, vibration, and electron temperatures) are similar for both reactor types;
- The non-uniform electric field distribution around the planar electrode favors the formation of the plasma onset spots with higher electric field intensity, while the field distribution around the cylindrical electrode lacks such regions, which affects the plasma formation process.
Author Contributions
Funding
Institutional Review Board Statement
Informed Consent Statement
Data Availability Statement
Conflicts of Interest
References
- Siemens, W. Ueber Die Elektrostatische Induction Und Die Verzögerung Des Stroms in Flaschendrähten. Ann. Phys. 1857, 178, 66–122. [Google Scholar] [CrossRef]
- Brandenburg, R.; Becker, K.H.; Weltmann, K.-D. Barrier Discharges in Science and Technology Since 2003: A Tribute and Update. Plasma Chem. Plasma Process. 2023, 43, 1303–1334. [Google Scholar] [CrossRef]
- Kotsonis, M. Diagnostics for Characterisation of Plasma Actuators. Meas. Sci. Technol. 2015, 26, 092001. [Google Scholar] [CrossRef]
- Sidorenko, A.A.; Budovskiy, A.D.; Maslov, A.A.; Postnikov, B.V.; Zanin, B.Y.; Zverkov, I.D.; Kozlov, V.V. Plasma Control of Vortex Flow on a Delta Wing at High Angles of Attack. Exp. Fluids 2013, 54, 1585. [Google Scholar] [CrossRef]
- Pescini, E.; De Giorgi, M.G.; Suma, A.; Francioso, L.; Ficarella, A. Separation Control by a Microfabricated SDBD Plasma Actuator for Small Engine Turbine Applications: Influence of the Excitation Waveform. Aerosp. Sci. Technol. 2018, 76, 442–454. [Google Scholar] [CrossRef]
- Starikovskiy, A.; Meehan, K.; Persikov, N.; Miles, R. Static and Dynamic Stall Control by NS SDBD Actuators. Plasma Sources Sci. Technol. 2019, 28, 054001. [Google Scholar] [CrossRef]
- Joussot, R.; Hong, D.; Weber-Rozenbaum, R.; Leroy-Chesneau, A. Modification of the Laminar-to-Turbulent Transition on a Flat Plate Using DBD Plasma Actuator. In Proceedings of the 5th Flow Control Conference, Chicago, IL, USA, 28 June–1 July 2010. [Google Scholar] [CrossRef]
- Corke, T.C.; Post, M.L.; Orlov, D.M. SDBD Plasma Enhanced Aerodynamics: Concepts, Optimization and Applications. Prog. Aerosp. Sci. 2007, 43, 193–217. [Google Scholar] [CrossRef]
- Korzec, D.; Freund, F.; Bäuml, C.; Penzkofer, P.; Nettesheim, S. Hybrid Dielectric Barrier Discharge Reactor: Characterization for Ozone Production. Plasma 2024, 7, 585–615. [Google Scholar] [CrossRef]
- Nassour, K.; Brahami, M.; Nemmich, S.; Hammadi, N.; Zouzou, N.; Tilmatine, A. Comparative Experimental Study between Surface and Volume DBD Ozone Generator. Ozone Sci. Eng. 2015, 38, 70–76. [Google Scholar] [CrossRef]
- Zylka, P. Evaluation of Ozone Generation in Volume Spiral-Tubular Dielectric Barrier Discharge Source. Energies 2020, 13, 1199. [Google Scholar] [CrossRef]
- Yuan, D.; Zhang, G.; Ling, Z.; Wu, A.; He, Y.; Wang, Z. Characteristics of Temperature Distribution in Atmospheric Pulsed Surface Dielectric Barrier Discharge for Ozone Production. Vacuum 2020, 176, 109351. [Google Scholar] [CrossRef]
- Xie, L.; Yuan, D.; Jin, C.; Xu, H.; Li, Y.; Wei, L.; Wu, W.; Ling, Z. Characteristics of Dielectric Barrier Discharge and Ozone Production in Synthetic Air. Vacuum 2024, 226, 113359. [Google Scholar] [CrossRef]
- Adamiak, K. Two-Species Modeling of Electrohydrodynamic Pump Based on Surface Dielectric Barrier Discharge. J. Electrost. 2020, 106, 103470. [Google Scholar] [CrossRef]
- Li, Z.; Deng, S.; Chen, J. Surface Modification via Dielectric Barrier Discharge Atmospheric Cold Plasma (DBD–ACP): Improved Functional Properties of Soy Protein Film. Foods 2022, 11, 1196. [Google Scholar] [CrossRef] [PubMed]
- Ibrahim, J.; Al-Babtaineh, S.A.; Cousens, S.; Michelmore, A.; Corr, C.; Whittle, J. A Surface Dielectric Barrier Discharge for Deposition of Allylamine Polymer Costings. Appl. Surf. Sci. 2021, 544, 148826. [Google Scholar] [CrossRef]
- Udachin, V.; Wegewitz, L.; Dahle, S.; Maus-Friedrichs, W. Reduction of Copper Surface Oxide Using a Sub-Atmospheric Dielectric Barrier Discharge Plasma. Appl. Surf. Sci. 2022, 573, 151568. [Google Scholar] [CrossRef]
- Kang, M.S.; Yu, G.; Shin, J.; Hwang, J. Collection and Decomposition of Oil Mist via Corona Discharge and Surface Dielectric Barrier Discharge. J. Hazard. Mater. 2021, 411, 125038. [Google Scholar] [CrossRef]
- Tański, M.; Reza, A.; Przytuła, D.; Garasz, K.; Tomaszewski, A. Electrostatic Precipitator with Surface Dielectric Barrier Discharge Ionizer. J. Clean. Prod. 2023, 404, 136990. [Google Scholar] [CrossRef]
- Veerana, M.; Mumtaz, S.; Rana, J.N.; Javed, R.; Panngom, K.; Ahmed, B.; Akter, K.; Choi, E.H. Recent Advances in Non-Thermal Plasma for Seed Germination, Plant Growth, and Secondary Metabolite Synthesis: A Promising Frontier for Sustainable Agriculture. Plasma Chem. Plasma Process. 2024, 44, 2263–2302. [Google Scholar] [CrossRef]
- Debien, A.; Benard, N.; Moreau, E. Streamer Inhibition for Improving Force and Electric Wind Produced by DBD Actuators. J. Phys. D Appl. Phys. 2012, 45, 215201. [Google Scholar] [CrossRef]
- Debien, A.; Benard, N.; David, L.; Moreau, E. Unsteady Aspect of the Electrohydrodynamic Force Produced by Surface Dielectric Barrier Discharge Actuators. Appl. Phys. Lett. 2012, 100, 013901. [Google Scholar] [CrossRef]
- Moreau, E.; Cazour, J.; Benard, N. Influence of the Air-Exposed Active Electrode Shape on the Electrical, Optical and Mechanical Characteristics of a Surface Dielectric Barrier Discharge Plasma Actuator. J. Electrost. 2018, 93, 146–153. [Google Scholar] [CrossRef]
- Nakano, A.; Kaneko, Y.; Nishida, H. Investigation on Voltage Waveform Characteristics of Plasma Actuators with Different Electrode Geometry for High Performance. In Proceedings of the AIAA Scitech 2020 Forum, Orlando, FL, USA, 6–10 January 2020. [Google Scholar] [CrossRef]
- Kaneko, Y.; Nishida, H.; Tagawa, Y. Visualization of the Electrohydrodynamic and Thermal Effects of AC-DBD Plasma Actuators of Plate- and Wire-Exposed Electrodes. Actuators 2022, 11, 38. [Google Scholar] [CrossRef]
- Li, J.-Q.; Yan, H.-J.; Li, T.; Yu, S.-Q.; Fan, J.-W.; Song, J. Surface Charge Characteristics in Surface Dielectric Barrier Discharge Actuators with Thin Cylindrical Exposed Electrode. J. Appl. Phys. 2023, 133, 063301. [Google Scholar] [CrossRef]
- Zhang, X.; Zhao, Y.; Yang, C. Recent Developments in Thermal Characteristics of Surface Dielectric Barrier Discharge Plasma Actuators Driven by Sinusoidal High-Voltage Power. Chin. J. Aeronaut. 2023, 36, 1–21. [Google Scholar] [CrossRef]
- Enloe, C.L.; McLaughlin, T.E.; VanDyken, R.D.; Kachner, K.D.; Jumper, E.J.; Corke, T.C. Mechanisms and Responses of a Single Dielectric Barrier Plasma Actuator: Plasma Morphology. AIAA J. 2004, 42, 589–594. [Google Scholar] [CrossRef]
- Benard, N.; Moreau, E. Electrical and Mechanical Characteristics of Surface AC Dielectric Barrier Discharge Plasma Actuators Applied to Airflow Control. Exp. Fluids 2014, 55, 43. [Google Scholar] [CrossRef]
- Selivonin, I.; Moralev, I. Microdischarges Properties in sDBD: The Role of the Exposed Electrode Oxidation. Plasma Sources Sci. Technol. 2020, 30, 035005. [Google Scholar] [CrossRef]
- Benard, N.; Moreau, E. Role of the Electric Waveform Supplying a Dielectric Barrier Discharge Plasma Actuator. Appl. Phys. Lett. 2012, 100, 193503. [Google Scholar] [CrossRef]
- Tirumala, R.; Benard, N.; Moreau, E.; Fenot, M.; Lalizel, G.; Dorignac, E. Temperature Characterization of Dielectric Barrier Discharge Actuators: Influence of Electrical and Geometric Parameters. J. Phys. D Appl. Phys. 2014, 47, 255203. [Google Scholar] [CrossRef]
- Bayoda, K.D.; Benard, N.; Moreau, E. Elongating the Area of Plasma/Fluid Interaction of Surface Nanosecond Pulsed Discharges. J. Electrost. 2015, 74, 79–84. [Google Scholar] [CrossRef]
- Zhang, Y.; Li, J.; Jiang, N.; Shang, K.-F.; Lu, N.; Wu, Y. Optical Characteristics of the Filamentary and Diffuse Modes in Surface Dielectric Barrier Discharge. Spectrochim. Acta Part A Mol. Biomol. Spectrosc. 2016, 168, 230–234. [Google Scholar] [CrossRef] [PubMed]
- Shcherbanev, S.A.; Ding, C.; Starikovskaia, S.M.; Popov, N.A. Filamentary Nanosecond Surface Dielectric Barrier Discharge. Plasma Properties in the Filaments. Plasma Sources Sci. Technol. 2019, 28, 065013. [Google Scholar] [CrossRef]
- Wu, Y.; Li, Y.; Jia, M.; Song, H.; Su, C.; Pu, Y. Experimental Investigation into Characteristics of Plasma Aerodynamic Actuation Generated by Dielectric Barrier Discharge. Chin. J. Aeronaut. 2010, 23, 39–45. [Google Scholar] [CrossRef]
- Nupangtha, W.; Kuensaen, C.; Ngamjarurojana, A.; Chomdej, S.; Boonyawan, D. A Surface Dielectric Barrier Discharge Non-Thermal Plasma to Induce Cell Death in Colorectal Cancer Cells. AIP Adv. 2021, 11, 075222. [Google Scholar] [CrossRef]
- Jangra, R.; Ahlawat, K.; Prakash, R. An SDBD Plasma-Based Source for Efficient Degradation of VOCs in an Enclosed Environment. Phys. Lett. A 2023, 490, 129184. [Google Scholar] [CrossRef]
- Burhenn, S.; Golda, J.; Kratzer, J.; Brandt, S.; Held, J. Characterization of a Co-Planar Dielectric Barrier Discharge Design as a Plasma Source for Trace Element Detection by Atomic Spectrometry. Spectrochim. Acta Part B At. Spectrosc. 2024, 213, 106884. [Google Scholar] [CrossRef]
- Kunze, H.J. Introduction to Plasma Spectroscopy, 1st ed.; Springer Science & Business Media: Berlin, Germany, 2009; pp. 1–203. [Google Scholar]
- Moreau, E.; Benard, N. Ionic Wind Produced by Volume Corona Discharges and Surface Dielectric Barrier Discharges: What Role Do Streamers Play? J. Electrost. 2024, 132, 103988. [Google Scholar] [CrossRef]
- Guo, T.; Du, X.; Peng, Z.; Xu, L.; Dong, J.; Li, J.; Cheng, P.; Zhou, Z. Quantification and Risk Assessment of Organic Products Resulting from Non-thermal Plasma Removal of Toluene in Nitrogen. Rapid Commun. Mass Spectrom. 2017, 31, 1424–1430. [Google Scholar] [CrossRef]
- Zhou, L.; Wei, L.; Yang, Z.; Suo, C.; Li, J.; Zhou, D.; Ding, Y.; Li, H.; Tang, J. Time-Domain Signal Analysis of Dielectric Response of Nonlinear SDBD Thruster in near Space. Vacuum 2023, 207, 111666. [Google Scholar] [CrossRef]
- Galmiz, O.; Pavlinak, D.; Zemanek, M.; Brablec, A.; Cernak, M. Study of Surface Dielectric Barrier Discharge Generated Using Liquid Electrodes in Different Gases. J. Phys. D Appl. Phys. 2015, 49, 065201. [Google Scholar] [CrossRef]
- Moreau, E.; Defoort, E. Effect of the High Voltage Waveform on the Ionic Wind Produced by a Needle-to-Plate Dielectric Barrier Discharge. Sci. Rep. 2022, 12, 18699. [Google Scholar] [CrossRef] [PubMed]
- Zhang, Y.; Yao, J.; Liu, G.; Yuan, C.; He, X.; Wang, X. Characteristics of OH Production at Atmospheric-Pressure Discharge in He/Ar- Air Dielectric Barrier Discharge. In Proceedings of the 2024 IEEE International Conference on Plasma Science (ICOPS), Beijing, China, 16–20 June 2024. [Google Scholar] [CrossRef]
- Yao, S.; Weng, S.; Tang, Y.; Zhao, C.; Wu, Z.; Zhang, X.; Yamamoto, S.; Kodama, S. Characteristics of OH Production by O2/H2O Pulsed Dielectric Barrier Discharge. Vacuum 2016, 126, 16–23. [Google Scholar] [CrossRef]
- Hsieh, K.; Burlica, R.; Locke, B.R. Optical Diagnostics of Electrical Discharge Water Spray Reactors for Chemical Synthesis. In Proceedings of the 2011 IEEE Industry Applications Society Annual Meeting, Orlando, FL, USA, 9–13 October 2011. [Google Scholar] [CrossRef]
- Zhang, G.; Jin, W.; Zheng, H. Dynamic Mechanism about the Fluorescence Emission of NO Dielectric Barrier Discharge Plasma. J. Quant. Spectrosc. Radiat. Transf. 2013, 127, 90–95. [Google Scholar] [CrossRef]
- Dimitrakellis, P.; Faubert, F.; Wartel, M.; Gogolides, E.; Pellerin, S. Plasma Surface Modification of Epoxy Polymer in Air DBD and Gliding Arc. Processes 2022, 10, 104. [Google Scholar] [CrossRef]
- Roberts, J.R. 3. Glow Discharges and Wall Stabilized Arcs. Exp. Methods Phys. Sci. 1998, 31, 37–63. [Google Scholar] [CrossRef]
- Völker, T.; Gornushkin, I.B. Extension of the Boltzmann Plot Method for Multiplet Emission Lines. J. Quant. Spectrosc. Radiat. Transf. 2023, 310, 108741. [Google Scholar] [CrossRef]
- Bousquet, B.; Gardette, V.; Ros, V.M.; Gaudiuso, R.; Dell’Aglio, M.; De Giacomo, A. Plasma Excitation Temperature Obtained with Boltzmann Plot Method: Significance, Precision, Trueness and Accuracy. Spectrochim. Acta Part B At. Spectrosc. 2023, 204, 106686. [Google Scholar] [CrossRef]
- Biganzoli, I.; Barni, R.; Riccardi, C.; Gurioli, A.; Pertile, R. Optical and Electrical Characterization of a Surface Dielectric Barrier Discharge Plasma Actuator. Plasma Sources Sci. Technol. 2013, 22, 025009. [Google Scholar] [CrossRef]
- Gulec, A.; Oksuz, L.; Hershkowitz, N. Optical Studies of Dielectric Barrier Plasma Aerodynamic Actuators. Plasma Sources Sci. Technol. 2011, 20, 045019. [Google Scholar] [CrossRef]
- Enloe, C.; McLaughlin, T.; Font, G.; Baughn, J. Parameterization of Temporal Structure in the Single Dielectric Barrier Aerodynamic Plasma Actuator (Invited). In Proceedings of the 43rd AIAA Aerospace Sciences Meeting and Exhibit, Reno, NV, USA, 10–13 January 2005. [Google Scholar] [CrossRef]
- Soloviev, V.R.; Selivonin, I.V.; Moralev, I.A. Breakdown Voltage for Surface Dielectric Barrier Discharge Ignition in Atmospheric Air. Phys. Plasmas 2017, 24, 103528. [Google Scholar] [CrossRef]
- Takeuchi, N.; Hamasaki, T.; Yasuoka, K.; Sakurai, T. Surface Charge Measurement in Surface Dielectric Barrier Discharge by Laser Polarimetry. J. Electrost. 2011, 69, 87–91. [Google Scholar] [CrossRef]


| Band or Line Number | Wavelength [nm] | Band |
|---|---|---|
| 1 | 296.2 | N2 SP |
| 2 | 312.2 | N2 SP |
| 3 | 314.1 | N2 SP |
| 4 | 316.9 | N2 SP |
| 5 | 336.6 | N2 SP |
| 6 | 352.0 | N2 SP |
| 7 | 354.8 | N2 SP |
| 8 | 357.8 | N2 SP |
| 9 | 373.5 | N2 SP |
| 10 | 375.4 | N2 SP |
| 11 | 378.6 | N2 SP |
| 12 | 381.0 | N2 SP |
| 13 | 393.1 | N2+ FN |
| 14 | 399.1 | N2 SP |
| 15 | 405.6 | N2 SP |
| 16 | 413.5 | N2 SP |
| 17 | 419.5 | N2 SP |
| 18 | 426.4 | N2 SP |
| 19 | 433.8 | N2 SP |
| 20 | 441.2 | N2 SP |
| 21 | 448.3 | N2 SP |
| 22 | 456.9 | N2 SP |
| 23 | 465.5 | N2 SP |
| 24 | 471.1 | N2 SP |
| 25 | 491.3 | N2 SP |
| 26 | 637.5 | N2 FP |
| 27 | 645.1 | N2 FP |
| 28 | 652.7 | N2 FP |
| 29 | 660.3 | N2 FP |
| 30 | 667.5 | N2 FP |
| 31 | 676.0 | N2 FP |
| 32 | 684.0 | N2 FP |
| 33 | 725.5 | N2 FP |
| 34 | 736.5 | N2 FP |
| 35 | 747.2 | N2 FP |
| 36 | 760.4 | N2 FP |
| 37 | 771.0 | N2 FP |
| 38 | 818.6 | N |
| 39 | 844.8 | O |
| 40 | 868.0 | N2 FP |
| 41 | 886.7 | N2 FP |
Disclaimer/Publisher’s Note: The statements, opinions and data contained in all publications are solely those of the individual author(s) and contributor(s) and not of MDPI and/or the editor(s). MDPI and/or the editor(s) disclaim responsibility for any injury to people or property resulting from any ideas, methods, instructions or products referred to in the content. |
© 2024 by the authors. Licensee MDPI, Basel, Switzerland. This article is an open access article distributed under the terms and conditions of the Creative Commons Attribution (CC BY) license (https://creativecommons.org/licenses/by/4.0/).
Share and Cite
Tański, M.; Podliński, J.; Berendt, A.; Mizeraczyk, J. Imaging and Optical Emission Spectroscopy of Surface Dielectric Barrier Discharge (SDBD) Plasma Generated Using Reactors with Planar and Cylindrical Electrodes. Appl. Sci. 2024, 14, 11596. https://doi.org/10.3390/app142411596
Tański M, Podliński J, Berendt A, Mizeraczyk J. Imaging and Optical Emission Spectroscopy of Surface Dielectric Barrier Discharge (SDBD) Plasma Generated Using Reactors with Planar and Cylindrical Electrodes. Applied Sciences. 2024; 14(24):11596. https://doi.org/10.3390/app142411596
Chicago/Turabian StyleTański, Mateusz, Janusz Podliński, Artur Berendt, and Jerzy Mizeraczyk. 2024. "Imaging and Optical Emission Spectroscopy of Surface Dielectric Barrier Discharge (SDBD) Plasma Generated Using Reactors with Planar and Cylindrical Electrodes" Applied Sciences 14, no. 24: 11596. https://doi.org/10.3390/app142411596
APA StyleTański, M., Podliński, J., Berendt, A., & Mizeraczyk, J. (2024). Imaging and Optical Emission Spectroscopy of Surface Dielectric Barrier Discharge (SDBD) Plasma Generated Using Reactors with Planar and Cylindrical Electrodes. Applied Sciences, 14(24), 11596. https://doi.org/10.3390/app142411596