
AIoT Monitoring Technology for Optimal Fill Dam Installation and Operation


Abstract
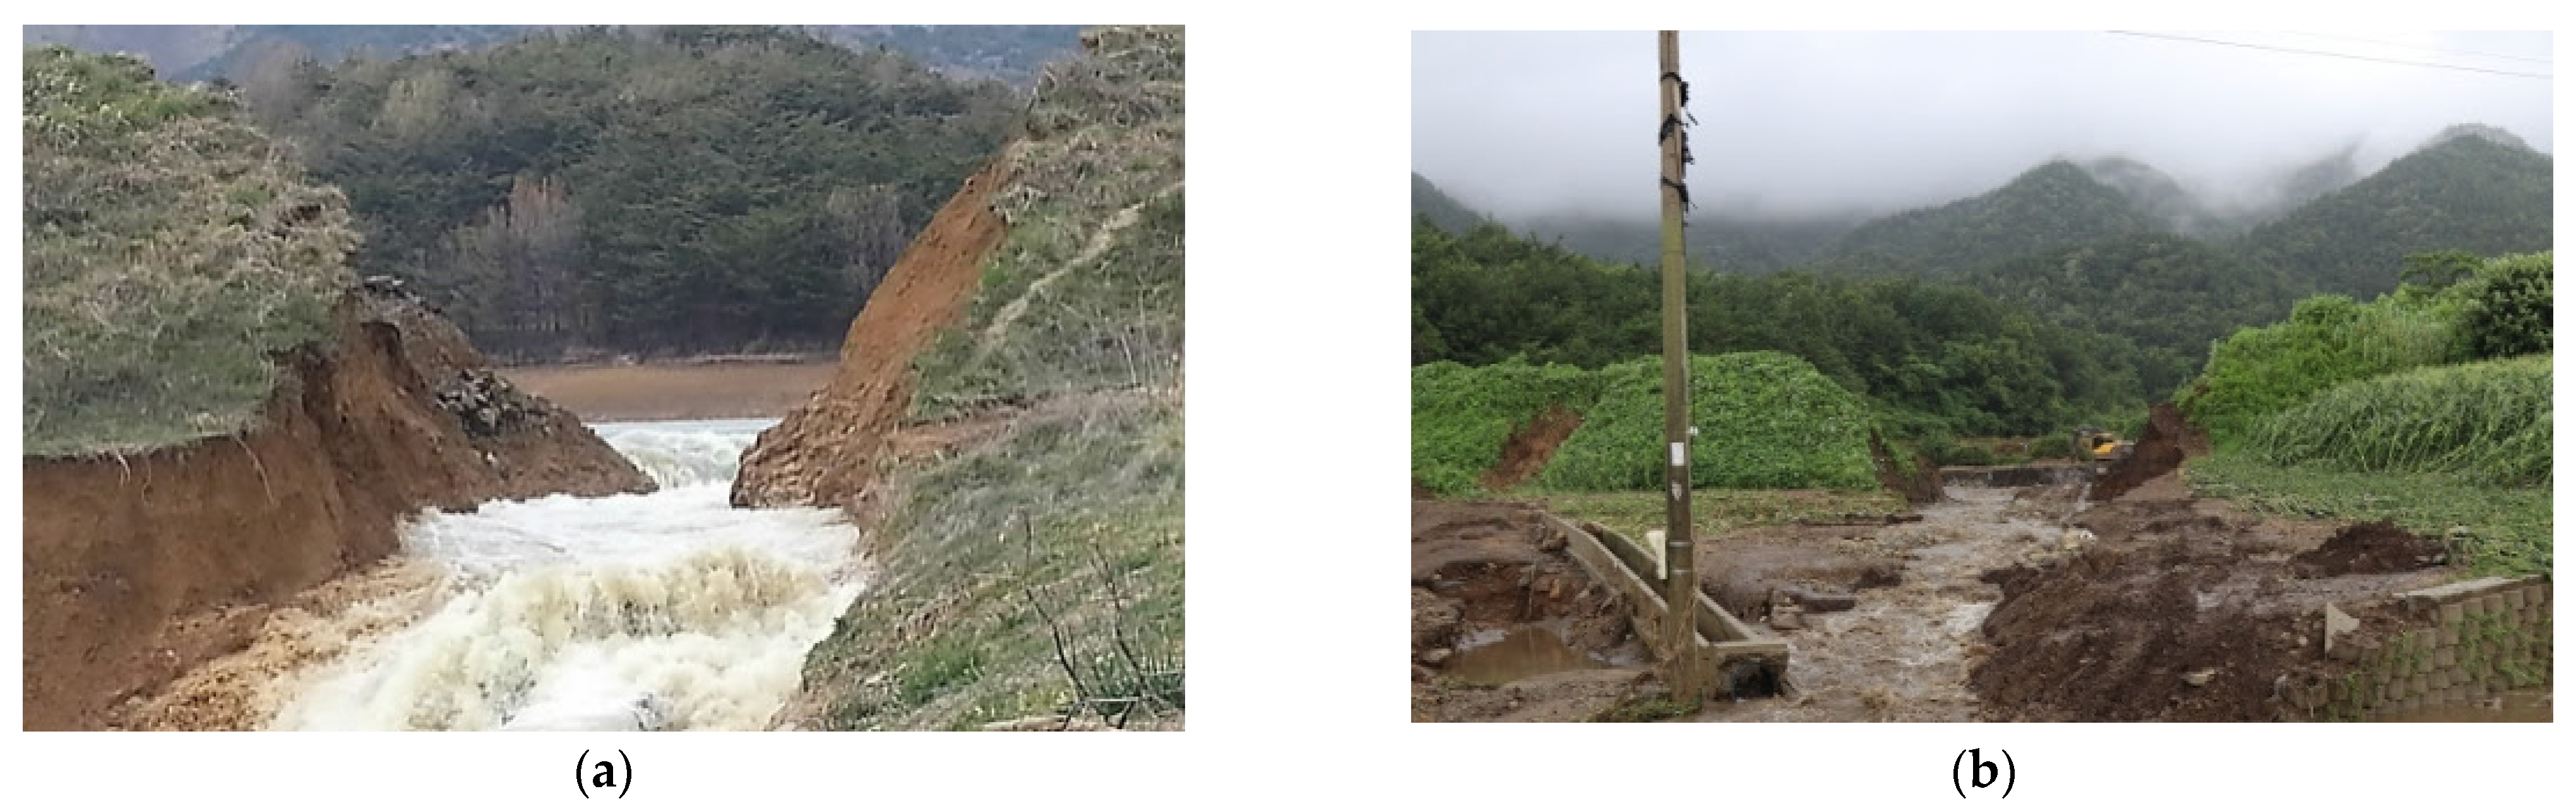
:1. Introduction
2. Literature Review
3. AIoT Dam Monitoring Technology
3.1. Overview
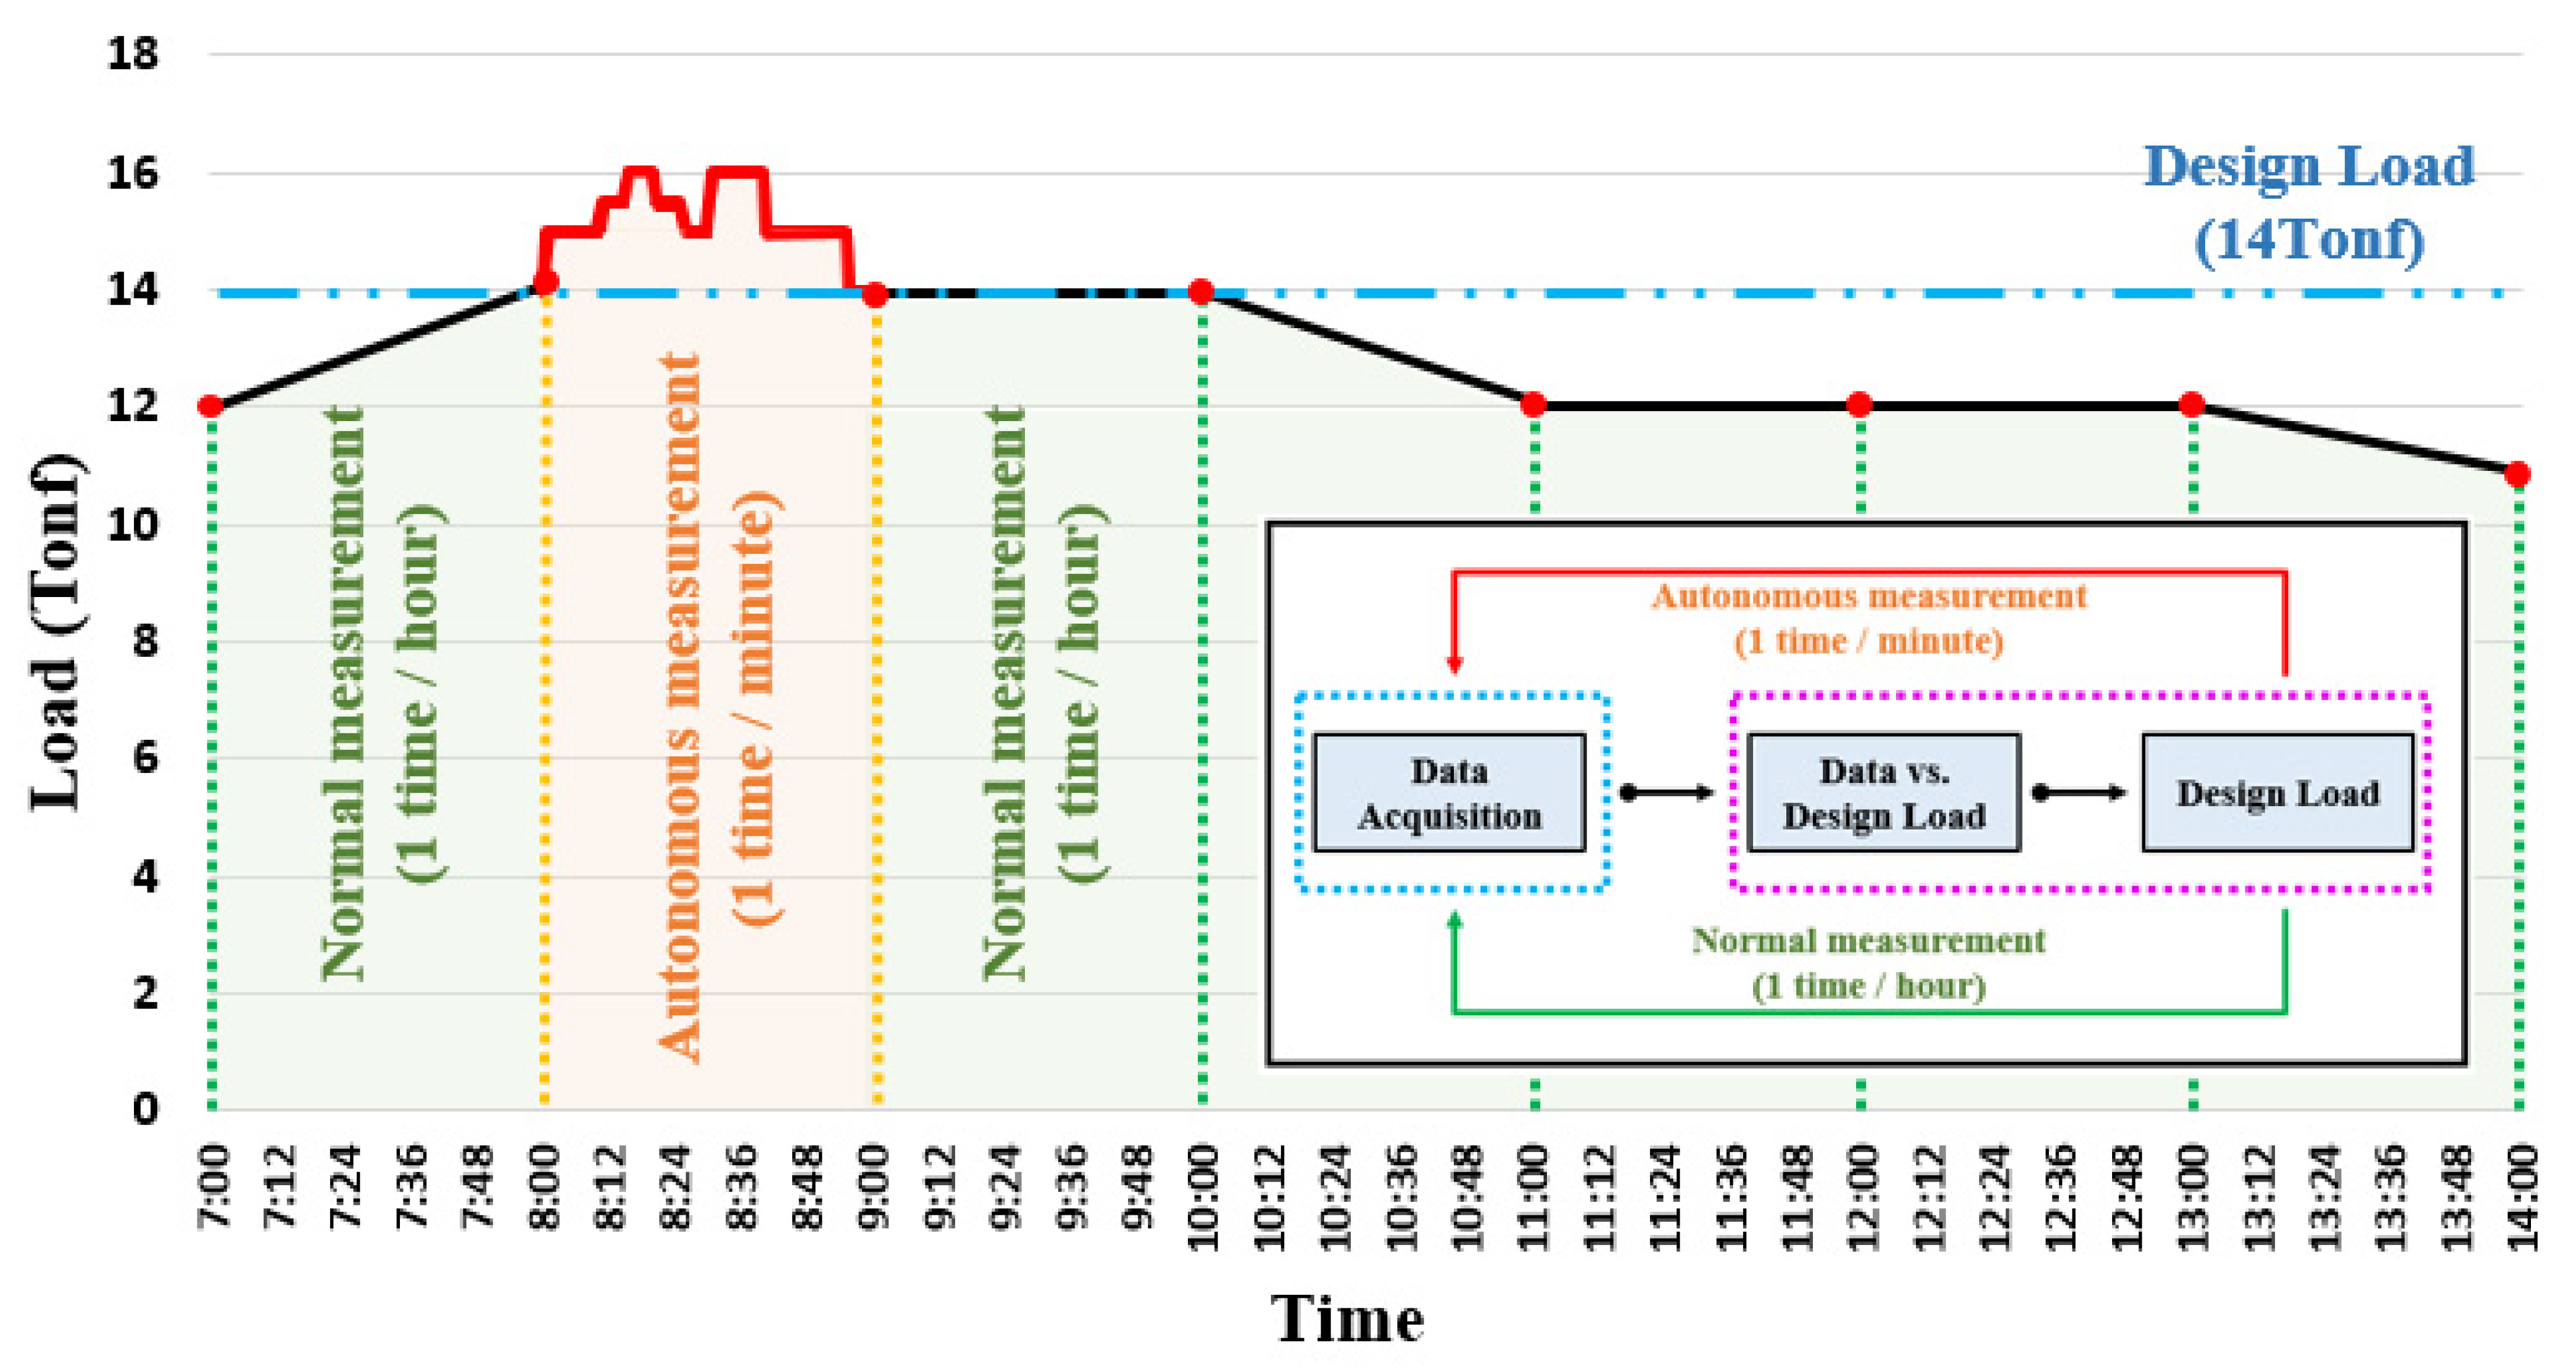
3.2. Autonomous Operation
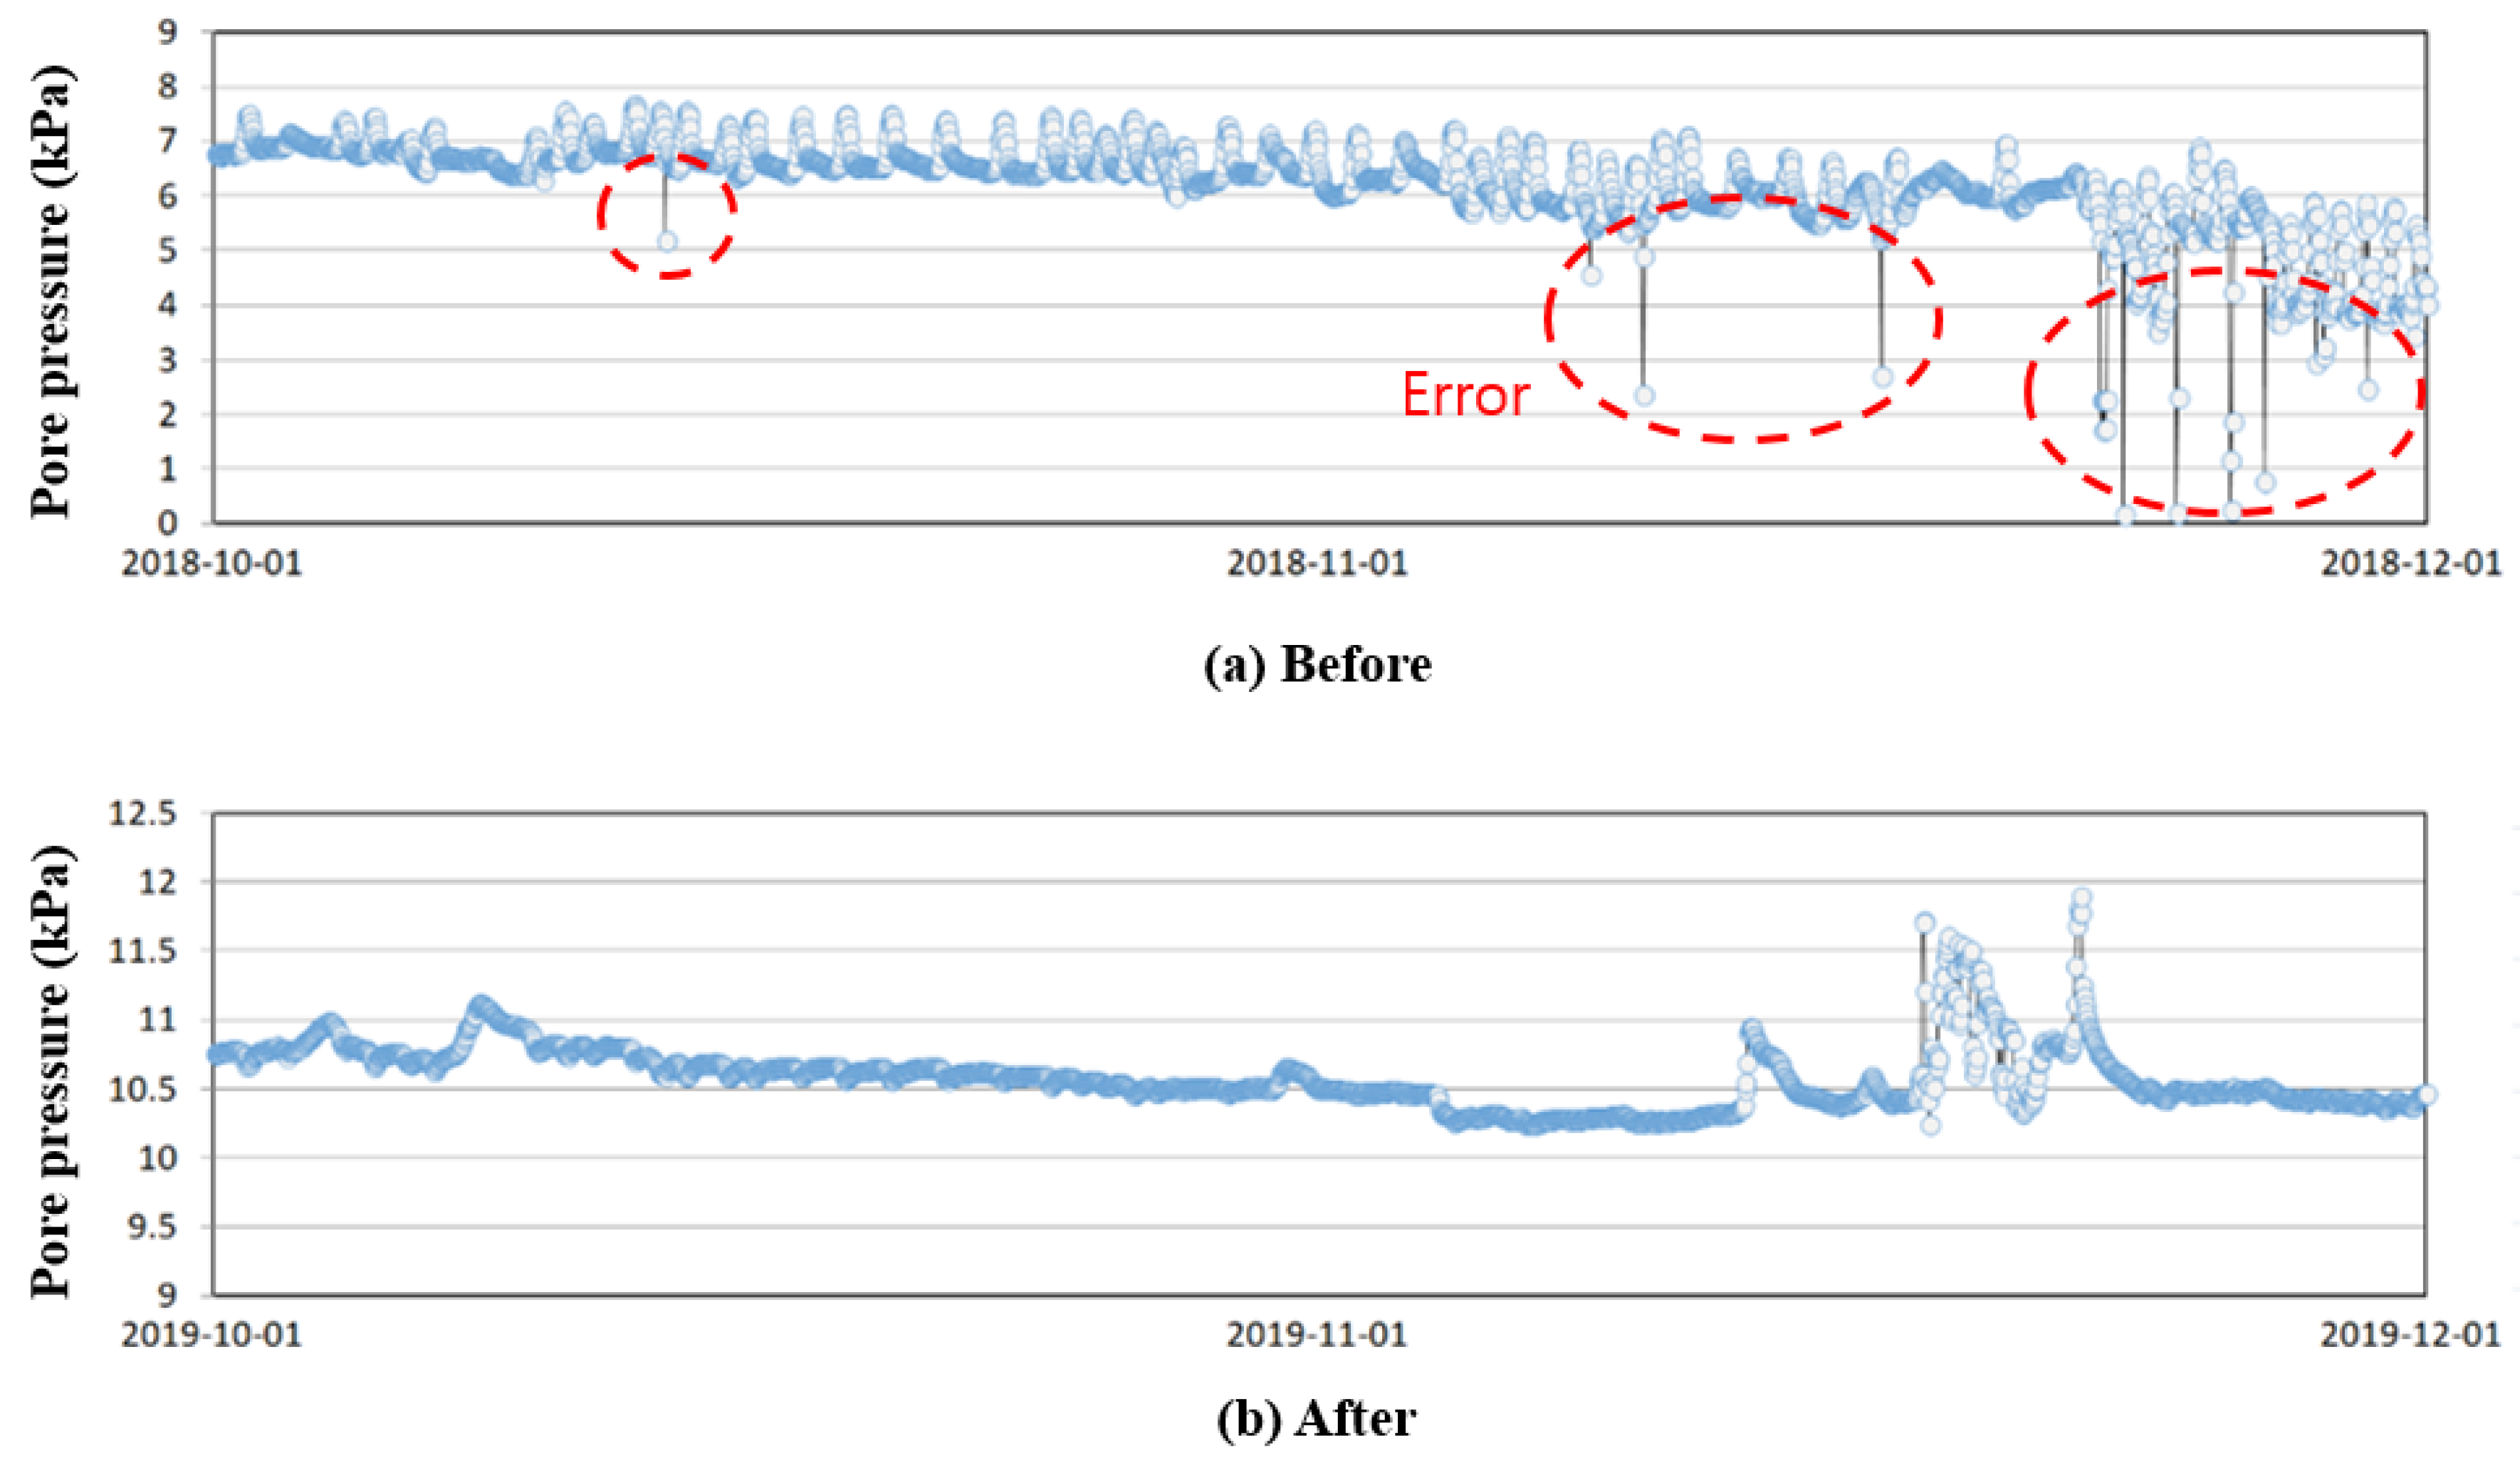
3.3. Malfunction Prevention
3.4. Optimal Communication Environment
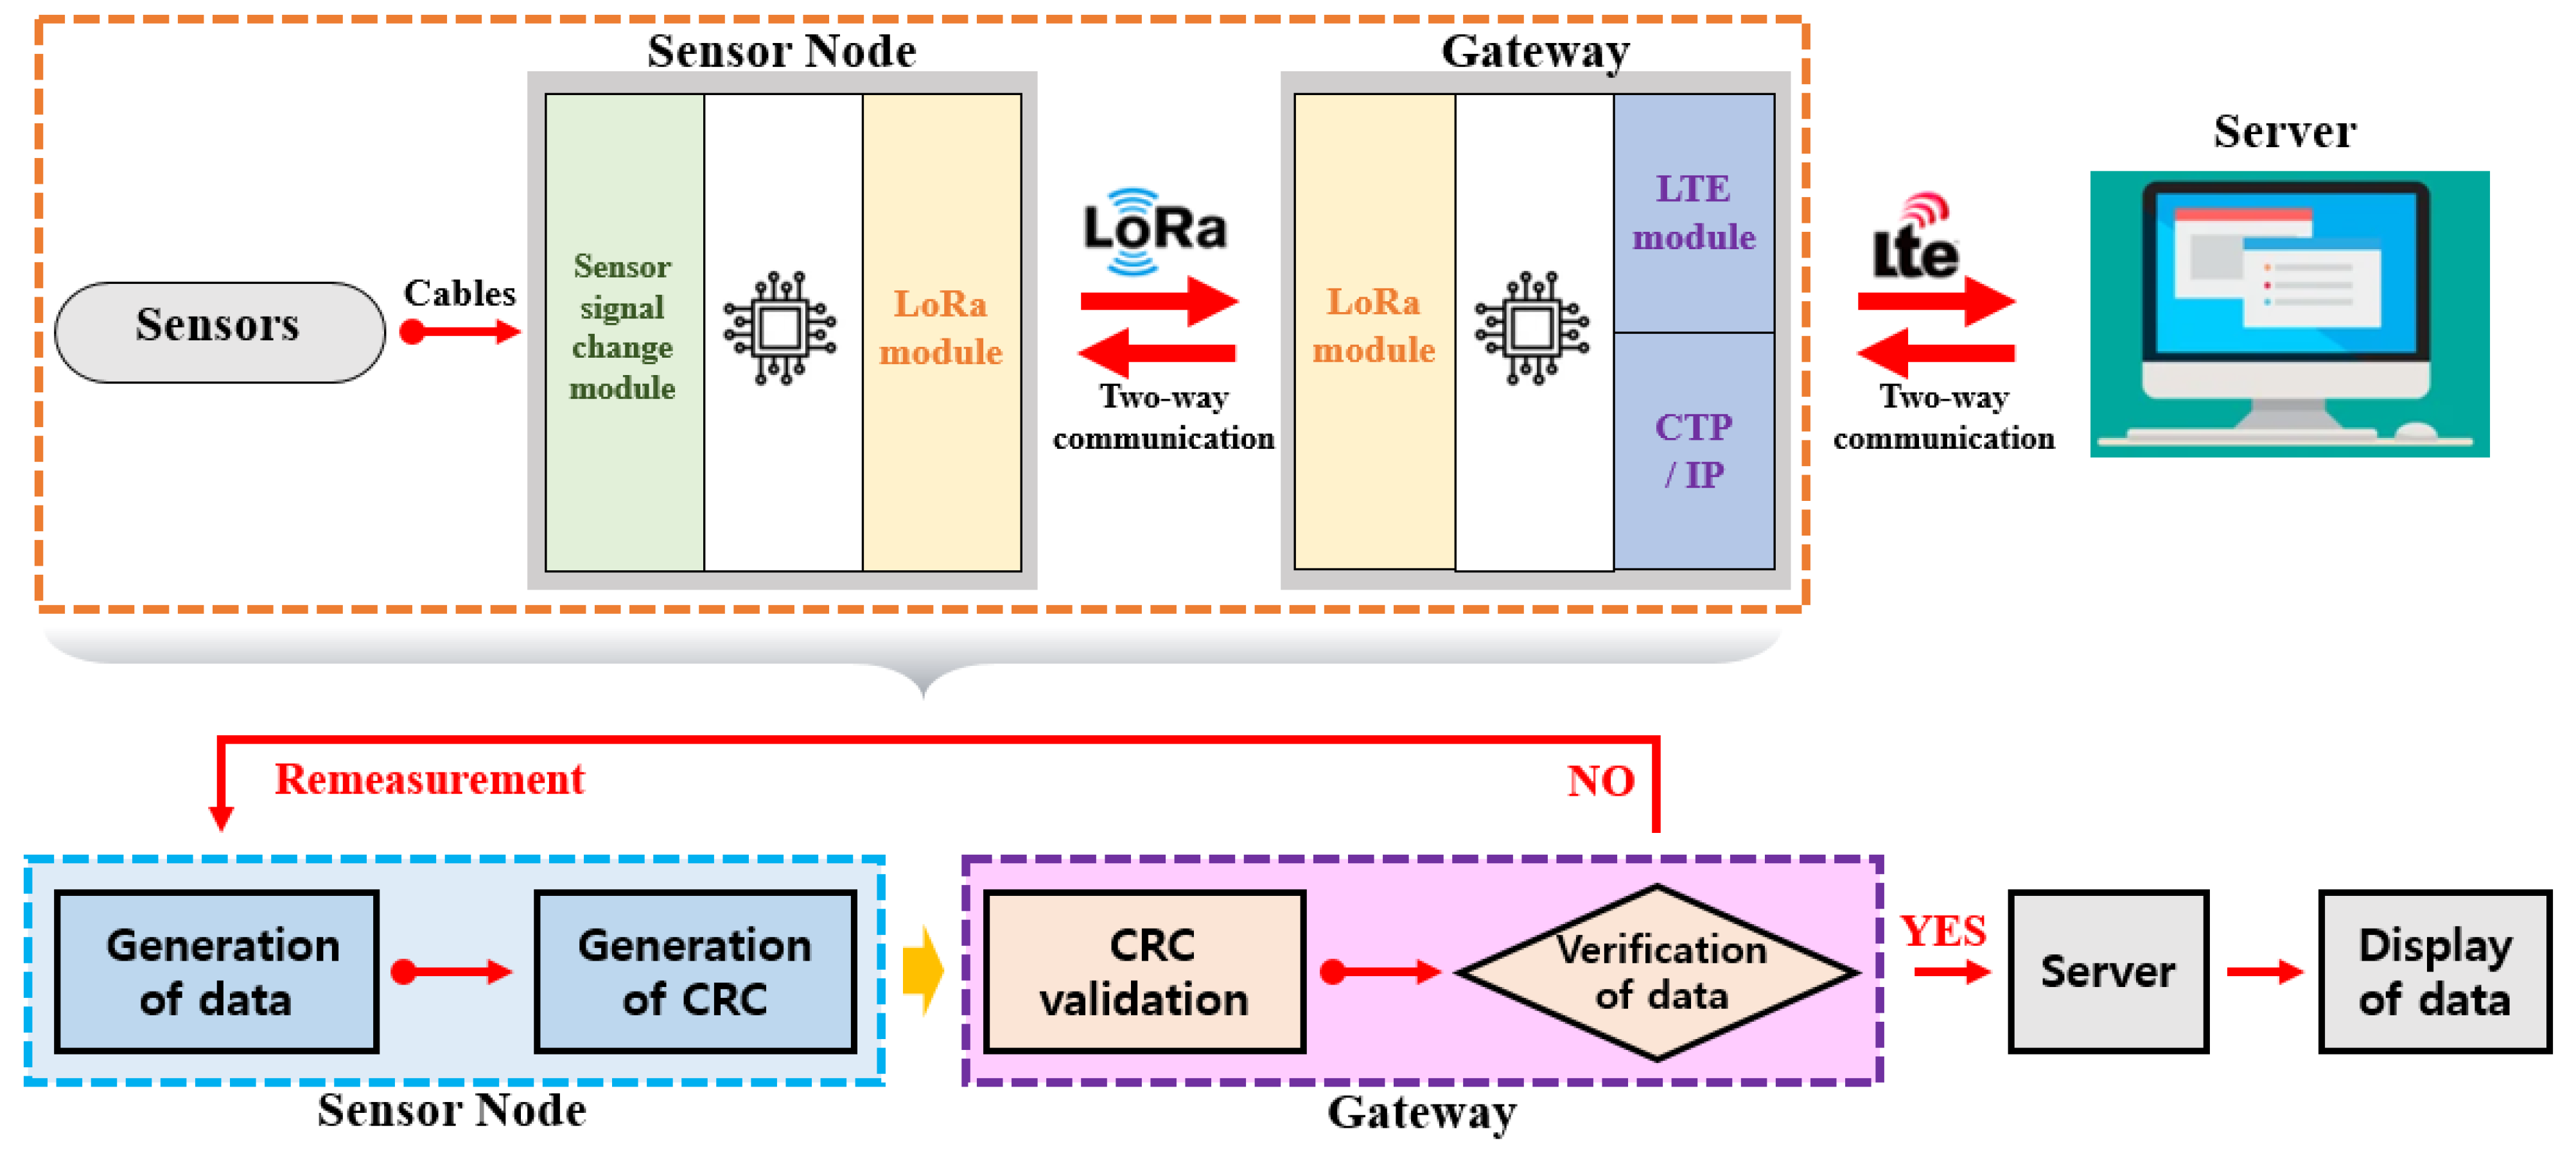
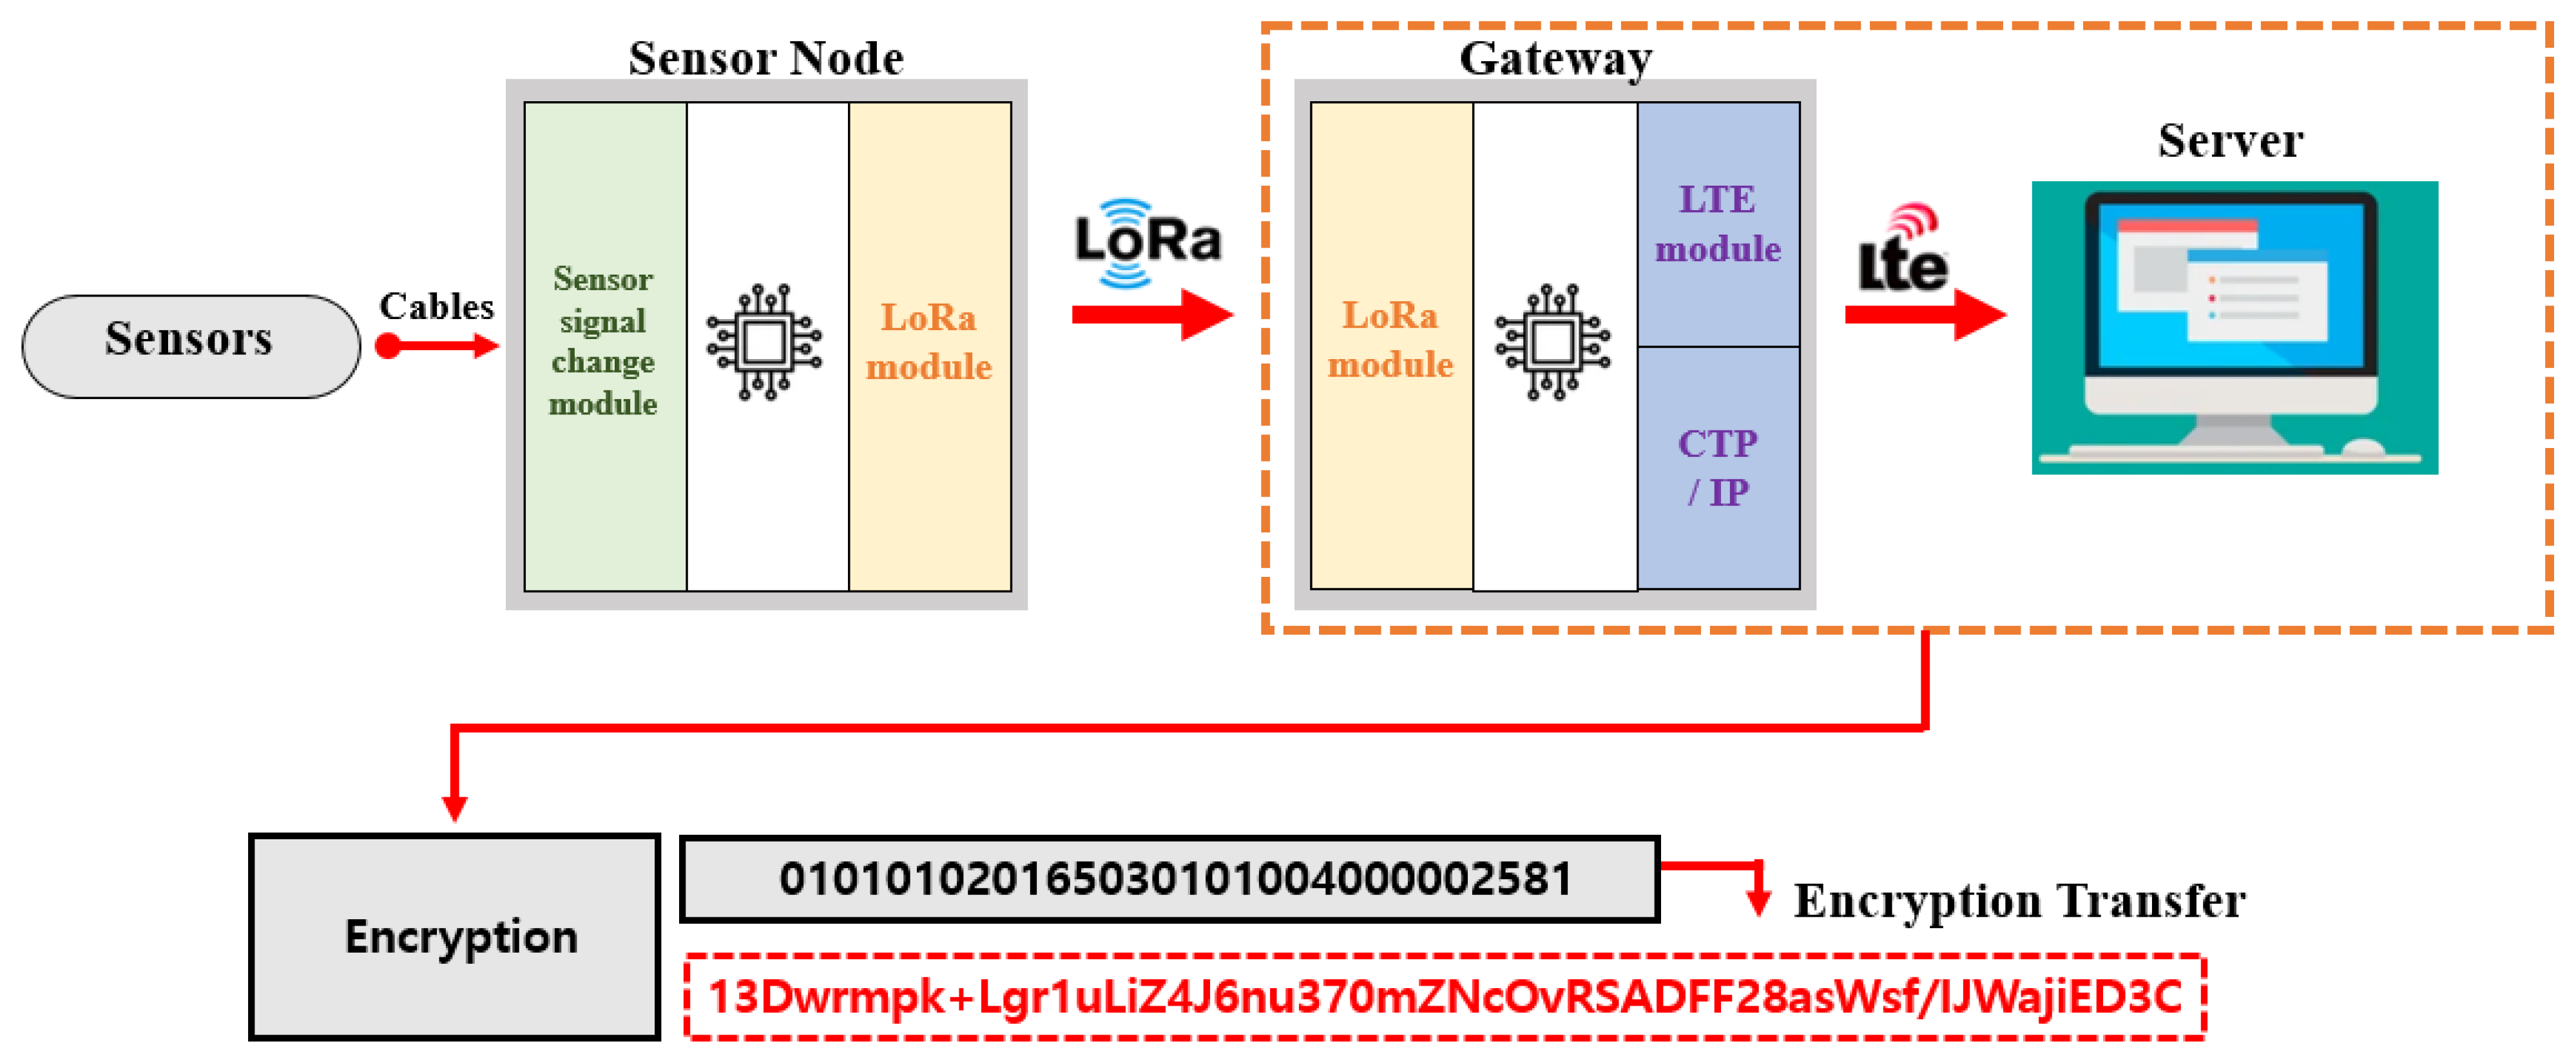
3.5. Data Authentication and Security
4. Field Application of AIoT Monitoring Technology
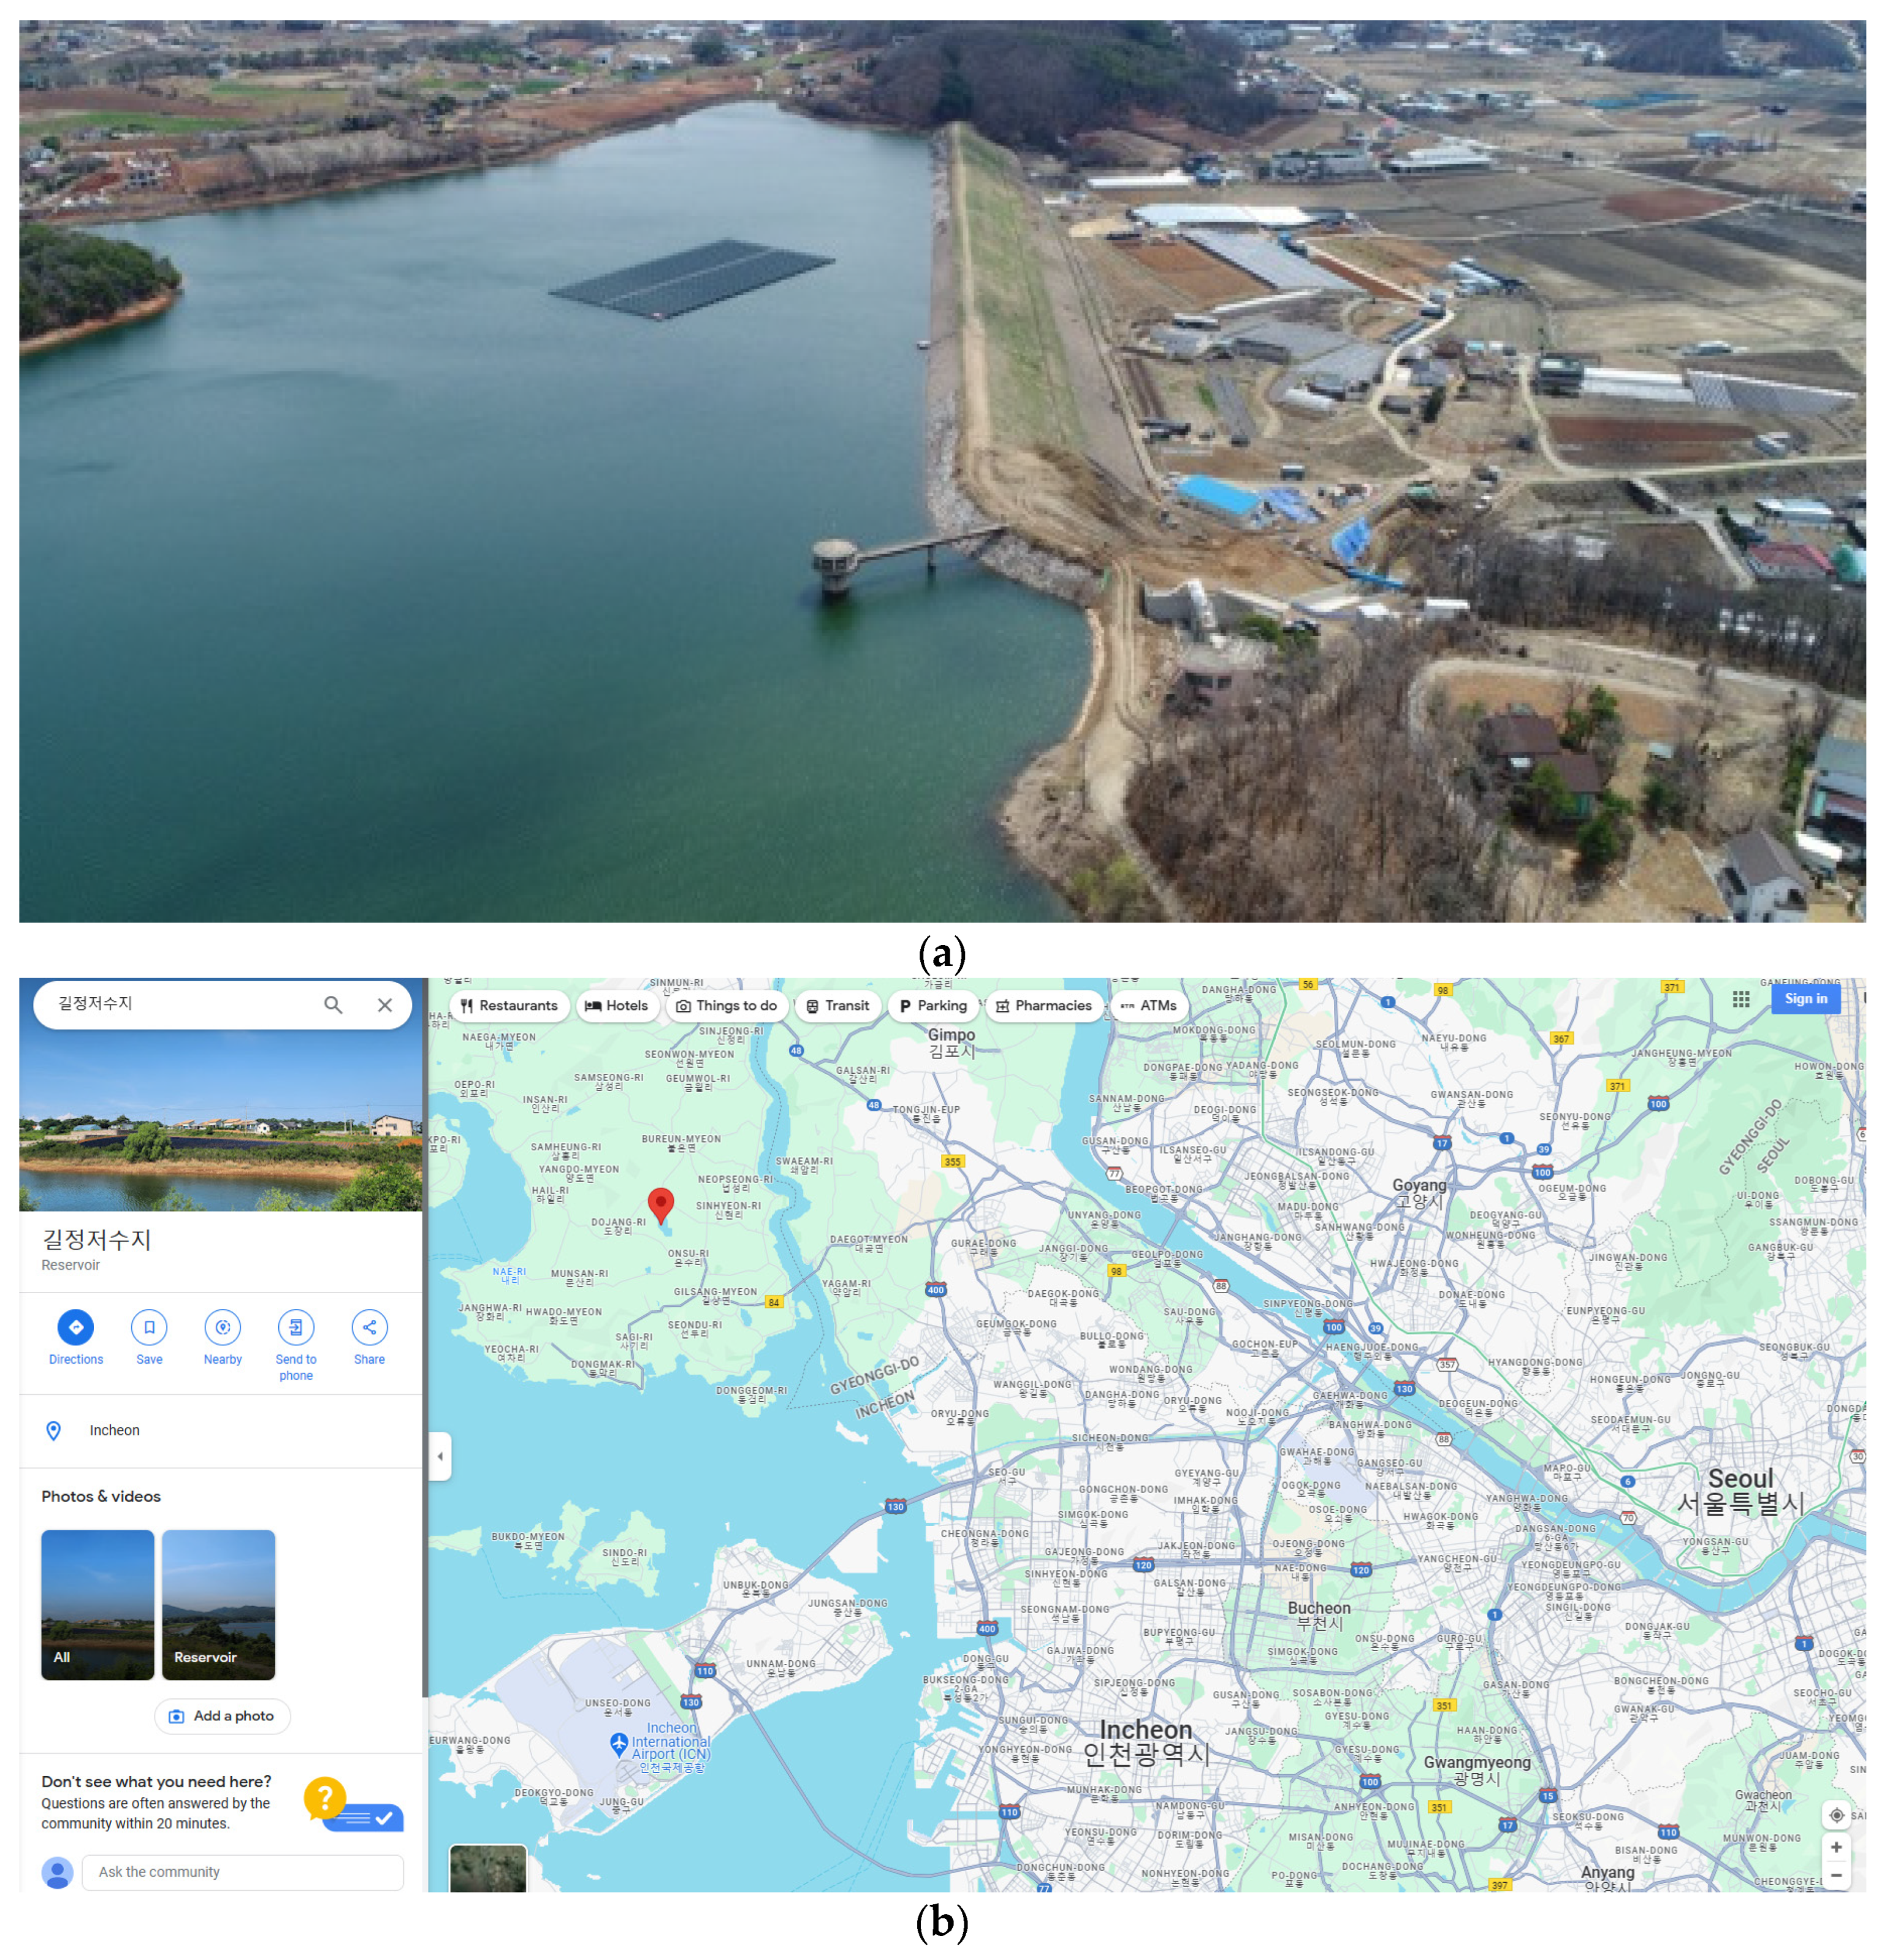
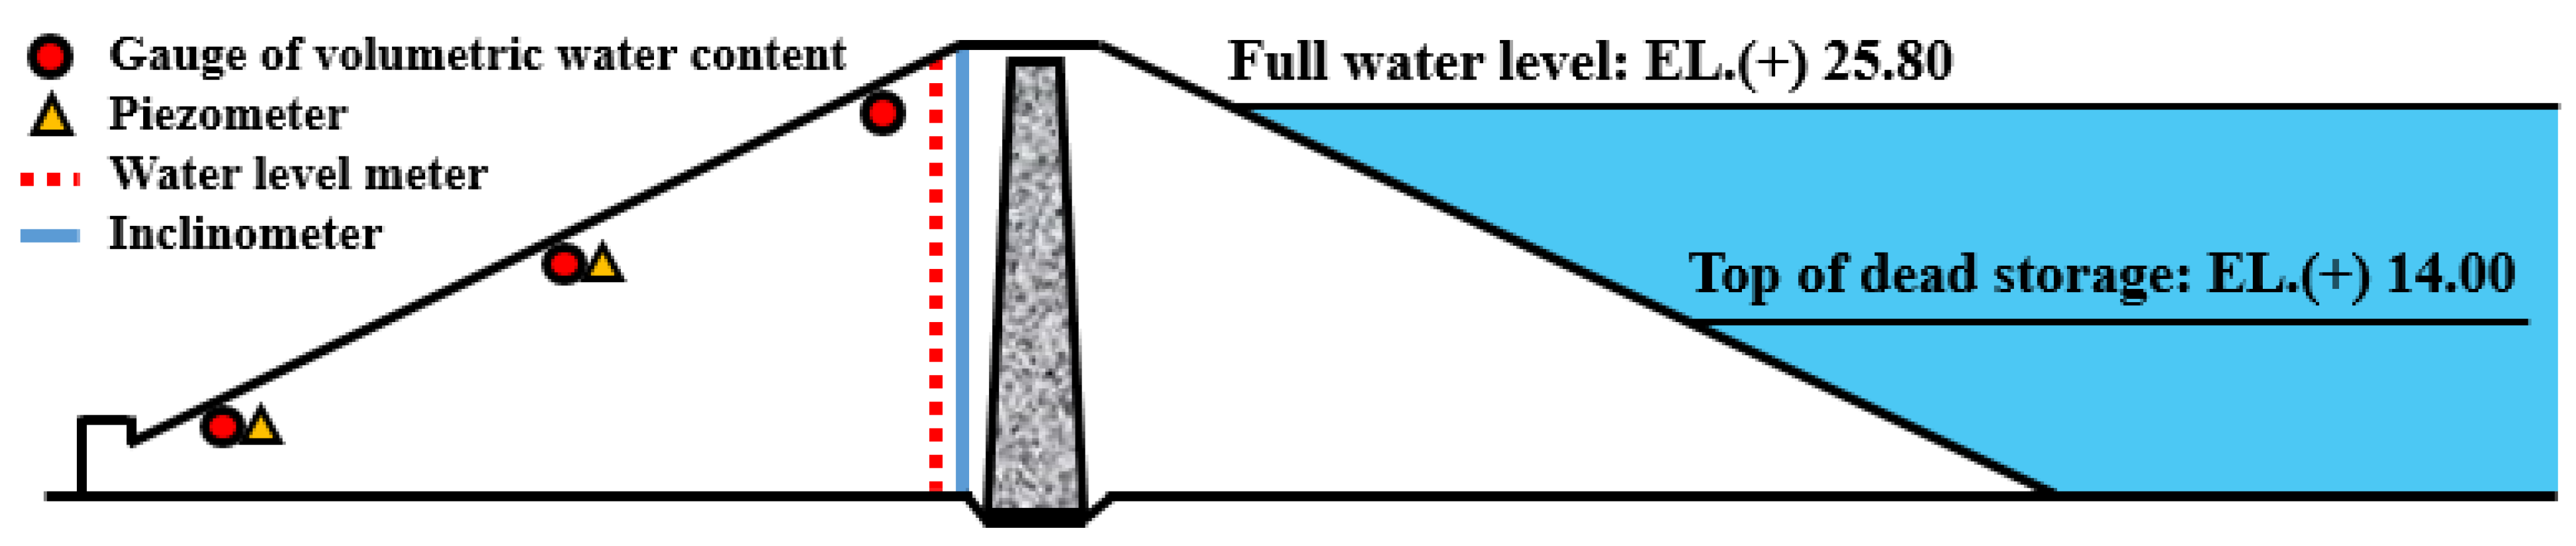
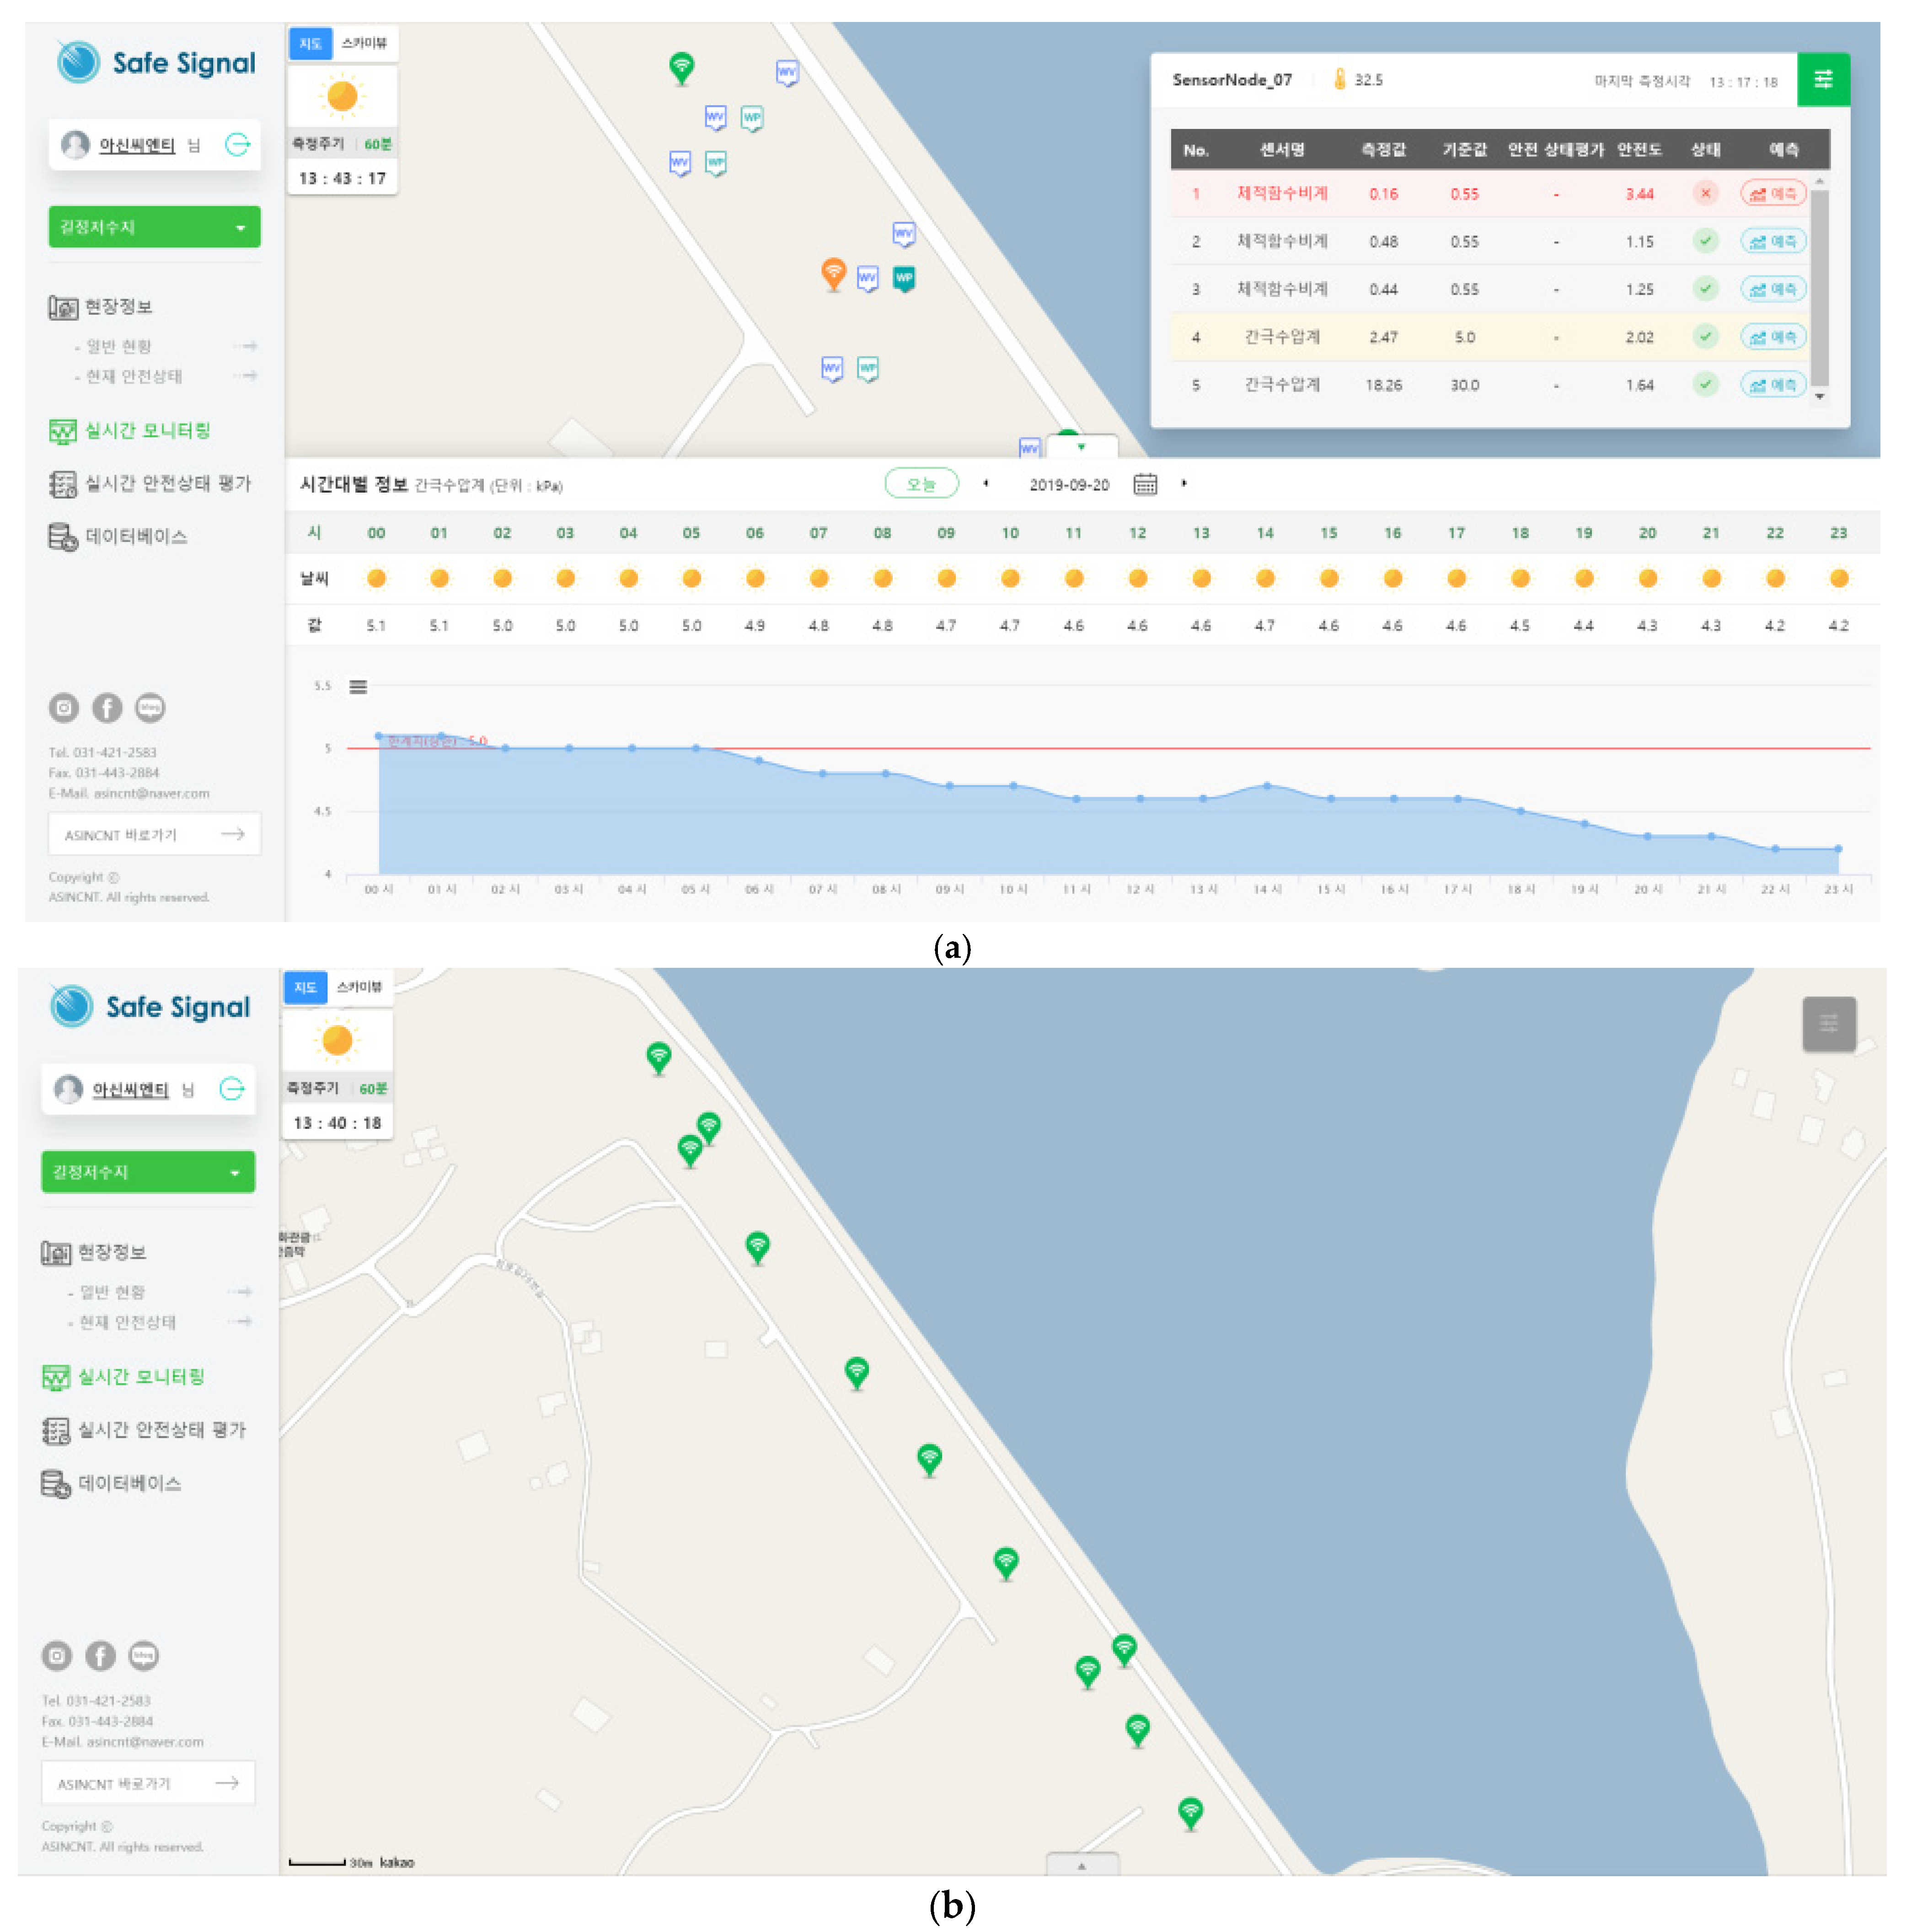
4.1. Field Test in Korea
4.2. Future Field Test Plan in Vietnam
5. Conclusions
Author Contributions
Funding
Institutional Review Board Statement
Informed Consent Statement
Data Availability Statement
Conflicts of Interest
References
- Foster, M.A.; Fell, R. A Framework for Estimating the Probability of Failure of Embankment Dam by Internal Erosion and Piping Using Event Tree Methods; UNICIV Report, R-377; University of New South Wales: Sydney, Australia, 1999. [Google Scholar]
- Lim, S.S.; Lim, H.D. Statistical analysis of the causes of the embankment dam incidents and the importance of Piping. KSCE Mag. Korean Soc. Civ. Eng. 2008, 56, 73–79. [Google Scholar]
- Tran, Q.D.; Nishimura, S.; Senge, M.; Nishimura, T. Research on cause of dam failure from viewpoint of hydraulic fracturing: Case study of a dam failure in Vietnam. Int. J. Geomate 2018, 14, 86–94. [Google Scholar] [CrossRef]
- Kim, D.H.; Park, H.J.; Yoon, H.J.; Lee, S.O. Review of the priority index for selection between repair and reinforcement methods of dam facilities. J. Korea Inst. Struct. Maint. Insp. 2023, 27, 1–11. [Google Scholar]
- Jang, S.K.; Kim, J.S.; Sin, S.C.; Park, W.Y. Displacement analysis of dam deformation monitoring with GPS. J. Korean Soc. Surv. Geod. Photogramm. Cartogr. 2001, 19, 237–244. [Google Scholar]
- Han, J.G.; Hong, K.K.; Jung, Y.W.; Kim, Y.S. Application Estimation of Visual Monitoring System for Real-Time Displacement Measuring on Dam. In Proceedings of the Korean Society of Civil Engineers. Convention Conference and Civil Expo, Gwangju, Republic of Korea, 12–13 October 2006. [Google Scholar]
- Hong, D.Y. Construction of real-time automatic monitoring system for Sanya Baogu Reservoir embankment settlement and translation in Hainan, China. Tech. Rep. Rural. Resour. Korean Soc. Agric. Eng. 1999, 63, 57–64. [Google Scholar]
- Gu, C.; Wang, Y.; Gu, H.; Hu, Y.; Yang, M.; Cao, W. A combined safety monitoring model for high concrete dams. Appl. Sci. 2022, 12, 12103. [Google Scholar] [CrossRef]
- Li, S.; Li, Y.; Lu, X.; Wu, Z.; Pei, L.; Liu, K. A spatial model for repairing of the dam safety monitoring data combining the variable importance for projection (VIP) and cokriging methods. Appl. Sci. 2022, 12, 12296. [Google Scholar] [CrossRef]
- Kim, Y.S.; Kwon, M.H.; Jung, J.Y.; Kim, K.C.; Kim, J.G. Digital twin-based dam·watershed·river one system platform construction. In Proceedings of the Spring Conference, Korea Institute of Information and Communication Engineering, Gwangju, Republic of Korea, 26 May 2023. [Google Scholar]
- Lee, H.N. 3D reconstruction model of Malpasset Dam using close-range photogrammetry technique for geotechnical application. J. Eng. Geol. Korean Society Eng. Geol. 2021, 31, 179–186. [Google Scholar]
- Ryu, S.H.; Park, J.M.; Yoon, J.S. Development of advanced dam safety data monitoring technology. In Proceedings of the Korean Society of Civil Engineers, Convention Conference and Civil Expo, Ulsan, Republic of Korea, 21 October 2022. [Google Scholar]
- Chao, Y.; Lin, C.; Li, T.; Qi, H.; Li, D.; Chen, S. An automated framework for the health monitoring of dams using deep learning algorithms and numerical methods. Appl. Sci. 2023, 13, 12457. [Google Scholar] [CrossRef]
- Yoon, J.S.; Ryu, S.H.; Park, J.M.; Lee, Y.B. Establishing a dam realtime displacement monitoring system based on GNSS. In Proceedings of the Spring Conference, Korea Institute of Information and Communication Engineering, Gwangju, Republic of Korea, 26 May 2023. [Google Scholar]
- Peng, X.; Liu, M.; Huang, C. Application of artificial neural network model in dam deformation observation. China Rural. Water Hydropower 2006, 11, 31. [Google Scholar]
- Mohod, N. Usability of Internet of Things [IoT] for Dam Safety and Water Management. Int. J. Res. Advent Technol. 2017, 5, 29–30. [Google Scholar]
- Liu, M.; Wen, Z.; Zhou, R.; Su, H. Bayesian optimization and ensemble learning algorithm combined method for deformation prediction of concrete dam. J. Struct. 2023, 54, 981–993. [Google Scholar] [CrossRef]
- Yihong, Z.; Afzal, J. An IoT-Based Mechanism for Monitoring Dam Structures. In Proceedings of the International Conference on Computing & Emerging Technologies (ICCET), Lahore, Pakistan, 21–23 February 2023; pp. 1–10. [Google Scholar]
- Gong, S.; Sun, F.; Chen, K. Dam Safety Monitoring and Early Warning Method Based on Knowledge Graph. In Hydraulic and Civil Engineering Technology VIII; IOS Press: Amsterdam, The Netherlands, 2023; Volume 43, pp. 842–850. [Google Scholar]
- Gordan, M.; Cislariu, M. Fuzzy Image Processing, Analysis and Visualization Methods for Hydro-Dams and Hydro-Sites Surveillance and Monitoring. In Sustainable Natural Resources Management; InTech: London, UK, 2012; pp. 1–26. [Google Scholar]
- Idhate, S.; Bilapatte, A.; Rathod, A.; Kalbande, H. Dam Monitoring System Using Wireless Sensor Networks. Int. Res. J. Eng. Technol. IRJET 2017, 4, 1767–1769. [Google Scholar]


| Category | Problems in the Current Technology | AIoT Technology |
|---|---|---|
| (1) Malfunction prevention technology | Sensor measurement error due to unstable voltage and sensing noise ⇒ Decreased reliability of measurement data ⇒ Frequent alarm notifications | Application of a statistics-based data filtering technique ⇒ Measurement data error removal and reliable alarm notification |
| (2) Communication performance improvement | Use of the open-frequency area of shared Wi-Fi and LoRa communications ⇒ Communication delay | Frequency channel setting feature (0–15 channels) ⇒ Improved communication performance by using a frequency with high communication sensitivity |
| (3) Autonomous operation | Limited to periodic measurements (once per hour, week, day) and simple communication capabilities ⇒ Impossible to perform precision measurement when a risk occurs | Autonomous switching from normal measurement (once per hour) to precision measurement (once per minute) in the event of a risk ⇒ Precision measurement/bi-directional communication is possible |
| (4) Data authentication | Use of open IoT communications (LoRa and Wi-Fi) ⇒ Problem in collecting error data (other communication data) | CRC checking when collecting measurement data (received data authentication) ⇒ Verification of data quality and reliability |
| (5) Prediction technology using machine learning | Simple measurement data monitoring ⇒ The state of safety of the facility cannot be recognized ⇒ Expert judgment is required | Assessment of safety status based on real-time data collected ⇒ Use of normal and anomaly detection information to predict safety status |
| (6) Security features | Vulnerable to external connections and hacking on open communication frequencies ⇒ Decreased security | Data transmission after pattern encryption ⇒ Prevention of hacking and enhancement of security features ⇒ Smooth control of devices/systems |
| Category | Specifications |
|---|---|
| Sensor measurement | Electrical resistance type, electric type, RS485, and RS232 simultaneous measurements |
| Measurement cycle | 1 min to 60 min or higher (measurement cycle control feature included) |
| MCU | ARM Cortex M3 32-bit 120 MHz |
| Internal memory | Minimum 128 KB (Flash Memory) |
| Power supply | Always-on, primary battery, secondary battery + solar power |
| Applied voltage | 3.3–12 V |
| Node communication method | LoRa, Wi-Fi, LTE |
| Operating temperature | −20~60 °C, humidity 80% or lower |
| Durability | IP 67 or higher |
| Quality assurance | Minimum 2 years |
| Category | Specifications |
|---|---|
| Number of node connections | 20 |
| MCU | ARM Cortex M3 32-bit 120 MHz |
| Internal memory | Minimum 128 KB (Flash Memory) |
| Power supply | Always-on, primary battery, secondary battery + solar power |
| Applied voltage | 3.3–12 V |
| Node communication method | LoRa, Wi-Fi, LTE |
| Server communication method | Router communication (3G, 4G, 5G) |
| Operating temperature | −20~60 °C, humidity 80% or lower |
| Durability | IP 67 or higher |
| Quality assurance | Minimum 2 years |
Disclaimer/Publisher’s Note: The statements, opinions and data contained in all publications are solely those of the individual author(s) and contributor(s) and not of MDPI and/or the editor(s). MDPI and/or the editor(s) disclaim responsibility for any injury to people or property resulting from any ideas, methods, instructions or products referred to in the content. |
© 2024 by the authors. Licensee MDPI, Basel, Switzerland. This article is an open access article distributed under the terms and conditions of the Creative Commons Attribution (CC BY) license (https://creativecommons.org/licenses/by/4.0/).
Share and Cite
Kong, S.-M.; Yoo, C.; Park, J.; Park, J.-H.; Lee, S.-W. AIoT Monitoring Technology for Optimal Fill Dam Installation and Operation. Appl. Sci. 2024, 14, 1024. https://doi.org/10.3390/app14031024
Kong S-M, Yoo C, Park J, Park J-H, Lee S-W. AIoT Monitoring Technology for Optimal Fill Dam Installation and Operation. Applied Sciences. 2024; 14(3):1024. https://doi.org/10.3390/app14031024
Chicago/Turabian StyleKong, Suk-Min, Chanho Yoo, Jaeim Park, Jae-Hyun Park, and Seong-Won Lee. 2024. "AIoT Monitoring Technology for Optimal Fill Dam Installation and Operation" Applied Sciences 14, no. 3: 1024. https://doi.org/10.3390/app14031024