Article

Numerical Study on the Dynamic Response of Gas Explosion in Uneven Coal Mine Tunnels Using CESE Reaction Dynamics Model

1
School of Emergency Management and Safety Engineering, North China University of Science and Technology, Tangshan 063210, China
2
College of Mining and Safety Engineering, Shandong University of Science and Technology, Qingdao 266590, China
*
Author to whom correspondence should be addressed.
Appl. Sci. 2024, 14(6), 2372; https://doi.org/10.3390/app14062372
Submission received: 20 February 2024 / Revised: 3 March 2024 / Accepted: 5 March 2024 / Published: 11 March 2024
(This article belongs to the Special Issue Advanced Methodology and Analysis in Coal Mine Gas Control)

Abstract

:

Featured Application

(1) A gas explosion simulation combining the chemical reaction mechanism and tunnel structure is described; (2) the shock wave flow fields in tunnels with uneven walls and smooth walls are compared; and (3) the dynamic responses in tunnels with uneven walls and smooth walls are analyzed.

Abstract

A numerical simulation method combining the detailed chemical reaction mechanism of methane deflagration with an approximate real tunnel structure was proposed to confirm whether the unevenness of the tunnel wall during a coal mine gas explosion can be ignored. The approximate real tunnel model and smooth wall tunnel model were developed using 3D modeling methods. The propagation and attenuation processes of shock waves in the two tunnel models, as well as the different dynamic responses of the two tunnel walls, were compared and analyzed. Research results show that the non-uniformity of the tunnel wall decreases the shock wave overpressure and propagation velocity. The peak overpressure reduction value of the shock wave reaches 81.91 kPa, and the shock wave overpressure reaches its peak at an extended maximum time of 7.4 ms. The stress distribution on the approximate real tunnel wall is discontinuous, the propagation speed of stress waves in the bend tunnel is slower, and the duration of high load is relatively low. The displacement of the approximate real tunnel after gas explosion is lower than that of tunnels with smooth walls, and the displacement of most measuring points on the tunnel on the right is only 1/3–1/2 that of the smooth tunnel.

Graphical Abstract

1. Introduction

Gas dynamic accidents in deep mines seriously threaten the safety of underground workers and are a key concern of China’s coal industry [1,2,3], and among them, gas explosion is the most serious dynamic disaster in coal mines. Gas explosion is the most serious dynamic disaster in coal mines. Gas explosion accidents often lead to a large number of casualties. Among the 556 serious coal mine accidents from 2000 to 2022, 285 gas explosion accidents occurred, resulting in 6378 deaths [4]. At the same time, the high-intensity shock wave generated by gas explosion damages the tunnel walls and internal facilities, posing a serious threat to the safety production of coal mines in China.
In recent years, extensive research has been conducted on gas explosions in different scenarios [5,6,7]. Compared with gas explosion experiments, numerical simulation tools not only support the rapid modeling of gas explosions in various enclosed or semi-enclosed spaces, but, at the same time, can also accurately capture the shock wave flow field at every moment. Among them, computational fluid dynamics (CFD) is widely used to accurately simulate the evolution of a shock wave flow field in a confined space following a methane/air premixed gas deflagration. Zhu et al. [8] used a flame accelerator simulator (FLACS) to establish a large-scale tunnel model. The effects of methane volume concentration, blockage rate, tunnel length, and cross-sectional area on gas explosion overpressure were studied. Zhang et al. [9] studied the variation in shock wave overpressure in the main tunnel under bifurcated tunnels with different lengths and angles using the CFD program. Gao et al. [10] established a numerical model of gas explosion using OpenFOAM open-source CFD code based on the spatial structure characteristics of goaf. The flame and shock wave propagation characteristics induced by the gas explosion were analyzed under different arrangements for gradient diameter rocks. Liu et al. [11] explored the influence of cavity structure on explosion wave propagation through theoretical analysis, experimental research, and numerical simulation. A numerical model of shock wave propagation in a cavity was established to study the propagation process of explosion shock waves in cavities of different sizes. These studies have revealed the propagation and attenuation laws of shock waves in different gas explosion scenarios. However, the structural displacement and deformation under the impact load of gas explosion cause energy loss, and changes in the structural plane also alter the direction of shock wave reflection. For situations with structural deformation, analyzing only the explosion flow field lacks accuracy [12,13].
The Arbitrary Lagrangian–Euler (ALE) algorithm can accurately and efficiently solve the problem of the large deformation of structures caused by explosion [14,15,16]. Among its types, empirical methods, such as the TNT equivalent method [17] and equivalent gas explosion pressure method [18,19], are often used as the explosion sources of gas explosion. Sochet et al. [20] simplified the gas explosion load to an equivalent TNT explosive to simulate the scene of accidental explosions in industrial sites. The propagation and interaction of shock waves in complex environments, such as in gas storage, were studied. Jiang et al. [21] used improved material constitutive and state equations to characterize gas explosion and reproduced the June 13 gas explosion accident in Shiyan, Hubei Province. The propagation process of shock wave inside buildings and the evolution process of building damage related to the accident were studied. However, the gas detonation model based on the C-J detonation theory ignores the complex intermediate reaction of gas deflagration [22]. In the case of a large combustible gas cloud volume, the accuracy cannot be guaranteed [23]. Currently, studies on the complete coupling process between chemical reaction of methane deflagration and structure are limited.
In different gas explosion scenarios, due to the complex spatial structure of an underground coal tunnel and its harsh working environment, combustible gas is easy to accumulate, and the risk of coal mine gas explosion is significant. The shock wave generated by the rapid expansion of combustible gas in the semi-closed space of a coal mining face not only harms human health and damages valuable equipment such as shearers, but also cause the severe vibration of the coal tunnel walls in a short period of time, seriously affecting the emergency rescue and production recovery after the accident. Zhu et al. [24] used a CFD program modeled to simulate gas explosions in tunnel working faces, coal mining working faces, and transverse tunnels to study the characteristics of methane–air explosions in large tunnels with different structures. Pang et al. [25] conducted a numerical study on the methane/air explosion process in straight tunnels with different support spacings. Gao et al. [26] simulated the gas explosion process in tunnels containing pipeline systems or lines and explored the influence of flexible obstacles in tunnels on the propagation law of gas explosions. Zhang et al. [27] established a model of a coal mine refuge chamber to analyze its structural safety after a gas explosion. These researchers simulated the underground tunnel gas explosion process from the perspective of the tunnel structure and obstacles. However, the tunnel walls are not smooth in the actual gas explosion scene, and the entire coal tunnel wall has evident bulges and depressions. The uneven tunnel walls lead to a relatively complex propagation of gas explosion shock waves. The unevenness of the real coal mine tunnel walls leads to a significant increase in the analysis difficulty and calculation cost. Therefore, reports on this aspect are limited.
The coupling analysis of the methane-deflagration chemical reaction and structural deformation is realized, in this paper, to address these issues. Meanwhile, whether the dents and protrusions on the tunnel wall can be ignored is confirmed. The immersion boundary layer algorithm (IBM) is used to combine the tunnel structure with a finite-rate model of the CESE solver to simulate gas explosions in the approximate real tunnel model and smooth wall tunnel model. The formation and dissipation process of reactants and reaction products in the tunnel after explosion is analyzed. Subsequently, the characteristics of shock wave propagation and attenuation, as well as the dynamic response of the tunnel wall, are discussed in detail for approximate real tunnels and tunnels with smooth walls.

2. Numerical Simulation Algorithm and Constitutive Model

2.1. CESE-IBM Coupling Model

In this study, a high-precision, multidimensional compressible-flow CESE solver based on the spatiotemporal conservation element/solution element method was used [28]. Compared with traditional methods, this solver can handle space and time uniformly, achieving second-order accuracy in space and time. The flow field and its spatial derivatives are simultaneously considered variables for the solution, and high-speed shock waves generated by gas explosions are accurately captured.
During the coupling solution of chemical models, CESE flow fields, and FEM structure, information exchange is carried out between the chemical solver and CESE solver, which transfer fluid density, energy, temperature, and pressure information to each other, as shown in Figure 1. The structural mesh and fluid should be solved independently. The CESE solver uses a Eulerian mesh, and the structural finite-element solver uses a Lagrangian mesh. The interface between the fluid and the structure is determined by the Lagrange grid element. In each time step, the interface serves as the carrier of information transmission between the CESE solver and the structure solver. The Eulerian grid applies fluid pressure to the structure interface whereas the structure interface feeds back the displacement and velocity information of the structure to the fluid [29,30,31]. The moving mesh method (MMM) and immersed boundary method (IBM) are introduced by the CESE solver for fluid structure coupling. The MMM has high calculation accuracy and is suitable for small deformation. However, at each time step, grid information should be updated; thus, the approach is time-consuming. In the IBM, the fluid grid is fixed, and the structural FEM grid moves in the fluid region. This method is suitable for large deformation, and the calculation is relatively stable [32]. The IBM method was adopted considering the stability and calculation cost.

2.2. Finite-Rate Chemical Reaction Model

A finite-rate chemical model is used, and the detailed chemical reaction mechanism of methane deflagration is considered to accurately simulate the shock wave of methane explosion.
The following equation is used for the system involving ns species and nr basic reactions [33]:
k = 1 n s v k l X k k = 1 n s v k l X k l = 1 , 2 , 3 , n r
Here, v’kl and v″kl are the forward and reverse stoichiometric coefficients of species k in the reaction l, respectively, and Xk is the chemical symbol of this species k. The net molar formation rate wk of species k can be obtained from the following Equation (2):
w ˙ k = k = 1 n s v k l v k l k f l k = 1 n s [ X k ] k b l k = 1 n s [ X k ]
Here, [Xk] is the molar concentration of species k, and kfl and kbl are the forward and reverse reaction rate coefficients, respectively; they are calculated from Equations (3) and (4), as follows:
k f l = A l T β l exp E a l R T
k b l = k f l k c l
In the above equation, At stands for the pre-index factor, βl is the temperature index, Eal is the activation energy per unit mole, R is the general gas constant, and T is the temperature. Kcl is the equilibrium constant, which is obtained from the following Equation (5):
K c l = P a t m R T k = 1 n s v k l exp k = 1 n s v k l S 0 k R H 0 k R T
S0k and H0k in Equation (5) represent the entropy and enthalpy in the standard state, respectively, and the EOS of gas adopts the ideal gas state equation:
P = k = 1 n s [ X k ] R T
The thermal conductivity, viscosity, and diffusion coefficients of species k required by the Navier–Stokes solver can be obtained through the transfer data files in the reference literature [34]. The calculation cost is expensive, considering that the current detailed kinetic mechanism of methane combustion, GRI-Mech 3.0 [35], contains 53 species and 325 elementary reactions. Therefore, the simplified 18-step and 53-step methane combustion models based on GRI-Mech 3.0 were adopted [36], and these models will be verified in subsequent studies to select the best methane combustion reaction mechanism suitable for simulation analysis. Among them, the 18 step basic reaction mechanism extracted the skeleton reaction of complex methane combustion mechanism, which has high prediction accuracy for methane combustion, as follows [36,37,38]:
H + O 2 < = > O + O H
O + H 2 < = > H + O H
H + O H + M < = > H 2 O + M
O H + H 2 < = > H 2 O + H
2 O H < = > O + H 2 O
C H O + M < = > C O + H + M
C H 2 O + H < = > C H O + H 2
C H 2 O + O H < = > C H O + H 2 O
C H 3 + O < = > C H 2 O + H
C H 3 + O 2 < = > C H 3 O + O
C H O + H < = > C O + H 2
C H O + O H < = > C O + H 2 O
H + C H 3 ( + M ) < = > C H 4 ( + M )
C H 4 + H < = > C H 3 + H 2
C H 4 + O H < = > C H 3 + H 2 O
C H 4 + O < = > C H 3 + O H
H + C H 2 O ( + M ) < = > C H 3 O ( + M )
C O + O H < = > C O 2 + H
In the above equations, M represents catalyst, derived from mixed gas participating in the reaction or N2.

2.3. Material Failure Criterion

When studying the full coupling between a gas explosion and structure, the MAT_PLASTIC_KINEMATIC material model can effectively describe the strain rate effect and element failure behavior when the explosion wave acts on the structure. The materials used for the surface of the coal tunnel and the steel pipe are coal materials and Q345 steel, respectively [39,40]. The material parameters include static mechanical parameters and dynamic mechanical parameters, which need to be obtained through uniaxial load experiments and dynamic impact experiments, respectively. The relationship between yield stress and plastic strain and strain rate in the material model is shown in Formula (25), as follows:
σ y = ε ˙ C 1 P σ 0 + β E p ε e f f p + σ 0 + β E p ε e f f p
Here, σy is the yield stress; σ0 is the initial yield stress; ε is the strain rate; εeff is the effective plastic strain; β and Ep are hardening parameters and the hardening modulus, respectively; and C and P are the strain rate parameters. The material parameters of the tunnel wall and steel pipe are shown in Table 1.

2.4. Chemical Model Validation

Qu et al. [41] conducted a 9.5% concentration 100 m3 volume gas explosion experiment in a large square tunnel with a cross-sectional area of 7.2 m2 and a length of 900 m, and the ignition source was located at the closed end of the tunnel. According to the experiment, a 3D numerical model of the same size tunnel was established to verify the accuracy of the 18-element reaction, 53 element reaction kinetic model, and simplified detonation model of methane deflagration, as shown in Figure 2.
The simulation results of the simplified explosion model that simplifies the complex methane combustion reaction mechanism into a one-step reaction differ greatly from the experimental data. The simulation results of the 18- and 53-element reaction kinetic models are very close, and after 120 m, they are close to the experimental data. After mesh refinement (with an average of 5.8 elements/m), the numerical simulation results using the 18-step reaction kinetic models in a gas explosion within 120 m of the front of the tunnel are closer to the experimental data. Therefore, when the density of grid cells is sufficient, using the 18-step methane reaction mechanism can reduce computational costs while ensuring the accuracy of simulation results.

3. Numerical Model of Gas Deflagration in Tunnel

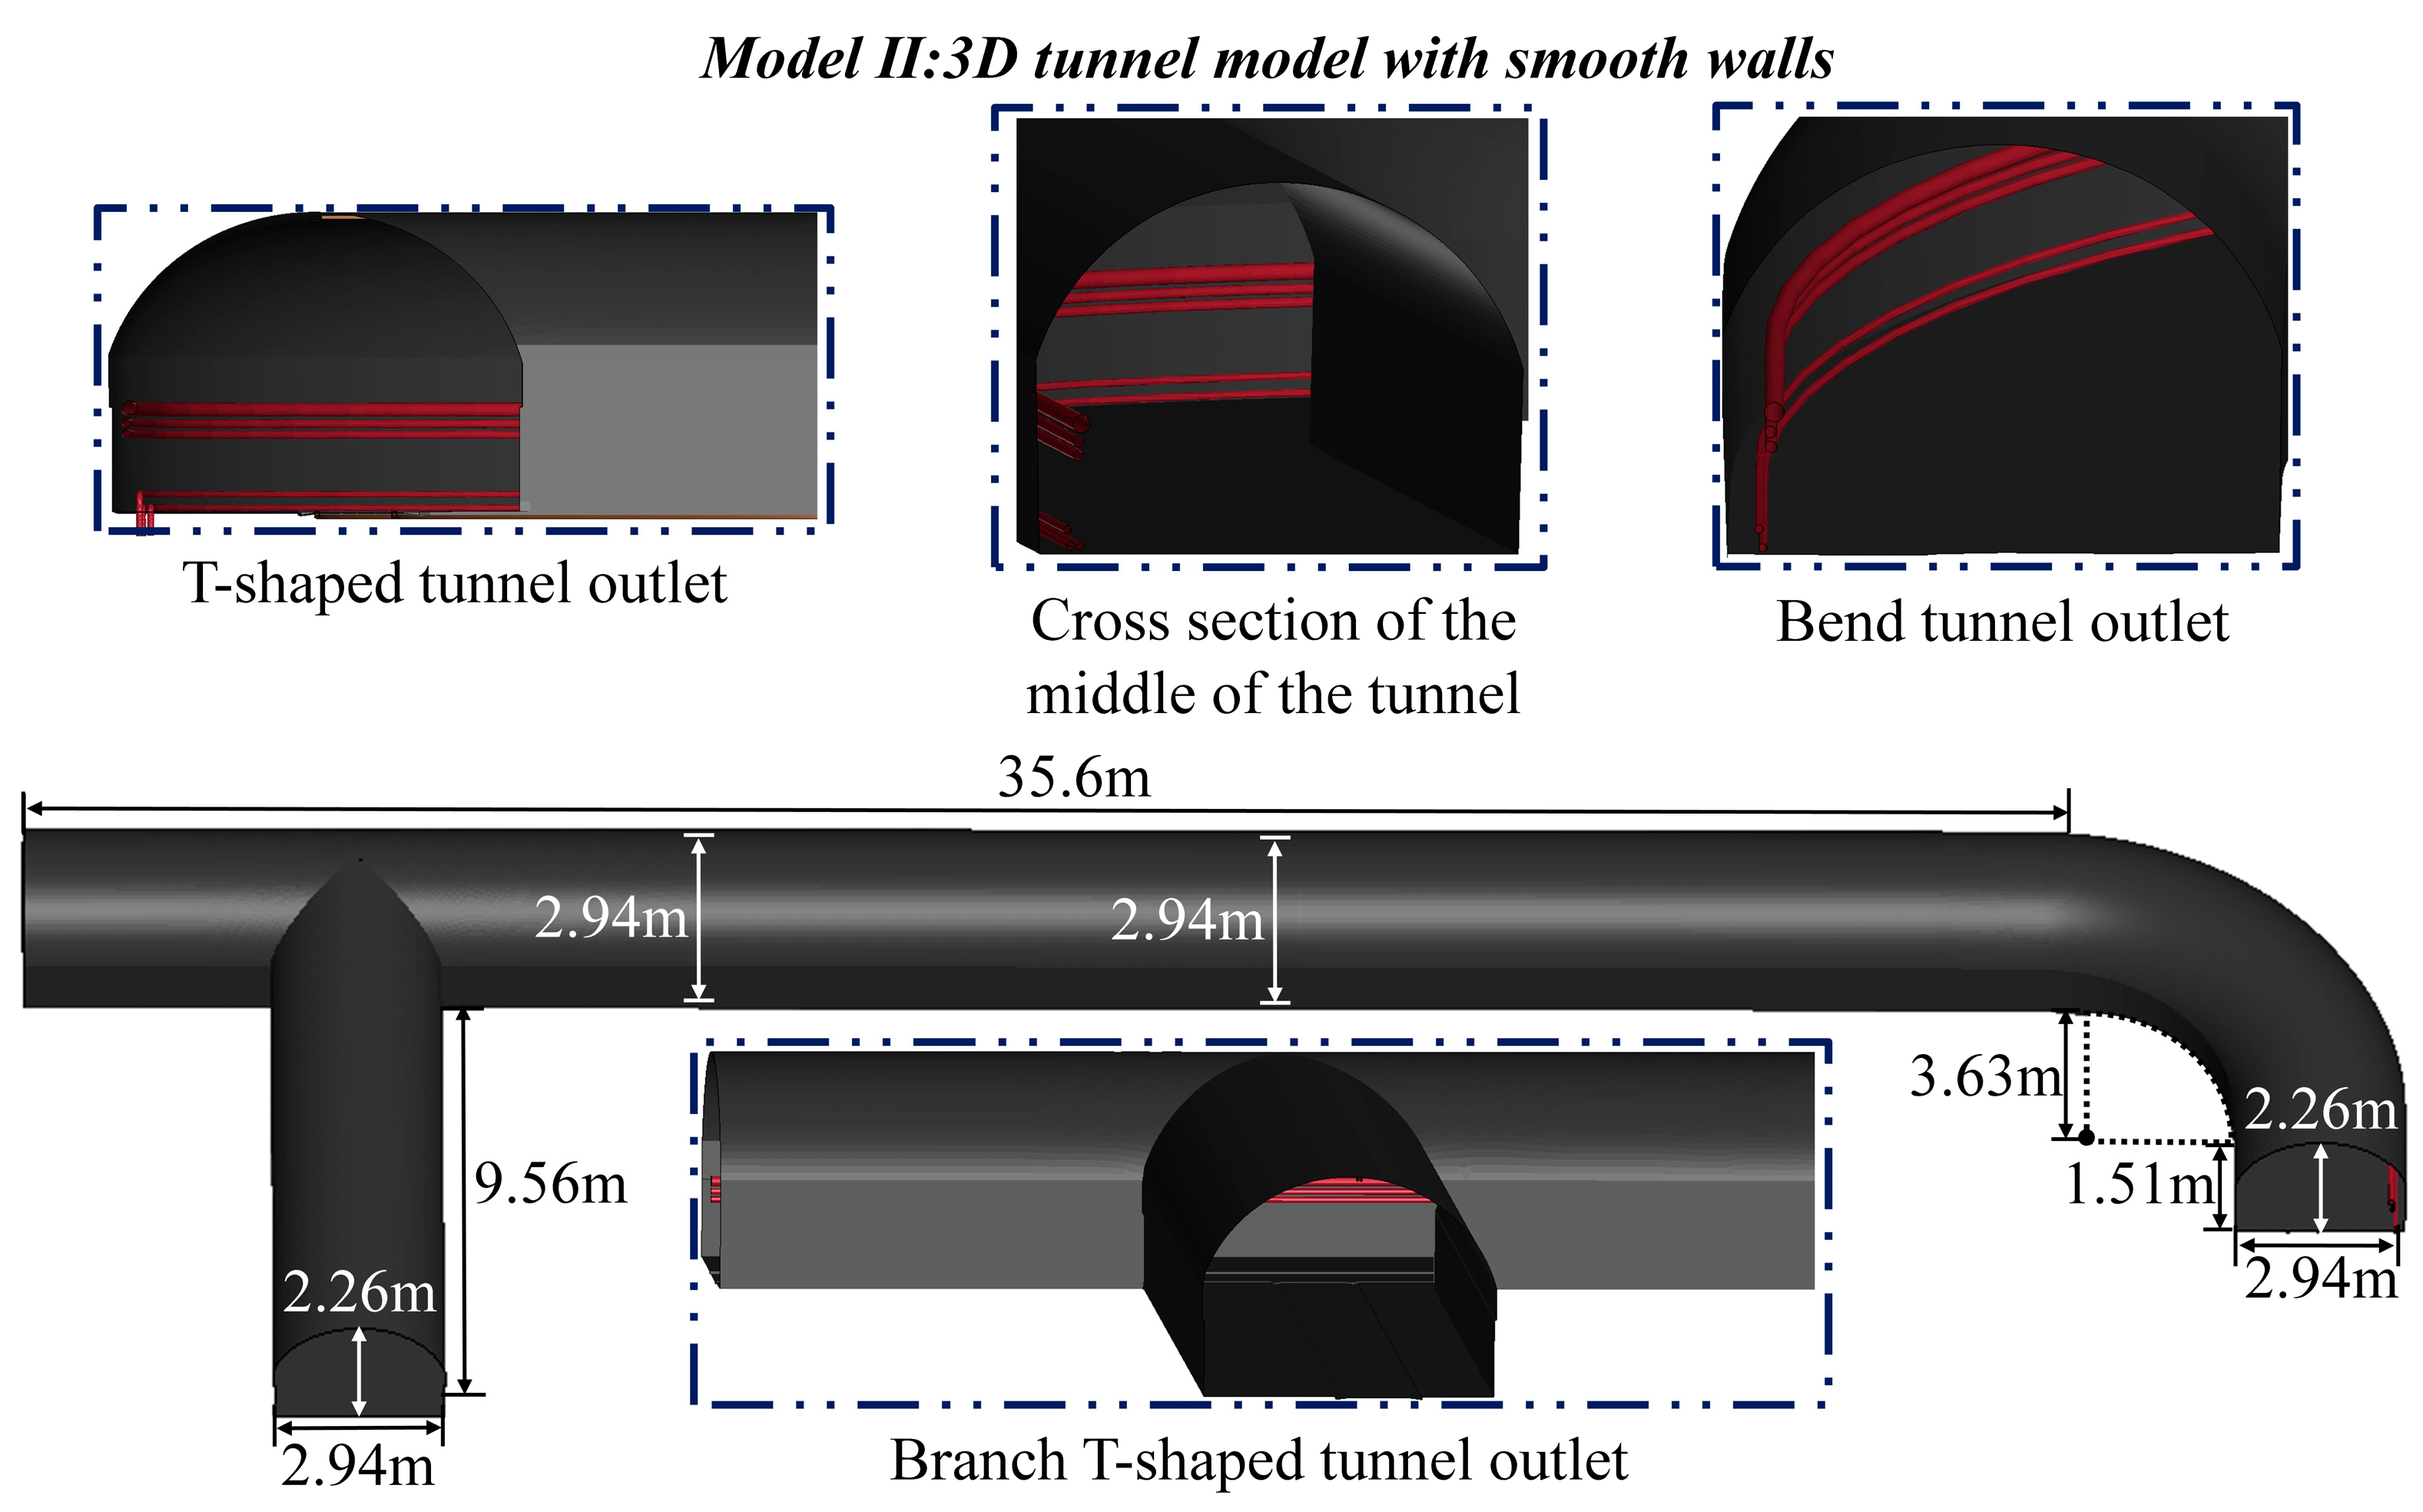
The approximate real tunnel model obtained through 3D modeling is shown in Figure 3. The model mainly includes four parts: a T-shaped tunnel, two-section straight tunnel, and a bend.
The walls of the left T-shaped tunnel and straight tunnel have little concave–convex fluctuation. By contrast, the walls of the right straight tunnel and bend are evidently concave–convex and uneven. The straight tunnel and branch tunnel of the T-type tunnel are 11.04 and 9.56 m long, respectively, the widths of the exit end are 2.97 and 2.94 m, and the height is 2.26 m. The straight tunnel connected with the T-shaped tunnel is also 11.04 m long; this tunnel is a transition section, and the rear end width is 2.75 m, which is different from the width of the front end. The length of the second straight tunnel is 13.52 m, and the connected bend includes a 1/4 arc with an inner diameter of 3.63 m and a tunnel section with a length of 1.51 m, with a total length of 9.37 m. The width and height of the tunnel are not fixed due to the evident depressions and protrusions on the right tunnel wall, and the cross-sectional area of the tunnel is between 5.8 m2 and 5.9 m2.
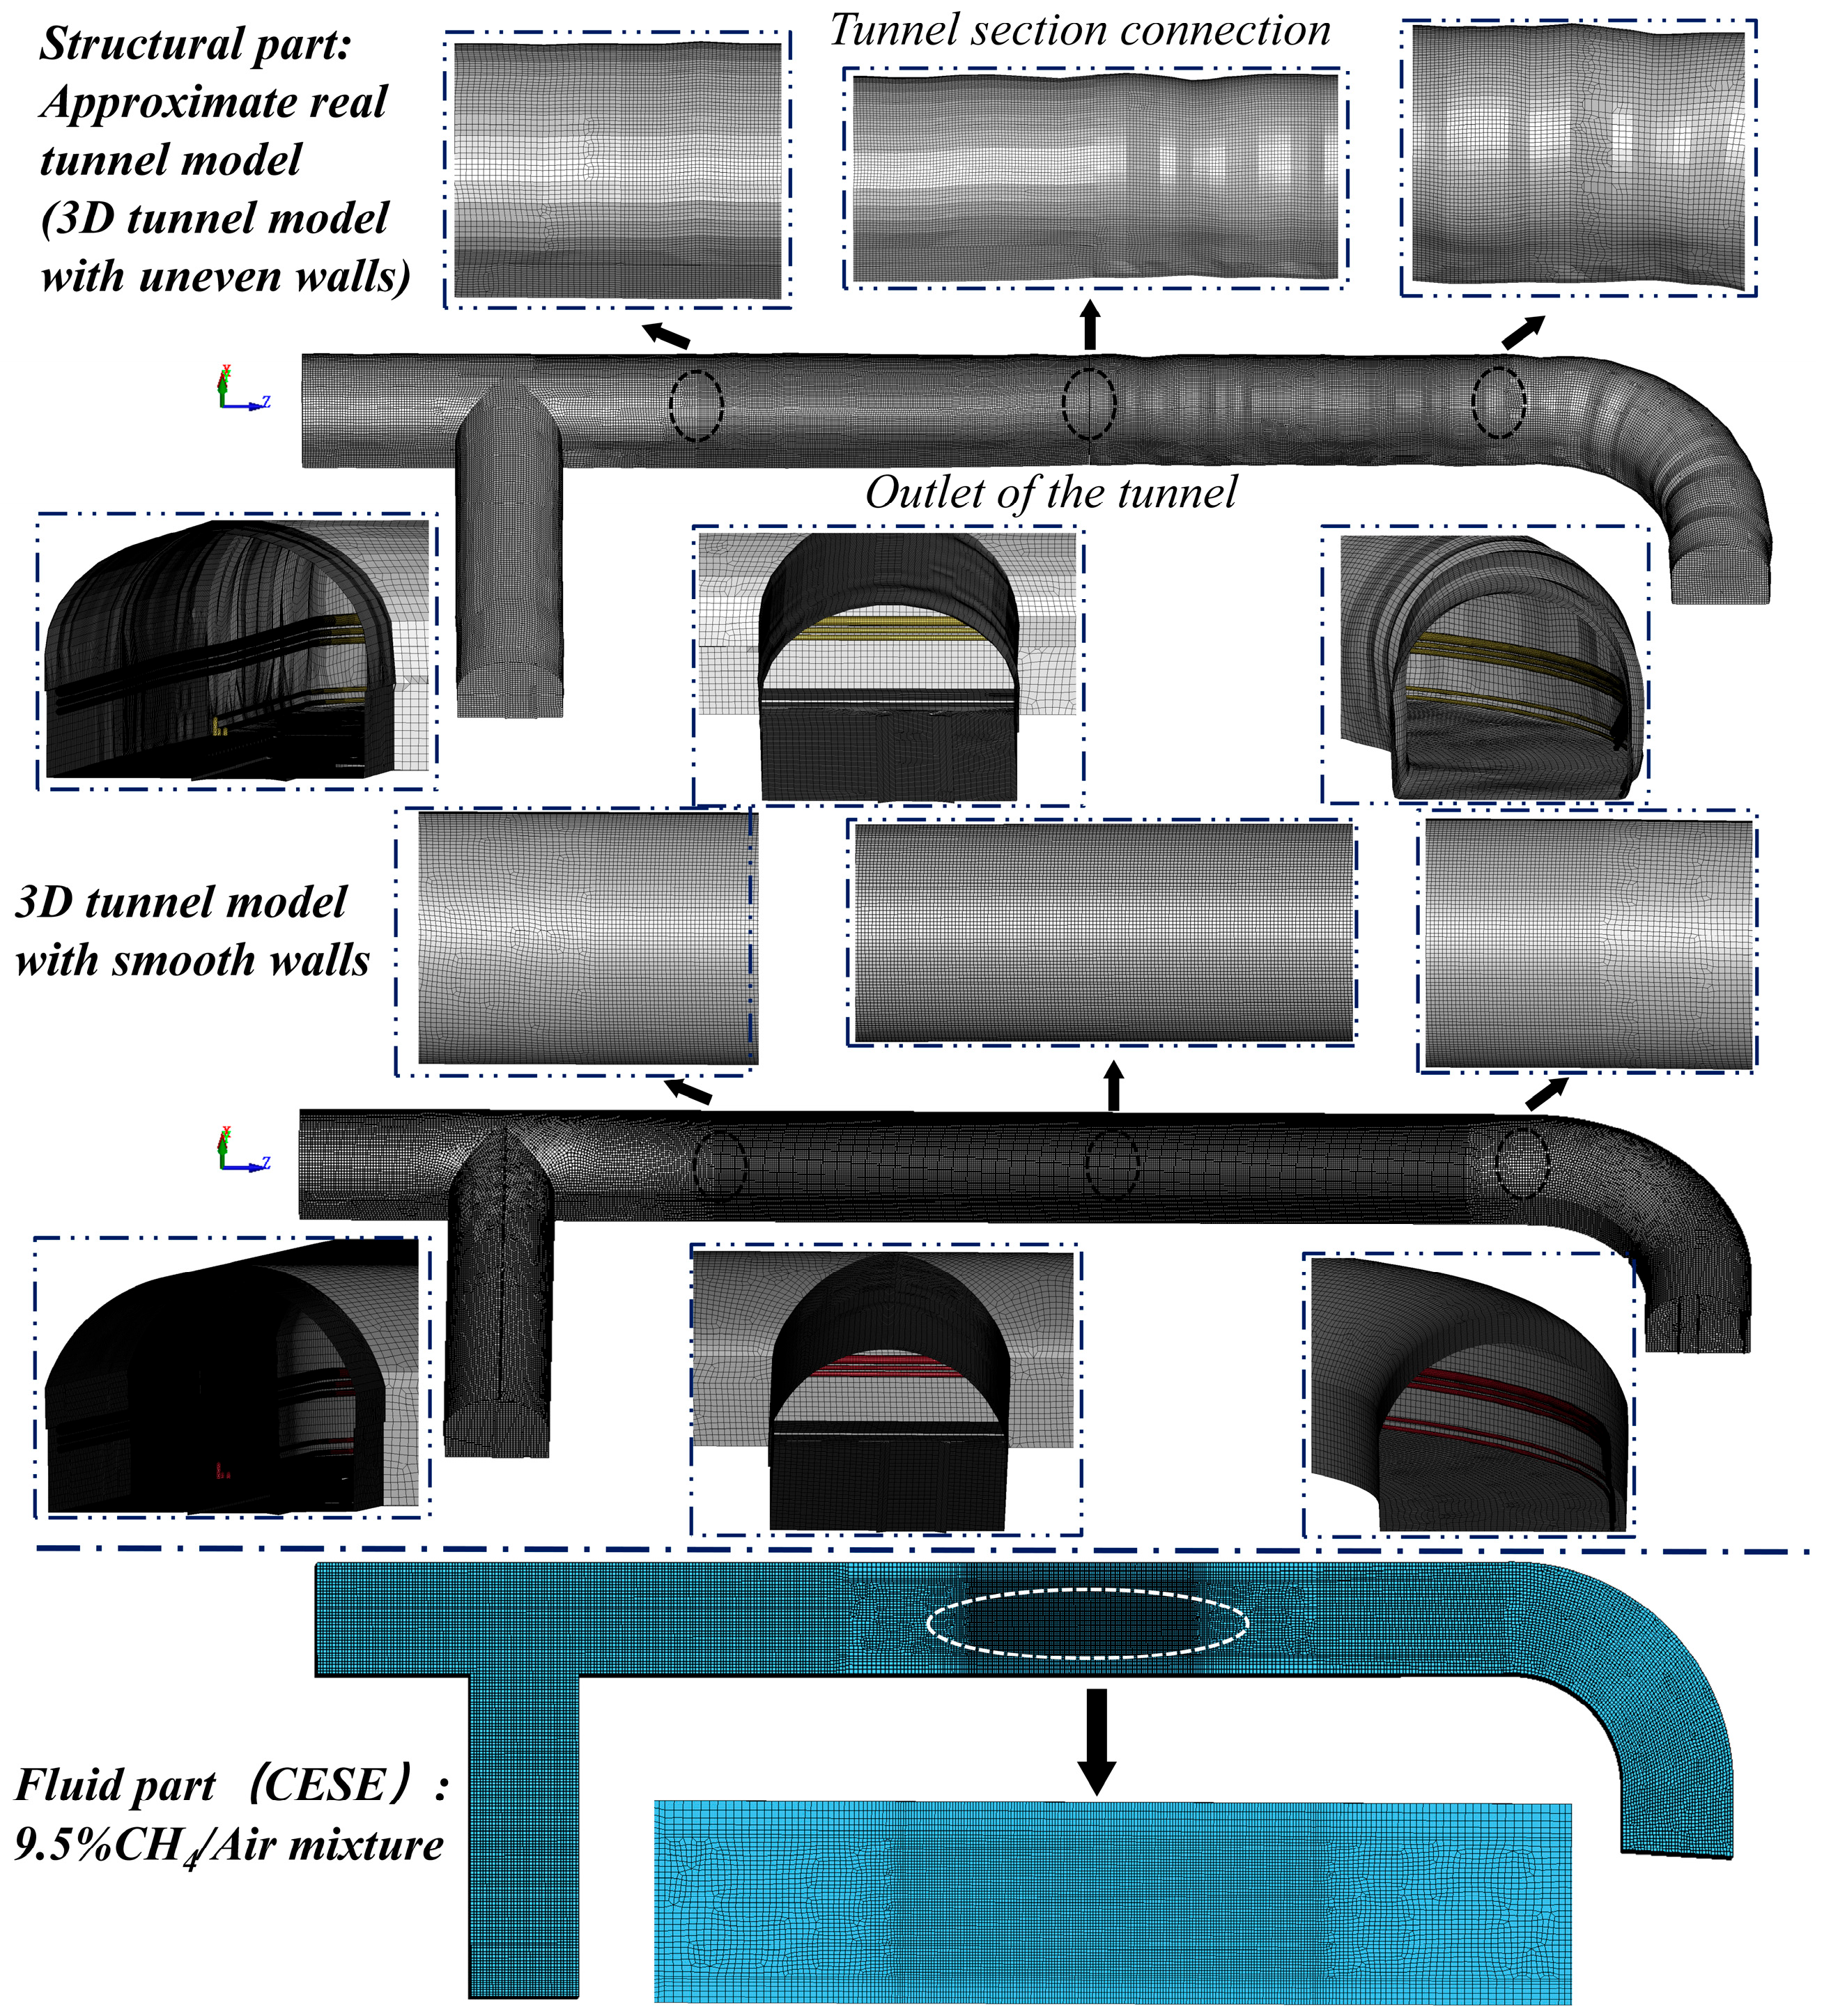
A tunnel model with smooth walls of the same size is established as a control to clarify the impact of the concave–convex fluctuation of tunnel walls on gas explosion simulation, as shown in Figure 4. The lengths of the straight tunnel, T-shaped tunnel, and bend are consistent with the approximate real tunnel model, but the tunnel walls of the model do not have concave–convex fluctuation. The height and width remain unchanged, and the cross-sectional areas of the tunnels are always 5.88 m2.
The characteristic lengths of small parts, such as the tunnel pipe support, cable, and miner’s lamp, are extremely small, greatly increasing the analysis difficulty and calculation time of the numerical model. These small obstacles have a low blockage rate of gas and a limited impact on the shock wave of gas explosion [42]. Therefore, such parts are ignored, and only tunnel and large pipes are reserved. The tunnel walls and pipes are divided by a 2D quadrilateral grid, as shown in Figure 5. The size of the tunnel wall grid transits from 0.05 m in the middle of the straight tunnel to 0.075 m on both sides (19.2 elements/m in the transverse direction of the tunnel; 20.7 elements/m in the vertical direction). The CESE fluid part uses high-quality structured grids, and the computational domain covers the entire tunnel. The fluid grid is divided into two parts: a methane–air mixture and air. The grid size from the combustible-gas part in the middle to the air part transits from 0.045 m to 0.090 m (12.5–18.7 elements/m in the transverse direction of the tunnel; 15.2 elements/m in the vertical direction). The total number of grid elements is 1,451,496.
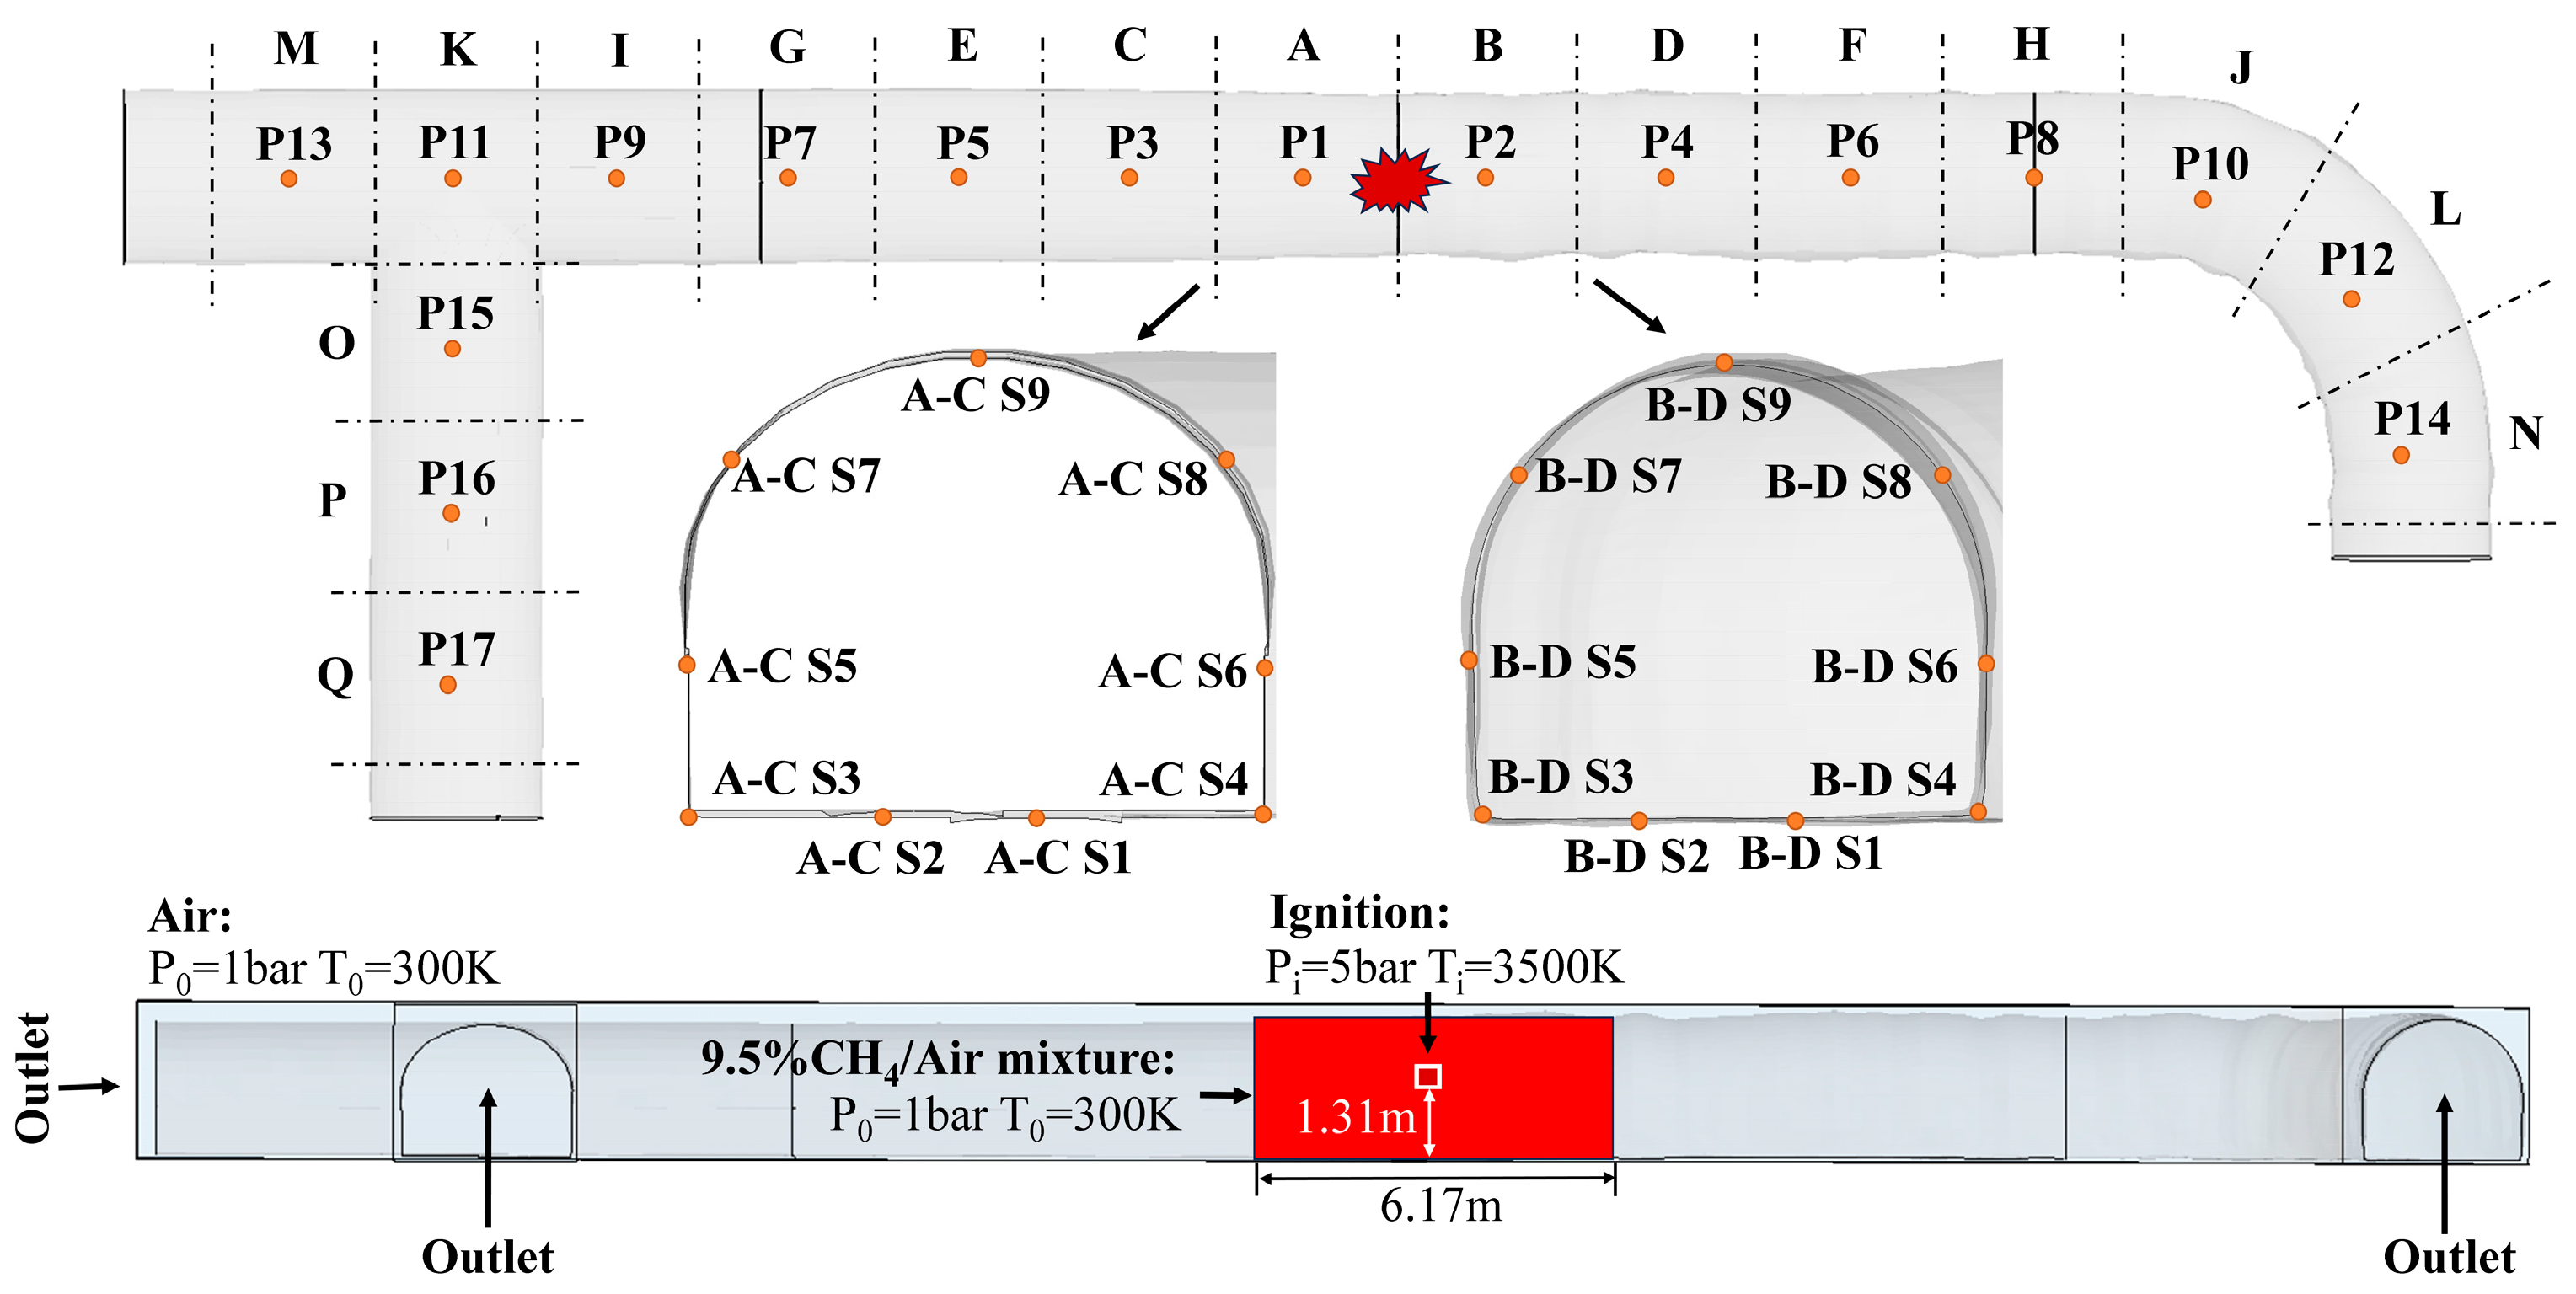
In the CESE fluid element, the position of the ignition point and the distribution of the 9.5% methane–air mixture and air are shown in Figure 6. The ignition point is located in the middle of the whole numerical model. The initial pressure and temperature of the ignition point are 5 bar and 3500 K, respectively. The ignition point is surrounded by the methane–air mixture at normal temperature and pressure, with a length of 6.17 m. The remaining component of the fluid grid is air under normal temperature and pressure conditions and the outflow boundary is set at the exit end of the tunnel.
For the convenience of analysis, the straight tunnel, T-shaped tunnel, and bend of the approximate real tunnel model and the tunnel model with smooth walls are divided into a–q tunnel sections. The center position of each section of the tunnel is set as the overpressure and gas mass-fraction monitoring point, numbered P1–P17. In the cross-section between each tunnel section, nine locations are selected as monitoring points for stress and displacement, and these are located at the tunnel bottom (S1, S2), tunnel corner (S3, S4), tunnel wall (S5–S8), and tunnel top (S9).

4. Results and Discussion

4.1. Formation and Dissipation of Reactants and Reaction Products

The multistep elementary reaction of methane deflagration is a very short process. Figure 7I shows the mass fraction changes in the intermediate products CH3 and CH2O and final product CO2 when methane reactants are consumed whereas Figure 7II shows the changes in overpressure and temperature during methane combustion.
The initial reaction rate of methane is slow, but the chain reaction starts after generating CH3, the product of the initial elementary reaction, and CH2O, the oxidation product of CH3. As a result, the methane combustion reaction rate sharply increases, and the final product CO2 starts to be generated. At the same time, the pressure and temperature of the mixed gas sharply increase. The mass fraction of intermediate products reaches its peak during the intense consumption of methane. The components rapidly participate in the next reaction after generation because of the unstable chemical properties of intermediate products. Moreover, the peak mass fraction is significantly lower than the initial reactants and final products. At this time, the distribution of intermediate products CH3 and CH2O is a thin circle, representing the region of intense methane reaction. The final product CO2 is inside the circle whereas methane that has not participated in the reaction is outside the circle. When methane is completely consumed, the intermediate products are almost simultaneously consumed. However, the mass fraction of the final product CO2 still slowly increases, indicating the remaining CO that still continues the reaction at this time. Therefore, the pressure and temperature of the mixed gas slowly increase for a short period of time after the complete consumption of methane.
Subsequently, the formation and diffusion of harmful gases CO and CO2 after explosion were analyzed, as shown in Figure 8I,II. At 0.5 ms, the CO mass fraction at points P1 and P2 at the centers of tunnel sections A and B reached 4.77% and 3.07%, respectively, and the CO mass fraction decreased sharply after reaching the peak. The trend of CO mass-fraction time curves at the P3 and P4 points, which are 3 m apart from the P1 and P2 points, is similar to that of the P1 and P2 points, but the peak value is less than 0.09%, and the CO mass fraction at points P5 and P6 (with an interval of 7.5–10.5 m from the ignition source) is less than 0.02%. This finding shows that the CO produced via methane deflagration is consumed in a large amount before it diffuses to the distance. The CO2 mass fraction at the P1 and P2 points reached 11.98% and 12.11%, respectively. After reaching the peak value, the CO2 gas began to diffuse slowly to the distance. At 35 ms, the CO2 gas mass fraction at P1 and P2 decreased to 8.49% and 5.89%, respectively. At the same time, the CO2 mass fraction at the P3–P8 points in the further distance (4.5–10.5 m from ignition point) increased to 1.29–5.54%.

4.2. Propagation Characteristics of Shock Wave in Approximate Real Tunnel Model and Tunnel Model with Smooth Walls

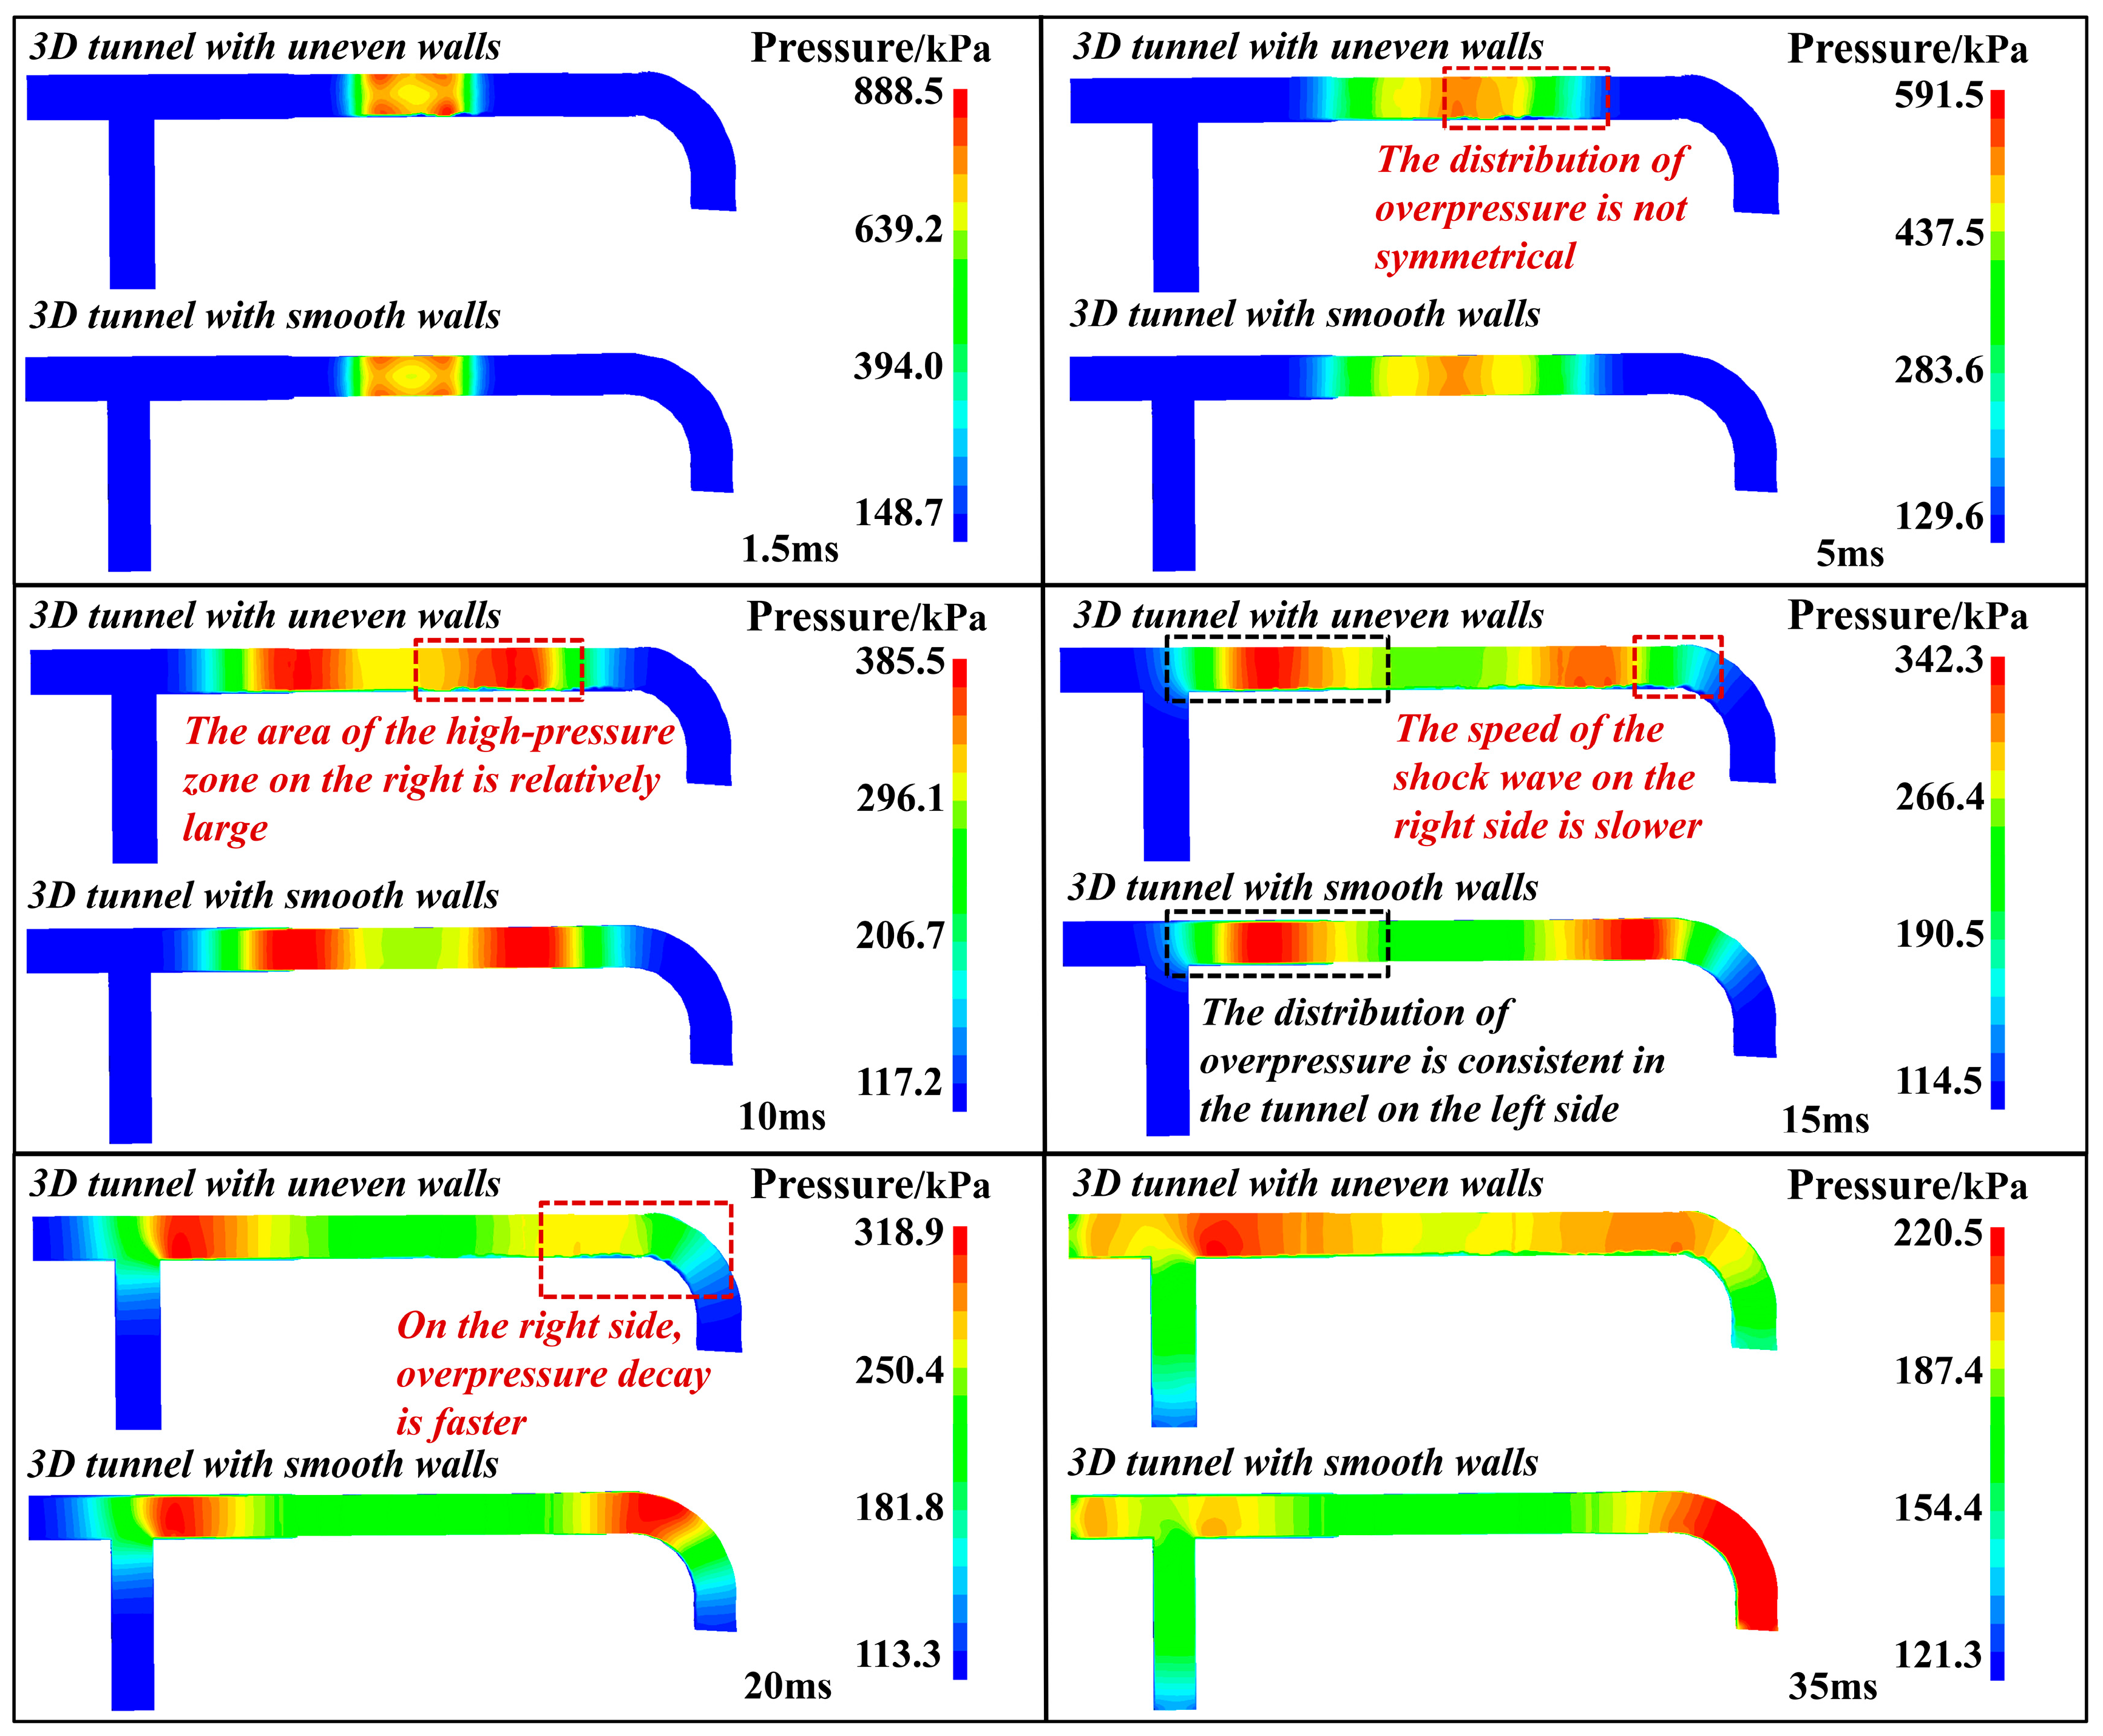
In real coal mine gas explosion scenarios, the unevenness of the tunnel walls and floor caused by coal mining has a significant im-pact on the propagation of shock waves in the tunnel. Therefore, we compared and analyzed the propagation and attenuation processes of gas explosion shock waves in ap-proximately real tunnel models with uneven walls and floors, as well as in smooth tunnel models with smooth walls and floors, as shown in Figure 9.
During the time period from 1.5 ms to 10 ms, the explosion shock wave propagates in the straight tunnels on both sides simultaneously. At 1.5 ms, the initial shock wave is superimposed with the reflection wave from the tunnel wall, and the overpressure reaches the maximum value of 884.5 kPa. The uneven wall and floor changes the incident angle of the shock wave and the propagation direction of the reflected wave. Subsequently, the superposition of the shock wave changes. Therefore, the overpressure distribution in an approximate real tunnel is asymmetric. At 5–10 ms, the complete consumption of methane reactants causes the shock wave to lose its energy replenishment, thereby reducing the shock wave overpressure. The orange–red high-pressure area in the approximate real tunnel inclines to the right straight tunnel with severe concave and convex fluctuations. The overpressure distribution of the fluid in the tunnel with smooth walls maintains symmetry. The propagation distance of the shock wave in two different tunnel models during this time period is the same.
After 15 ms, the shock wave propagating to the left has reached the intersection of the straight tunnel and the branch tunnel whereas the shock wave on the right has entered the bend tunnel. Within 15 ms to 20 ms, the propagation range and overpressure distribution of the shock wave in the left of the approximate real tunnel with only slight fluctuations are almost the same as those in the tunnel with smooth walls. The propagation distance of shock waves in the bend tunnel of the approximately real tunnel is lower than that in a smooth wall tunnel. At the same time, the area of the orange high-pressure zone in the bend tunnel of the approximately real tunnel gradually declines. In 35 ms, the shock waves have reached the tunnel exit and the maximum overpressure is 220.5 kPa.
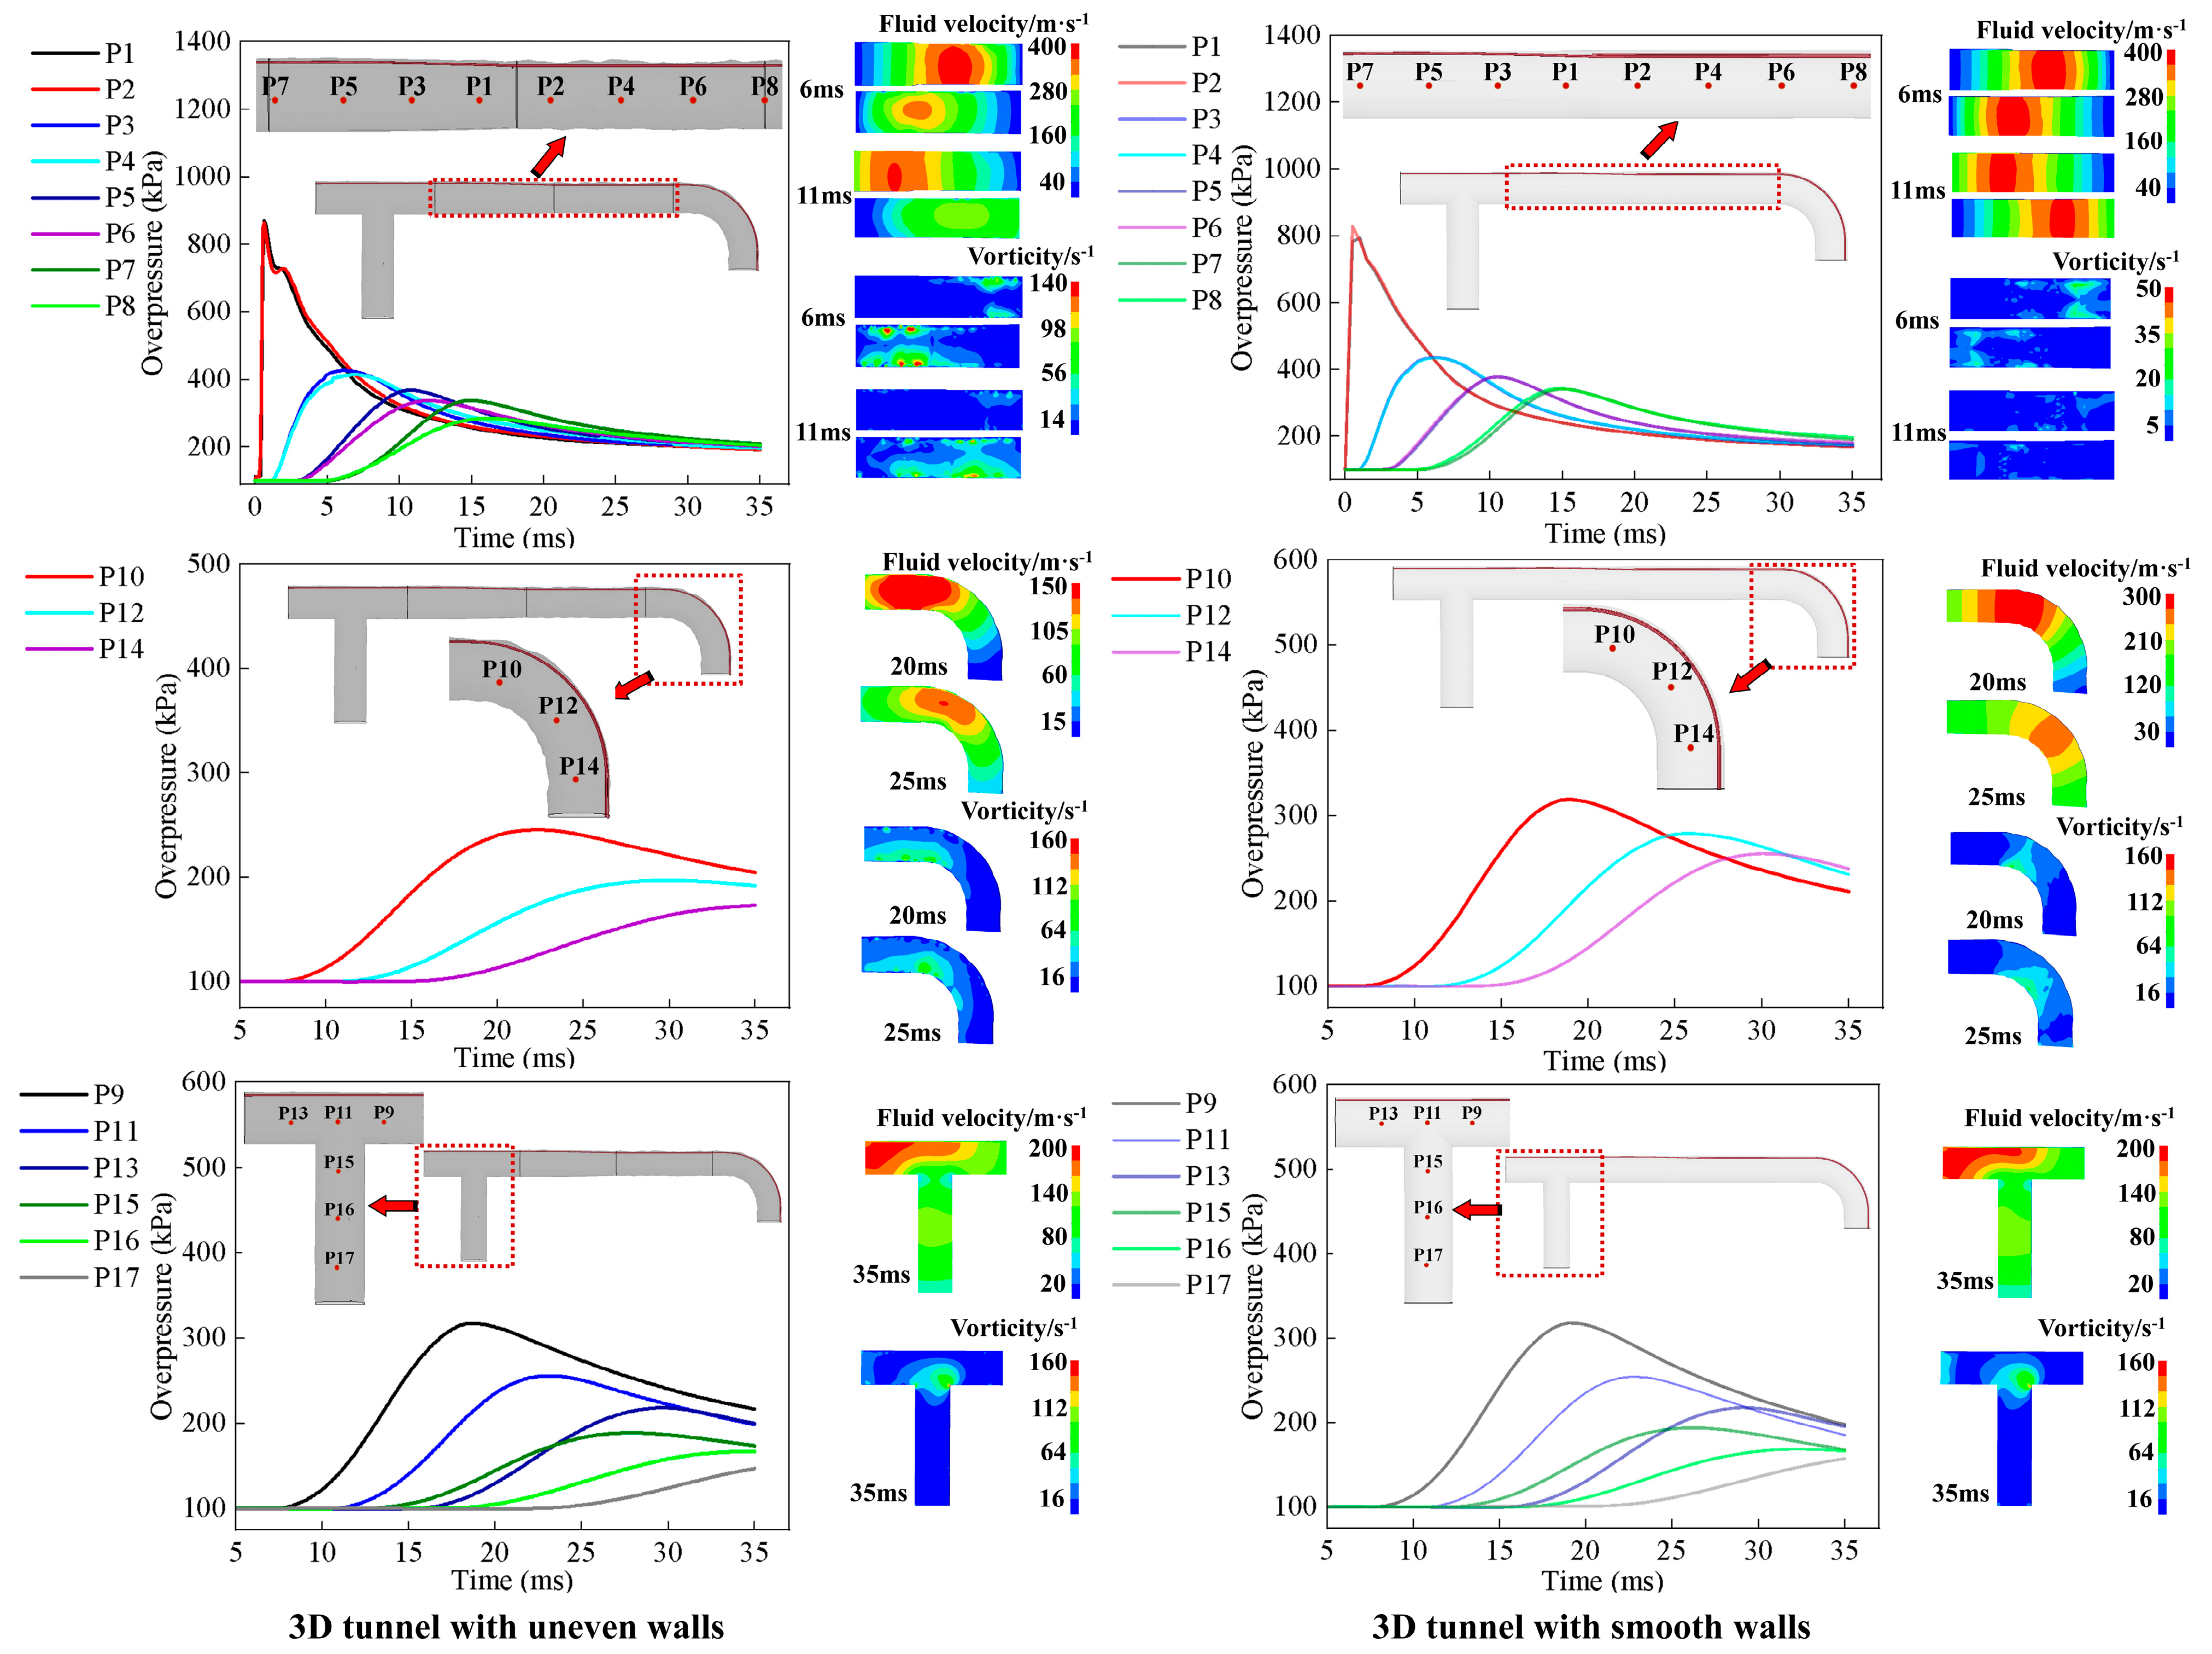
The changes in overpressure over time in the A-Q section of the tunnel were monitored to further explore the reasons for the different distributions of overpressure in the two different tunnel models. At the same time, the changes in shock wave velocity field and vorticity in straight tunnels, bend tunnels, and T-shaped tunnels in the two models were analyzed separately, as shown in Figure 10.
When the shock wave propagates in the straight tunnel, the velocity direction of the fluid near the right tunnel in the approximate real tunnel changes significantly, increasing the local resistance of the fluid and energy dissipation. Ultimately, it leads to a concentric distribution of shock wave velocity in the right straight channel. After 11 ms, compared with the left straight lane, the shock wave velocity and overpressure attenuation amplitude increase. As the distance between the overpressure monitoring points and the center of the tunnel increases, the difference between the overpressure time curves of P2, P4, P6, and P8 on the right side of the approximate real tunnel and those of P1, P3, P5, and P7 on the left side gradually increases. The peak overpressure at points P2, P4, P6, and P8 is low, and considerable time is required to reach the peak overpressure. For the smooth wall tunnel model, the change in the velocity direction of the fluid near the wall is unremarkable, the local resistance inside the fluid is small, and the shock wave velocity is distributed in a layered manner. At 11 ms, the velocity and overpressure attenuation amplitude of the shock wave in the straight tunnels on both sides are relatively small. The overpressure time curves of monitoring points P1, P3, P5, P7 and P2, P4, and P6 and P8 are close to overlapping.
When the shock wave enters the bend, the direction of fluid velocity deviates significantly. The approximate real tunnel has higher vorticity near the wall and at the turning of the tunnel. In the smooth wall tunnel, only the fluid at the turning point of the tunnel has high vorticity. The propagation speed of shock waves in the approximate real tunnel is only half of that in the smooth wall tunnel. The differences in the peak overpressure and peak overpressure arrival time of the overpressure time curves of monitoring points P10, P12, and P14 in the two models increase. The peak overpressure differences were 73.78, 81.91, and 81.38 kPa, respectively and the peak overpressure arrival time differences were 3.4, 4.1, and 7.4 ms, respectively.
When the shock wave enters the T-shaped tunnel on the left, the presence of a branch causes the velocity direction of the shock wave to deviate, and at the intersection of the tunnel, the vorticity of the fluid is relatively high. Among them, the shock wave velocity in the main tunnel is significantly higher than that in the branch tunnel. The flow velocity and vorticity cloud maps within the T-shaped tunnel in both models are similar. The overpressure peaks at the monitoring points located in the T-shaped tunnel in both models are similar. These findings indicate that when the unevenness of the tunnel walls and floors is low, the tunnel can be regarded as smooth.

4.3. Stress Response of Approximate Real Tunnel Model and Tunnel Model with Smooth Walls

The results of the previous analysis show that the uneven walls of the tunnel have a certain impact on the propagation and overpressure distribution of the shock wave, leading to the difference in load between the approximate real tunnel and the tunnel with smooth walls.
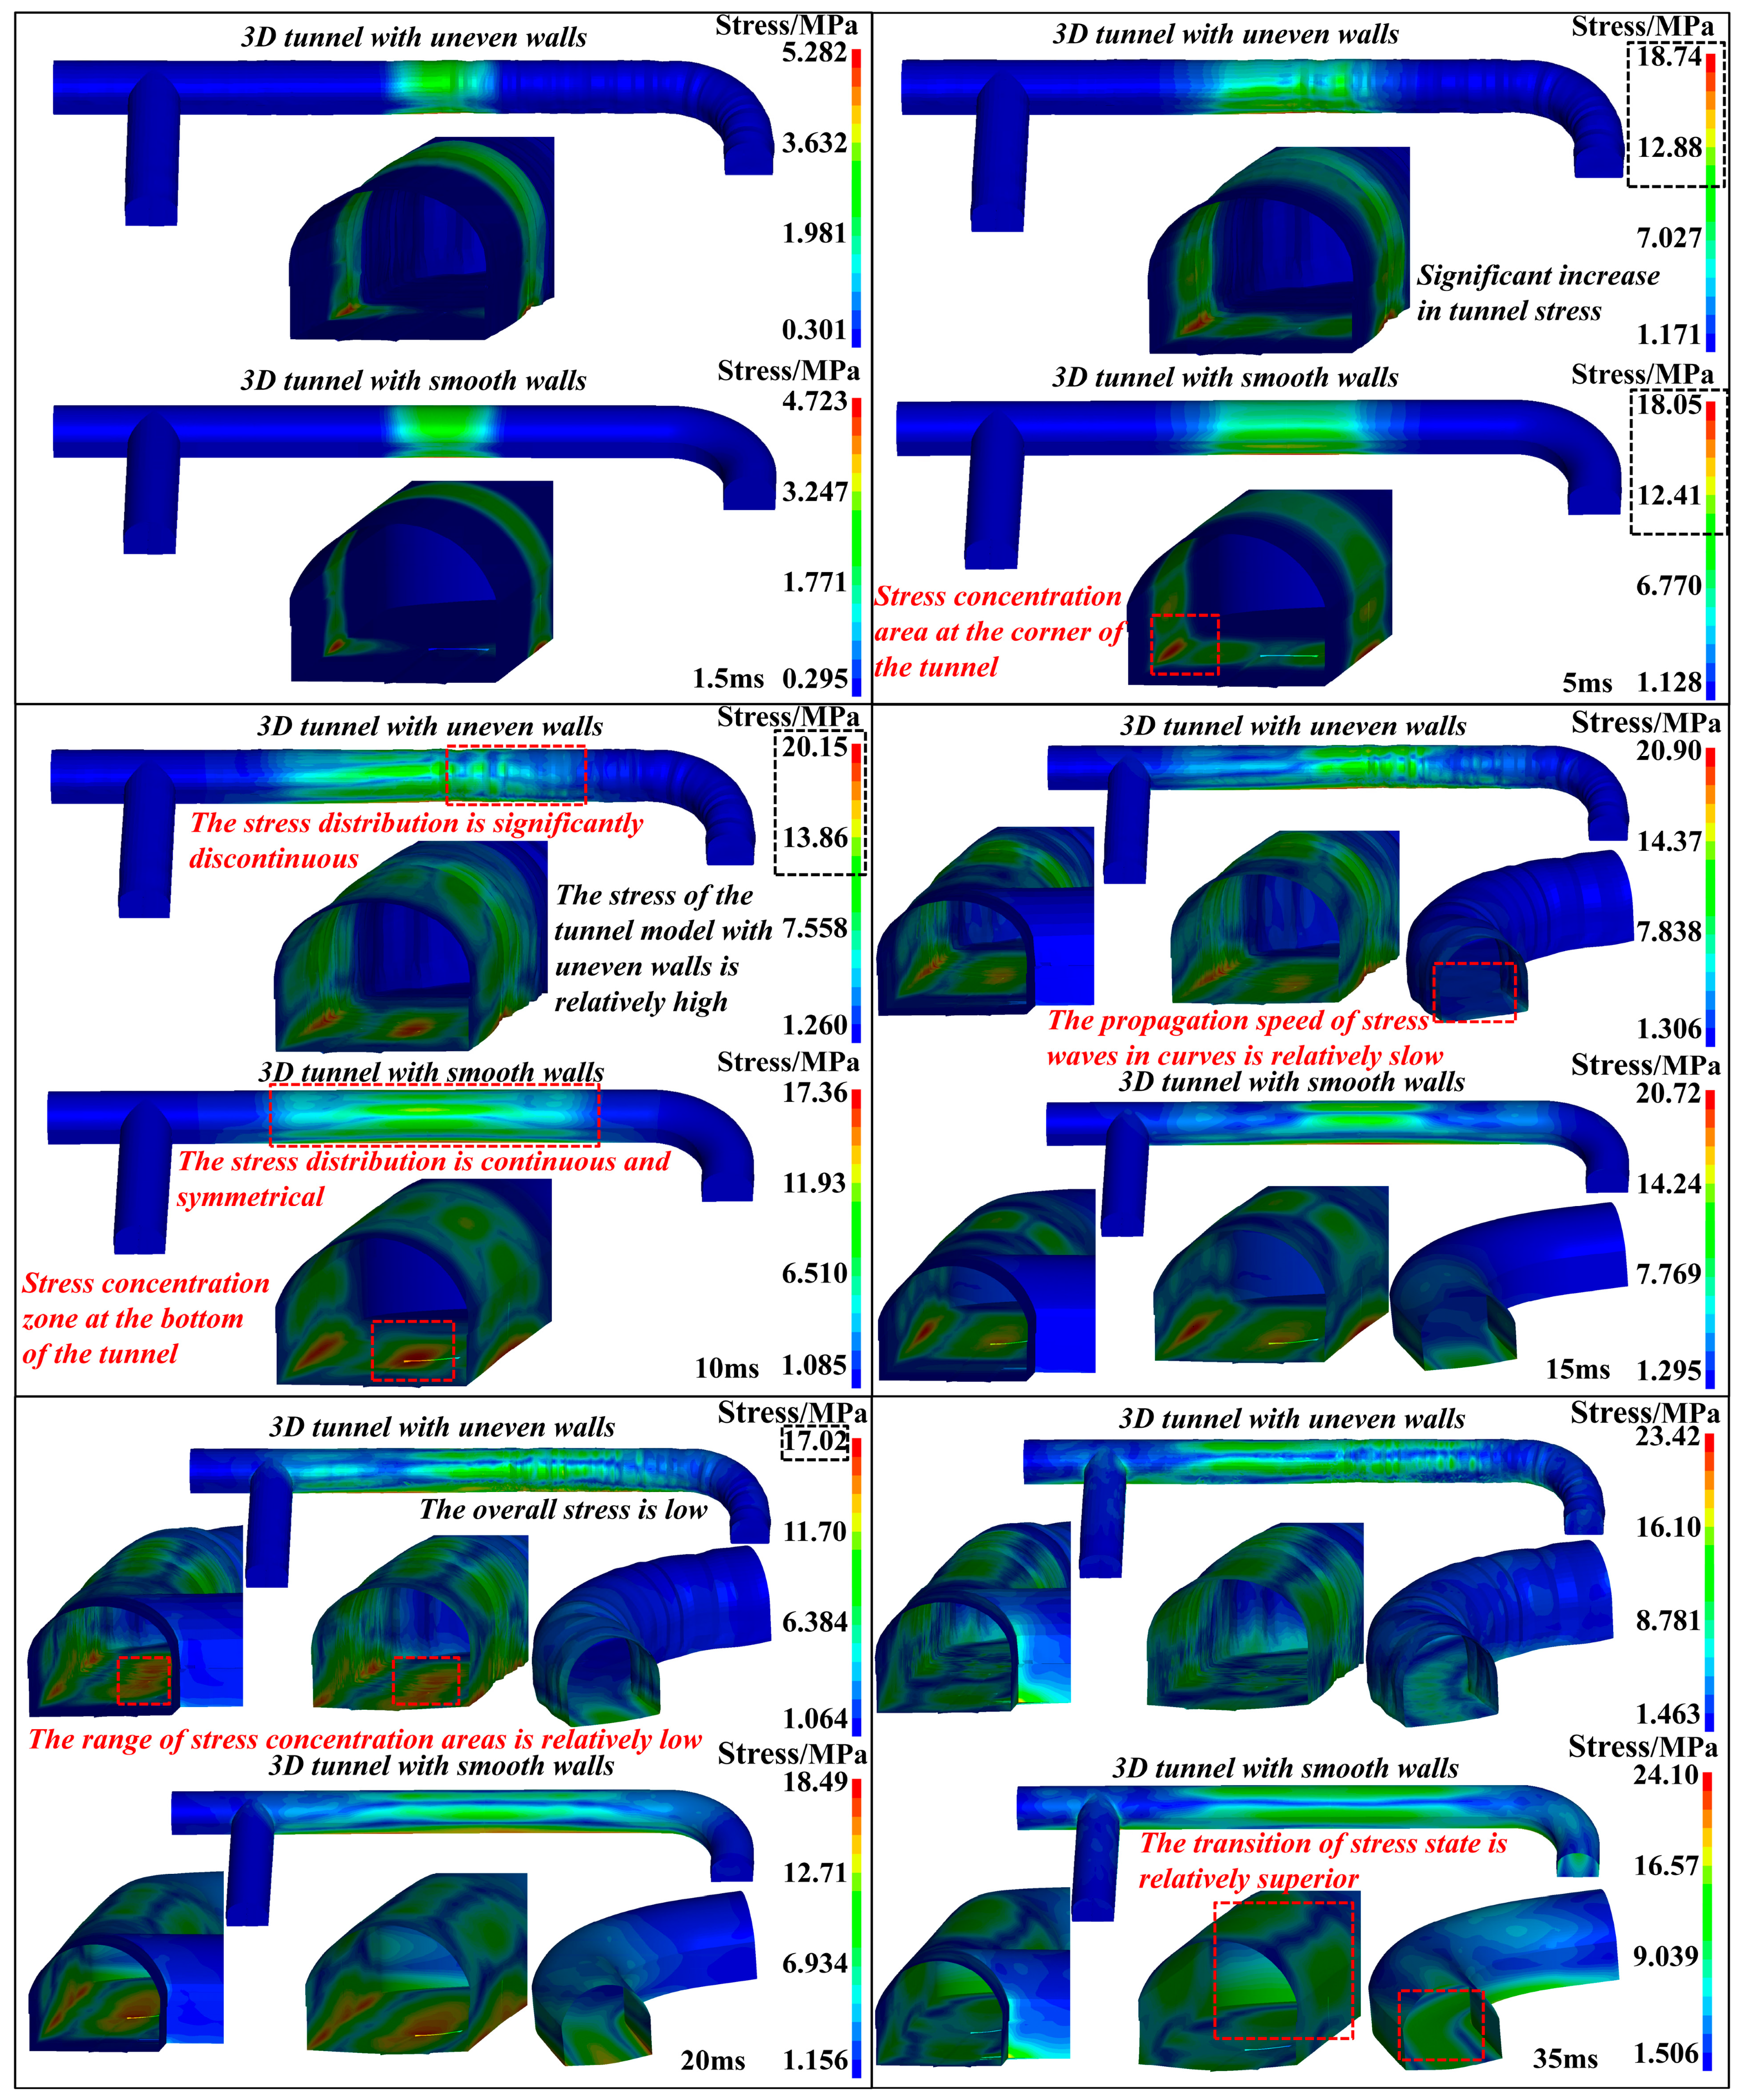
Figure 11 shows the effective stress distribution of the outer surface and inner walls of the tunnel in different time periods for the two tunnel models. At 1.5 ms, the high-intensity explosion shock wave initially acts on the tunnel walls near the explosion gas. The stress distribution of the approximate real tunnel is the same as in the tunnel with smooth walls; the former bears a high stress. The stress in most areas ranges from 1.5 MPa to 3 MPa. The stress concentration areas are located at the left and right corners of the tunnel, with stresses ranging from 4 MPa to 5 MPa. After 5 ms, the shock wave is reflected many times between the tunnel walls, the stress on the tunnel walls increases significantly, and the maximum stress reaches more than 18 MPa. And this is already higher than the yield limit of 12.3MPa of the coal tunnel material, causing plastic deformation in the coal tunnel (when the plastic deformation reaches 0.8, the material will fail). At 10 ms, the red stress concentration area appears in the center of the tunnel bottom. For the approximate real tunnel model, the phenomenon of discontinuous stress distribution becomes prominent, especially in the walls with more evident concave–convex fluctuation on the right side. The stress distribution on the tunnel surface with smooth walls is continuous and symmetrical. At 15 ms, the stress wave has diffused to the T-shaped structure and bend part of the tunnel. The diffusion of the stress wave in the bend of the approximate real tunnel is delayed compared with that of the tunnel with smooth walls. After 20 ms, the range of the red stress concentration zone and maximum stress on the approximate real tunnel surface are lower than those in smooth-walled tunnels. At 35 ms, the stress wave has spread to the whole tunnel, the stress on the upper wall of the T-shaped tunnel and bend is low, and the stress load on the bottom of the tunnel is high. The green stress zone on the wall of the approximate real tunnel is split by the blue unloading zone and distributed in a serrated shape whereas the transition between the green stress zone on the wall of the tunnel with smooth walls and the blue unloading zone is relatively good. At this time, the maximum stress values of the two tunnels still increase, reaching 23.42 and 24.10 MPa.
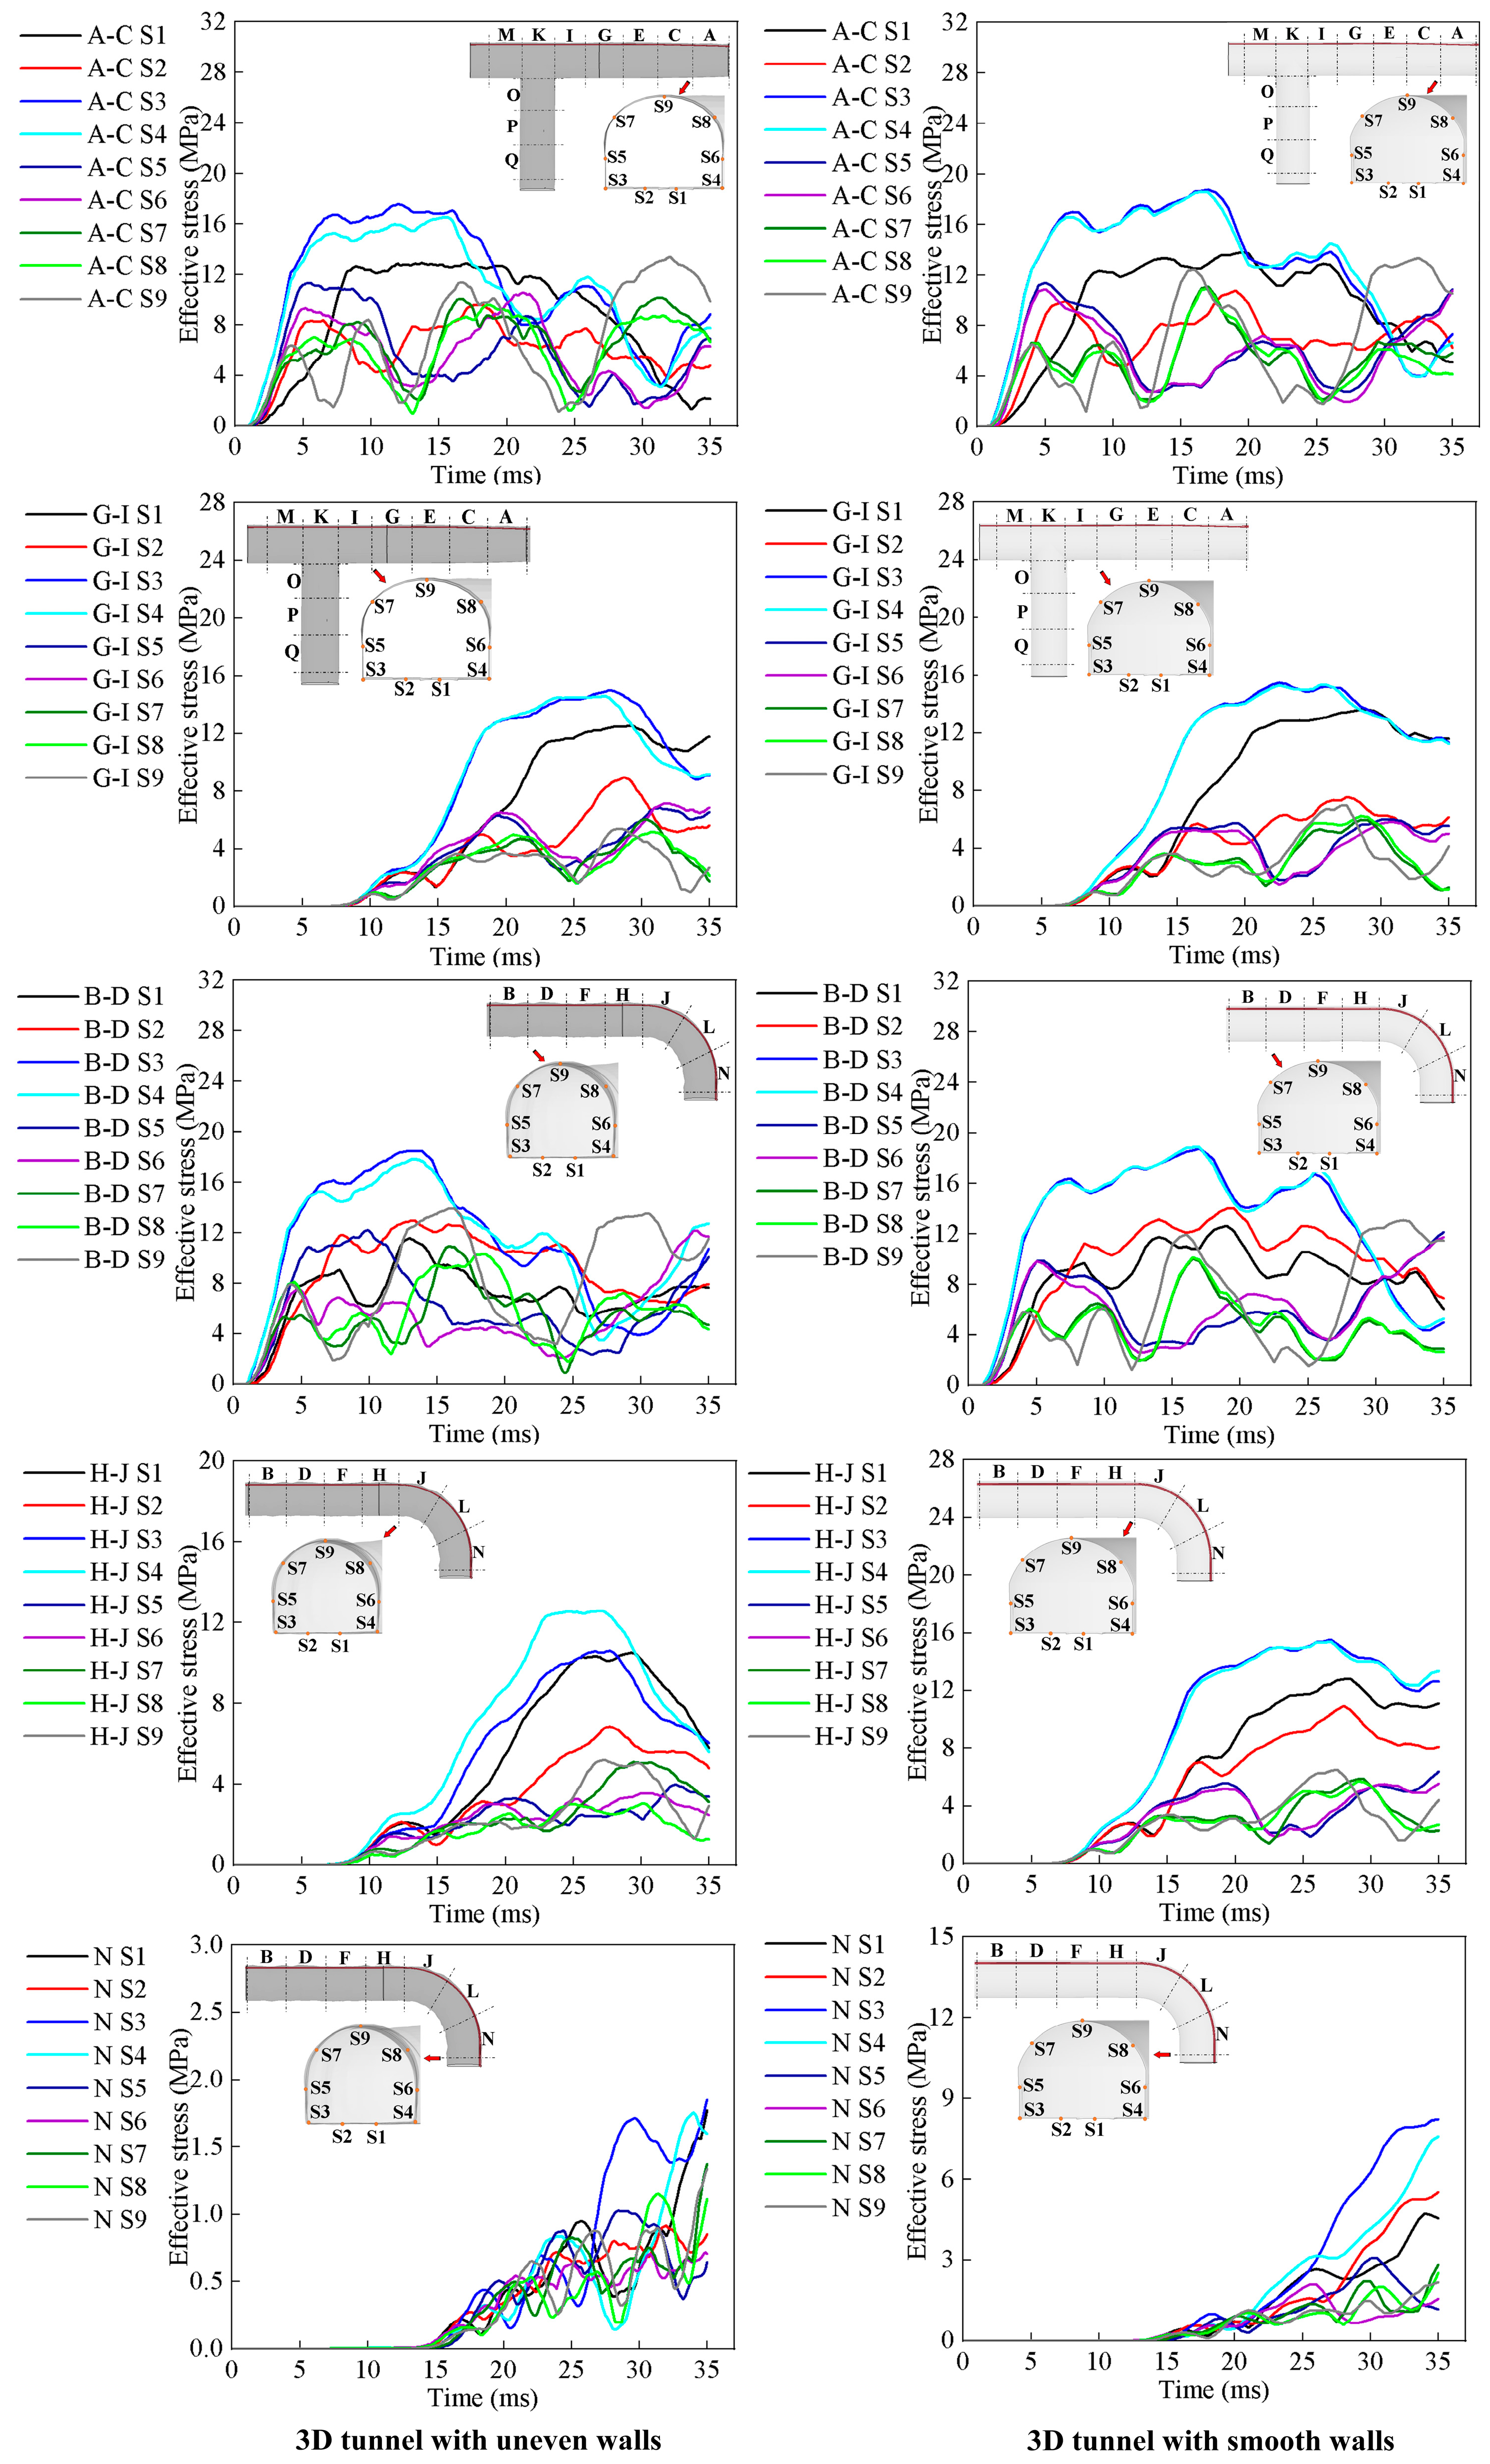
Figure 12 shows the variation curve of stress with time at the S1–S9 measuring points at the sections A–C, B–D, G–I, H–J, and N in the approximate real tunnel model and the tunnel model with smooth walls. In each section in the two tunnel models, the point with the highest stress and the first to reach the peak always includes the measuring points S3 and S4 at the corner of the tunnel, followed by the measuring points S1 and S2 located at the bottom of the tunnel. However, the stress of measuring points S5 and S6 of and S7 and S8 on the tunnel wall is relatively low. For sections A–C and B–D, which are nearest to the explosion center, the stress time curve of measuring point S9 on top of the tunnel reaches the highest point the slowest, but its peak value is close to those of S1 and S2. The trend and stress range of the stress time curves at each measuring point in sections A–C, B–D, and G–I of the approximate real tunnel and the smooth wall tunnel are consistent. The curves of the symmetric measuring points S1 and S2, S5 and S6, and S7 and S8 in the smooth wall tunnel almost overlap. However, a certain gap is found in the stress time curves of these mutually symmetric measuring points in the approximate real tunnel. At the same time, the high stress-application time of each stress-monitoring point of the approximate real tunnel is lower than that of the tunnel model with smooth walls, and its curve falls faster, and this phenomenon is more evident for sections B–D and H–J of the right tunnel. In addition, the stress loading amount of sections H–J and N located in the bend in the approximate real tunnel is lower than that of sections H–J and N of the tunnel with smooth walls. These results show that the propagation ability of stress waves in the approximate real tunnel is worse than that in the smooth tunnel.
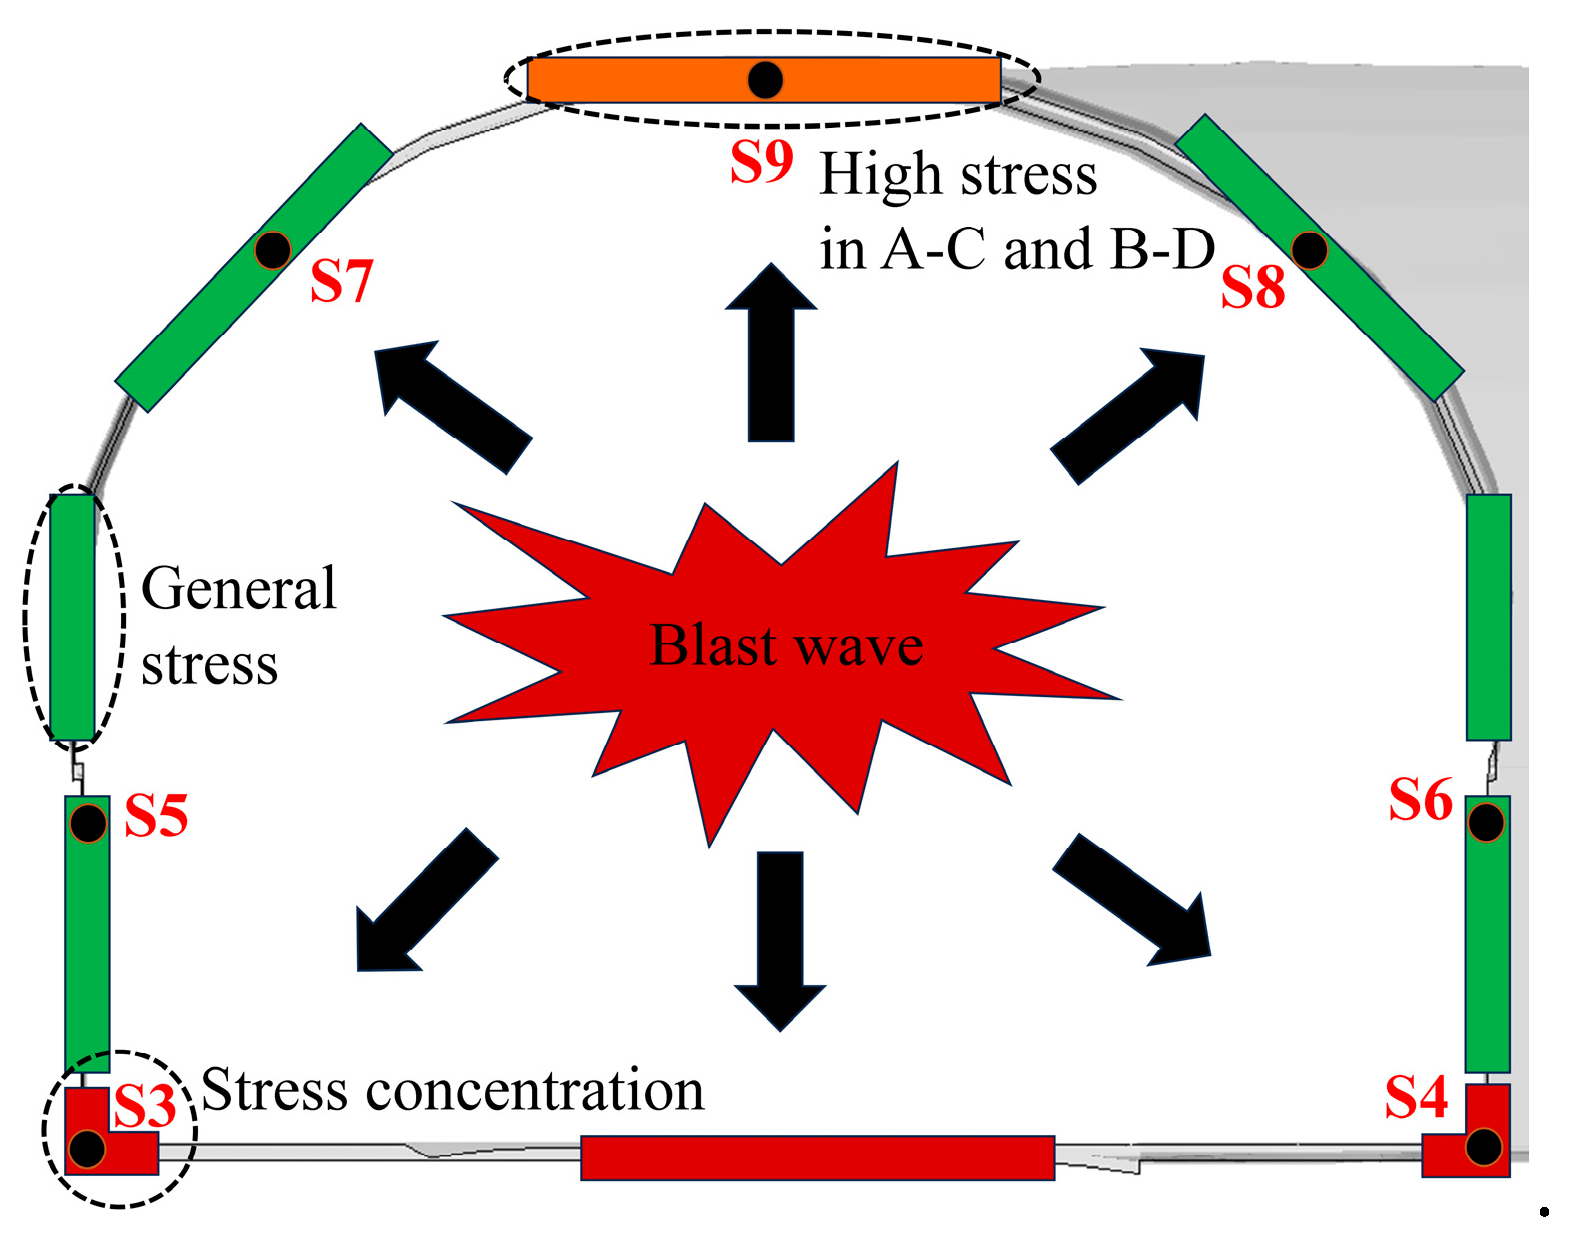
Overall, the development and diffusion processes of stress waves are closely synchronized with the propagation of shock waves. Except for bends, the positions and ranges of the green stress zone and the red stress concentration zone in the two types of tunnels are the same, and the stress distribution of the tunnel section are similar, as shown in Figure 13. The stress concentration area is located at the corner of the tunnel, the high stress area is located on the top surface of the tunnel near the explosive gas, and the general stress area is located on the wall of the tunnel. However, compared with the tunnel with smooth walls, the stress of the approximate real tunnel wall presents the characteristics of discontinuous stress distribution and low maximum stress. Moreover, the stress unloading on the wall of the approximate real tunnel occurs earlier than that of the smooth wall tunnel, and the propagation speed of stress waves in the bend of the former is relatively slow, leading to varying degrees of deformation in the two tunnel types.

4.4. Displacement Response of Approximate Real Tunnel Model and Tunnel Model with Smooth Walls

The final deformation of the approximate real tunnel model and the smooth wall tunnel model is shown in Figure 14.
For the approximate real tunnel, the deformation degree of the tunnel on the right is lower than that of the tunnel on the left. When the left straight tunnel is considered the center, the deformation degree of the tunnel gradually decreases toward both sides. The top and bottom of the left straight tunnel have the most severe deformation, with a maximum deflection of 0.08 m. The bend tunnel and the branch of the T-shaped structure have the smallest deformation. The displacement distribution of the smooth wall tunnel is uniform, and the deformation degrees of the left and right tunnels are similar. The part with the highest degree of deformation is located at the bottom of the center of the tunnel, with a maximum deflection of 0.187 m, which is more than twice that of an approximate real tunnel. The minimum total displacement on the surface of the light-green deformation zone exceeds 0.07 m. The plastic deformation areas in the two types of tunnel models are mostly distributed in the middle and corner of the bottom of the straight tunnel, and small plastic damage areas are found in the top of the middle of the straight tunnel and the corner of the T-shaped tunnel. The plastic deformation area in the approximate real tunnel is smaller than that in the smooth wall tunnel, and no plastic deformation is found in its bend tunnel.
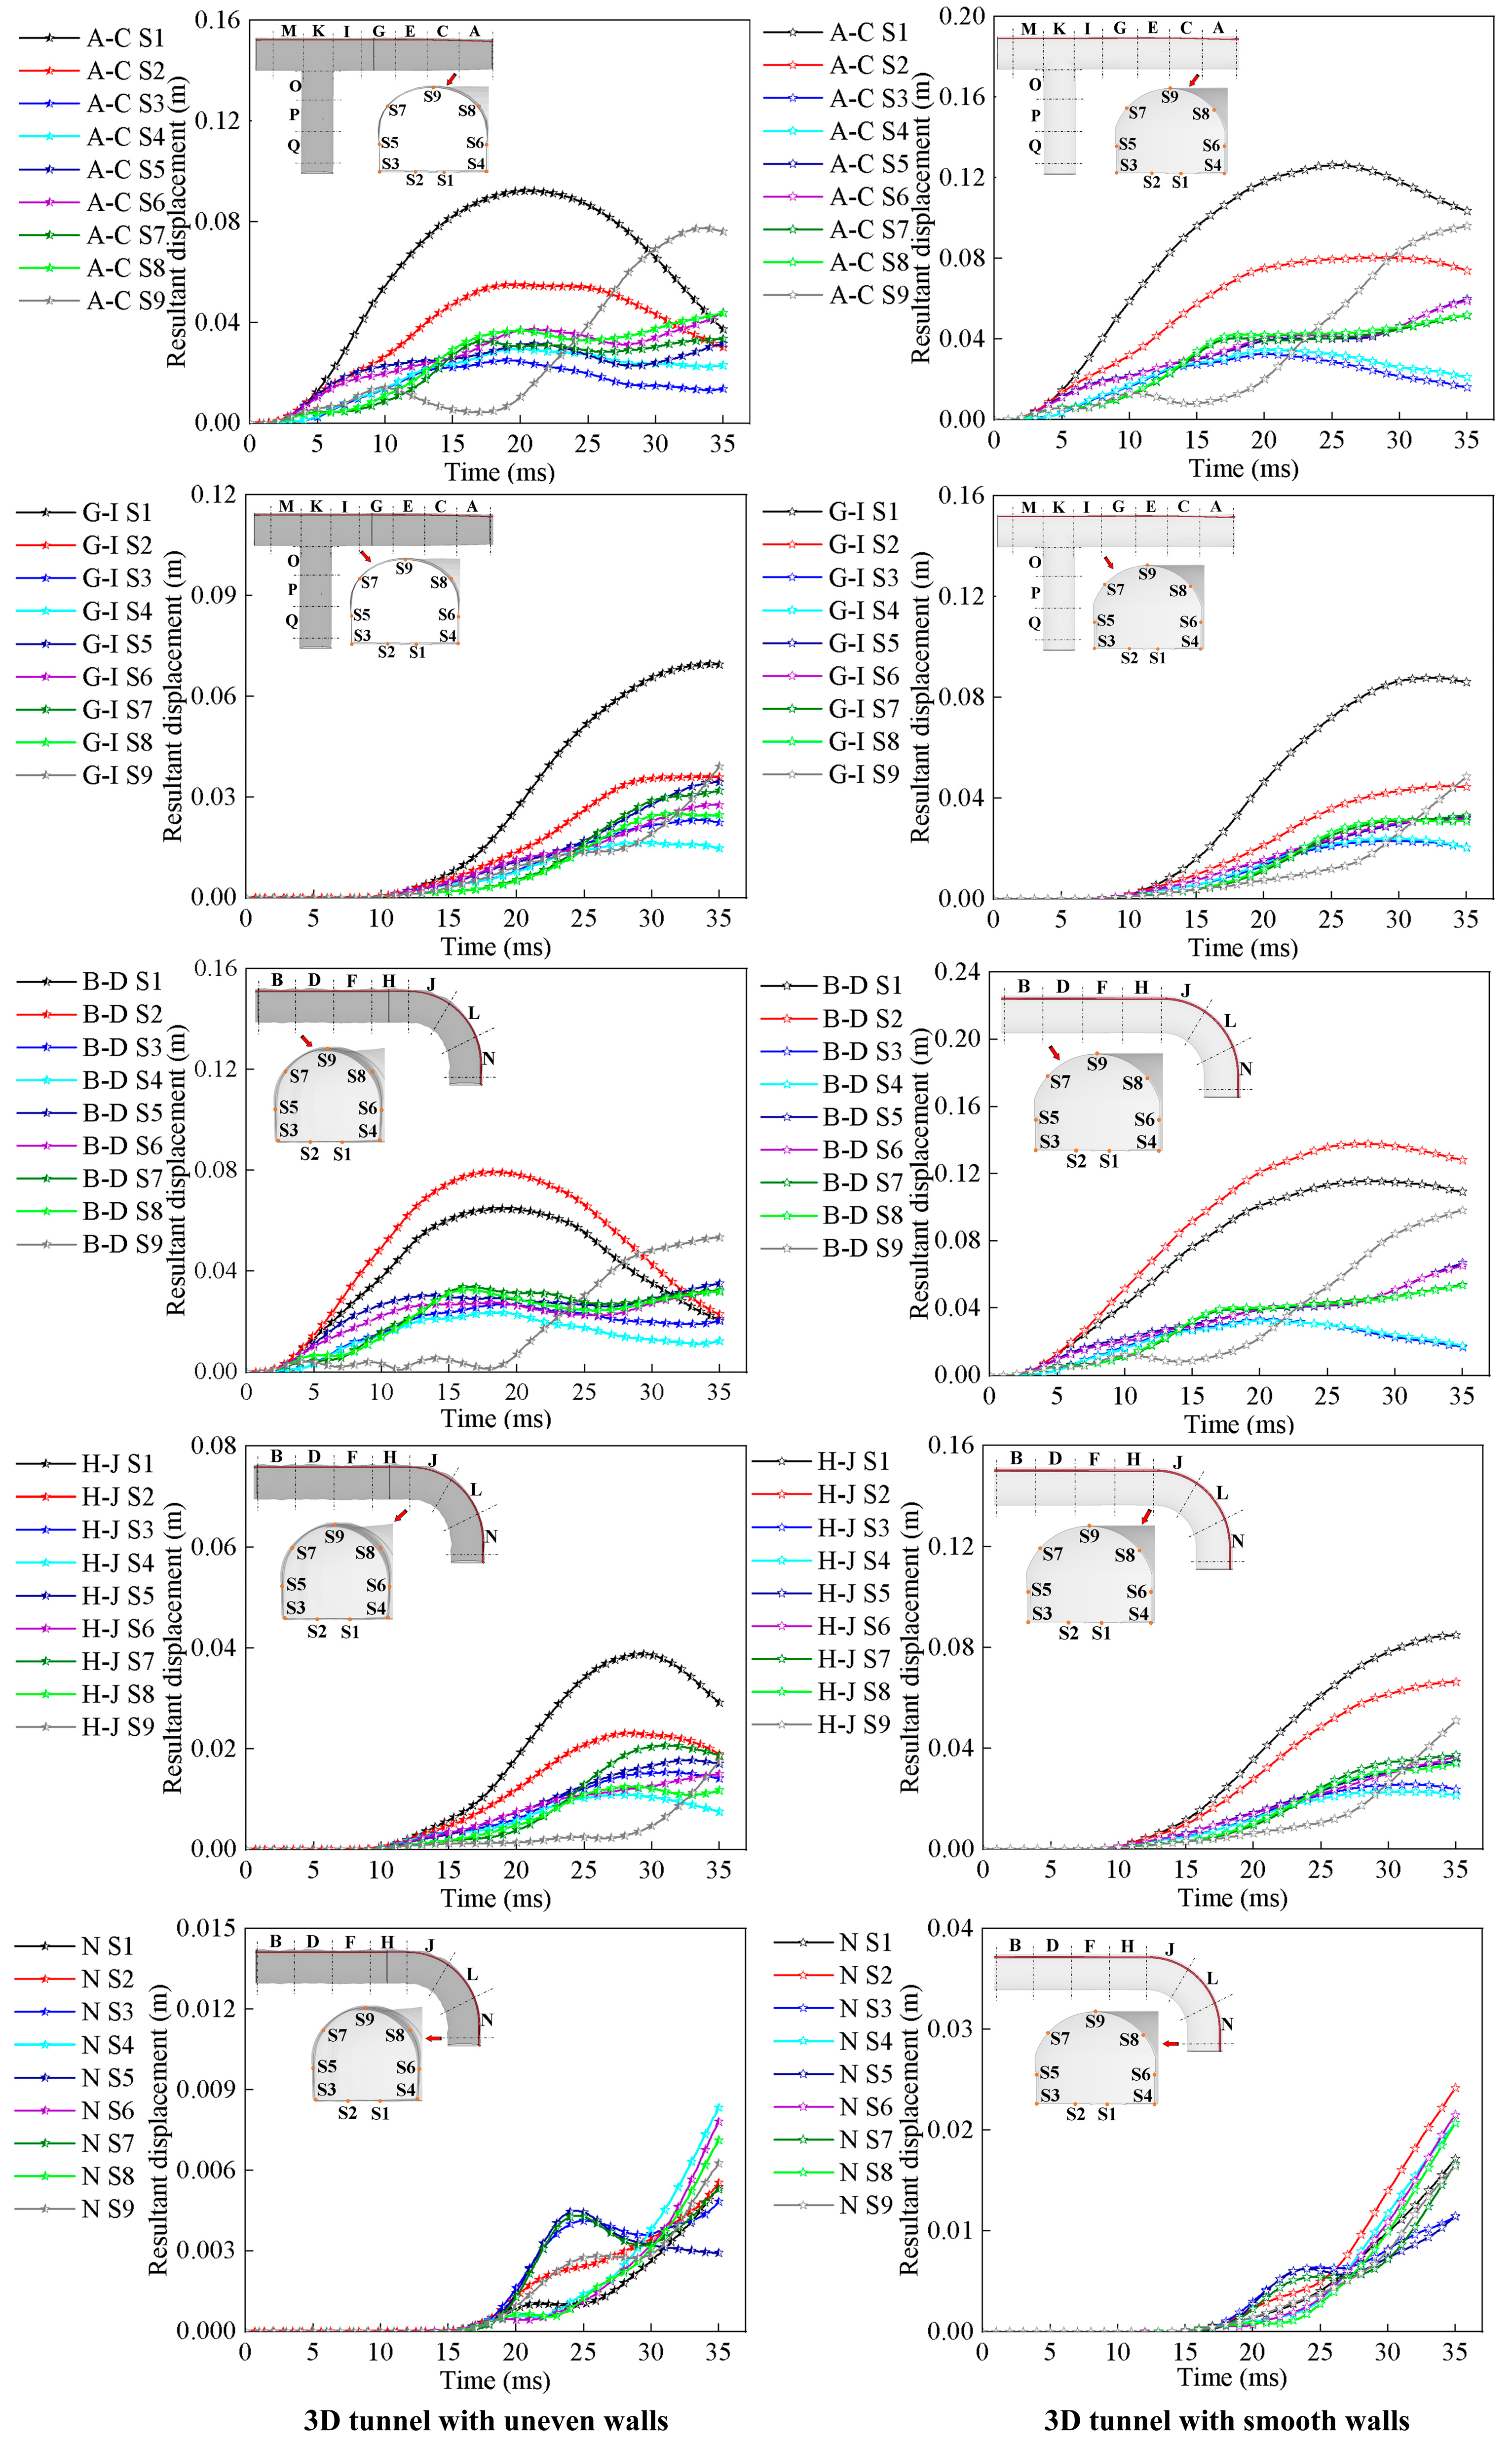
Figure 15 shows the displacement curves of the S1–S9 measuring points at the sections A–C, B–D, G–I, H–J, and N in the approximate real tunnel model (left-hand side of Figure 13) and the smooth wall tunnel model (right-hand side of Figure 13). In each section of the two tunnel models, except for the N section of the bend, the points with higher displacement are always S1 and S2 at the bottom of the tunnel and S9 at the top of the tunnel whereas S3 and S4 at the corner of the tunnel have the lowest displacement.
The results of the previous analysis show that the duration of high load on the wall of the approximate real tunnel is lower than that of the tunnel with smooth walls, resulting in the lower displacement of each monitoring point on each section of the approximate real tunnel than in the tunnel with smooth walls in general. The maximum displacement values of monitoring points A–C S1 and G–I S1 are 26.9% and 20.7% lower than in the tunnel with smooth walls, respectively whereas the displacement values of most monitoring points on the right tunnel section are less than half of those in the tunnel with smooth walls. Overall, the maximum deformation displacement of the approximate real tunnel does not exceed 0.1m, and as the shock wave energy decays, most of the deformation of the tunnel gradually recovers. Therefore, the approximate real tunnel will not lose stability as a result of gas explosion.

5. Conclusions

In this study, a high-precision CESE solver and immersion boundary layer algorithm (IBM) were used for the first time to couple tunnel structures and methane explosions. The gas deflagration process and wall dynamic response in the approximate real tunnel model and smooth wall tunnel model were studied, and the following conclusions were drawn:
(1)
The highest mass fraction of intermediates CH3 and CH2O produced by methane deflagration is much lower than the final product CO2, and they are almost simultaneously depleted after the complete consumption of methane. At a distance of 1.5 m from the ignition point, the maximum mass fraction of intermediate product CO reaches 4.77%, but CO gas is consumed in large quantities prior to diffusion. At a distance of 1.5–10.5 m from the ignition point, the CO2 mass fraction reaches 1.29–12.11%.
(2)
The uneven walls of a tunnel that are approximately real cause changes in the distribution of shock wave overpressure. On straight tunnels, the distribution of shock wave overpressure is asymmetric, with the red high-pressure zone leaning to the right. Meanwhile, the severely uneven tunnel walls decrease the propagation speed and overpressure of the shock wave. Compared with the tunnels with smooth walls, the peak overpressure reduction value of the shock wave reaches 81.91 kPa, and the time when the shock wave overpressure reaches its peak is extended by a maximum of 7.4 ms.
(3)
The development and diffusion processes of stress loads are close to synchronization with the propagation of shock waves. The propagation speed of stress waves in the bend of the approximate real tunnel is slower than that in the smooth wall tunnel model. Except in the bend tunnel, the positions and ranges of the green stress zone and the red stress concentration zone in the two tunnel models are the same. Compared with smooth-walled tunnels, the stress distribution in the approximate real tunnel is discontinuous, and the transition zone between the green stress zone and the blue unloading zone is serrated, with a shorter duration of high loads.
(4)
The approximate real tunnel will not lose stability as a result of gas explosion. The displacement of the approximate real tunnel after gas explosion is lower than that in tunnels with smooth walls, and the area of plastic deformation zone is small. The wall displacement of the left tunnel is, at most, 26.9% lower than that of the smooth tunnel. The displacement values of most monitoring points on the right tunnel section are less than half of those in the tunnel with smooth walls.
These findings prove that the depressions and protrusions on the wall surfaces of underground coal mine tunnels cannot be ignored.

Author Contributions

Conceptualization, J.D.; methodology, J.D.; software, J.D. and X.H.; validation, X.H.; investigation, F.W.; data curation, L.Z.; writing—original draft preparation, L.Z.; writing—review and editing, J.C.; visualization, F.W.; supervision, L.G. All authors have read and agreed to the published version of the manuscript.

Funding

This work was financially supported by the National Natural Science Foundation of China—General Project (52274202), Central Guidance for Local Development Funding Projects (226Z4601G), Natural Science Foundation of Hebei (E2022209051), 2023 Scholarship Program for Introducing Overseas Students (C20230359), Higher Education Youth Top Talent Project of Hebei (BJK2023086), Youth Talent Promotion Program of North China University of Science and Technology (28438101), and Key Scientific Research Project of North China University of Science and Technology (ZD-ST-202313-23).

Institutional Review Board Statement

Not applicable.

Informed Consent Statement

Not applicable.

Data Availability Statement

Data are contained within the article.

Conflicts of Interest

The authors declare no conflicts of interest.

References

  1. Wang, G.; Wang, R.; Wu, M.M.; Fan, C.; Song, X. Strength criterion effect of the translator and destabilization model of gas-bearing coal seam. Int. J. Min. Sci. Technol. 2019, 29, 327–333. [Google Scholar] [CrossRef]
  2. Chen, J.; Cheng, W.; Wang, G.; Li, H.; Li, Y. New method of monitoring the transmission range of coal seam water injection and correcting the monitoring results. Measurement 2021, 177, 109334. [Google Scholar] [CrossRef]
  3. Wang, G.; Qin, X.; Zhou, J.; Han, F.; Cai, J. Simulation of coal microstructure characteristics under temperature-pressure coupling based on micro-computer tomography. J. Nat. Gas. Sci. Eng. 2021, 91, 103906. [Google Scholar] [CrossRef]
  4. Wang, Y.; Fu, G.; Lyu, Q.; Li, X.; Chen, Y.; Wu, Y.; Xie, X. Modelling and analysis of unsafe acts in coal mine gas explosion accidents based on network theory. Process Saf. Environ. Prot. 2023, 170, 28–44. [Google Scholar] [CrossRef]
  5. Xiao, G.Q.; Wang, S.; Mi, H.F.; Khan, F.; Yu, M.G. Analysis of obstacle shape on gas explosion characteristics. Process Saf. Environ. Prot. 2022, 161, 78–87. [Google Scholar] [CrossRef]
  6. Hou, Z.H.; Wang, D.M.; Zhang, W.; Luo, S.Y.; Lu, Y.S.; Tian, S.Y.; Zhou, Q.; Xu, Z.M. Study on the influence of ignition position on the explosion characteristics of methane-air premix in a semi-closed pipeline. Process Saf. Environ. Prot. 2023, 172, 642–651. [Google Scholar] [CrossRef]
  7. Meng, Q.; Wu, C.; Li, J.; Wu, P.; Xu, S.; Wang, Z. A study of pressure characteristics of methane explosion in a 20 m buried tunnel and influence on structural behaviour of concrete elements. Eng. Fail. Anal. 2021, 122, 105273. [Google Scholar] [CrossRef]
  8. Zhu, Y.; Wang, D.; Shao, Z.; Zhu, X.; Xu, C.; Zhang, Y. Investigation on the overpressure of methane-air mixture gas explosions in straight large-scale tunnels. Process Saf. Environ. Prot. 2020, 135, 101–112. [Google Scholar] [CrossRef]
  9. Zhang, X.B.; Shen, S.S.; Yang, M.; Wang, H.; Ren, J.Z.; Lu, F.C. Influence of length and angle of bifurcated tunnel on shock wave propagation. J. Loss Prev. Process Ind. 2022, 78, 104802. [Google Scholar] [CrossRef]
  10. Gao, K.; Li, S.N.; Han, R.; Li, R.Z.; Liu, Z.M.; Qi, Z.P.; Liu, Z.Y. Study on the propagation law of gas explosion in the space based on the goaf characteristic of coal mine. Saf. Sci. 2020, 127, 104693. [Google Scholar] [CrossRef]
  11. Liu, W.; Mu, C.; Li, Z. Influence of cavity structure on gas explosion characteristics in coal mine. Powder Technol. 2022, 398, 117084. [Google Scholar] [CrossRef]
  12. Ma, Q.J.; Guo, Y.H.; Zhong, M.Y.; Ya, H.; You, J.F.; Chen, J.H.; Zhang, Z.K. Numerical simulation of hydrogen explosion characteristics and disaster effects of hydrogen fueling station. Int. J. Hydrogen Energy 2023, 51, 861–879. [Google Scholar] [CrossRef]
  13. Du, Y.; Ma, L.; Zheng, J.; Zhang, F.; Zhang, A. Coupled simulation of explosion-driven fracture of cylindrical shell using SPH-FEM method. Int. J. Press. Vessel. Pip. 2016, 139–140, 28–35. [Google Scholar] [CrossRef]
  14. Valsamos, G.; Casadei, F.; Solomos, G.; Larcher, M. Risk assessment of blast events in a transport infrastructure by fluid-structure interaction analysis. Saf. Sci. 2019, 118, 887–897. [Google Scholar] [CrossRef]
  15. Gu, Y.; Wang, J.; Li, H.; Tang, K.; Liu, L. Formation characteristics and penetration performance of an underwater shaped charge jet. Ocean Eng. 2022, 258, 111695. [Google Scholar] [CrossRef]
  16. Jiang, X.; Xue, Y.; Kong, F.; Gong, H.; Fu, Y.; Zhang, W. Dynamic responses and damage mechanism of rock with discontinuity subjected to confining stresses and blasting loads. Int. J. Impact Eng. 2023, 172, 104404. [Google Scholar] [CrossRef]
  17. Guo, Y.; He, L.; Wang, D.; Liu, S. Numerical investigation of surface conduit parallel gas pipeline explosive based on the TNT equivalent weight method. J. Loss Prev. Process Ind. 2016, 44, 360–368. [Google Scholar] [CrossRef]
  18. Xue, Y.; Chen, G.; Zhang, Q.; Xie, M.; Ma, J. Simulation of the dynamic response of an urban utility tunnel under a natural gas explosion. Tunn. Undergr. Space Technol. 2020, 108, 103713. [Google Scholar] [CrossRef]
  19. Zhu, L.Q.; Du, J.Q.; Chen, J.; Guo, L.W.; Wang, F.S. Dust raising law of gas explosion in a 3D reconstruction real tunnel: Based on ALE-DEM model. Powder Technol. 2024, 434, 119224. [Google Scholar] [CrossRef]
  20. Sochet, I.; Sauvan, P.E.; Boulanger, R.; Nozeres, F. External explosion in an industrial site. J. Loss Prev. Process Ind. 2014, 29, 56–64. [Google Scholar] [CrossRef]
  21. Jiang, H.; Chi, M.; Hou, D.; Ding, H.; Xie, Z.; Zeng, X. Numerical investigation and analysis of indoor gas explosion: A case study of “6·13” major gas explosion accident in Hubei Province, China. J. Loss Prev. Process Ind. 2023, 83, 105045. [Google Scholar] [CrossRef]
  22. Du, Y.; Zhou, F.; Ma, L.; Zheng, J.; Xu, C.; Chen, G. Consequence analysis of premixed flammable gas explosion occurring in pipe using a coupled fluid-structure-fracture approach. J. Loss Prev. Process Ind. 2019, 57, 81–93. [Google Scholar] [CrossRef]
  23. Yang, S.; Sun, W.; Fang, Q.; Yang, Y.; Xia, C.; Bao, Q. Investigation of practical load model for a natural gas explosion in an unconfined space. J. Saf. Sci. Resil. 2022, 3, 209–221. [Google Scholar] [CrossRef]
  24. Zhu, Y.; Wang, D.; Shao, Z.; Xu, C.; Li, M.; Zhang, Y. Characteristics of methane-air explosions in large-scale tunnels with different structures. Tunn. Undergr. Space Technol. 2021, 109, 103767. [Google Scholar] [CrossRef]
  25. Pang, L.; Zhang, Q.; Wang, T.; Lin, D.C.; Cheng, L. Influence of laneway support spacing on methane/air explosion shock wave. Saf. Sci. 2012, 50, 83–89. [Google Scholar] [CrossRef]
  26. Gao, K.; Liu, Z.; Wu, C.; Li, J.; Liu, K.; Liu, Y.; Li, S. Effect of low gas concentration in underground return tunnels on characteristics of gas explosions. Process Saf. Environ. Prot. 2021, 152, 679–691. [Google Scholar] [CrossRef]
  27. Zhang, B.; Zhao, W.; Wan, W.; Zhang, X. Pressure characteristics and dynamic response of coal mine refuge chamber with underground gas explosion. J. Loss Prev. Process Ind. 2014, 30, 37–46. [Google Scholar] [CrossRef]
  28. Chang, S.-C. The method of space-time conservation element and solution element—A new approach for solving the Navier-Stokes and Euler equations. J. Comput. Phys. 1995, 119, 295–324. [Google Scholar] [CrossRef]
  29. Rokhy, H.; Soury, H. Fluid structure interaction with a finite rate chemistry model for simulation of gaseous detonation metal-forming. Int. J. Hydrogen Energy 2019, 44, 23289–23302. [Google Scholar] [CrossRef]
  30. Haghgoo, M.; Babaei, H.; Mostofi, T.M. 3D numerical investigation of the detonation wave propagation influence on the triangular plate deformation using finite rate chemistry model of LS-DYNA CESE method. Int. J. Impact Eng. 2022, 161, 104108. [Google Scholar] [CrossRef]
  31. Haghgoo, M.; Babaei, H.; Mostofi, T.M. Numerical simulation of the influence of confined multi-point ignited H2–O2 mixture on the propagation of shock waves towards a deformable plate. Int. J. Hydrogen Energy 2022, 47, 27080–27095. [Google Scholar] [CrossRef]
  32. Rokhy, H.; Mostofi, T.M. Tracking the explosion characteristics of the hydrogen-air mixture near a concrete barrier wall using CESE IBM FSI solver in LS-DYNA incorporating the reduced chemical kinetic model. Int. J. Impact Eng. 2023, 172, 104401. [Google Scholar] [CrossRef]
  33. Im, K.-S.; Joh, S.-T.; Kim, C.-K.; Chang, S.-C.; Jorgenson, C. Application of the CESE method to detonation with realistic finite-rate chemistry. In Proceedings of the 40th AIAA Aerospace Sciences Meeting & Exhibit, Reno, NV, USA, 14–17 January 2002; p. 1020. [Google Scholar] [CrossRef]
  34. Kee, R.J.; Rupley, F.M.; Miller, J.A. Chemkin-II: A Fortran Chemical Kinetics Package for the Analysis of Gas-Phase Chemical Kinetics; Sandia National Laboratories: Livermore, CA, USA, 1989. [Google Scholar] [CrossRef]
  35. Miller, J.A.; Kee, R.J.; Westbrook, C.K. Chemical Kinetics and Combustion Modeling. Annu. Rev. Phys. Chem. 1993, 41, 345–387. [Google Scholar] [CrossRef]
  36. Liu, H.; Chen, F.; Liu, H.; Zheng, Z.H.; Yang, S.H. 18-Step Reduced Mechanism for Methane/Air Premixed Supersonic Combustion. J. Combust. Sci. Technol. 2012, 18, 467–472. [Google Scholar]
  37. Wei, Y.; Li, X.; Che, X. Study on the effect of combustion efficiency of variable thrust rocket engines. J. Phys. Conf. Ser. 2023, 2551, 012025. [Google Scholar] [CrossRef]
  38. Lu, H.; Liu, F.; Wang, Y.; Fan, X.; Yang, J.; Liu, C.; Xu, G. Mechanism reduction and bunsen burner flame verification of methane. Energies 2018, 12, 97. [Google Scholar] [CrossRef]
  39. Gan, L.; Zong, Z.; Lin, J.; Chen, Y.; Xia, M.; Chen, L. Influence of U-shaped stiffeners on the blast-resistance performance of steel plates. J. Constr. Steel Res. 2022, 188, 107046. [Google Scholar] [CrossRef]
  40. Liu, F.; Silva, J.; Yang, S.; Lv, H.; Zhang, J. Influence of explosives distribution on coal fragmentation in top-coal caving mining. Geomech. Eng. 2019, 18, 111. [Google Scholar] [CrossRef]
  41. Qu, Z. Numerical study on shock wave propagation with obstacles during methane explosion. Appl. Mech. Mater. 2010, 33, 114–118. [Google Scholar] [CrossRef]
  42. Wang, S.; Li, Z.; Fang, Q.; Yan, H.; Liu, Y. Numerical simulation of overpressure loads generated by gas explosions in utility tunnels. Process Saf. Environ. Prot. 2022, 161, 100–117. [Google Scholar] [CrossRef]
Figure 1. Coupling mechanism between the chemical solver of CESE and structure.
Applsci 14 02372 g001
Figure 2. Verification of different gas explosion models based on experimental data.
Applsci 14 02372 g002
Figure 3. Model 1: approximate real tunnel model with uneven tunnel walls.
Applsci 14 02372 g003
Figure 4. Model 2: tunnel model with smooth walls.
Applsci 14 02372 g004
Figure 5. Mesh division of the finite-element numerical model.
Applsci 14 02372 g005
Figure 6. Numerical model boundary conditions and monitoring locations.
Applsci 14 02372 g006
Figure 7. Methane deflagration reaction.
Applsci 14 02372 g007
Figure 8. CO and CO2 concentration time-variation curves at different positions after methane explosion.
Applsci 14 02372 g008
Figure 9. Propagation process of shock waves in approximate real tunnel and smooth wall tunnel.
Applsci 14 02372 g009
Figure 10. Overpressure time curve of monitoring points P1−P17 in approximate real tunnel and smooth wall tunnel.
Applsci 14 02372 g010
Figure 11. Stress distribution characteristics in the approximate real tunnel and smooth wall tunnel.
Applsci 14 02372 g011
Figure 12. Stress time curves of S1–S9 monitoring points in approximate real tunnel and smooth wall tunnel.
Applsci 14 02372 g012
Figure 13. Stress distribution in tunnel cross-section.
Applsci 14 02372 g013
Figure 14. Final deformation situation in approximate real tunnel and smooth wall tunnel.
Applsci 14 02372 g014
Figure 15. Displacement time curve of S1–S9 monitoring points in approximate real tunnel and smooth wall tunnel.
Applsci 14 02372 g015
Table 1. Material parameters of coal and steel.
Materialρ/kg·m−3E/GPaμσy/MPaEtan/GPaC/s−1PΒFs
Tunnel surface18602.610.3012.30.25--0.50.8
Steel pipe78502000.3347375.1968443.9110.25
Disclaimer/Publisher’s Note: The statements, opinions and data contained in all publications are solely those of the individual author(s) and contributor(s) and not of MDPI and/or the editor(s). MDPI and/or the editor(s) disclaim responsibility for any injury to people or property resulting from any ideas, methods, instructions or products referred to in the content.