Abstract
Tensiomyography (TMG) has been described as an effective method for identifying differences in muscle response to athletic training stimuli. However, there is a lack of studies that evaluated changes in muscle contractile properties in response to anaerobic effort and related these changes to Wingate test parameters in more than one lower limb superficial muscle. The main contribution of this work is to evaluate changes in the contractile properties of muscles in response to anaerobic exercise. In a group of 20 physically active men, the body composition analysis was performed using a Tanita DC-360 device. The anaerobic effort was assessed by a Wingate test (30 s), and the contractile properties of muscles were measured using a TMG S2 device. The TMG parameters were measured in selected superficial muscles of the dominant lower limb. The study also calculated indices of the differences (d) and the size of the effect (r). An anaerobic effort in the form of the Wingate test resulted in greater stiffness (Dm) in the vastus lateralis muscle (p = 0.0365; r = 0.47) and a delayed response to stimulus (Td) in the vastus lateralis (p = 0.0239; r = 0.51) and vastus medialis (p = 0.0031; r = 0.66) muscles. The half relaxation time (Tr) (p = 0.0478; r = 0.44) and sustained contraction time (Ts) (p = 0.0276; r = 0.49) in the rectus femoris muscle were also increased. In contrast, a prolonged stimulus-response time (Td) with a decrease in sustained contraction time (Ts) was observed in the gastrocnemius lateralis (Td: p = 0.0054; r = 0.64 and Ts: p = 0.0012; r = 0.74) and gastrocnemius medialis (Td: p = 0.0229; r = 0.52 and Ts: p = 0.0054; r = 0.64) muscles. A significant decrease in contraction time (Tc) (p = 0.0051; r = 0.63) occurred only in the soleus muscle. In addition, significant correlations were shown between selected changes in contractile properties of muscle and parameters of the Wingate anaerobic test. Anaerobic exercise has a significant effect on changes in skeletal muscle contractility parameters. TMG is an effective method for identifying differences in muscle response to sports training stimuli.
1. Introduction
Tensiomyography (TMG) is a method for assessing muscle mechanical response, relying on the radial displacement of the muscle belly following a single electrical stimulus [1,2]. TMG does not require the subject to exert physical effort, making it a noninvasive and practical method [3,4]. Recordings of displacement–time curves enable the assessment of muscle contractile properties [5]. The parameters measured by the TMG are: radial muscle displacement (Dm), contraction time (Tc), delay time (Td) (also known as reaction or activation time [6]), sustained contraction time (Ts), and half relaxation time (Tr). Dm represents the absolute spatial transverse deformation of the muscle while Tc is measured as the time on an ascending curve between 10 and 90 percent of Dm. The parameter Td is the time between the delivery of the electrical stimulus and 10% Dm, while Tr is the time between 90% Dm and 50% Dm on a descending curve. The parameter Ts is measured as the time between 50% Dm on each side of the curve [6,7]. The high reliability was confirmed for the parameters Tc, Dm, and Td, while parameters Ts and Tr reported poorer reliability and should be further investigated [2,7]. Within the literature, the Tc parameter has been associated with the rate of force generation [3]; however, some studies [4,8,9] have shown that Tc is also associated with the ratio of slow-twitch fibers. For example, Simunic et al. [4] found a significant positive correlation among Td, Tc, and Tr and myosin heavy chain I (%MHC-I) in the vastus lateralis muscle. Futuremore, the Dm parameter is associated with the stiffness of the muscle belly, muscle mass, and muscle architecture [10,11], while the Td parameter is associated with the conduction velocity of muscle fibers [3,12]. In addition, the parameters Ts and Tr provide a theoretical evaluation of the fatigue status of muscle [5,13].
TMG has been succesfuly used in sports enviroments [2,14,15,16,17,18,19,20,21]. Researchers have applied this method in a group of male soccer players [17] and showed that the TMG parameters distinguish the the dominant side from the non-dominant side. Also of interest are the findings of the study by Simola et al. [19], which showed that the TMG has been an effective tool in discerning between elite power and aerobic endurance athletes, with the latter demonstrating elevated Tc and Dm values. Additionally, Giovanelli et al. [22] found that an uphill marathon resulted in a reduction in Tc and an elevation in Dm in the vastus lateralis muscle. Moreover, Sanchez et al. [23] assessed how the contractile properties of muscles in elite futsal players were affected by a repeated sprint ability (RSA) test. The authors showed that the RSA test generated alterations in the contractile properties of the rectus femoris and biceps femoris. Furthermore, correlations were identified between the decline in performance during the RSA test and certain parameters measured by tensiomyography. On the other hand, a study by García-García et al. [1] examined the predictive ability of TMG parameters on peak power output during the incremental cycling test in elite cyclists. The authors demonstrated that parameters acquired via TMG could be valuable in evaluating cyclist performance throughout the season, augmenting the conventional incremental performance test to exhaustion.
The effort analyzed in this study was an anaerobic exercise in the form of a Wingate test. To our knowledge, there are two studies [15,24] that combine TMG with that form of anaerobic effort. Firstly, Venezuela et al. [15] assessed the relationship between the peak power output (PPO) production capacity in the Wingate test and TMG parameters measured before anaerobic exercise in a women’s Olympic Rugby Sevens Team. The athletes were examined during the preseason training and their levels of peak power output were homogeneous. The study unveiled a pronounced correlation between the contractile characteristics of the vastus lateralis muscle and the power generation capabilities observed in female rugby athletes.
Secondly, Kalc et al. [24] aimed to explore the diagnostic precision of TMG parameters assessed pre- and post-anaerobic exercise in the vastus lateralis muscle of the right leg. Their objective was to identify individual alterations following the maintenance of 25% of maximal voluntary contraction (MViC25%) and after a 30 s Wingate test, respectively. The research was conducted on a group of young, recreationally trained, healthy males. The study showed that TMG parameters exhibited satisfactory diagnostic effectiveness (DE > 0.70) in identifying significant muscular changes immediately following both fatigue-inducing protocols.
However, we were unable to find any study that connected changes in TMG parameters with Wingate test parameters in more than one muscle. Therefore, the aim of this study was (1) to evaluate changes in muscle contractile properties in response to anaerobic exercise (2) to assess the correlation between alterations in TMG parameters and the parameters of the Wingate test.
The findings from this study would enhance comprehension of the impact of anaerobic exercise on the muscular response of physically active men. Moreover, our study evaluates the superficial muscle, and significant differences in the contractile parameters of the muscle before and after anaerobic exercise are assumed. In light of the above, this study may lead to the development of more effective training strategies tailored to individual athletes’ needs and serve as a reference basis for future research. This knowledge may be particularly important in sports that are characterized by episodes of short-term, intense muscular activity, such as sprinting, soccer, or basketball.
2. Materials and Methods
The study was conducted in the Diagnostics Laboratory for Sport and Health Training of the University of Rzeszow. The examined group consisted of 20 physically active men. The G*Power 3.1.9.2 software [25] was used to estimate the optimal sample size, according to the a priori Mann–Whitney test, a total of 20 participants were required to detect an interaction effect size of 0.86 at the 0.05 significance level.
The inclusion criteria to participate in this study were the following: (1) no medical contraindications for anaerobic exercise; (2) do not perform any exhaustive activities 48 h before the tests; and (3) be physically active, i.e., do physical activity at least three times per week. Each participant voluntarily entered the study. All procedures were approved by the Ethics Committee of the University of Rzeszow (No 3/11/2017). The investigation was conducted following the Declaration of Helsinki, and informed consent was obtained from all participants.
The data concerning age, height, body mass, and body composition of the 20 participants are displayed in Table 1. The participants were aged 22.90 ± 1.44 years, had a height of 176.25 ± 6.68 cm, body mass of 74.86 ± 6.68 kg, and BMI of 24.07 ± 3.03 kg/m2. The highest coefficient of variation was found in the parameter of body fat content (49.26%).

Table 1.
Characteristics of the study group (N = 20).
2.1. Experimental Approach
The participants were all evaluated in the Diagnostics Laboratory for Sport and Health Training of the University of Rzeszow. All participants were briefed on the testing procedures, and signed a written informed consent. The experimental approach commenced with the measurement of body composition using bioelectrical impedance analysis (BIA). Following this, the positions of the electrodes and the TMG sensor were marked using a dermatological marker. Subsequently, the assessment of muscle contractility properties was performed using a TMG S2 device (TMG-BMC d.o.o., Ljubljana, Slovenia). Next, a 30 s Wingate test was conducted on a Cyclus 2 ergometer (Avantronic, Cyclus 2, Leipzig, Germany), preceded by an appropriate warm-up. Immediately after the anaerobic test, TMG parameters were measured again, ensuring consistent muscle order and electrode placement. Selected parameters obtained during the measurements were utilized for analysis. The graphic scheme illustrating the research procedures has been presented in Figure 1.
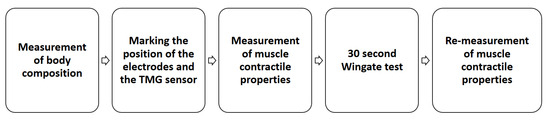
Figure 1.
Research procedures—scheme.
2.2. Procedures
The body height was measured using a stadiometer and the body composition analysis was performed using a Tanita DC-360 device (Tanita Corporation, Tokyo, Japan). To ensure the accuracy of the measurements, it was ensured that the arms did not touch the torso, the shoulders were straight down, and the inner sides of the thighs were not in contact with each other.
The muscle’s contractile properties were assessed by tensiomyography using a TMG S2 device and TMG 3.6 software (TMG-BMC d.o.o., Ljubljana, Slovenia). The TMG parameters were measured in the superficial muscles of the dominant lower limb (in all subjects this was the right limb), in the present order: rectus femoris (RF), vastus medialis (VM), vastus lateralis (VL), soleus (SO), gluteus maximus (GT), gastrocnemius medialis (GM), and gastrocnemius lateralis (GL). The order of muscles during TMG assessments was kept constant before and after the Wingate test.
The location of the sensor was determined anatomically by palpation during voluntary contraction. The sensor was aligned perpendicular to the belly muscle’s thickest part halfway between the electrodes. The electrode and sensor positions were marked with a dermatological pen to ensure consistent measurement locations in consecutive assessments. Self-adhesive electrodes (5 × 5 cm, UltraStim X, Axelgaard Manufacturing Co., Ltd., CA, USA) were placed at a distance of 2.5 cm from the sensor on both sides. The test was performed on the subject under static. The muscles rectus femoris, vastus medialis, and vastus lateralis were measured with the participant in the supine position, and the muscles gluteus maximus, gastrocnemius medialis, gastrocnemius lateralis, and soleus were measured with the participant in the prone position. No immobilization of the limb was used during the study. The proper angle of the knee joint was upheld with a triangular foam pad and a semi-circular foam cushion. The extensor muscles of the knee joint were assessed with the knee joint positioned at 120°, while the flexor muscles were evaluated with the knee joint set at 150°. A single rectangular monophasic pulse 1.0 ms in width, was applied. The signal magnitude began at 30 mA and was raised by 10 mA increments until Dm reached a ‘plateau’. A 15-s rest period between stimulations was used to minimize the effect of fatigue. All measurements were conducted by the same skilled examiner. The curve exhibiting the greatest maximum radial displacement was selected for analysis for each assessed muscle. The collected parameters measured by the TMG method were as follows: radial muscle displacement (Dm), contraction time (Tc), deceleration time (Td), sustained contraction time (Ts), and half relaxation time (Tr). The focus was on the parameters Tc and Dm; they are the most frequently studied muscle contractile properties due to their reliability and validity [7].
The anaerobic test was the 30 s Wingate test, performed on a Cyclus 2-cycle ergometer. The test was preceded by a 5 min warm-up on the ergometer with a resistance of 2.1% of total body mass, where participants completed three 5 s sprints at minutes 2–3 and 4 with a resistance equal to 4.1% of total body mass. To eliminate the possibility of fatigue, the warm-up was followed by a rest period of 3 min. Rest was followed by the actual part of the test. The test subject initiated pedaling at 60 revolutions per minute (rpm) for approximately 10 s without any resistance. Then the “3-2-1-Start!” was counted down and the test resistance changed to that calculated from the formula 0.075 kg-kg−1 [26]. The subject’s goal was to achieve the highest possible pedal frequency in the shortest possible time and to maintain it throughout the 30 s test. A verbal encouragement was used during the test and the last 3 s were counted down. The collected parameters in the Wingate test were as follows: (PPO)—peak power output, i.e., the greatest power output during a 5 s period of the test; (tPPO)—time to peak power, i.e., the time needed to reach peak power (W); (AP)—anaerobic power, i.e., the peak power divided by the subject’s body mass (W/kg); (AC)—anaerobic capacity, i.e., the mean power divided by the subject’s body mass (W/kg); (FI)—fatigue index, i.e., the percent decrease in power output from the beginning of the test to the end of the test (%); (Vmax)—maximal velocity, i.e., the highest level of velocity reached during the test (km/h) [26,27].
2.3. Statistical Methods
The data obtained were statistically analyzed using Statistica 13 software. Arithmetic mean, median, quartile 1, quartile 3, standard deviation, and coefficient of variation were determined. The normality of the distributions was verified using the Shapiro–Wilk test. All the variables studied do not have a normal distribution. The Wilcoxon test for paired data was used to evaluate changes between the first and second measurements. The effect size for the Wilcoxon test was determined using the following formula: , where Z—test value, N—total number of subjects [28]. The analysis of the relationships between increments and Wingate parameters was carried out using the Spearman correlation coefficient [29]. The correlation ratio was interpreted using the following criteria: ( = 0)—none; ()—poor; ()—fair; ()—moderate; ()—very strong; ()—perfect. Changes between measurements were calculated from the formula: d = , where —mean value.
3. Results
Table 2 illustrates the outcomes of the Wingate test conducted. According to the study, the test subjects achieved an average maximum pedal speed of 79.82 ± 6.19 (km/h) while generating a peak power of 848.37 ± 132.42 (W).
Table 2.
Characteristics of the Wingate parameters (N = 20).
The numerical characteristics of the TMG parameters obtained before and immediately after anaerobic exercise are presented together with their statistics in Table 3. Significant statistical changes were observed among individual TMG parameters in the values obtained before and immediately after anaerobic exercise in the following muscles: gastrocnemius lateralis, gastrocnemius medialis, rectus femoris, soleus, vastus lateralis, and vastus medialis. A significant decrease in Tc (p = 0.0051; r = 0.63) was observed in the soleus muscle, where the value of this parameter differed from the pre-exercise value by 25.93% (−8.88 ms). In contrast, the values of the parameter Ts after anaerobic exercise took significantly lower values in the gastrocnemius lateralis (p = 0.0012; r = 0.74) and gastrocnemius medialis (p = 0.0054; r = 0.64) muscles, where the difference between the measurement values was −42.26 ms and −44.47 ms, respectively. Only in the rectus femoris muscle was a significantly higher (p = 0.0276; r = 0.49) value of the Ts parameter observed, differing from the baseline value by 16.31 ms (Table 3). The parameter Tr was significantly different (p = 0.478; r = 0.44) in the rectus femoris muscle, where its value after anaerobic exercise increased by 39.23%. A statistically significant decrease in the parameter Dm was recorded in the vastus lateralis muscle (p = 0.0365; r = 0.47) in which the radial muscle belly displacement decreased by −0.35 mm. The parameter Td reached significantly higher post-exercise values in almost all muscles, with the highest statistically significant difference observed in the vastus medialis muscle (p = 0.0031; r = 0.66), where the delay time increased by 1.21 ms (Table 3).
Table 3.
Characteristics of the tensiomyography (TMG) parameters before and after anaerobic exercise (N = 20).
The next step of the analysis was to analyze the correlation between Wingate test parameters and changes in TMG parameters, which is shown in Table 4. Statistically significant correlations were noted in five out of seven tested muscles. The gastrocnemius medialis muscle was characterized by the largest number of correlations, with 5 negative correlations at the moderate level and one at the strong level (Table 4). The correlation parameter with the highest effect size occurred for parameter d Tr compared with the anaerobic power (AP) of the Wingate test (−0.77), while the other relationships were at an average level. The parameters d Tc and d Tr of the gastrocnemius lateralis muscle correlated with Vmax (−0.63, −0.53), AP (−0.55, −0.77), and AC (−0.60, −0.65). In turn, the relationship between the d Dm parameter was noted in connection with Vmax (−0.49) and tPPO (−0.58). Two statistically significant correlations were found for the gluteus maximus muscle—a positive one between the d Ts parameter and the AC parameter (0.53) and a negative one between the d Td parameter and the AP parameter (−0.55). The soleus muscle showed a positive relationship between the d Tc parameter in comparison with tPPO (0.49), and a negative relationship between the d Ts parameter and FI (−0.58). The correlation with the PP parameter was obtained only in the vastus lateralis muscle in connection with d Td, where this relationship was negative. In the case of the vastus medialis muscle, two negative correlations were found for the d Tc parameter in comparison with AP (−0.58) and AC (−0.54).
Table 4.
Matrix of correlation coefficients between changes in tensiomyography (TMG) parameters and selected parameters of the 30 s Wingate test (N = 20).
In addition, a correlation analysis was conducted between BMI and changes in TMG parameters of individual muscle groups. The analysis showed that statistically significant correlations were observed only for d Dm (r = 0.551) and for d Td (r = 0.567) of the vastus lateralis muscle. Both correlations were positive, and their strength was at a moderate level.
4. Discussion
The research conducted focused on evaluating changes in muscle contractile properties in response to anaerobic exercise in the form of the Wingate test. In addition, the relationships occurring between the level of changes in TMG parameters and Wingate test parameters were characterized. The main findings of the present study reveal that anaerobic effort led to statistically significant alterations in TMG in almost all examined muscles of the lower limb. Changes in the muscle response concerned the parameters Tc, Dm, Td, Ts, and Tr. The baseline values of the TMG variables of this study were compared with data reported for other sports [15,17,30]. The results of the present study show that the Tc parameter had similar values to the group of football players [17], but different in relation to road cyclists [30]. Cyclists presented higher values of the Tc in both the preparatory and starting periods. Interestingly, in women practicing rugby [15], the Tc parameter had similar values both in relation to the study group and the group of football players. The obtained results can provide reference data for future research.
The study showed statistically significant changes before and after anaerobic exercise in parameters measured using TMG. In addition, significant correlations were shown between these changes and selected parameters of the Wingate anaerobic test. A study by Venezuela et al. [15] showed a relationship between the contractile characteristics of the vastus lateralis muscle and the peak power achieved in the Wingate test. In contrast, a study by Kalc et al. [24] found that TMG is able to identify significant muscle changes immediately after anaerobic exercise. In addition, the correlation found in our study between Wingate test parameters and changes in TMG parameter values for almost all muscles tested suggests that TMG can be used as a tool for measuring fatigue and performance in anaerobic exercise. Thus, it can be concluded that anaerobic exercise has a significant effect on changes of skeletal muscle contractility parameters. Thus, it appears that TMG is an effective method for identifying differences in muscle response to training stimuli of anaerobic nature in particular. This makes TMG a useful tool to be used in monitoring the sports training process [10]. Based on monitoring muscle reactions to anaerobic exercise, coaches will be able to individually adjust the intensity of workouts and the length of rest periods between sets or exercises, thus optimizing athletic performance [2]. The obtained data can also be used to detect fatigue among subjects, minimizing the risk of muscle overload and, if necessary, implementing early preventive actions [6,18]. Assessing the effectiveness of muscle contractions will also allow for the identification of areas requiring further improvement. Therefore, TMG can be an effective tool for minimizing the risk of injuries [13] and for more accurately adjusting training to improve athletic performance [3].
Increased stiffness (Dm −6.33%) in the vastus lateralis muscle and delayed stimulus response in the vastus lateralis (Td 3.55%) and vastus medialis (Td 5.88%) muscles were observed. To our knowledge, only the study by Kalc et al. [24] characterized changes in TMG parameters after the Wingate test and exclusively in the vastus lateralis muscle. However, the results appeared to be similar to those obtained in our study. The authors showed a decrease in the Dm parameter (−38.5%) and an increase in the Td parameter (7.3%). In addition, small changes were observed in the Tc parameter (1%). As suggested by the authors [24], the decrease in Dm after the Wingate test reflected a swelling response, elevated intracellular water volume, and also heightened passive muscle stiffness induced by anaerobic exercise. Moreover, an increase in the Td parameter illustrated a longer reaction to the stimulus, and an increase in the Tc indicates a reduction in muscular contractile force due to muscle fatigue [31].
Within the study group, the Tr and Ts parameters in the rectus femoris muscle were also prolonged (Tr 39.23%, Ts 24.32%). This could stem from the involvement of the rectus femoris, which along with the hip flexors and adductors, perform the recovery function during the pedaling movement [6], and this may have translated into greater fatigue of this muscle. The reports of Sánchez-Sánchez et al. [23] also seem to support the fact that, in many studies, muscle fatigue is typically linked with heightened time variable values. However, in the other study [23], the opposite situation was observed, because there was a significant decrease in the parameters Td, Ts, and Tr after the RSA test, along with an increase in the parameter Dm in the rectus femoris muscle for both the dominant and non-dominant leg. In turn, after the ultra-endurance triathlon [6], almost no changes in Tr, Ts, Tc, and Dm in rectus femoris were observed, and only shortening of the Td parameter was found. However, the authors explained that the rectus femoris muscle is crucial predominantly during the cycling phase, while its importance diminishes during running. Increased Td and the accompanying decrease in Ts were also observed in the gastrocnemius lateralis and gastrocnemius medialis muscles, while a significant decrease in the Tc occurred only in the soleus muscle.
Correlation analysis revealed a notable connection between anaerobic endurance parameters and changes in individual muscle contractility parameters. The analysis shows that most of the changes (indexes of change) in muscle contractility parameters correlate negatively with Wingate test performance, which means, among other things, that the lower the power generated by an individual, the longer the contraction and relaxation times. No relationship was shown between the Dm parameter and most of the muscles tested, except for the gastrocnemius medialis for which this relationship was also negative. Therefore, it can be concluded that the participant’s level of anaerobic endurance affects the level of changes in muscle contractility parameters after anaerobic exercise. This conclusion, of course, requires further research to characterize these compounds in detail.
A limitation of the presented study is connected to the characteristics of the subjects. First, the research group consisted of only one gender. It limits the comparison between genders. Second the sample size is small. However, it was necessary to have a group of 20 participants to identify an interaction with an effect size of 0.86, with a significance level of 0.05. In addition, although all participants were described as active, differences in lifestyle and the presence of prior injury or medical conditions could have affected the results. Furthermore, only one anaerobic exercise was assessed, and the study was conducted once without testing the data collection. Furthermore, the high reliability of TMG has been confirmed for Tc, Dm, and Td parameters, while parameters Ts and Tr have poorer reliability [2]. In addition, there is no confirmed reliability for all the muscles we tested. Last, the time between coming off the cycloergometer and the end of the TMG measurement of the first and last muscle was not measured.
Author Contributions
J.D.—writing manuscript, analysis, interpretation of data; K.B.—conceptualization, research investigation, methodology; H.S.—analysis, interpretation of data; A.I.—analysis, interpretation of data; É.R.G.—review and editing; J.I.—review, supervision, final review; K.P.—conceptualization, methodology, analysis, interpretation of data, writing manuscript. All authors have read and agreed to the published version of the manuscript.
Funding
This research received no external funding.
Institutional Review Board Statement
The study was conducted in accordance with the Declaration of Helsinki and approved by the Ethics Committee of the University of Rzeszow (No 3/11/2017).
Informed Consent Statement
Informed consent was obtained from all subjects involved in the study.
Data Availability Statement
The datasets used and analyzed during the current study are available from the corresponding author upon reasonable request.
Acknowledgments
The authors would like to express their sincere gratitude to all the participants of this study and those who assisted with data collection.
Conflicts of Interest
The authors declare no conflict of interest.
References
- García-García, O.; Cuba-Dorado, A.; Fernández-Redondo, D.; López-Chicharro, J. Neuromuscular parameters predict the performance in an incremental cycling test. Int. J. Sports Med. 2018, 39, 909–915. [Google Scholar] [CrossRef] [PubMed]
- Martín-Rodríguez, S.; Loturco, I.; Hunter, A.M.; Rodríguez-Ruiz, D.; Munguia-Izquierdo, D. Reliability and measurement error of tensiomyography to assess mechanical muscle function: A systematic review. J. Strength Cond. Res. 2017, 31, 3524–3536. [Google Scholar] [CrossRef] [PubMed]
- Loturco, I.; Pereira, L.A.; Kobal, R.; Kitamura, K.; Ramírez-Campillo, R.; Zanetti, V.; Abad, C.C.C.; Nakamura, F.Y. Muscle contraction velocity: A suitable approach to analyze the functional adaptations in elite soccer players. J. Sports Sci. Med. 2016, 15, 483. [Google Scholar] [PubMed]
- Simunic, B.; Degens, H.; Rittweger, J.; Narici, M.; Mekjavic, I.; Pisot, R. Noninvasive estimation of myosin heavy chain composition in human skeletal muscle. Med. Sci. Sports Exerc. 2011, 43, 1619–1625. [Google Scholar] [CrossRef] [PubMed]
- Tous-Fajardo, J.; Moras, G.; Rodríguez-Jiménez, S.; Usach, R.; Doutres, D.M.; Maffiuletti, N.A. Inter-rater reliability of muscle contractile property measurements using non-invasive tensiomyography. J. Electromyogr. Kinesiol. 2010, 20, 761–766. [Google Scholar] [CrossRef] [PubMed]
- García-Manso, J.M.; Rodríguez-Ruiz, D.; Rodríguez-Matoso, D.; de Saa, Y.; Sarmiento, S.; Quiroga, M. Assessment of muscle fatigue after an ultra-endurance triathlon using tensiomyography (TMG). J. Sports Sci. 2011, 29, 619–625. [Google Scholar] [CrossRef] [PubMed]
- Macgregor, L.J.; Hunter, A.M.; Orizio, C.; Fairweather, M.M.; Ditroilo, M. Assessment of skeletal muscle contractile properties by radial displacement: The case for tensiomyography. Sports Med. 2018, 48, 1607–1620. [Google Scholar] [CrossRef] [PubMed]
- Dahmane, R.; Valenčič, V.; Knez, N.; Eržen, I. Evaluation of the ability to make non-invasive estimation of muscle contractile properties on the basis of the muscle belly response. Med. Biol. Eng. Comput. 2001, 39, 51–55. [Google Scholar] [CrossRef]
- Dahmane, R.; Djordjevič, S.; Šimunič, B.; Valenčič, V. Spatial fiber type distribution in normal human muscle: Histochemical and tensiomyographical evaluation. J. Biomech. 2005, 38, 2451–2459. [Google Scholar] [CrossRef]
- Wilson, M.T.; Ryan, A.M.; Vallance, S.R.; Dias-Dougan, A.; Dugdale, J.H.; Hunter, A.M.; Hamilton, D.L.; Macgregor, L.J. Tensiomyography derived parameters reflect skeletal muscle architectural adaptations following 6-weeks of lower body resistance training. Front. Physiol. 2019, 10, 1493. [Google Scholar] [CrossRef]
- Langen, G.; Sandau, I.; Ueberschär, O.; Nosaka, K.; Behringer, M. Methodical approaches to determine the rate of radial muscle displacement using tensiomyography: A scoping review and new reporting guideline. J. Electromyogr. Kinesiol. 2022, 67, 102702. [Google Scholar] [CrossRef]
- Rey, E.; Lago-Penas, C.; Lago-Ballesteros, J. Tensiomyography of selected lower-limb muscles in professional soccer players. J. Electromyogr. Kinesiol. 2012, 22, 866–872. [Google Scholar] [CrossRef]
- Alentorn-Geli, E.; Alvarez-Diaz, P.; Ramon, S.; Marin, M.; Steinbacher, G.; Boffa, J.J.; Cuscó, X.; Ballester, J.; Cugat, R. Assessment of neuromuscular risk factors for anterior cruciate ligament injury through tensiomyography in male soccer players. Knee Surg. Sports Traumatol. Arthrosc. 2015, 23, 2508–2513. [Google Scholar] [CrossRef]
- Rodríguez-Ruiz, D.; Rodríguez-Matoso, D.; Quiroga, M.E.; Sarmiento, S.; García-Manso, J.M.; Da Silva-Grigoletto, M.E. Study of mechanical characteristics of the knee extensor and flexor musculature of volleyball players. Eur. J. Sport Sci. 2012, 12, 399–407. [Google Scholar] [CrossRef]
- Valenzuela, P.L.; Montalvo, Z.; Sánchez-Martínez, G.; Torrontegi, E.; De La Calle-Herrero, J.; Dominguez-Castells, R.; Maffiuletti, N.A.; De La Villa, P. Relationship between skeletal muscle contractile properties and power production capacity in female Olympic rugby players. Eur. J. Sport Sci. 2018, 18, 677–684. [Google Scholar] [CrossRef] [PubMed]
- García-García, O.; Cancela-Carral, J.M.; Huelin-Trillo, F. Neuromuscular profile of top-level women kayakers assessed through tensiomyography. J. Strength Cond. Res. 2015, 29, 844–853. [Google Scholar] [CrossRef]
- Alvarez-Diaz, P.; Alentorn-Geli, E.; Ramon, S.; Marin, M.; Steinbacher, G.; Rius, M.; Seijas, R.; Ballester, J.; Cugat, R. Comparison of tensiomyographic neuromuscular characteristics between muscles of the dominant and non-dominant lower extremity in male soccer players. Knee Surg. Sports Traumatol. Arthrosc. 2016, 24, 2259–2263. [Google Scholar] [CrossRef]
- Wiewelhove, T.; Raeder, C.; Meyer, T.; Kellmann, M.; Pfeiffer, M.; Ferrauti, A. Markers for routine assessment of fatigue and recovery in male and female team sport athletes during high-intensity interval training. PLoS ONE 2015, 10, e0139801. [Google Scholar] [CrossRef]
- Simola, P.; Álvaro, R.; Christian, R.; Thimo, W.; Michael, K.; Tim, M.; Mark, P.; Alexander, F. Muscle mechanical properties of strength and endurance athletes and changes after one week of intensive training. J. Electromyogr. Kinesiol. 2016, 30, 73–80. [Google Scholar] [CrossRef] [PubMed]
- García-Manso, J.M.; Rodríguez-Matoso, D.; Sarmiento, S.; de Saa, Y.; Vaamonde, D.; Rodríguez-Ruiz, D.; Da Silva-Grigoletto, M.E. Effect of high-load and high-volume resistance exercise on the tensiomyographic twitch response of biceps brachii. J. Electromyogr. Kinesiol. 2012, 22, 612–619. [Google Scholar] [CrossRef] [PubMed]
- Carrasco, L.; Sanudo, B.; de Hoyo, M.; Pradas, F.; Da Silva, M.E. Effectiveness of low-frequency vibration recovery method on blood lactate removal, muscle contractile properties and on time to exhaustion during cycling at VO2max power output. Eur. J. Appl. Physiol. 2011, 111, 2271–2279. [Google Scholar] [CrossRef] [PubMed]
- Giovanelli, N.; Taboga, P.; Rejc, E.; Simunic, B.; Antonutto, G.; Lazzer, S. Effects of an uphill marathon on running mechanics and lower-limb muscle fatigue. Int. J. Sports Physiol. Perform. 2016, 11, 522–529. [Google Scholar] [CrossRef] [PubMed]
- Sánchez-Sánchez, J.; Bishop, D.; García-Unanue, J.; Ubago-Guisado, E.; Hernando, E.; López-Fernández, J.; Colino, E.; Gallardo, L. Effect of a Repeated Sprint Ability test on the muscle contractile properties in elite futsal players. Sci. Rep. 2018, 8, 17284. [Google Scholar] [CrossRef] [PubMed]
- Kalc, M.; Puš, K.; Paravlic, A.; Urbanc, J.; Šimunič, B. Diagnostic accuracy of Tensiomyography parameters for monitoring peripheral neuromuscular fatigue. J. Electromyogr. Kinesiol. 2023, 70, 102775. [Google Scholar] [CrossRef] [PubMed]
- Kang, H. Sample size determination and power analysis using the G*Power software. J. Educ. Eval. Health Prof. 2021, 18, 17. [Google Scholar] [CrossRef] [PubMed]
- Castañeda-Babarro, A. The Wingate Anaerobic Test, a Narrative Review of the Protocol Variables That Affect the Results Obtained. Appl. Sci. 2021, 11, 7417. [Google Scholar] [CrossRef]
- Simpson, A.E., Jr.; Helm, K.D.; Saez, G.M.; Smith, J.R. Anaerobic Parameters of Division I Collegiate Male and Female Tennis Players. J. Exerc. Physiol. Online 2017, 20, 177–187. [Google Scholar]
- Tomczak, M.; Tomczak, E. The need to report effect size estimates revisited. An overview of some recommended measures of effect size. TRENDS Sport Sci. 2014, 21, 19–25. [Google Scholar]
- Akoglu, H. User’s guide to correlation coefficients. Turk. J. Emerg. Med. 2018, 18, 91–93. [Google Scholar] [CrossRef]
- García-García, O.; Cancela-Carral, J.M.; Martínez-Trigo, R.; Serrano-Gómez, V. Differences in the contractile properties of the knee extensor and flexor muscles in professional road cyclists during the season. J. Strength Cond. Res. 2013, 27, 2760–2767. [Google Scholar] [CrossRef]
- Chai, J.H.; Bae, S.W. Evaluation of calf muscular function during the recovery phase after the repair of an achilles tendon rupture. Front. Surg. 2019, 6, 57. [Google Scholar] [CrossRef] [PubMed]

Disclaimer/Publisher’s Note: The statements, opinions and data contained in all publications are solely those of the individual author(s) and contributor(s) and not of MDPI and/or the editor(s). MDPI and/or the editor(s) disclaim responsibility for any injury to people or property resulting from any ideas, methods, instructions or products referred to in the content. |
© 2024 by the authors. Licensee MDPI, Basel, Switzerland. This article is an open access article distributed under the terms and conditions of the Creative Commons Attribution (CC BY) license (https://creativecommons.org/licenses/by/4.0/).