Abstract
The reconstruction of traffic accidents has grown as an interdisciplinary field, encompassing bodies of research from automotive engineering, traffic and transport engineering, biomechanics, and forensic sciences. In this work, a method is proposed by which the value of the force in the safety belt buckle can be determined provided the belt buckle is equipped with a pretensioning system with a pyrotechnic trigger in the pretensioner tube, PBP—Pyrotechnical Buckle Pretensioner, or PLP—Pyrotechnical Lap Pretensioner type. The anti-return system of the pretensioner mechanism, which prevents the passenger’s body from moving forward, contains a set of balls that block the movement of the piston in the pretensioner tube after its activation. When limiting the movement, the force the human body exerts on the safety belt webbing is transformed into the deformation of the pretensioner tube by the balls of the anti-return system. Depending on the magnitude of the force, the marks left by the balls differ. This is an alternative method for determining the force that occurs in a seatbelt and causes injury to the occupants of a vehicle. The advantage of this method is that the force in the seatbelt buckle cable can be determined relatively quickly and accurately by analyzing the deformations in the pretensioner tube, without a need for expensive laboratory equipment. The limitation of the model resides in the consideration of a static system with rigid bodies. The correlation between the normal force causing the deformation of the tube and the force in the belt buckle cable is obtained by means of a mechanical model that explains the operation of the anti-return system. By comparing the values of the normal force given by the proposed model and the elastoplastic model, a good correlation is found. Finally, a regression curve is determined to help the expert in approximating the force in the buckle cable depending on the deformation size in the pretensioner tube. The value of this force also enables biomechanical or medical specialists to correlate the degree of injury to occupants of a vehicle depending on the force in the seatbelt.
1. Introduction
Vehicle accident reconstruction is a multidisciplinary field [1,2] that often involves collaboration between engineers, forensic experts, and law enforcement personnel. The goal is to piece together a comprehensive and accurate understanding of traffic collision for safety and legal purposes. These techniques help investigators to determine factors such as the speed of vehicles, point of impact, and the sequence of events. Some common car accident reconstruction techniques comprise the following:
- Immediately after the accident, police officers take measurements and photographs at the accident site using topography equipment or laser scanners. They help create accurate, scaled sketches of the accident. Photogrammetry [3] is a laboratory method that involves the analysis of images taken at the scene of the accident to create 3D models. These models can help determine vehicle positions, speeds, and impact angles. This is carried outby technical experts who have access to the data collected by the police at the scene of the accident. Likewise, in the first stage after the accident, thorough examinations of the vehicles involved are carried out to assess damage patterns, tire marks, and other types of physical evidence. This information helps determine the point of impact and the speed of the vehicles. The analysis is carried out by technical experts or forensic officers.
- By studying skid marks, yaw marks [4], the scattering distance of the fragments [5], and other tire impressions, experts can analyze the acceleration, deceleration, and braking behavior of the vehicles involved. This is one of the oldest methods of accident reconstruction; it is usually conducted immediately after the traffic accident.
- An exact method of accident reconstruction is carried out in research centers approved by manufacturers and various authorities in the field. Controlled crash tests using similar vehicles can help recreate and understand the collision in depth. These tests provide data that can be compared to the actual crash in order to validate reconstruction results, but they require expensive test facilities and precision equipment to measure and record the data. Computer software is used to create simulations based on the available evidence. This includes inputting data such as vehicle speeds, impact angles, travel conditions of traffic participants, acceleration, deceleration, as well as road conditions (adhesion) to model the collision and its consequences. Various software applications such as Madymo [6] and PC-Crash [7], with powerful databases of vehicles and their occupants, are used.
Recent research has addressed equipping the vehicle with complex systems for active and passive safety [8], which records various data points before, during, and after an accident. For instance, this includes information about speed, brake status, throttle position, tire contact with the road, and so forth. Key data may be downloaded by specialized personnel from these “black boxes” in the event of an accident. In race cars, an important topic is crash analysis [9] in order to establish some characteristics like the car and human body deceleration during impact and human body forces on different body segments. Analyzing the forces in a seatbelt involves understanding the physics of restraint systems during a vehicle collision. Seatbelts play a crucial role in protecting occupants by distributing and managing the forces generated during a crash. In a collision, the seatbelt applies force to restrain the occupants and prevent them from continuing to move forward.
During a collision, a vehicle undergoes rapid deceleration. Seatbelts are designed to slow down this deceleration experienced by occupants, spreading the forces over an extended period to reduce the risk of injury. Many modern seatbelts are equipped with load limiters. These devices allow for a controlled amount of webbing to spool out during a collision, reducing the peak forces applied to the occupant. Pretensioners are devices that retract the seatbelt slightly during a crash, removing excess slack. The seatbelt webbing is a critical component in distributing forces. The tension in the seatbelt is carefully calibrated to manage the energy absorption during a collision while avoiding excessive loading on the occupant. Safety standards and regulations establish performance criteria for seatbelt systems [10]. Compliance with these standards ensures that seatbelts provide effective restraint during crashes.
Different seatbelt systems have been investigated due to their potential for distributing belt forces and for providing alternative load paths for the head in both frontal and lateral impacts [11]. The space within the vehicle interior allows the restraint system to dissipate a larger amount of the occupant’s energy during the collision event without the occupant being injured by the shoulder belt restraining load [12].
The three-point belt is a generally accepted and effective way to restrain vehicle occupants in the case of a frontal impact. The overall lifesaving effectiveness is estimated to amount to 61% [13]. Nevertheless, performance can be improved. Pretensioned and force-limiting seatbelts in combination with airbags have been shown to significantly reduce thoracic loading and consequently thorax injuries for a driver [11,14,15]. As an output of the restraint system, the seatbelt behavior can be influenced by different parameters, for example, occupant anthropometries, belt geometry, and crash severities [16].
The seatbelt provides initial restraint to the occupant body from the beginning of a collision, while the airbag can distribute the restraining load over the chest. Accident data analysis shows a benefit of seatbelt load limiters in frontal collisions, and a load limiter value of 4 kN has been proposed to achieve a good balance with the airbag [17,18,19].
In [20,21], studies on the dynamic deformations produced by spherical projectiles at high speeds are presented. We consider that the level of energies produced during the interaction between the target and the projectile is too high to make comparisons with the present situation, and subsequently these studies are not suitable for determining indentations with much smaller dimensions, as found in the case of pretensioning systems.
The aim of this paper is to determine the force in the buckle cable of the seatbelt equipped with the PBP or PLP system. The method is applicable in the case of a frontal impact of a vehicle by measuring the marks that the balls of the anti-return system of the pretensioner leave on the tube and the piston of the system. Once the tension in the buckle cable is established, the force in the seatbelt webbing and its action on the occupant’s chest and pelvis can then be determined. It is known that this depends on several factors previously mentioned and analyzed in various studies. Among these factors, we mention the anatomical constitution of the passenger, his/her age [22], the position of the driver [23], the intensity of the impact, as well as the construction and adjustment method of seatbelt safety [16,24,25].
Thus, a new method is proposed to help in the reconstruction of traffic accidents by analyzing the PBP type pretensioning mechanism of the seatbelt, as shown in Figure 1. During a traffic accident, when passengers are restrained with the seatbelt, their forward body movement is limited by the belt webbing. The webbing is connected through the belt buckle to the piston of the mentioned system by means of a cable. The anti-return system of the pretensioner limits the movement of the passengers towards the dashboard. The force with which the passenger’s body acts on the belt is transformed into the deformation of the tube pretensioner.
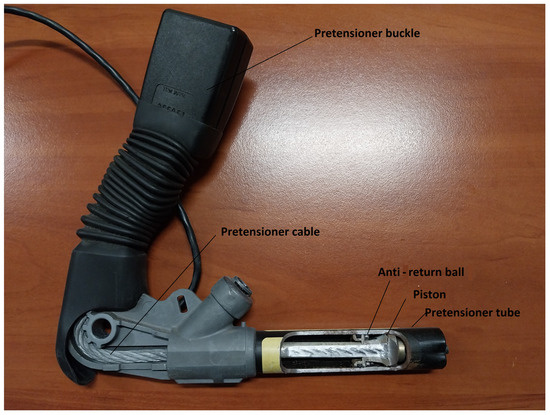
Figure 1.
The PBP pretensioner, the area of interest for the proposed method.
The force in the seatbelt buckle cable enables biomechanics or medical specialists to correlate the degree of injury to the occupants of a vehicle, taking into account the force in the seatbelt. Other applications may refer to the decelerations to which the human body has been subjected in the thorax–pelvis–hip region.
The remainder of this paper is organized as follows: Section 2 describes the phenomenon that occurs in the pretensioning system activated during an impact, as well as the occurrence of deformations in the pretensioner tube under the action of cable forces. Section 3 presents the mathematical models used to determine the normal force that causes the tube deformation and to establish a correlation between the normal force and the force in the tensioner cable. A CAD-3D model is also presented to virtually determine the depth of the tube deformation depending on the diameter of the mark. Section 4 describes the equipment used in the experiments. Section 5 analyses the experimental results obtained, and Section 6 points out the conclusions of the study.
2. Phenomenon Description
Pyrotechnic pretensioning systems, with a cable, as shown in Figure 1, are found on PBP and PLP models. In terms of location, they also coincide with the seatbelt anchorage points in the area of the central tunnel of the vehicle body, respectively, on the B-pillar, in the lower area. Their components include the following:
- The guide tube of the piston, which usually has a built-in pyrotechnic staple. It is the element that deforms in the process of blocking the anti-return system.
- The piston, mounted at the end of the belt buckle cable, for the PBP model. It is pushed by the force of the gases generated by the pyrotechnic staple and reduces the slack in the belt webbing. It has a special shape, geometry similar to a truncated cone, with generators inclined at approximately 7 degrees. Its shape allows for the reverse movement of the belt cable to be blocked after the pyrotechnic staple has been triggered.
- The balls of the anti-return system are mounted in a special plastic cage, similar to a bearing cage. They are placed around the conical area of the piston, on its generators. They make contact with both the piston and the tube.
The process of blocking the pretensioning mechanism, type PBP, is carried out as follows:
- In the event of a frontal impact, after activating the pyrotechnic staple and performing the tightening stroke of the seatbelt on the occupant’s body, the passenger tends to move forward due to inertia. At this moment, the balls of the anti-return system come out of their resting position and tend to “climb” up the conical surface from a smaller diameter to a larger one, until the moment when the piston–balls–cylinder mechanism stops.
- The intensity of the force with which the occupant’s body acts on the belt straps will lead to the deformation of the piston and the cylinder, the balls leaving marks in them, as shown in Figure 2.
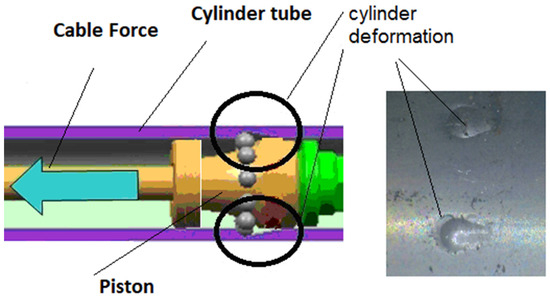 Figure 2. The functioning of the anti-return system for the PBP tube during the blocking of the pretensioning system.
Experimental tests were carried out on specially designed equipment, with various traction forces, using the pretensioning system from a seatbelt with a three-point attachment. The three-point seatbelt is, in accordance with the European Union’s general approach to “Vehicles” in the Transatlantic Trade and Investment Partnership negotiations, equipped with a PBP (Pyrotechnical Buckle Pretensioner). This study considers, as a test case, the US and EU legislation on seatbelt anchorages. The presence of the occupant in the seat or on a special catapult-type stand is not necessary because only the deformations in the PBP piston–cylinder (tube) pretensioning system were analyzed.
At the contact between the balls of the locking mechanism and the piston, respectively, the cylinder of the pretensioning tube, normal reactions will occur on the surface of the piston and cylinder due to the traction force in the belt. These will cause the human body to stop advancing after pretensioning by deforming the material of the piston and cylinder. The force distribution on the two loops of the strap and the effects on the human body are not the subject of this study; some of these aspects have been presented in various studies, such as [22,26].
We identify the situation of spherical contact with an indentation in the plastic regime studied under various aspects in [27,28,29,30,31,32]. These have been studied in numerous works, beginning with the early years of the 20th century, in order to develop models for testing the hardness of materials [33,34,35], as well as to determine spherical indentation in the elastic–plastic regime [36,37,38,39]. Throughout time, the study of indentation contact has attempted to develop models for testing material hardness. In indentation models, contact between a rigid sphere and a deformable flat is considered, as shown in Figure 3, where “N” is the normal force that acts on the indenter, “D” is the diameter of the intender, “d” is the diameter of the indentation, and “h” is the depth of the indentation on a flat wall. Points A, B, and O define the angle “φ” of spherical head, which is used to establish the depth of indentation. The simplified diagram of the plastic deformation mechanism of a flat surface under the action of a normal force is presented in Figure 3.
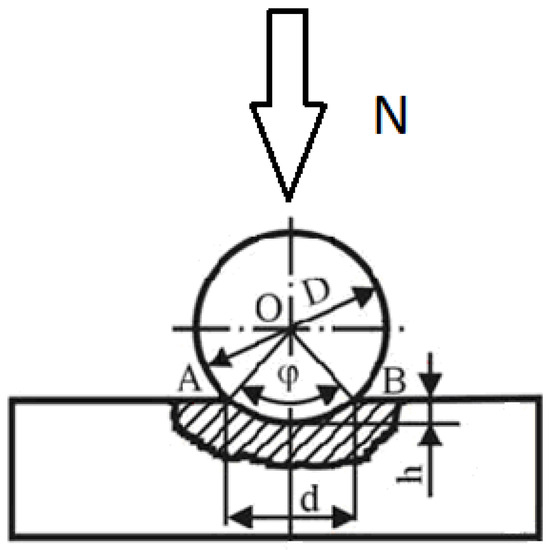
Figure 3.
Normal force and deformation occurring at the contact between the balls and the cylinder/piston, (realized after [40] description.
If the pulling force generated by the movement of the passenger’s body is high, settlement deformations can also occur on a certain length of the cylinder generator, as shown in Figure 4. In the proposed model, the tangential acting force is given by the force with which each ball acts on the tube. Figure 4 shows the marks left by the balls on the cylinder wall during the blocking of the pretensioning system.
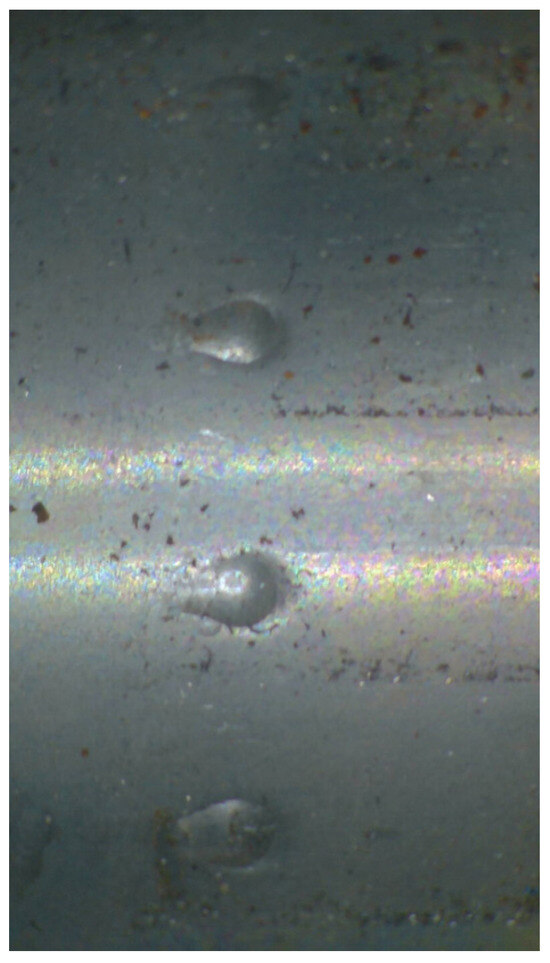
Figure 4.
Deformation by settling along a certain length.
The presence or absence of a webbing force limiting mechanism (RLE) and the magnitude of the force at which this system comes into action influences the way the cylinder is deformed by the locking balls. Figure 5 shows the sectioned tube of the pretensioning system after being acted upon with the traction force of the cable, written here as “Fcable”. Also, the ball cage, which holds the balls on the tube generator and piston, the piston, and the cable crimp can be seen on the cable end. By analyzing the marks left by the balls on the cylinder and on the piston, shown in Figure 4, the diagram of the forces acting on the anti-return system of the PBP type pretensioning mechanism can be drawn up.
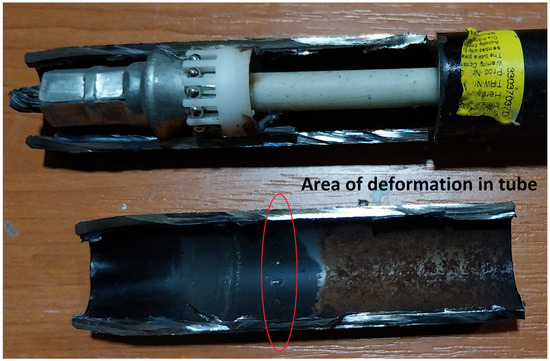
Figure 5.
Example of cylinder deformed following the functioning of the anti-return pretensioning mechanism PBP.
3. The Models
The technical expert examines the pretensioning system, in the tube of which the balls of the anti-return system leave marks. The elastoplastic model and the hardness method are used to calculate the normal force that determines the diameter of the spherical indentation, as shown in Section 3.2 and Section 3.3. The correlation between the normal force acting on a ball and the force in the belt buckle cable is established with a mechanical model. This model explains the operating principle of the anti-return system, as shown in Section 3.1. With the proposed model, the dimensions of the indentation are not determined.
In the models described in Section 3.2 and Section 3.3, we have as an input from the experimental data the diameter “d” of the impressions, and, with the given materials’ properties, we determine the normal forces “N” that produce deformations.
Provided that by comparing the values of the normal forces given by the proposed model and the elastoplastic model, a good correlation is found, it is considered that the proposed model is valid, enabling the determination of the force in the cable by considering the normal force that deformed the tube.
The goal is to establish a correlation of these deformations with the force in the cable leading to the seatbelt buckle. That is why, at the end of the study, a regression curve is determined to help the expert make an approximation of the force in the pretensioner cable given the deformation in the pretensioner tube. This force is useful for biomechanical or medical specialists when correlating the degree of injury to the occupants of a vehicle with the force in the seatbelt.
3.1. Proposed Model to Establish the Correlation between Normal Forces That Deform the Tube and the Force in Cable
For the proposed model, the bodies are considered rigid bodies. The mass of the ball of the anti-return system is insignificant compared to the forces that occur at deformation, and the system is considered in a static regime. The tilt angle of the piston generator was measured from the small base of the cone trunk to the right of the mark left by the ball on the piston. It has an inversely proportional influence on the magnitude of the normal deformation force.
The diagram depicted in Figure 6 shows the forces acting on the anti-return system, which is composed of a piston–ball–tube, in the stage of blocking the passenger’s movement due to inertia. Through the movement of the piston, given by the force in the cable “Fcable” as generated by the human body, the ball moves on the shape of the inclined plane of the piston and comes into contact with the piston and the tube of the pretensioner, causing the system to block. Deformation occurs in components with low hardness. Basically, the ball has the role of a feather. From the balance of the forces on the X- and Y-axes, we obtain the normal forces. The forces corresponding to the action of the ball on the cylinder and the piston have been illustrated.
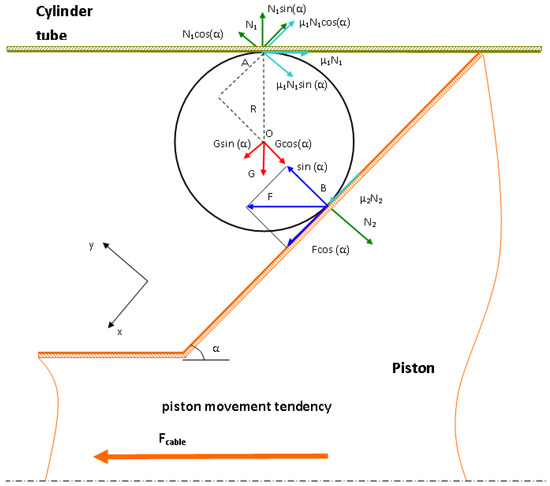
Figure 6.
Diagram of forces for the mathematical model proposed.
The force acting on a ball is given by the ratio of the force in the traction cable to the number of balls mounted on the piston generator:
Having the XY-axis system, as shown in Figure 6, the equilibrium equations on the X- and Y-axis are written as follows:
By solving the system formed by relations (2) and (3), we obtain the following:
The reaction forces “N1” and “N2”, which cause the deformation of both the cylinder and the piston, are determined from relations (4) and (5). These reactions will be compared with the normal forces, which cause spherical indentation, in the hardness model and the one described in [27].
The friction coefficient between the ball and the piston, respectively, the pretensioner tube, is chosen in accordance with the data from [41,42,43] at a value of 0.15–0.2. It depends on the contact pressure between the two materials, as well as on the sliding speed between them. As the speed and contact pressure increase, the friction coefficient decreases [44].
3.2. Determining the Normal Force of Action through the Hardness Method
Knowing, according to Brinell method [35], the hardness of the component in which the ball of diameter “D” left its mark and having the diameter “d” of the spherical indentation, the force with which the component part was acted upon can be determined, using a reasoning similar to the one applied to hardness determination by the Brinell method. According to the diagram depicted in Figure 3, the value of the normal force, that actsin static conditions, is given by relation (7).
The hardness formula, according to [40], with normal force in kgf, and “D” and “d” in millimeters, is as follows:
wherein
The angle of the spherical cap that penetrated the material can be obtained from the triangle AOB, as shown in Figure 3.
Wherein the depth with which the ball penetrates the material is determined from the triangle AOB and is described by the following relationship:
The value of the normal force, which deforms the tube, described by relation (7), is compared with that of the proposed model given in relations (4) and (5).
3.3. Determining the Normal Force of Action through Elastic–Plastic Contact Regime with Spherical Indentation
During contact, the material usually begins yielding at very small interferences, especially in the case of metals. Therefore, the elastic regime only covers a small range of interferences. On the other hand, the fully plastic regime occurs at very large interferences. For the majority of contacts, part of the material is in the elastic regime, and part of it undergoes plastic deformations. This is called the elastic–plastic regime. So far, there are no closed-form solutions for elastic–plastic contacts that arederived from fundamental principles [30].
Determining the normal force of action by the method described in [27] requires knowledge of the material properties, namely E1,2—Young’s modulus for the tube and ball, respectively, in MPa, Sy—yield strength in MPa, and Poisson’s ratio for the tube with the role of the part where the deformation takes place and the ball with the role of the spherical indenter.
The equivalent radius, depending on the cylinder, R1, and ball, R2, in millimeter is as follows:
A dimensionless factor is defined, using the notation from Figure 3
where, based on thenotation from Figure 3, the radius of truncated contact areas is determined:
where A and A′ are the real and truncated contact areas.
When Q > 1.78, the elastic–plastic small deformation phase persists until Q ≤ 21. For 21 < Q ≤ 400, contact occurs in the elastic–plastic medium deformation phase, and it has been considered to be consistent with the conventional hardness relation (note that this is the value assumed in their model). When Q > 400, the contact is in elastic–plastic large deformation phase [27].
Depending on the value of Q, for the cases analyzed, according to [27]
Hence, the value of the normal force “N”, described by (17), is compared with the one obtained by solving the system given by relations (4) and (5).
3.4. Virtual CAD-3D Models
Through CAD-3D modeling, the penetration depth of the ball can be determined virtually on surfaces with different geometries, outlined in Table 1, depending on the diameter of the impression. Thus, two surfaces have been modeled, shown in Figure 7, one flat and one cylindrical, respectively, on a 1:1 scale, with the aim of determining the penetration of the ball into the material of the cylinder/flat surface, depending on the diameter of the measured mark that the ball of the anti-return system leaves when the locking mechanism is blocked. The elliptical shape of the mark left by the ball on the surface of the cylinder is observed, as opposed to the circular shape, in the case of the flat surface. As the curvature of the surface tends to infinity (flat surface), at the same depth of penetration, a smaller diameter of the impression will result, and the shape tends to undergo an elliptical-to-circular transition.

Table 1.
Indentation dimensions on flat and cylindrical surface.
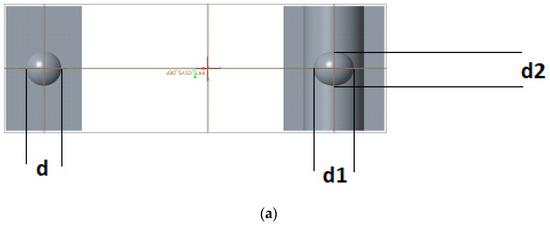
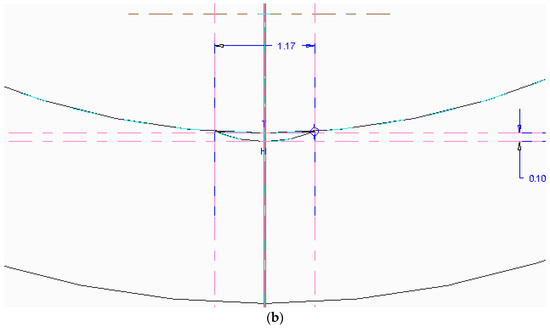
Figure 7.
Shape of indenters on both flat and cylindrical surfaces (a); image size increased on the penetration depth of the spherical indenter in the virtual model (b).
4. Experimental Setup
The experimental tests were performedon a test rig, as shown in Figure 8. A system with a spring was used to simulate the resistance of the human body and the force with which it acts on the safety belt strap with the body area (chest in particular). The PBP type pretensioning system was fixedly mounted, maintaining the angle that the pull cable of the closer has when mounted on the vehicle. The main geometric characteristics and properties of the materials are as follows:
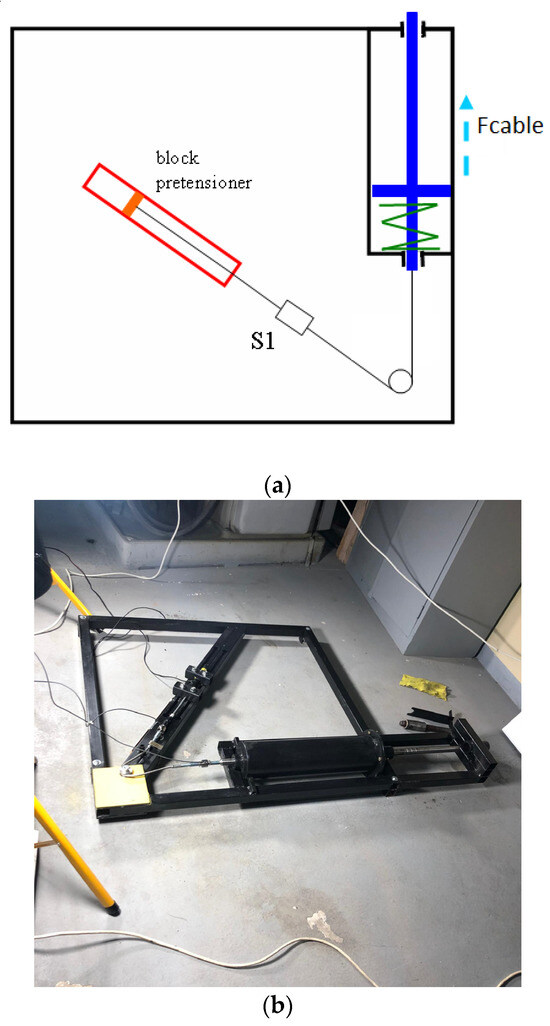
Figure 8.
Experimental test rig schema (a) and photo (b).
- The tube of the pretensioning system has an inner diameter of 18 mm;
- The ball of the anti-return system has a diameter of 3 mm;
- The material of the tube is carbon steel, ISO 3304-4 [45], with hardness HB 149;
- The ball is made of stainless steel X46Cr13, ISO 3290-1 [46], with a hardness of 56 HRC.
A HBM C9C—20 kN force transducer was mounted on the traction cable at a sampling frequency of 4800 Hz. In the first phase, the pyrotechnic system is triggered, which develops a pulling force on the seatbelt buckle cable. At this point, the displacement of the piston in the tube of the pretensioning system occurs. The second stage of the tests, in which the pretensioner is blocked and the marks left by the balls in the system tube appear, begins when the passenger’s body (with the chest and pelvis area), due to the inertia and intensity of the impact, pulls the webbing; therefore, cable traction occurs with “Fcable” force. During the tests, the human body was replaced with a compressed spring. The energy accumulated is released upon decompression, and it subsequently acts on the pretensioning system, which, through the mounted anti-return balls, blocks the release (unwinding of the strap). In real accidents, this blocking is translated by preventing the passenger from moving from the vehicle towards the dashboard.
The force in the spring can be adjusted by compressing its coils differently. The value of the maximum force that was developed by the spring in the seatbelt buckle cable during testing was between 2146 and 7858 N.
The average values of these forces are given in Table 2. FMVSS208 [47] and FMVSS214 [48] regulations on frontal and side impacts of passenger cars indicate maximum limits for deceleration (60 g for frontal impact and 85 g side impact) at the level of the torso. Likewise, the ECE/96/27 regulation [49] indicates the force (2.5 kN) that occurs at the abdomen of the occupant of a motor vehicle. In reference [9], also, the values of the car body decelerations encountered in crashes of competition vehicles are indicated, mentioning values of over 20 g in many cases.
Table 2.
Data about values of forces, indentation diameters, and depths.
The force developed in this stage, “Fcable”, acts on the occupant’s chest and pelvis. If a certain value is exceeded, the seatbelt can trigger a limitation of the effort on the chest. The force values of the force limitation system (RLE) are set by the seatbelt manufacturer, depending on the vehicle manufacturer’s requirements. The tension limiting force on the passenger’s body, in most types of seatbelts used, can be constant, progressive, or degressive. The threshold value at which the RLE system is activated varies between 2 and 4 kN. In this way, less severe injuries may occur to the occupant’s chest.
After the traction test in the cable, the pretensioners were disassembled, and their tubes were sectioned in order to carry out a microscopic analysis on the impressions left by the balls. The microscope used was a digital Hayear HY-1070, with its own analysis software and diameter values automatically indicated. Thus, the diameter of the ball impression was determinedafter the system calibration. HY-1070 is a multifunctional digital microscope individually designed, developed and manufactured by Shenzhen Hayear Electronics Co., Ltd., Shenzhen, China.
5. Discussion
The acting force in the seatbelt buckle cable is divided into “n” forces that act on the balls, kept equidistant through a special cage, all around the tube generator, as shown in Figure 5. The present analysis considers the force in the cable equally distributed on the number of balls. The acting time of the force in the cable differs depending on tests, considering the degree of compression of the spring, but we can say that it is approximately 10 ms, as shown in Figure 9, Figure 10 and Figure 11. The deformation produced in the pretensioner tube is two-fold, under the action of both normal and tangential forces, a fact that is established due to the geometry of the component parts and the acting force in the cable. The indentation left by a ball in the tube takes the form of a drop. The marks left by the balls on the tube generator were compared, and deviations of up to 10% of the measured diameters were found. For the proposed mathematical model, during the action of the force, it is considered that only the tube deforms plastically. The accuracy of the obtained results can be influenced by the characteristics of the materials in contact.
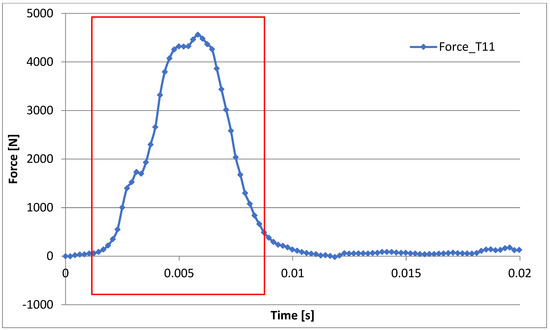
Figure 9.
Area of interests for force acting on buckle cable, sample test 11.
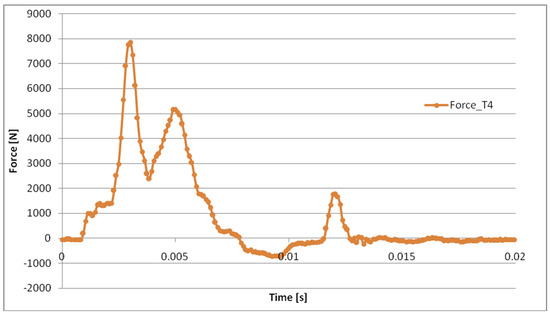
Figure 10.
Cable force sample for test 4.
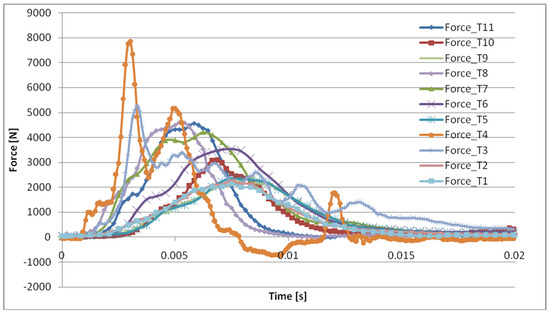
Figure 11.
Cable force variation for all tests.
Thus, elastic deformation in the spherical indenter can cause prediction errors of up to 12%, as shown in [50]. Tabor [51] has suggested that the yield strength of a spherical indenter should equal 2.5 times that of the flat indenter to prevent the plastic deformation of the indenter. For the steel ball, Sy is approximately 650 MPa, and for the tube material, it reaches 350 MPa [52]. Therefore, elastic deformations that produce errors on the size of marks may occur.
Eleven experimental tests were performed, with various action forces in the shutter cable. In the case of test no. 4, shown in Figure 10, the values cannot be used because of the displacement/movement of the tube while the force was acting in the cable. The pretensioning tube did not remain firmly fixed; thus, the force shows two humps, unlike the other cases, as shown in Figure 11.
The values of the forces measured and the dimensions of the marks are given in Table 2.
After performing the tensile tests, in the first step, the dimensions of the spherical indentations obtained through the virtual CAD-3D model were compared with those obtained after the experiments. In Figure 12, the values of the diameters that define the elliptical shape of the indention on the curved surface, together with their two trendlines, are represented. In Figure 13 we have a sample of shape and diameter measured using the microscope. Following the experiments, the shape of the indentations marks in the tube was predominantly close to the diameter “d2” of the indentation, their size fitting in the corridor defined by the two trendline curves. From the microscopic analysis, it was not possible to highlight the elliptical shape of the deformation, most probably due to the deformation process under the action of a normal force, as well as of the tangential one.
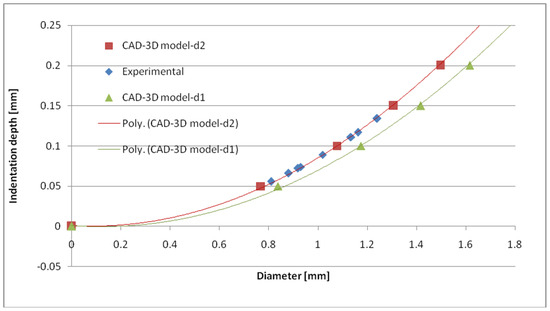
Figure 12.
Values of diameter indentation for 3D model and experimental data.
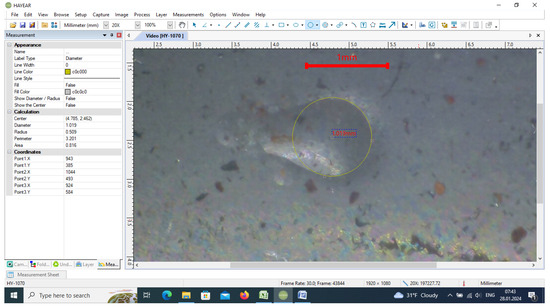
Figure 13.
Sample of diameter measure based on experimental data.
Thus, a good correlation is observed. The ratio between theoretical and experimental, as a percentage between 95.7% and 101%, observed probably due to the measurement errors of the indentation diametersprompted us to proceed to the stage of determining the forces. The values of the indentation depth were determined, according to Figure 3, by a calculation with relations (8) and (9), or with the CAD-3D model presented in Section 3.4.
In the next stage, the normal forces with which the balls act on the cylinder were compared by using three methods:
- The mathematical model proposed in this study;
- The “Hardness” model;
- The Komvopoulos–Ye model, described in [27,38,39].
From the experimental tests, we have the force in cable “Fcable” and also the diameter “d” of the indentation in the tube. In the mathematical model from Section 3.1., by using relation (1) to (5), we introduce as an input the experimentally obtained “Fcable” force, and thus we can determine the normal force “N1” and “N2”. The ball acts with normal force “N1” to produce these deformations in the tube; in this way, we were able to finda correlation between “Fcable”, “N1”, and “d”.
In the models described in Section 3.2 and Section 3.3, we have as an input from the experimental data the diameter “d” of the impressions, and with the given materials’ properties, we determine the normal forces “N” that produce deformations. So, we have another two set of points named “Hardness” and “Komv.–Ye”. For these datasets, we determined some linear regressions, as shown in Figure 14.
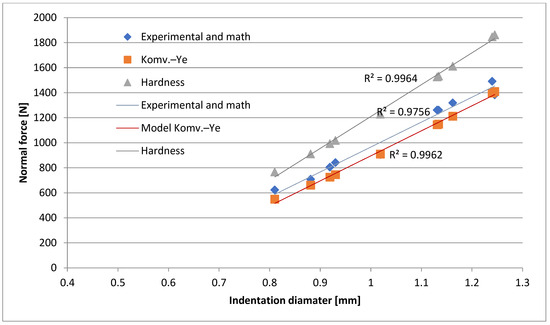
Figure 14.
Normal forces resulted from hardness, elastic–plastic model, and experimental data, depending on indentation diameter.
The force in the cable, obtained experimentally, was calculated as the average of the values over its range of action (see Table 2). These values cover the 1000–2400 N range, mostly up to the limit in which the effort limiter in the seatbelt retractor would come into operation. The normal force with which the ball acts on the tube is determined in the proposed mathematical model, starting from the force value measured in the belt buckle cable. The force values are lower than those determined by the “hardness” method. There is a good grouping of the values along a trend line (blue line). The coefficient of determination (R2) is 0.977, as shown in Figure 14.
In the model described in [27], the value of the normal force that produces the indentation has more grouped values compared to the trend line (red line); in this case, the coefficient of determination (R2) is 0.996, shown in Figure 14. The values of the forces are the lowest, by comparison with the other models wherein they were determined.
The dimensionless factor Q previously described is within the range of 21 < Q ≤ 400, so the contact occurs in the elastic–plastic medium deformation.
Considering the proposed model and the one in [27], the ratio between the normal forces that deform the tube is between 0.99 and 1.134. Comparing the two trendlines, it is found that they are theoretically parallel, showing the same tendency, with the difference between the values of the forces slightly increasing towards the small values of the indentation diameter and decreasing towards the larger diameters.
The average deviation between the two trendline curves is 7.8%, so it is considered that the proposed model is valid and the force in the cable can be determined depending on the normal force that deformed the tube.
The normal strength values, obtained through the “hardness” method, are the highest, with variations of 32–40% compared to those resulting from the Komvopoulos–Ye method. Moreover, this is considered to be outdated in contact mechanics for the purpose of determining the plastic deformations of materials [27] and, therefore, we do not consider this method to be useful for the present case. The technical or judicial expert in traffic accidents can have easy access to the safety belt pretensioning system. In the case of a PBP or PLP type system, data can be obtained about the size of the indentations that the balls of the anti-return system carry out in the tube. Based on a regression curve, the dependence between the force in the cable and the size of the mark can be determined.
Thus, in the last stage of the analysis, a polynomial curve was established to approximate the force in the cable of the seatbelt buckle depending on the diameter of the mark left by the balls of the locking system in the pretensioner tube, as shown in Figure 15.
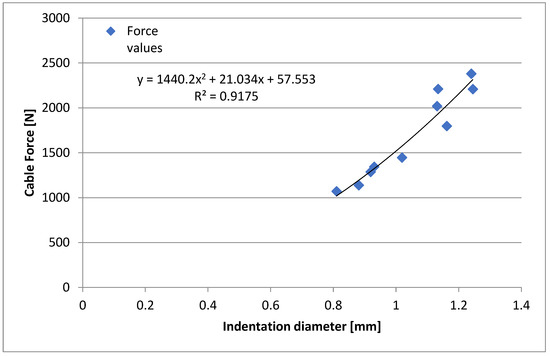
Figure 15.
The proposed regression curve force–indentation.
The force in the cable, “Fcable”, is determined with the following relation:
where “F” is the force with which a ball in the anti-return system acts to deform the pretensioner tube, and n is the number of balls (see Figure 6).
The force “F” is determined from relation (2) or (3), knowing the values of the normal reactions.
The coefficient of determination (R2) is 0.917, which authorizes us to consider that in this way, a good prediction can be made for the establishment of this useful force in the reconstruction of traffic accidents, starting from the marks left by the balls of the anti-return system during the traction appearing in the seatbelt buckle cable.
6. Conclusions
To the best of our knowledge, no current study addresses the possibility of determining the forces in aseatbelt by analyzing the deformations in the pretensioning tube system. On-board sensors may provide information about the travel regime of a vehicle and may determine whether active or passive occupant protection systems are triggered. However, there is no on-board device to measure or estimate forces in the seatbelt. Specialized equipment used to determine these forces is only found in research laboratories where accidents can be reproduced, obviously at a highcost.
The method used to analyze the deformations in the tube of the PBP or PLP pretensioning system provides information on the value of the force in the buckle cable, and implicitly the force in the safety belt, by inspecting these systems at a relatively low cost.
We believe that amodel based on hardness measurement is not feasible for this type of analysis.
The method herein proposedcan provide information for the analysis and reconstruction of traffic accidents by establishing the force with which the passenger’s body acts on the seatbelt buckle at the time of impact. These data can help to further determine the intensity of the frontal impact and the forces on the occupant’s torso, especially at the level of the ribcage. The determination of the forces with which the spherical indenter acts on the tube of the pretensioning system was carried out by using three models.
The proposed mathematical and the elastic–plastic model show close results for normal forces that deform the tube, with the difference between the two models not exceeding 7.8%.
The values of the two normal forces resulting from the two methods are considered to be equal for calculations. With this assumed approximation, and using the proposed mathematical model, starting from the normal deformation force, the value of the force in the cable may be determined.
The maximum force in the cable, experimentally determined, varies between 2146 and 7858 N, depending on the precompression of the spring. The diameter of the impressions varies between 0.81 and 1.245 mm, and the depths of the impression are 0.0557 and 0.135 mm. Since the dimensionless factor was in all cases in the range of 21 < Q ≤ 400, the contact occurs in the elastic–plastic medium deformation.
A polynomial regression function, with a coefficient of determination (R2) = 0.92, based on the results of experimental tests, has been proposed to establish the traction force in the seatbelt buckle cable, depending on the deformations in the tube of the PBP pretensioning system.
Future research can be extended to other elements of the belt retractor component in order to determine the strength of the seatbelt webbing.
We also aimto improve the proposed mathematical model by taking into account the dynamic aspect of the phenomena, as well as the properties of the materials.
Funding
This research received no external funding.
Institutional Review Board Statement
Not applicable.
Informed Consent Statement
Not applicable.
Data Availability Statement
Data is contained within the article.
Conflicts of Interest
The authors declare no conflicts of interest.
References
- Brooks, D. A Comprehensive Review of Pedestrian Impact Reconstruction; SAE Paper, no.890859; SAE International: Warrendale, PA, USA, 1989. [Google Scholar]
- Lipert, R. Motor Vehicle Accident Reconstruction and Cause Analysis, 5th ed.; Lexis Publishing: Charlottesville, VA, USA, 1999; pp. 539–554. [Google Scholar]
- Brach, R.; Brach, M. Vehicle Accident Analysis and Reconstruction Methods; SAE: Warrendale, PA, USA, 2011; ISBN 9780768057409. [Google Scholar] [CrossRef]
- Fricke, L.B. Traffic Accident Reconstruction; Northwestern University Traffic Institute: Evanston, IL, USA, 1990. [Google Scholar]
- Struble, D.E. Automotive Accident Reconstruction: Practices and Principles; CRC Press: Boca Raton, FL, USA, 2013. [Google Scholar]
- Zou, D.; Fan, Y.; Liu, N.; Zhang, J.; Liu, D.; Liu, Q.; Li, Z.; Wang, J.; Huang, J. Multi objective optimization algorithm for accurate MADYMO reconstruction of vehicle-pedestrian accidents. Front. Bioeng. Biotechnol. 2022, 10, 1032621. [Google Scholar] [CrossRef]
- Datentechnik, S. PC-CRASH.A Simulation Program for Vehicle Accidents, Operating and Technical Manual; Version 13.1; PC-CRASH: Richmond, BC, Canada, 2021. [Google Scholar]
- Mosconi, L.; Farroni, F.; Sakhnevych, A.; Timpone, F.; Gerbino, F.S. Adaptive vehicle dynamics state estimator for on board automotive applications and performance analysis. Veh. Syst. Dyn. 2023, 61, 3244–3268. [Google Scholar] [CrossRef]
- Melvin, J.W.; Baron, K.J.; Little, W.C.; Gideon, T.W.; Pierce, J. Biomechanical Analysis of Indy Race Car Crashes. SAE Trans. 1998, 107, 2872–2891. Available online: https://www.jstor.org/stable/44741243 (accessed on 27 March 2024).
- Regulation No 16 of the Economic Commission for Europe of the United Nations (UN/ECE)—Uniform Provisions Concerning the Approval of: I. Safety-Belts Restraint Systems Child Restraint Systems Isofix Child Restraint Systems for Occupants of Power-Driven Vehicles, II. Vehicles Equipped with Safety-Belts, Restraint Systems, Child Restraint Systems and Isofix Child Restraint Systems (OJL31330.11.2 007, p.58, ELI). Available online: https://eur-lex.europa.eu/eli/reg/2007/16(2)/oj (accessed on 27 March 2024).
- Kent, R.; Lopez-Valdes, F.J.; Dennis, N.J.; Lessley, D.; Forman, J.; Higuchi, K.; Tanji, H.; Ato, T.; Kameyoshi, H.; Arbogast, K. Assessment of a Three-Point Restraint System with a Pretensioned Lap Belt and an Inflatable, Force-Limited Shoulder Belt. Stapp Car Crash J. 2011, 55, 141–159. [Google Scholar] [CrossRef] [PubMed]
- Mertz, H.J.; Dalmotas, D.J. Effects of Shoulder Belt Limit Forces on Adult Thoracic Protection in Frontal Collisions. Stapp Car Crash J. 2007, 361–380. [Google Scholar]
- Cummings, P.; Wells, J.D.; Rivara, F.P. Estimating seatbelt effectiveness using matched pair cohort methods. Accid. Anal. Prev. 2003, 35, 143–149. [Google Scholar] [CrossRef] [PubMed]
- Valdano, M.; Jiménez-Octavio, J.R.; Lopez-Valdes, F.J. The effect of seatbelt pretensioners and load limiters in the reduction ofMAIS2+, MAIS3+, and fatal injuries inreal-world frontal crashes. Accid. Anal. Prev. 2023, 190, 107180. [Google Scholar] [CrossRef] [PubMed]
- Pipkorn, B.; López-Valdés, F.J.; Juste-Lorente, O.; Insausti, R.; Lundgren, C.; Sunnevång, C. Assessment of an innovative seatbelt with independent control of the shoulder and lap portions using THORtests, the THUMS model, and PMHS tests. Traffic Inj. Prev. 2016, 17, 124–130. [Google Scholar] [CrossRef] [PubMed]
- Mackay, G.; Hill, J. The limitations of current seatbelts in Europe—Some population considerations. J. Trauma 1995, 38, 533–537. [Google Scholar] [CrossRef] [PubMed]
- Lu, H.; Andreen, M.; Fausst, D.; Furton, L.; Holcombe, S.; Kohoyda-Inglis, C.; Putala, B.; Yee, J.; Wang, S. Safety Belt and Occupant Factors Influencing Thoracic & Upper Abdominal Injuries in Frontal Crashes; Society of Automotive Engineers, Inc.: Warrendale, PA, USA, 2011; 2011-01-1129. [Google Scholar] [CrossRef]
- Foret-Bruno, J.-Y.; Trosseille, X.; LeCoz, J.-Y.; Bendjellal, F.; Steyer, C.; Phalempin, T.; Villeforceix, D.; Dandres, P.; Got, C. Thoracic Injury Risk in Frontal Car Crashes with Occupant Restrained with Belt Load Limiter; Society of Automotive Engineers, Inc.: Warrendale, PA, USA, 1998; Volume 983166, pp. 389–401. [Google Scholar]
- Foret-Bruno, J.-Y.; Trosseille, X.; Page, Y.; Huere, J.-F.; Le Coz, J.-Y.; Bendjellal, F.; Diboine, A.; Phalempin, T.; Villeforceix, D.; Baudrit, P.; et al. Comparison of Thoracic Injury Risk in Frontal Car Crashes for Occupant Restrained without Belt Load Limiters and Those Restrained with 6kN and 4kN Belt Load Limiters. Stapp Car Crash J. 2001, 45, 205–224. [Google Scholar] [PubMed]
- Li, P.; Li, Y.; Hua, X.; Guo, Y.; Curtis, J.S. 3D DEM Simulations and Experiments on Spherical Impactor Penetrating into the Elongated Particles. Materials 2023, 16, 1664. [Google Scholar] [CrossRef] [PubMed]
- Buchely, M.; Maranon, A. Spherical Cavity Expansion Approach for the Study of Rigid-Penetrator’s Impact Problems. Appl. Mech. 2020, 1, 20–46. [Google Scholar] [CrossRef]
- Antona-Makoshi, J.; Yamamoto, Y.; Kato, R.; Kunitomi, S.; Konosu, A.; Dokko, Y.; Yasuki, T.; Takamiya, T. Effect of seatbelt and airbag loads on thoracic injury risk in frontal crashes considering average and small body size and age-dependent thoracicfragility. In Proceedings of the IRCOBI Conference, Malaga, Spain, 14–16 September 2016. [Google Scholar]
- Eggers, A.; Eickhoff, B.; Dobberstein, J.; Zellmer, H.; Adolph, T. Effects of Variations in Belt Geometry, Double Pretensioning and Adaptive Load Limiting on Advanced Chest Measurements of THOR and Hybrid III. In Proceedings of the 2014 IRCOBI Conference, Berlin, Germany, 10–12 September 2014. [Google Scholar]
- Nie, B.; Poulard, D.; Subit, D.; Donlon, J.P.; Forman, J.L.; Kent, R.W. Experimental investigation of the effect of occupant characteristics on contemporary seatbelt payout behavior in frontal impacts. Traffic Inj. Prev. 2016, 17, 374–380. [Google Scholar] [CrossRef] [PubMed]
- Pipkorn, B.; Lopez-Valdes, F.J.; Lundgren, C.; Bråse, D.; Sunnevång, C. Innovative SeatBelt System for Reduced Chest Deflection. In Proceedings of the 24th International Technical Conference on the Enhanced Safety of Vehicles (ESV), Gothenburg, Sweden, 8–11 June 2015. [Google Scholar]
- Beillas, P.; Soni, A.; Chevalier, M.-C. Q6 Dummy Thoracic Response and Diagonal Belt Interactions: Observations based on Dummy Testing and Human and Dummy Simulations. In Proceedings of the 2014 IRCOBI Conference, Berlin, Germany, 10–12 September 2014. [Google Scholar]
- Ghaednia, H.; Wang, X.; Saha, S.; Xu, Y. A Review of Elastic-Plastic Contact Mechanics. Appl. Mech. 2017, 69, 060804. [Google Scholar] [CrossRef]
- Tiwari, A.; Almqvist, A.; Persson, B.N.J. Plastic Deformation of Rough Metallic Surfaces. Tribol. Lett. 2020, 68, 129. [Google Scholar] [CrossRef]
- Johnson, K.L. Contact Mechanics; Cambridge University Press: Cambridge, UK, 1987. [Google Scholar]
- Ghaednia, H.; Pope, S.A.; Jackson, R.L.; Marghitu, D.B. A Comprehensive Study of the Elasto-Plastic Contact of a Sphere and a Flat. Tribol. Int. 2016, 93, 78–90. [Google Scholar] [CrossRef]
- Alcalá, J.; los Ojos, D.E.-D. Reassessing Spherical Indentation: Contact Regimes and Mechanical Property Extractions. Int. J. Solids Struct. 2010, 47, 2714–2732. [Google Scholar] [CrossRef]
- Quicksall, J.J.; Jackson, R.L.; Green, I. Elasto-Plastic Hemispherical Contact Models for Various Mechanical Properties. Proc. Inst. Mech. Eng. Part J 2004, 218, 313–322. [Google Scholar] [CrossRef]
- Tabor, D. The Hardness of Metals; Oxford University Press: New York, NY, USA, 2000. [Google Scholar]
- Brinell, J. Way of Determining the Hardness of Bodies and Some Applications of the Same. Tek. Tidskr. 1900, 5, 69. [Google Scholar]
- Meyer, E. Investigations of Hardness Testing and Hardness. Z. Phys. 1908, 9, 66–74. [Google Scholar]
- Taljat, B.; Pharr, G. Development of Pile-Up During Spherical Indentation of Elastic–Plastic Solids. Int. J. Solids Struct. 2004, 41, 3891–3904. [Google Scholar] [CrossRef]
- Chaudhri, M.M.; Hutchings, I.M.; Makin, P.L. Plastic Compression of Spheres. Philos. Mag. 1984, 49, 493–503. [Google Scholar] [CrossRef]
- Ye, N.; Komvopoulos, K. Indentation Analysis of Elastic-Plastic Homogeneous and Layered Media: Criteria for Determining the Real Material Hardness. ASME J. Tribol. 2003, 125, 685–691. [Google Scholar] [CrossRef]
- Komvopoulos, K.; Ye, N. Three-Dimensional Contact Analysis of Elastic-Plastic Layered Media with Fractal Surface Topographies. ASME J. Tribol. 2001, 123, 632–640. [Google Scholar] [CrossRef]
- Beitz, W.; Kuttner, K.-H. (Eds.) Dubbel Hanbook of Mechanical Engineering; Springer: Berlin/Heidelberg, Germany, 1994. [Google Scholar]
- Pijpers, R.J.; Slot, H.M. Friction coefficients for steel to steel contact surfaces in air and sea water. J. Phys. Conf. Ser. 2020, 1669, 012002. [Google Scholar] [CrossRef]
- Stembalski, M.; Pres, P.; Skoczynski, W. Determination of the friction coefficient as a function of sliding speed and normal pressure for steel C45 and stee l40 HM. Arch. Civ. Mech. Eng. 2013, 13, 444–448. [Google Scholar] [CrossRef]
- Evin, E.; Daneshjo, N.; Mareš, A.; Tomáš, M.; Petrovčiková, K. Experimental Assessment of Friction Coefficient in Deep Drawing and Its Verification by Numerical Simulation. Appl. Sci. 2021, 11, 2756. [Google Scholar] [CrossRef]
- Arnoux, J.J.; Sutter, G.; List, G.; Molinari, A. Friction Experiments for Dynamical Coefficient Measurement. Adv. Tribol. 2011, 2011, 613581. [Google Scholar] [CrossRef][Green Version]
- ISO3304:1975; Plain End Seamless Precision Steel Tubes—Technical Conditions for Delivery. ISO: Geneva, Switzerland, 1985. Available online: https://standards.iteh.ai/catalog/standards/sist/8f436f55-bb4c-4260-a618-4353211c1e0f/iso-3304-1975 (accessed on 27 March 2024).
- ISO3290-1:2014; Rolling Bearings—Balls—Part1: Steel Balls. ISO: Geneva, Switzerland, 2020. Available online: https://standards.iteh.ai/catalog/standards/sist/358646e0-deea-4e16-afa8-f496dc77fe1d/iso-3290-1-2014 (accessed on 27 March 2024).
- U.S. Department of Transportation. NHTSA Evaluation Plan for Federal Motor Vehicle Safety Standard 208 Occupant Crash Protection; U.S. Department of Transportation: Washington, DC, USA, 1979. [Google Scholar]
- U.S. Department of Transportation. FMVSS No.214 Amending Side Impact Dynamic Test Adding Oblique Pole Test; U.S. Department of Transportation: Washington, DC, USA, 2007. [Google Scholar]
- Directive 96/27/EC of the European Parliament and of the Council of 20 May 1996 on the Protection of Occupants of Motor Vehicles in the Event of a Side Impact. Available online: https://op.europa.eu/en/publication-detail/-/publication/0a5e2760-59c8-47f0-829c-4a0d16e05169 (accessed on 27 March 2024).
- Rodriguez, S.A.; Alcala, J.; Martins Souza, R. Effects of Elastic Indenter Deformation on Spherical Instrumented Indentation Tests: The Reduced Elastic Modulus. Philos. Mag. 2011, 91, 1370–1386. [Google Scholar] [CrossRef]
- Tabor, D. Simple Theory of Static and Dynamic Hardness. Proc. R. Soc. Lond. Ser. A 1948, 192, 247–274. [Google Scholar]
- Steel Tubes for Precision Applications—Seamless Cold Drawn Tubes E235, E355. Available online: https://www.peninsulardevastagos.es/ (accessed on 5 November 2020).


Disclaimer/Publisher’s Note: The statements, opinions and data contained in all publications are solely those of the individual author(s) and contributor(s) and not of MDPI and/or the editor(s). MDPI and/or the editor(s) disclaim responsibility for any injury to people or property resulting from any ideas, methods, instructions or products referred to in the content. |
© 2024 by the author. Licensee MDPI, Basel, Switzerland. This article is an open access article distributed under the terms and conditions of the Creative Commons Attribution (CC BY) license (https://creativecommons.org/licenses/by/4.0/).