Abstract
Ensuring the sustainability of transportation infrastructure for electric vehicles (e-trans) is increasingly imperative in the pursuit of decarbonization goals and addressing the pressing energy shortage. By prioritizing the development and maintenance of resilient e-trans platforms through the optimization of the public charging network, electric vehicle businesses can effectively meet the needs of users, thereby contributing to efforts aimed at improving environmental quality. To achieve this goal, researching the dynamics of vehicle user behaviors plays a crucial role. In this paper, we propose cross-structure multi-behavior contrastive learning for recommendation (C-MBR), which takes into account the dynamic preferences of users, and develops model profiles from the global structure module, local structure module, cross-behavior contrastive learning module, cross-structure contrastive learning module, and model prediction and optimization. C-MBR is mainly designed to learn user preferences from the diversity of users’ behaviors in the process of interacting with the project, so as to grasp the different behavioral intentions of users. The experimental and analytical research is further conducted and validated for dealing with cold start problems. The results indicate that C-MBR has a strong ability to deal with the problem of sparse data. Compared with the ablation experiment, the model performance of C-MBR is significantly enhanced, showing that the C-MBR model can fully apply the information of a global structure and local structure in cross-structure comparative learning and multi-behavioral comparative learning to further alleviate the problem of data sparsity. As a result, the e-trans infrastructure will be significantly enhanced by addressing the issue of data-driven disruption.
1. Introduction
As the fuel crisis escalates and environmental worries mount, governmental bodies and automobile manufacturers have unveiled diverse strategic initiatives aimed at advancing the adoption of fuel-efficient vehicles with reduced carbon emissions [1]. The resilience and remaining e-trans infrastructure stand as pillars of paramount importance, commanding attention from both academia and the transportation infrastructure constructing corporation. Hence, bolstering the fast-charging infrastructure to facilitate more frequent vehicle recharging represents a viable strategy for upholding the sustainability of e-trans infrastructure [2]. An investigation was implemented of the scenario where the company opts to invest in the necessary charging infrastructure to facilitate a cost-minimizing strategic transition, either due to the current inadequacy of public charging infrastructure or for strategic purposes [3].
To model and optimize the public charging network and thus, sustain the e-trans infrastructure, data on vehicle user behaviors play a crucial role in establishing the charging station network [4]. Furthermore, the resilience of e-trans infrastructure is closely intertwined with the broader concept of digital transformation. As businesses increasingly rely on digital channels to conduct transactions and engage with customers, the importance of maintaining robust and resilient e-trans platforms cannot be overstated. Whether it is ensuring the availability of charging sites, streamlining payment processing systems, or safeguarding customer data, the resilience of the e-trans infrastructure is essential for fostering trust, reliability, and continuity in the digital platform.
The internet holds an immense amount of information, continuously expanding to a degree where humans are unable to manage the overwhelming volume of data manually or through conventional tools [5]. Numerous studies indicate that data sparsity poses a significant barrier to deploying public charging site networks. The data sparsity and the cold start problem present a significant hurdle in datasets where each user provides ratings for only a limited number of sites [6]. In addition, electric vehicle trajectory data are sparse, resulting in a sparse tensor [7].
The implications of the shortage of data go far beyond the field of infrastructure development, especially when it comes to the construction of networks for electric vehicle (EV) charging. There are several issues associated with inadequate data availability, from imprecise demand forecasts to inefficient resource distribution and infrastructure design.
Fundamentally, insufficient data makes it difficult to determine where charging stations would be most appropriate, which causes uneven coverage and accessibility problems for electric vehicle customers. This may lead to overworked facilities in some locations and underutilized infrastructure in others, which would ultimately impair the convenience and dependability of EV charging networks. A log10 transform on the DBS (distance between sessions) was deployed to avoid broad difficulty due to the sparsity of data at high distances [8].
Moreover, the lack of data makes it more difficult to create demand forecasting prediction models, which are necessary to figure out the right size and capacity of infrastructure for charging EVs in the future. Infrastructure planners may find it difficult to deploy resources effectively in the absence of precise forecasts, which could lead to either an overinvestment or an underinvestment in charging infrastructure. Data gaps also make it more difficult to apply load management techniques and dynamic pricing schemes, both of which are essential for maximizing the efficiency of charging networks and reducing the burden on the electrical grid. It is difficult to put into practice efficient demand-side management techniques and incentives to promote off-peak charges without detailed data on consumption trends, periods of peak demand, and user behavior.
To address the lack of data in infrastructure planning, coordinated efforts must be made to improve data collection techniques, strengthen stakeholder data-sharing processes, and use advanced analytics and machine learning techniques to glean useful insights from small datasets. Governmental organizations, utility corporations, IT firms, and transportation stakeholders must work together to tackle data difficulties and guarantee the effective development of the EV charging infrastructure.
To fill these research gaps, this study aims to address the issues of data sparsity and the cold start problem, thereby ensuring resilience and remaining e-trans infrastructure.
The C-MBR (cross-structural multi-behavioral model) serves to predict and optimize electric vehicle charging behavior within the charging network. Based on these predictions, the charging network can be optimized to meet charging needs efficiently, minimize wait times, and optimize charging infrastructure resources. This helps enhance the charging experience for users and supports the development of the electric vehicle charging infrastructure. The evaluation metrics including normalized discounted cumulative gain (NDCG) @N and hits ratio (HR) @N are used to compare the differences between the recommended list and the user’s real interaction list. A cold start solution is further examined to conclude that C-MBR has a strong ability to deal with the problem of data sparsity.
The rest of the paper is organized as follows. Section 2 reviews relevant studies of sustainable e-trans infrastructure and data sparsity problems. Section 3 presents the mathematical foundation and parameter settings of the algorithm. Section 4 discusses the data and experimental results. Section 5 provides a discussion, and Section 6 concludes the paper.
2. Literature Review
2.1. Sustainable e-Trans Infrastructure
Maintaining sustainable transportation infrastructure, especially e-trans, is a critically important task for nations as it ensures smoothness for supply chains and other economic sectors. For countries with vast territories and developing countries, optimizing the network poses even greater challenges. Metais et al. [9] review studies focusing on three types of charging infrastructure users: buses, taxis, or private vehicles. They indicate that the majority concentrates on private vehicles, which constitute the largest portion of the vehicle fleet, or at least assumes that infrastructure can be designed to accommodate all light vehicles. Private vehicle owners utilize their vehicles for diverse purposes depending on their surroundings (urban, rural), travel patterns (proximity to key destinations, frequency of trips), and numerous other variables. Ashfaq et al. [10] provide an extensive review of recent advancements, as well as the difficulties encountered in establishing electric vehicle (EV) infrastructure, considering different charging power capacities and methods. It also evaluates the effects of EVs on the electricity grid. An investigation of variations in charging habits is implemented among various categories of plug-in electric vehicle (PEV) owners, examining their preferences for charging locations and levels [11]. Subsequently, they identify factors influencing PEV owners’ decisions regarding charging location and level. The analysis highlights socio-demographic factors (such as gender and age), vehicle attributes, commuting patterns, and the availability of workplace charging as key determinants affecting the choice of charging location.
The lack of transportation infrastructure poses a significant challenge to the implementation of transportation, logistics, and other related activities. Numerous studies have been conducted to address this issue at various levels and scales. Wang et al. [12] propose a novel hybrid multiple-attribute decision-making (MADM) model that combines the ordinal priority approach (OPA) and fuzzy measurement of alternatives and ranking according to the compromise solution (fuzzy MARCOS) for improving last-mile logistics, specifically for developing economies, due to poor infrastructures’ challenges. In the context of lacking infrastructure, to provide a guideline for the last-mile logistics managers and decision makers to take in-depth consideration, the research proposes a fuzzy multi-criteria decision-making (F-MCDM)-based framework combining the fuzzy analytic hierarchy process (FAHP) and the fuzzy weighted aggregated sum product assessment (FWASPAS), and triangular fuzzy numbers are applied to express the linguistic evaluation statements of experts [13]. A revealed preference survey is conducted to evaluate e-scooter usage in one of the highest-demand areas in the city of Austin, corresponding to a university campus [14]. The study explores population characteristics, mode shift, and mode interaction to provide a causal analysis to evaluate the nature of the relationship between e-scooters and transit trips in the whole city. A synthesis and critical discussion of the most up-to-date evidence on public charging choices is provided [15]. The findings indicate that useful criteria for charging behavior include home charging dominance, perceived insufficiency of public infrastructure, charging prices, comfort and waiting time, location matters, charging power, and frequency of use.
2.2. Data Sparsity Problem in e-Trans Charging Network
As mentioned earlier, enhancing the infrastructure for e-trans is a critical task in the decarbonization process. Deploying charging networks can be costly if completed under conditions of sparse data availability. Therefore, recent research has shown considerable interest in addressing this issue when establishing charging networks for e-trans infrastructure. To optimize the existing charging station network by eliminating redundant charging stations, for times and stations with sparse data, Yang et al. [7] utilize a method of context-aware tensor collaborative decomposition to infer the circumstances. In another study, an XGBoost regression model is utilized, which is a tree-based boosting model tailored to address sparse data when diagnosing battery charging capacity using extensive real-world EV operational data [16]. A classification system of charging patterns and user profiles for electric vehicles is derived from an analysis of 4.9 million charging transactions spanning from January 2017 to March 2019, involving 27,000 users across 7079 charging points in the public level two charging network across the four largest cities and metropolitan areas of the Netherlands [8]. Trinko et al. [17] examine and assess the pricing data related to charging stations sourced from PlugShare, an EV charging data platform that relies on crowd-sourced information. A typical study investigates the charging behavior of electric vehicles (EVs) and seeks to identify the most effective method for predicting it to optimize EV charging schedules [18]. The study observes that prediction errors increase with higher data entropy or lower data sparsity. Hence, it introduces the entropy/sparsity ratio (R) to account for both indicators. When R is low, support vector regression (SVR) and random forest (RF) regression demonstrate higher accuracy in predicting stay duration and energy consumption, respectively. Conversely, when R is high, a diffusion-based kernel density estimator (DKDE) performs better for both predictions. These three methods are combined into the proposed ensemble predicting algorithm (EPA) to enhance prediction performance by reducing prediction errors by 11% for the duration and 22% for the energy consumption. The prediction results are then utilized in an optimal EV charging scheduling algorithm to minimize load variance and reduce EV charging costs. Shoman et al. [19] employ a trip chain model to evaluate the charging demands for battery electric trucks (BETs) during long-distance operations in Europe by the year 2030. The proposed model considers truck driving regulations as well as various types of stops. The results indicate that the quantity of overnight chargers (50–100 kW) necessary is 4–5 times greater than the number of megawatt chargers (0.7–1.2 MW) required to accommodate a 15% adoption rate of BETs in long-haul operations.
To the best of our knowledge, previous models have not focused extensively on highlighting cross-behavioral comparative and sequence-based cross-behavioral aspects, as well as the issue of data sparsity in selecting charging sites. To fill this research gap, this paper provides the following contributions. Firstly, a thorough investigation into user behavior and embedding it into the training model can help the system separate behaviors more accurately. This is a significant contribution of the model. Secondly, through integrating a range of techniques for behavior separation into the local and global structural layer-based model during training, along with optimizing the distance from the user to the target site, user choice prediction becomes more accurate and optimal. Finally, based on the training and prediction results, the issue of sparse data is also addressed and reinforced. Consequently, this can assist in establishing additional charging stations.
3. Materials and Methods
To deploy a model predicting the user choice of a charging station based on behavior and that optimizes the charging station network, we incorporate techniques such as Global Architecture, Local Structure, Cross-behavioral Comparative Learning, and Comparative Learning Modules across Structures into our deep learning model. The Global Architecture technique enables the model to learn general and complex relationships between input variables and target variables across the entire dataset. The Local Structure technique focuses on modeling the local structure of the data, allowing the model to capture specific and complex relationships at each data point. Subsequently, the Cross-behavioral Comparative Learning and Comparative Learning Modules across Structures techniques are integrated to allow the model to compare and learn different behavioral patterns among users and across different types of behaviors, while combining learning and comparing behavioral patterns at both global and local structures, thereby providing a comprehensive approach to predicting electric vehicle charging behavior. This improves prediction accuracy by leveraging the advantages of both types of structures.
3.1. Global Architecture Module
For the global structure , where is the set of users, is the set of sites, and is the set of edges.
Here, denotes a user, denotes a site, and denotes the user–site interaction matrix under the behavior type (e.g., home-only, work-only, public-only, home-work, home-public, work-public, all). Thus, the multi-behavior interaction data are denoted as , where denotes the user–site interaction behavior type. When = 1, it means that interacts with on behaviors, and vice versa when = 0. It is a behavioral class.
3.1.1. User Project Messaging
Taking different interaction behaviors between users and projects as subgraphs, we build project-embedded propagation layers based on the information of subgraphs that can reflect the perception of customers’ behaviors, to capture the information of interaction structure graphs between customers and projects as well as the higher-order synergy signals under multi-behaviors [20,21].
Employing the user embedding propagation layer, denotes the -behavior of user after convolutional propagation in the layer, which is expressed as Equation (1):
where denotes the relationship between user and its neighbor project node . By combining them, is embedded into Equation (1) and Hadamard is applied as an operation method for product combination; denotes the target behavior on relationship ; denotes the customer; denotes the activation function; denotes the project node; and and denote the behavior of user and project on relationship , respectively. For the set of direct neighbor nodes in the group graph, denotes the symmetric normalized form to prevent the embedding size from increasing following the increase in the graph convolution operation; denotes the weight parameter matrix of a particular graph convolution from layer to layer ; denotes the propagation weight assigned to the user, which mainly incorporates the intensity of the user’s behavior, and the number of behaviors on relation ; denotes the behavior of site after the convolution propagation at layer for site ; denotes the behavior of site on relation at target behavior on relation after the layer of convolutional propagation.
Similarly, the site is embedded in the propagation layer as Equation (2):
3.1.2. Project Relevance Extraction
Capturing the similarity and relevance of sites presented by users on different behaviors can realize the enhancement of the site-embedded learning capability, especially in the case of sparse data volume [22,23].
The layer embedding the Equation for the same site in behavior is:
where denotes the parameter matrix of behavior , aggregated for layer information; denotes the interaction site; denotes the embedding of interaction site in layer when site performs behavior ; and denotes the set of sites that the user interacts with in the same site .
3.1.3. Multi-Behavioral Fusion Module
As there may be data sparsity during the execution of a user’s behavior, and different types of behaviors indicate the variability in the user’s intentional interest, the user’s behavioral preference for the target site can be judged by the auxiliary behavior, which is conducive to the learning of the user’s behavioral preference [24,25,26].
Encoding subgraph interaction patterns for users over different behaviors enables fusion concerning the global structure of the user’s project, which is represented by (4) and (5):
where and denote the initial features of nodes , ; denotes the two-layer MLPs (multi-layer perceptrons) with the ReLU (rectified linear unit) activation function applied.
3.2. Local Structure Module
For the interaction of users and projects on different behaviors as subgraphs, a sequence local structure encoder is applied to each subgraph, and based on the learning of a single behavior of the user and the project, the modules are integrated to form the final local structure representation of the user and the project. The historical behavior of user is represented in sequence form as , where denotes the type of user interaction with the project, is the sequence of user interactions with the project in chronological order under behavior , , and applying the BERT4Rec local structure encoder [27], we obtain the -behavior representation implemented by user under the local mechanism module as Equation (6):
After that, the final local structure concerning the user is represented in Equation (7):
where denotes the two-layer MLPs applying the ReLU (rectified linear unit) activation function.
3.3. Cross-Behavioral Comparative Learning Module
Comparative learning is carried out on the user’s auxiliary behavior, target behavior embedded representation, and the minimization of the difference between the same user embedding and the maximization of the difference between different user embeddings, based on the pairwise unlearned loss function to control this task [28,29].
3.3.1. Sequence-Based Cross-Behavioral Comparison Learning Tasks
The user set includes a total of customers. In this paper, positive sample pairs refer to the embedded representations of the same user under different behaviors, and negative sample pairs refer to the embedded representations under different behaviors of the same user. Based on the given user -embedding of target behavior denoted as , the given user -embedding of target behavior denoted as , and the given user -embedding of target behavior denoted as , the positive sample pairs are chosen as (, ) and the negative sample pairs are chosen as (, ) when the comparison learning is launched on them; , , and denote the set of the interaction behaviors between the users and the projects.
The input embedding representation in the MLP (multi-layer perceptron) allows negative sample pairs to be mapped in the same space, denoted by Equations (8) and (9):
where is applied to express the comparative loss of each pair of behaviors of the user and the project, which is given in the Equation (10):
where denotes the cosine similarity function between two behavioral embeddings; and denotes the temperature coefficient of the softmax function. Equation (10) represents a loss function commonly used in the context of machine learning, particularly for tasks that involve learning representations, such as contrastive learning or in the training of embedding models.
The cross-behavioral comparison learning loss based on sequences is expressed as Equation (11):
3.3.2. Graph-Based Cross-Behavioral Comparison Learning Tasks
Constructing a graph-based cross-behavior contrastive learning task involves users with given target behavior , embedding representations , users with given target behavior , embedding representations , and users with given target behavior and embedding representations . When conducting contrastive learning, the selected positive sample pairs are denoted as (, ), and negative sample pairs as (, ). Here, , where represents the set of interactions between users and sites.
The input embedding representation at the MLP allows negative sample pairs to be mapped in the same space, denoted by Equations (12) and (13):
is applied to express the comparative loss of each pair of behaviors of the user and the project, which is given by Equation (14):
Equation (14) is the loss function used in a cross-behavior contrastive learning module, often employed in machine learning models related to contrastive learning. Specifically, this is a sequence-based cross-behavior contrastive learning loss function used in recommendation systems, designed to better enable the model to learn representations of users across different behaviors.
The cross-behavioral comparison learning loss is expressed as Equation (15):
3.4. Comparative Learning Modules across Structures
The cross-structure comparison learning task is to present the commonalities of the different structures, in other words, to minimize the differences between local and full structure embeddings of the same user, and to maximize the differences between embeddings of different users, based on the control of the pairwise unlearning loss function for this task.
The positive sample pairs are chosen as (, ) and the negative sample pairs are (, ), (, ); , , denote the set of interaction behaviors between users and projects.
The input embedding representation at the MLP allows negative sample pairs to be mapped in the same space, denoted by Equations (16) and (17):
The defining Equation for the cross-structure comparison learning loss is denoted as Equation (18):
3.5. Model Prediction and Optimization
The behavioral embedding representation of the user and the project is obtained through the local structure and global structure respectively, and fused so that the user’s individual information and the global structure information can be included at the same time, which is expressed by the Equations (19) and (20):
The correlation score is calculated between the target site v and the target customer u interaction sites under the specified k behaviors as Equations (21) and (22):
where denotes a diagonal matrix with diagonal elements equal to ; and denotes the set of sites for user under behavior.
The predictive scoring Equation between the target site and the target customer interaction site is as follows:
The optimization model, the recommendation task loss function, is defined with Equation (24):
where denote paired training samples, and and denote observed and unobserved interaction behaviors that can be observed and unobserved, respectively, for user and site . is the sigmoid activation function, and the combined cross-behavioral, cross-structural comparison loss, and the overall loss Equation is expressed as follows:
where denotes the chance of all trainable parameters, denotes the parameter controlling regularization, and denotes the parameter controlling the proportion of contrast loss. The Nomenclature presents a full explanation of mathematical symbols in the proposed model.
4. Experimentation and Results Analysis
4.1. Data Set and Data Preprocessing
In this experiment using MATLAB R2018a, we utilize the charging infrastructure dataset provided by Statista including 41,742 users and 11,953 sites, with three types of charging behavior including 18,134 (slow), 25,572 (fast), and 1997 (ultra-fast) [30]. Pre-processing work is carried out on the above data to merge repeated interactions and filter out users and sites with fewer than 5 interactions.
4.2. Evaluation Indicators and Experimental Setup
The evaluation metrics normalized discounted cumulative gain (NDCG) @N and hits ratio (HR) @N were applied. They are used to compare the differences between the recommended list and the user’s real interaction list.
Each site in the list of recommendations has a certain correlation between the use and the score form of the expression of the correlation that exists. For example, for gain, if a user’s rating is (5–10 points), the gain is 5–10; if the analysis is of the user’s implicit behavior, such as observing whether the user clicks on the site, with 0 indicating click and 1 indicating not clicked, then the gain is 0 or 1. Add the gain between each site to obtain the Cumulative Gain (Cumulative Gain); let each site gain and its discount value (target site list position) be divided to obtain the discounted cumulative gain DCG (Discounted Cumulative Gain), which indicates that the site list position is more backward the higher the discount and the lower the value. Using the DCG to determine whether the user reference project recommendation is good or bad, but knowing that the DCG between different customers cannot be compared, it is necessary to use the normalized Discounted Cumulative Gain NDCG to obtain the best Discounted Cumulative Gain (Ideal Discounted Cumulative Gain, IDCG); combined with the project gain sorting for ranking, the best DCG calculation is IDCG. The greater the results of the calculation, the higher the value of the project list. The closer the calculation result is to 1, the more reasonable the ordering is. NDCG@N is defined by the Equation (26):
The hit rate HR is the recommended stronger evaluation metric. The HR@N Equation is:
where, indicates the number of times the site is recommended; the function indicates whether the is indicated by 1, if not, 0.
Higher values of the corresponding data indicate more accurate final recommendations. Non-interaction sites were randomly selected as negative samples and interaction sites as positive samples.
Set the number of base layers of the graph volume to 4, the in the prediction score to 0.7, the L2 normalization factor to 0.0001, and the temperature coefficient .
4.3. Baseline Methodology
The validity of the C-MBR model’s acquisition is verified by launching a comparative analysis between C-MBR and five other candidates including EHCF (efficient heterogeneous collaborative filtering), NMTR (neural multi-task recommendation), NGCF-M (neural graph collaborative filtering-multi-behavior), NGCF-CL (neural graph collaborative filtering-contrast learning tasks), and S-MBRec (self-supervised graph neural networks for multi-behavior recommendation).
For EHCF, we use the following parameter values. Embedding Matrix Size: The embedding matrices are set to have 100 × 100 dimensions, indicating 100 latent features for both users and sites. The Learning Rate is set to 0.001. The model consists of 2 hidden layers, each containing 50 neurons, providing a balance between model complexity and the capacity to capture intricate patterns in the data. A consideration threshold of 0.5 is established, indicating that recommendations with scores above 0.5 are deemed suitable. The Adam optimization algorithm is employed to optimize the model parameters.
The NMTR candidate encompasses specific parameter values as follows. The model can handle multiple recommendation tasks simultaneously, with common choices being the user–site rating prediction, site–site similarity calculation, and user clustering. In this comparison, we configure to address three tasks. Two hidden layers in the NN architecture are set to have sizes like 100 neurons each, providing flexibility in capturing complex patterns in the data across different tasks. The learning rate for training the model could be set to 0.001. To prevent overfitting, a dropout rate of 0.5 is applied during training, meaning that each neuron has a 50% probability of being dropped out during each training iteration. Training the model with a batch size of 32 samples per batch can balance computational efficiency and gradient accuracy during optimization.
For the NGCF-M, NGCF-CL, and S-MBRec, we configure similar parameter values as follows. The sizes of the embedding vectors for users and sites are set to 64 dimensions, allowing the model to learn rich representations of users and sites in the embedding space. The model architecture includes 2 convolutional layers to capture different levels of neighborhood information in the graph structure. In the NN component, we set 128 neurons each, providing the capacity for learning complex interactions between users and sites. The dropout rate of 0.2 is deployed. The Learning Rate is set to 0.001. The attention mechanism is employed with 4 attention heads to allow the model to focus on different aspects of the neighborhood relationships.
4.4. Experimental Results
The C-MBR was analyzed in comparison with the remaining five baseline models to show its results in the dataset. Detailed information is shown in Table 1.

Table 1.
Performance of different models on the dataset (N = 10).
Table 1 reveals that C-MBR exhibits superior performance compared to the remaining five baseline models. Across both rating indicators, C-MBR demonstrates an improvement of 4.5% to 6.9% compared to the optimal baseline model, indicating its superior performance and effectiveness in constructing local and global structures to capture users’ dynamic preferences. The fusion of sequence-based and graph-based recommendation models enhances information complementarity, allowing for more comprehensive learning of user preferences. Through analyzing sequence- and graph-based user behavior representations and comparing the two, commonalities are identified, enhancing modeling quality. NGCF lacks consideration for the comparative learning task, while NGCF-CL, despite its addition of graph-based cross-behavioral comparative learning, still falls short. However, NGCF-CL outperforms NGCF-M, underscoring the effectiveness of cross-behavioral comparative learning in capturing behavior differences and commonalities. EHCF, NMTR, and NGCF-F rely on supervised model construction, making it challenging to ensure accuracy in sparse data scenarios. In contrast, the C-MBR model effectively addresses this issue by analyzing multiple behaviors, learning user dynamic behavioral preferences across structures, and incorporating a comparative learning task simultaneously.
4.5. Ablation Experiments
The dataset was used to compare a total of six variants, w/o g, w/o s, w/o cl, w/o vcl, w/o g+cl, and w/o s+cl, with the C-MBR unfolding ablation realizations, as a way of demonstrating that the C-MBR model has certain rationality in all parts of its construction. Detailed information is shown in Table 2.
Table 2.
C-MBR model: its construction in the various parts of the ablation study.
Upon reviewing Table 2, it becomes evident that taking comprehensive considerations for various types of behaviors may enhance the learning of user preferences. Combining sequence-based local structure cross-behavioral comparison learning tasks with graph-based global structure cross-behavioral comparison learning tasks can effectively enhance overall performance. These tasks primarily focus on capturing both the user’s personal information and their global information to learn user representations, thereby shaping user interests and preferences at different levels. The comparative analysis between scenarios with and without certain components indicates that the cross-behavior comparison learning task contributes to model performance improvement. This suggests that multiple behaviors exhibited by the same user can better reflect their preferences, and there exists a degree of commonality among these behaviors, which can be fully explored to create more robust representations and address data sparsity issues. The comparative analysis of w/o g and w/o g+cl, w/o s and w/o s+cl, concluded that the cross-behavior comparison learning task is conducive to improving the model performance, which indicates that multiple behaviors unfolded by the same user can better reflect the user’s preferences, and there is also a certain degree of commonality between the multiple behaviors of the same user, and its commonalities can be fully explored to form a better representation, and effectively solve the data sparsity problems. The comparative analysis of w/o vcl and C-MBR fully verifies the value of the cross-structure comparison learning task for performance improvement, and it can be said that the cross-structure comparison learning task aligns the global structure representation information and the local structure representation information, which is conducive to obtaining the commonality of the interaction behaviors of users and projects with different structures, and strengthens the quality of structure modeling.
4.6. Dealing with Cold Starts
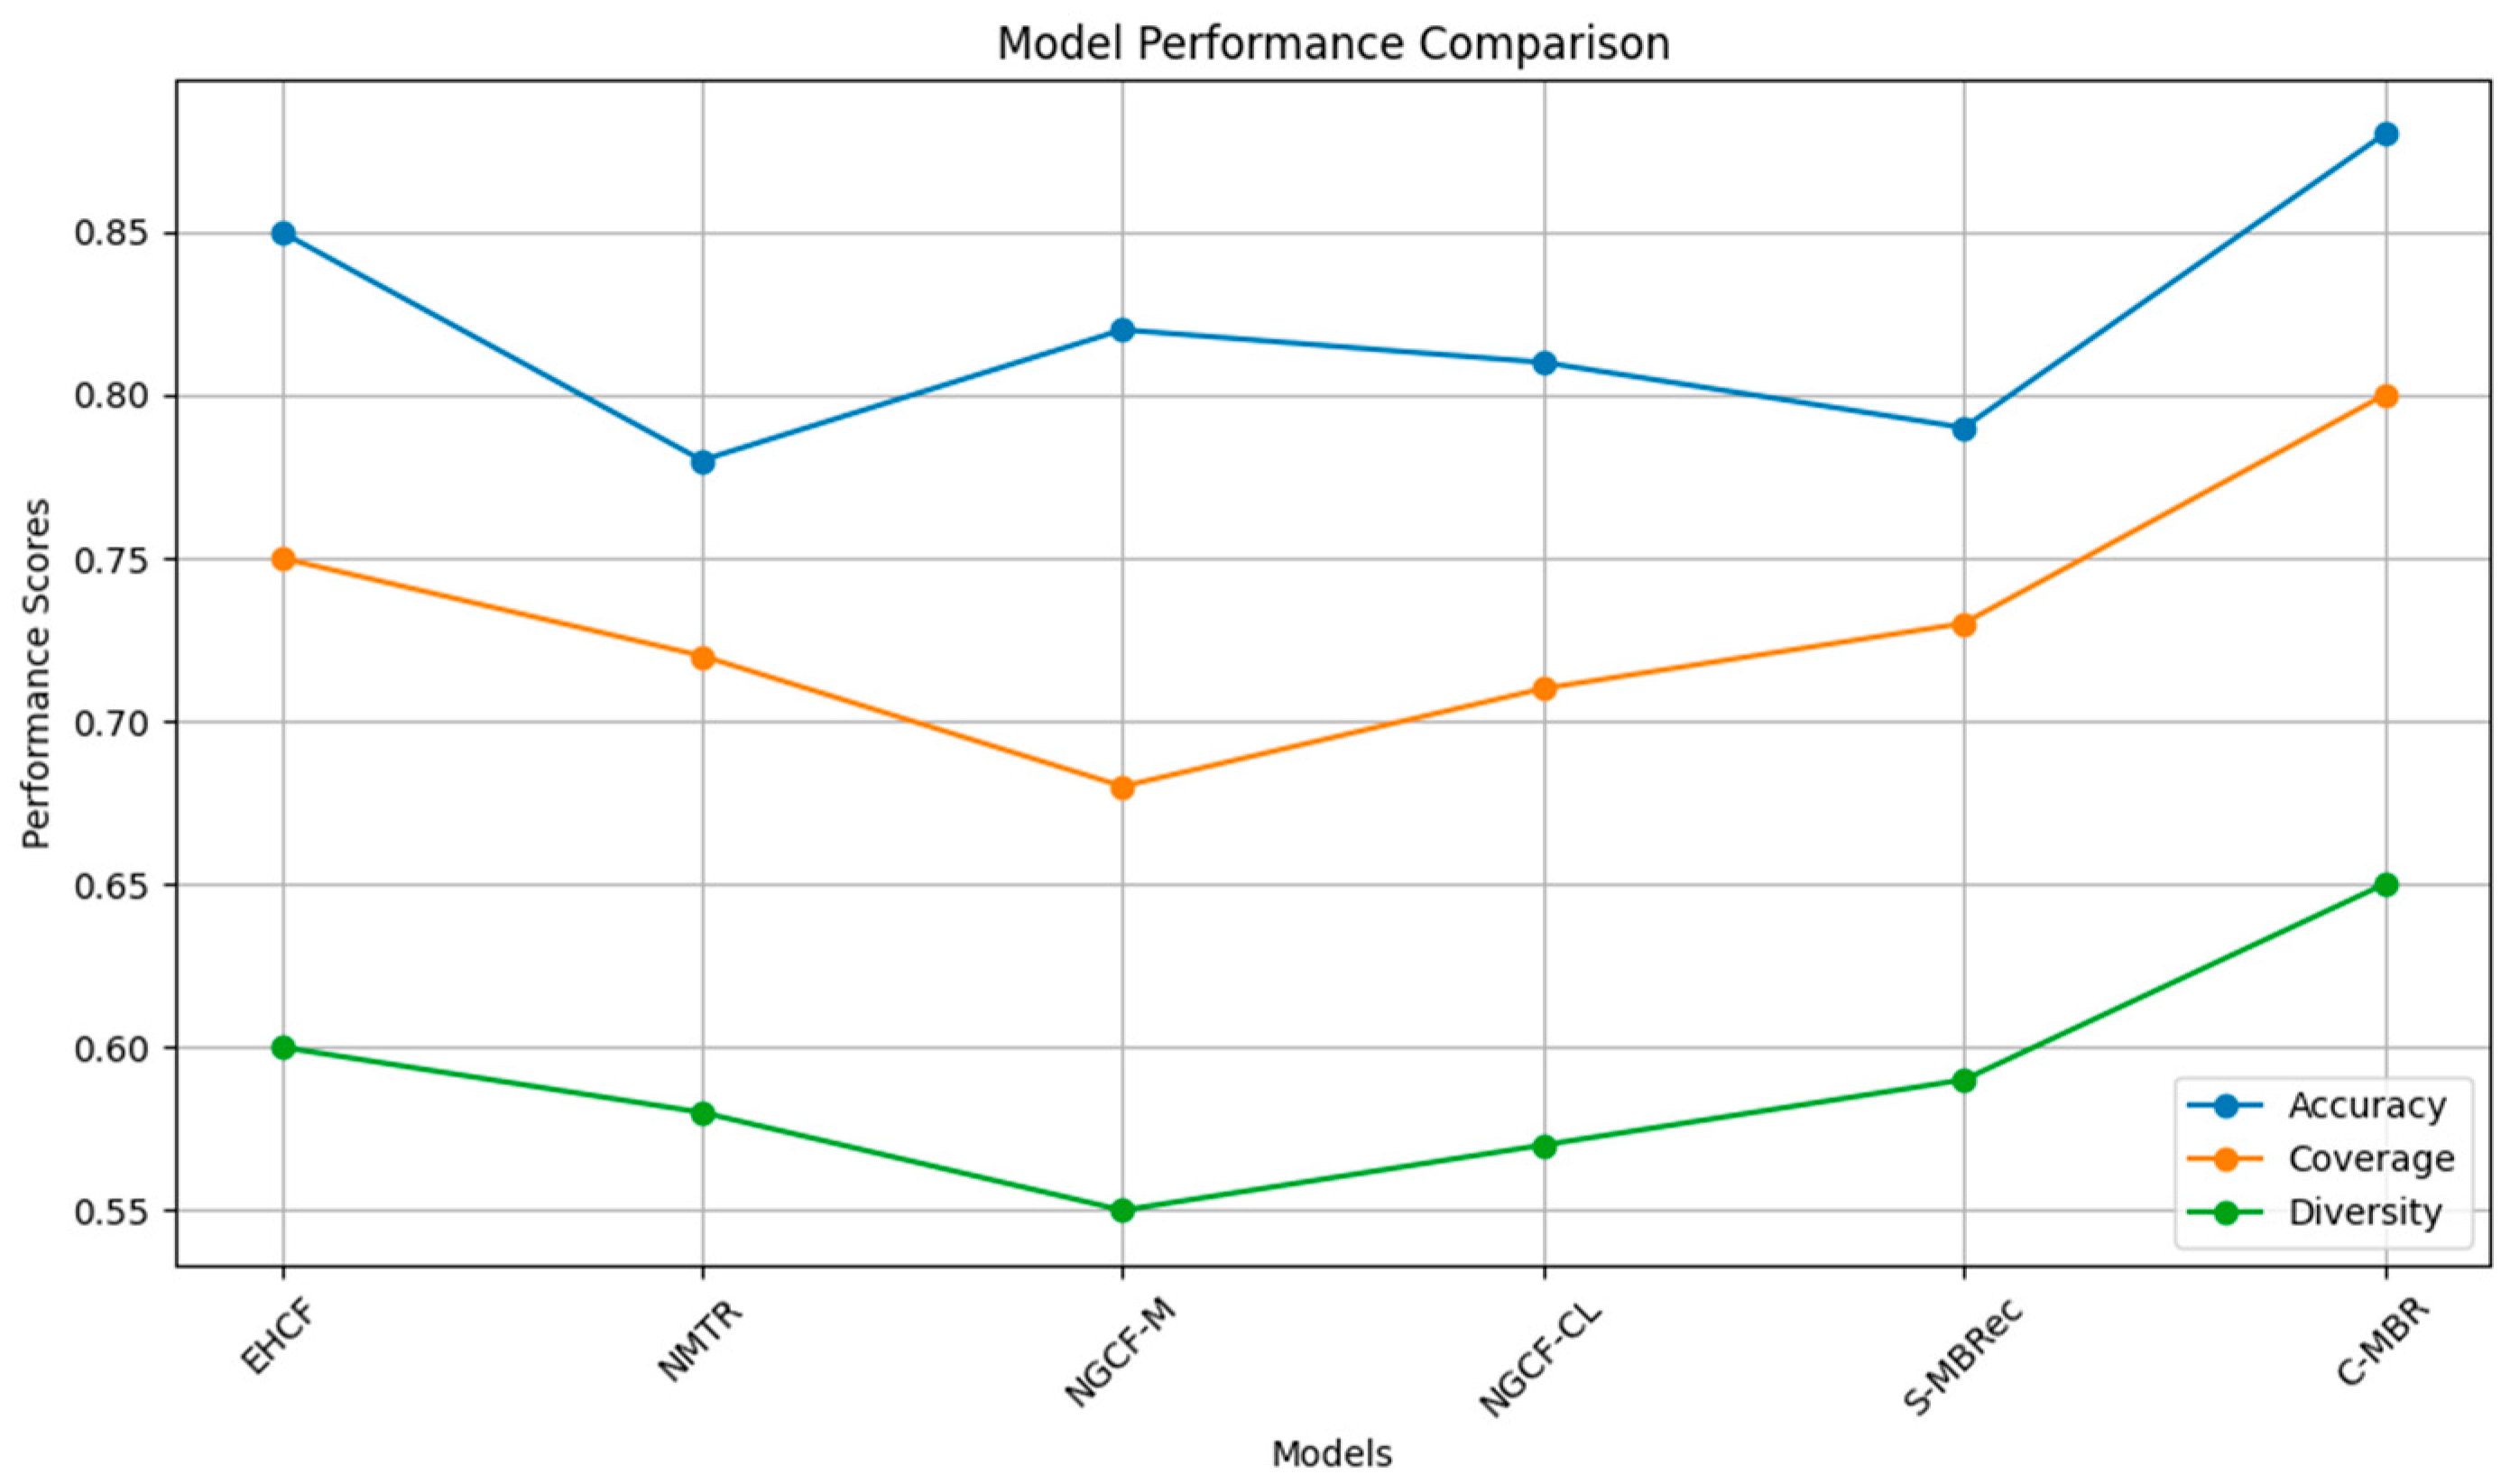
In the recommendation model about the cold start problem, its solution is more difficult, which is due to the interaction behavior between the user and the project being less active, which will lead to the model being constructed, for it cannot achieve the optimal representation, so then it is difficult to recommend the project for the user [31,32,33]. Through the experiment, 1000 users are randomly selected to use the C-MBR model to carry out a comparative learning task analysis on the different behaviors of a low interaction between users and projects, delete the interactions on the training set, carry out ink training for the rest of the users, and recommend projects for the experimental users, to obtain the results of the experiment. The results show that C-MBR has a strong ability to deal with the problem of sparse data, which is because C-MBR can extract the correlation information of the same site in the construction of the global structure module, and improve the value of site recommendation by evaluating the user’s previously interacted sites with the target site using comparative learning, and predicting the final score of the site based on the principle of the similarity phase (see Figure 1). Compared with the ablation experiment, the model performance of C-MBR is significantly enhanced, showing that the C-MBR model can fully apply the information of global structure and local structure in cross-structure comparative learning and multi-behavioral comparative learning to further alleviate the problem of data sparsity.
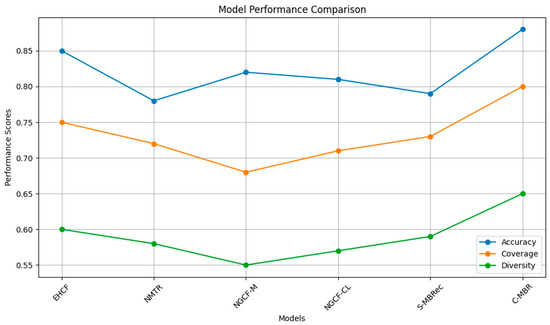
Figure 1.
Cold start problem by model.
5. Discussion
Transportation serves as the backbone of every economy. Maintaining sustainable e-trans infrastructure provides a solid foundation for a robust economy, while also advancing the decarbonization process and effectively addressing the adverse effects of fossil fuel consumption. This is a task proven to be a strategic imperative for many major economies worldwide, including China.
In the endeavor to construct e-trans infrastructure, as mentioned above, establishing a network of charging stations is paramount. To achieve this, scientific research on existing transportation infrastructure, such as road systems, population density, public transportation needs, electric vehicle usage demands, and charging station usage behaviors, among others, is essential. However, charging station networks may be deployed based solely on past experiences, lacking thorough scientific analysis, leading to suboptimal installations. This contributes to one of the factors leading to data sparsity. Additionally, other contributing factors may include the following. (1) Installations in certain regions or areas with low population density and outdated infrastructure may result in fewer opportunities for data collection. (2) Uneven distribution of charging infrastructure: charging infrastructure may be unevenly distributed across different geographic locations, with some areas having more charging stations than others. This non-uniform distribution contributes to data sparsity in regions with fewer charging facilities. (3) Sparse usage patterns: the usage of electric vehicles and charging facilities in various locations may be sparse compared to the density of charging stations available. Electric vehicle owners may not utilize charging stations regularly, resulting in gaps in data collection. (4) Early stage of electric vehicle infrastructure development: the electric vehicle infrastructure is still in its early stages of development, and the adoption of electric vehicles is gradually increasing. Therefore, data on electric vehicle usage and charging behavior may be limited. (5) Challenges in data collection: collecting data on the usage of electric vehicle infrastructure, such as charging sessions and energy consumption, can pose challenges. Issues such as data privacy concerns, technical difficulties with data collection equipment, and interoperability between different charging networks may contribute to data sparsity.
To maintain a robust and sustainable e-trans infrastructure, it is imperative to solve the data sparsity problem, with data management systems being one of the most critical. Without data, other components become paralyzed, rendering the e-trans platform ineffective, impeding operations for platform businesses and retailers, and hindering customer shopping experiences. Creating a robust and sustainable data management platform requires addressing data sparsity and cold start problems. The proposed C-MBR model by the authors contributes to addressing these challenges. As seen in Figure 1, the performance comparison chart of models (EHCF, NMTR, NGCF-M, NGCF-CL, S-MBRec, and C-MBR) illustrates the relationship between performance metrics such as accuracy, coverage, and diversity. C-MBR achieves the highest performance in all three metrics, with the highest accuracy score, coverage score, and diversity score, surpassing those of the remaining models. This indicates that C-MBR demonstrates superior diversification capability while providing extensive coverage and high precision in recommendations. Both NMTR and NGCF-CL also exhibit relatively high performance, whereas other models such as EHCF, NGCF-M, and S-MBRec show lower performance on certain metrics. This provides an overview of the diversity and performance of the models in the recommendation task.
Therefore, compared to previous models that did not focus much on highlighting cross-behavioral comparative and sequence-based cross-behavioral aspects, as well as the issue of sparse data in selecting charging sites, this paper provides the following contributions. Firstly, a thorough investigation into user behavior and embedding it into the training model can help the system separate behaviors more accurately. This is a significant step of the model towards improving training accuracy. Secondly, through integrating a range of techniques for behavior separation into the local and global structural layer-based model during training, along with optimizing the distance from the user to the target site, user choice prediction becomes more accurate and optimal. Finally, based on the training and prediction results, the issue of sparse data is also addressed and reinforced. Consequently, this can assist in establishing additional charging stations. Additionally, regulatory bodies overseeing transportation infrastructure may formulate more tailored infrastructure policies to better align with user behaviors and choices.
6. Conclusions
In summary, based on the introduction and implementation of the C-MBR model, this study has successfully addressed its initial research objective of focusing on the dynamics of user behavioral preferences to tackle the challenges of data sparsity and cold start problems in constructing e-trans infrastructure, especially for charging networks. Consequently, there has been a significant improvement in one of the key components aimed at maintaining a sustainable e-trans infrastructure to enhance resilience in the face of disruptive conditions. Through experimental research, it was found that C-MBR has a strong recommendation value for studying users’ dynamic preferences. In the process of dataset analysis, based on the performance possessed by the HR evaluation index, it can be found that the C-MBR model finally presents data results of higher quality. In the analysis of ablation experiments, it can be found that the C-MBR model has strong comprehensiveness and can effectively improve the quality of comparison. Exploring the analysis of the C-MBR model for the cold start problem, it is found that this model can alleviate the data sparsity problem. Finally, it is shown that the C-MBR proposed in this paper is effective on public datasets.
A notable limitation lies in the reliance on simulated or synthetic data for assessing the model efficacy, which may not fully encapsulate the intricacies of real-world e-trans dynamics. To mitigate this constraint, forthcoming research could concentrate on amassing and scrutinizing extensive real-world datasets to authenticate the models’ efficacy in authentic settings. Furthermore, while the evaluation metrics employed in this study, such as accuracy, coverage, and diversity, are widely acknowledged, they might not comprehensively encompass the resilience and sustainability attributes of e-trans infrastructure. Future investigations could formulate novel assessment metrics that explicitly consider resilience and sustainability factors, such as adaptability to market fluctuations, resilience to disruptions, and environmental impact.
Moreover, the research predominantly focuses on the technical dimensions of model performance, overlooking broader socioeconomic and organizational factors influencing the maintenance of enduring e-trans infrastructure. Subsequent studies could adopt an interdisciplinary approach, amalgamating insights from domains like business management, economics, and environmental science to formulate holistic frameworks for the assessment and fortification of e-trans infrastructure sustainability. In essence, addressing these limitations and pursuing interdisciplinary research trajectories will enrich our comprehension of effectively upholding sustainable e-trans infrastructure and bolstering resilience amidst burgeoning challenges.
From an algorithmic perspective, the cross-behavioral comparative and sequence-based cross-behavioral aspects of the training model have some limitations. Integrating cross-behavioral aspects into the model increases its complexity, which can lead to longer training times and higher computational costs. The interpretation of results becomes more challenging as the model becomes more complex due to the inclusion of cross-behavioral aspects. The effectiveness of cross-behavioral aspects may vary depending on the specific context and dataset used for training. As for applications in other fields, difficulties may arise in adapting cross-behavioral aspects to different domains due to the following reasons. First, behavior patterns and interactions may differ significantly across domains. Data for training models with cross-behavioral aspects may be more difficult in some domains where relevant data are scarce or less accessible. Certain domains may have unique constraints or considerations that affect the applicability of cross-behavioral aspects. Future research may focus on improving training time as well as reducing the complexity of algorithm interpretation. In addition, for the data sparsity, we can consider experimenting with combining techniques such as data augmentation and matrix factorization. This approach aims to generate synthetic data points to increase the size of the dataset and decompose the user–item interaction matrix into lower-dimensional matrices.
Author Contributions
Conceptualization, Z.X.; methodology, Z.X. and C.C.; software, Z.X.; validation, Z.X. and C.C.; formal analysis, Z.X. and C.C.; investigation, Z.X.; resources, Z.X.; data curation, Z.X.; writing—original draft preparation, Z.X. and C.C.; writing—review and editing, Z.X. and C.C.; visualization, C.C.; supervision, Z.X.; project administration, Z.X. All authors have read and agreed to the published version of the manuscript.
Funding
This research received no external funding.
Institutional Review Board Statement
Not applicable.
Informed Consent Statement
Not applicable.
Data Availability Statement
The raw data supporting the conclusions of this article will be made available by the authors on request.
Conflicts of Interest
The authors declare no conflicts of interest.
Nomenclature
| Symbol | Explanation |
| global structure | |
| set of users | |
| set of sites | |
| set of edges | |
| a user | |
| a site | |
| the user–site interaction matrix under the behavior type | |
| behavior type | |
| user–site interaction behavior type | |
| -behavior of user after convolutional propagation in the layer | |
| target behavior in relationship | |
| activation function | |
| behavior of user in relationship | |
| project on relationship | |
| symmetric normalized form to prevent the embedding size from increasing following the increase in graph convolution operation | |
| weight parameter matrix of a particular graph convolution from layer to layer | |
| propagation weight assigned to the user | |
| behavior of site after the convolution propagation at layer | |
| behavior of site in relation to target behavior in relation after the layer of convolutional propagation | |
| interaction site | |
| embedding of interaction site in layer when site performs behavior | |
| set of sites that the user interacts with on the same site | |
| output vector or feature representation for the edge (or possibly the attention score) between nodes and | |
| final representation of the relationship between nodes and | |
| initial features of nodes | |
| initial features of nodes | |
| two-layer MLPs with ReLU activation function | |
| sequence of user interactions with the project in chronological order under behavior | |
| local mechanism module | |
| local structure encoder | |
| output vector or embedding for a specific relationship or context involving entities denoted by and | |
| total of customers | |
| embedding of target behavior based on the given user | |
| embedding of target behavior based on the given user | |
| embedding of target behavior based on the given user | |
| project | |
| comparative loss of each pair of behaviors of the user and the project | |
| cosine similarity function between two behavioral embeddings | |
| temperature coefficient of the softmax function | |
| cross-behavioral comparison learning loss definition | |
| cross-structure comparison learning loss | |
| and | correlation score between the target site v and the target customer u interaction sites under the specified k behaviors |
| diagonal matrix with diagonal elements equal to | |
| set of sites for user under behavior | |
| transpose of the feature vector of , indicating it is used as a row vector for subsequent dot multiplication | |
| feature vector of entity , indicating it is used as a column vector for dot multiplication with | |
| predictive scoring between the target site and the target customer interaction site | |
| a weighting factor that determines the contribution of to the final measure. This might be a hyperparameter that is learned or set during the modeling process | |
| model’s loss function, which is typically optimized during the training process to adjust the model parameters | |
| sigmoid function | |
| chance of all trainable parameters | |
| parameter controlling regularization | |
| overall loss | |
| parameter controlling the proportion of contrast loss | |
| Normalized Discounted Cumulative Gain at rank position N, which is a number between 0 and 1 used to evaluate the quality of the ranking. | |
| Discounted Cumulative Gain at rank position N, which accounts for the relevance and the position of the ranks, giving more weight to the sites at higher positions | |
| Ideal Discounted Cumulative Gain at rank position N, which is the maximum possible DCG value that could be achieved if all the relevant sites were arranged in the best possible order | |
| frequency at which the target site appears within the top N recommendations | |
| a normalization factor to ensure the result is a ratio rather than an absolute number | |
| an indicator function that equals 1 if the recommendation is correct (the target site is among the top recommended sites); otherwise, it equals 0 |
References
- Wirasingha, S.G.; Emadi, A. Classification and Review of Control Strategies for Plug-in Hybrid Electric Vehicles. IEEE Trans. Veh. Technol. 2011, 60, 111–122. [Google Scholar] [CrossRef]
- Ronanki, D.; Kelkar, A.; Williamson, S.S. Extreme Fast Charging Technology—Prospects to Enhance Sustainable Electric Transportation. Energies 2019, 12, 3721. [Google Scholar] [CrossRef]
- Alp, O.; Tan, T.; Udenio, M. Transitioning to Sustainable Freight Transportation by Integrating Fleet Replacement and Charging Infrastructure Decisions. Omega 2022, 109, 102595. [Google Scholar] [CrossRef]
- Asensio, O.I.; Alvarez, K.; Dror, A.; Wenzel, E.; Hollauer, C.; Ha, S. Real-Time Data from Mobile Platforms to Evaluate Sustainable Transportation Infrastructure. Nat. Sustain 2020, 3, 463–471. [Google Scholar] [CrossRef]
- Natarajan, S.; Vairavasundaram, S.; Natarajan, S.; Gandomi, A.H. Resolving Data Sparsity and Cold Start Problem in Collaborative Filtering Recommender System Using Linked Open Data. Expert Syst. Appl. 2020, 149, 113248. [Google Scholar] [CrossRef]
- Nasiri, M.; Minaei, B.; Sharifi, Z. Adjusting Data Sparsity Problem Using Linear Algebra and Machine Learning Algorithm. Appl. Soft Comput. J. 2017, 61, 1153–1159. [Google Scholar] [CrossRef]
- Yang, Y.; Zhang, Y.; Meng, X. A Data-Driven Approach for Optimizing the EV Charging Stations Network. IEEE Access 2020, 8, 118572–118592. [Google Scholar] [CrossRef]
- Helmus, J.R.; Lees, M.H.; van den Hoed, R. A Data Driven Typology of Electric Vehicle User Types and Charging Sessions. Transp. Res. Part C Emerg. Technol. 2020, 115, 102637. [Google Scholar] [CrossRef]
- Metais, M.O.; Jouini, O.; Perez, Y.; Berrada, J.; Suomalainen, E. Too Much or Not Enough? Planning Electric Vehicle Charging Infrastructure: A Review of Modeling Options. Renew. Sustain. Energy Rev. 2022, 153, 111719. [Google Scholar] [CrossRef]
- Ashfaq, M.; Butt, O.; Selvaraj, J.; Rahim, N. Assessment of Electric Vehicle Charging Infrastructure and Its Impact on the Electric Grid: A Review. Int. J. Green Energy 2021, 18, 657–686. [Google Scholar] [CrossRef]
- Lee, J.H.; Chakraborty, D.; Hardman, S.J.; Tal, G. Exploring Electric Vehicle Charging Patterns: Mixed Usage of Charging Infrastructure. Transp. Res. Part D Transp. Environ. 2020, 79, 102249. [Google Scholar] [CrossRef]
- Wang, C.N.; Chung, Y.C.; Wibowo, F.D.; Dang, T.T.; Nguyen, N.A.T. Sustainable Last-Mile Delivery Solution Evaluation in the Context of a Developing Country: A Novel OPA–Fuzzy MARCOS Approach. Sustainability 2023, 15, 2866. [Google Scholar] [CrossRef]
- Wang, C.N.; Nguyen, N.A.T.; Dang, T.T.; Hsu, H.P. Evaluating Sustainable Last-Mile Delivery (LMD) in B2C E-Commerce Using Two-Stage Fuzzy MCDM Approach: A Case Study from Vietnam. IEEE Access 2021, 9, 146050–146067. [Google Scholar] [CrossRef]
- Zuniga-Garcia, N.; Tec, M.; Scott, J.G.; Machemehl, R.B. Evaluation of E-Scooters as Transit Last-Mile Solution. Transp. Res. Part C Emerg. Technol. 2022, 139, 103660. [Google Scholar] [CrossRef]
- Potoglou, D.; Song, R.; Santos, G. Public Charging Choices of Electric Vehicle Users: A Review and Conceptual Framework. Transp. Res. Part D Transp. Environ. 2023, 121, 103824. [Google Scholar] [CrossRef]
- Wang, Z.; Song, C.; Zhang, L.; Zhao, Y.; Liu, P.; Dorrell, D.G. A Data-Driven Method for Battery Charging Capacity Abnormality Diagnosis in Electric Vehicle Applications. IEEE Trans. Transp. Electrif. 2022, 8, 990–999. [Google Scholar] [CrossRef]
- Trinko, D.; Porter, E.; Dunckley, J.; Bradley, T.; Coburn, T. Combining Ad Hoc Text Mining and Descriptive Analytics to Investigate Public Ev Charging Prices in the United States. Energies 2021, 14, 5240. [Google Scholar] [CrossRef]
- Chung, Y.W.; Khaki, B.; Li, T.; Chu, C.; Gadh, R. Ensemble Machine Learning-Based Algorithm for Electric Vehicle User Behavior Prediction. Appl. Energy 2019, 254, 113732. [Google Scholar] [CrossRef]
- Shoman, W.; Yeh, S.; Sprei, F.; Plötz, P.; Speth, D. Battery Electric Long-Haul Trucks in Europe: Public Charging, Energy, and Power Requirements. Transp. Res. Part D Transp. Environ. 2023, 121, 103825. [Google Scholar] [CrossRef]
- Wu, S.; Sun, F.; Zhang, W.; Xie, X.; Cui, B. Graph Neural Networks in Recommender Systems: A Survey. ACM Comput. Surv. 2022, 55, 5. [Google Scholar] [CrossRef]
- Gao, C.; Zheng, Y.; Li, N.; Li, Y.; Qin, Y.; Piao, J.; Quan, Y.; Chang, J.; Jin, D.; He, X.; et al. A Survey of Graph Neural Networks for Recommender Systems: Challenges, Methods, and Directions. ACM Trans. Recomm. Syst. 2023, 1, 1–51. [Google Scholar] [CrossRef]
- Huang, C.; Xu, H.; Xu, Y.; Dai, P.; Xia, L.; Lu, M.; Bo, L.; Xing, H.; Lai, X.; Ye, Y. Knowledge-Aware Coupled Graph Neural Network for Social Recommendation. In Proceedings of the 35th AAAI Conference on Artificial Intelligence, AAAI 2021, Virtual, 2–9 February 2021; Volume 5, pp. 4115–4122. [Google Scholar] [CrossRef]
- Liu, H.; Cai, K.; Li, P.; Qian, C.; Zhao, P.; Wu, X. REDRL: A Review-Enhanced Deep Reinforcement Learning Model for Interactive Recommendation. Expert Syst. Appl. 2023, 213, 118926. [Google Scholar] [CrossRef]
- Gan, M.; Xu, G.; Ma, Y. A Multi-Behavior Recommendation Method Exploring the Preference Differences among Various Behaviors. Expert Syst. Appl. 2023, 228, 120316. [Google Scholar] [CrossRef]
- Abdullah, N.A.; Rasheed, R.A.; Nizam, M.H.; Rahman, M.M. Eliciting Auxiliary Information for Cold Start User Recommendation: A Survey. Appl. Sci. 2021, 11, 9608. [Google Scholar] [CrossRef]
- Mu, X.; Zeng, Z.; Shen, D.; Zhang, B. Multi-Feature Behavior Relationship for Multi-Behavior Recommendation. Appl. Sci. 2022, 12, 2909. [Google Scholar] [CrossRef]
- Sun, F.; Liu, J.; Wu, J.; Pei, C.; Lin, X.; Ou, W.; Jiang, P. Bert4rec: Sequential Recommendation with Bidirectional Encoder Representations from Transformer. In Proceedings of the International Conference on Information and Knowledge Management, Beijing, China, 3–7 November 2019; pp. 1441–1450. [Google Scholar] [CrossRef]
- Wei, W.; Huang, C.; Xia, L.; Xu, Y.; Zhao, J.; Yin, D. Contrastive Meta Learning with Behavior Multiplicity for Recommendation. In WSDM 2022—Proceedings of the 15th ACM International Conference on Web Search and Data Mining, New York, NY, USA, 21–25 February 2022; Association for Computing Machinery: New York, NY, USA, 2022; pp. 1120–1128. [Google Scholar] [CrossRef]
- Li, Y.; Liu, M.; Cao, J.; Wang, X.; Zhang, N. Multi-Attribute Group Decision-Making Considering Opinion Dynamics. Expert Syst. Appl. 2021, 184, 115479. [Google Scholar] [CrossRef]
- Zhang, W. Electric Vehicle Charging Infrastructure in China—Statistics & Facts. Available online: https://www.statista.com/topics/10465/electric-vehicle-charging-infrastructure-in-china/#dossier-chapter4 (accessed on 12 February 2024).
- Chen, J.; Kou, G.; Wang, H.; Zhao, Y. Influence Identification of Opinion Leaders in Social Networks: An Agent-Based Simulation on Competing Advertisements. Inf. Fusion 2021, 76, 227–242. [Google Scholar] [CrossRef]
- Hou, J.; Li, W.; Jiang, M. Opinion Dynamics in Modified Expressed and Private Model with Bounded Confidence. Phys. A Stat. Mech. Its Appl. 2021, 574, 125968. [Google Scholar] [CrossRef]
- Douven, I.; Hegselmann, R. Mis- and Disinformation in a Bounded Confidence Model. Artif. Intell 2021, 291, 103415. [Google Scholar] [CrossRef]
Disclaimer/Publisher’s Note: The statements, opinions and data contained in all publications are solely those of the individual author(s) and contributor(s) and not of MDPI and/or the editor(s). MDPI and/or the editor(s) disclaim responsibility for any injury to people or property resulting from any ideas, methods, instructions or products referred to in the content. |
© 2024 by the authors. Licensee MDPI, Basel, Switzerland. This article is an open access article distributed under the terms and conditions of the Creative Commons Attribution (CC BY) license (https://creativecommons.org/licenses/by/4.0/).