Featured Application
This study explores the potential application of tomato fruit production within the agrivoltaic system, aiming to evaluate its contribution to food security in the context of climate change. Specifically, the study compares tomato cultivation under agrivoltaic conditions with shaded areas created by PV panels to traditional cultivation under full sunlight conditions. The experiments primarily focus on investigating the impact of different watering conditions in both shaded areas and the full sunlight, in order to discern the differences in yield and tomato fruit quality.
Abstract
Climate change, with rising temperatures, water crises, and an increased frequency of climate disturbances, poses a threat to the ability of agroecosystems to ensure human access to food by affecting both the quantity and quality of crop production. Currently, there is growing knowledge about the fact that agrivoltaic systems may represent a direct strategy to cope with climate change driven by carbon dioxide emissions for energy production, preserving the capacity of agroecosystems to maintain food security. The aim of this work was to investigate the impact of environmental conditions generated by photovoltaic (PV) panels for sustaining open-field tomato (Solanum lycopersicum L.) fruit production under varying water supply regimes. Tomato plants were grown beneath PV panels or in full sunlight. In each scenario, two plots with an equal number of plants were subjected to different irrigation levels: high watering (HW) and low watering (LW). The results showed a lower number of tomato fruit produced grown under the PV panels, with an increased fruit size and water content under a normal water supply. The Brix degrees of the tomato fruits grown under the panel were more comparable to the fruits commercially available on the market than the Brix degree of the fruits grown in open-field sunlight. Thus, our data supported the conclusion that the agrivoltaic system, in the context of climate change with the enduring drought and long-term water scarcity, can be a good adaptation strategy to maintain favorable tomato production compared to the full sunlight conditions. Furthermore, these results can be important for planning breeding programs, since in many cases, the tomato fruits grown in full sunlight were seedless.
1. Introduction
The agroecosystem involves the dynamic interplay between natural resources and human-derived capital, encompassing human efforts and technologies devoted to increase our overall well-being [1,2,3,4]. It has a primary role to support food security, ensuring universal access to a sufficient and safe supply of nutritious food that adheres to the quality parameters promoting human health [5]. This perspective integrates crucial factors such as food availability, quality, accessibility, and utilization, aiming to maintain stability over time [6,7], aligning with the UN goals to alleviate hunger, malnutrition, and the related issues [5].
Farmers face challenges posed by changing meteorological events, including floods, heatwaves, fires, drought, and shifts in soil conditions [4,8,9]. These events force agricultural crop species to undergo adaptations, potentially influencing ecosystem services crucial for food security. However, the implementation of adaptation measures, like drought escape and dehydration avoidance, may have adverse consequences on crop yields and the quality of edible products [4,10,11,12,13]. Despite these challenges, farmers have the potential to mitigate the effects of climate change on crops by implementing specific agricultural strategies. These include optimizing irrigation and fertilization practices, diversifying crops and selecting resilient varieties, refining fertilization practices, and adopting protective measures (e.g., greenhouses and tunnels) along with implementing precision agriculture [4,14,15]. In this context, agrivoltaic systems emerge as a promising solution for sustainable crop production and the efficient use of water resources in the face of climate change. These systems integrate renewable energy production and crop cultivation within the same space, using photovoltaic (PV) panels either elevated above the ground or integrated into shade-like structures [16,17,18,19]. The agrivoltaic system can be defined as a hybrid-based solution (H-bS) combining human infrastructure into the agroecosystem with positive impacts on ecosystem services [20].
Positioning PV panels above specific crops provides benefits such as reduced leaf evapotranspiration, enhanced water use efficiency, and temperature regulation. Additionally, their shade helps maintain soil moisture balance, promoting optimal conditions for plant growth [16,20,21,22,23]. However, the extent of these advantages and the adaptability of crops to thrive and be productive beneath the PV panels vary among species. Indeed, there is substantial documentation indicating that when plants are exposed to shade, the net photosynthetic rate of leaves increases substantially, leading to a rapid closure of stomata [24]. This shading-induced decline in photosynthetically active radiation (PAR), encompassing light in the 400–700 nm range, can trigger the adaptive response known as the shade avoidance syndrome (SAS) [25,26]. SAS signifies the vegetation’s proactive response to low light availability, often a prodromal sign of imminent resource-dependent competition, and triggers physiological mechanisms that enhance plant capability to thrive in a competitive environment, including increased stem elongation, reduced branching, and early seed production. The consequences of SAS for crop production can vary depending on environmental conditions, natural resources, and the topography of vegetation [20,27,28]. Understanding these factors is crucial for optimizing the benefits of agrivoltaic systems in terms of their impact on plant growth and overall agricultural productivity.
The impact of shading in agrivoltaic systems depends on several factors, including plant species, environmental conditions, and crop management practices. Shading may result in increased production in certain cases, but its effects can be negative or negligible under different conditions [29,30]. In terms of food production, SAS could offer advantages for certain crops harvested for leaves, stems, or roots [28]. For example, studies have confirmed that the shade cast by PV panels can increase edible biomass production in chicory and lettuce [20,21,31].
The growth patterns of crops cultivated in agrivoltaic systems exhibit variability, necessitating comprehensive studies to understand the implications for food security in relation to specific locations, crop types, and employed technologies. Certain agronomic crops may prove more suitable for integration with PV panels than others. Therefore, it is crucial to assess the impact of shade generated by PV panels on different crops and locations, particularly in areas where climate change leads to diminished water availability and an increasing frequency of heatwaves.
The aim of this paper is to explore the potential of agrivoltaic systems in optimizing land use efficiency, concurrently addressing energy production, food security, water resource utilization, and human capital investment in the context of climate change.
Our research specifically delves into the influence of shade generated by PV panels on tomato. This crop was selected due to its global prevalence and commercial significance, as well as its vital role in human diets. Tomatoes are widely cultivated and consumed across the world, both fresh and in various cooked dishes, sauces, and salads. In Italy, the yellow datterino cultivar has gained widespread popularity in gastronomy due to its sweeter flavor profile compared to traditional red tomatoes. Italy is a major producer and consumer of tomato fruit, which holds significant economic value in the food market, surpassing other fruit-bearing vegetable crops in demand and market appeal. Therefore, integrating tomatoes into agrivoltaic systems presents a compelling area of interest and potential. This study seeks to assess the potential impact of shade provided by agrivoltaic systems on maintaining food security under different water availability conditions, comparing the outcomes with tomatoes grown in open fields within the same areas.
Our analysis primarily focuses on evaluating food security by measuring crop productivity, particularly the biomass and the quality of tomato fruits produced under varying conditions of sunlight exposure (whether under full sunlight or PV panels) with different water supplies.
2. Materials and Methods
2.1. Conditions of Plant Growth
The present study took place in the Apulia region, southern Italy, specifically on a PV farm situated in the province of Lecce at coordinates Y: 40.306792° and X: 18.021823° (WGS84). The experimental area comprised an open-field cultivation space, allowing us to expose the crop to two distinct lighting exposures: one under full sunlight and the other in the shadow of the PV panels.
The PV panels were oriented with solar exposure toward the South–North and did not present the typical height from the ground commonly associated with agrivoltaic systems designed for machine-assisted cultivation. However, such an unconventional setup was chosen for an initial assessment of the diverse sun exposures that tomato plants undergo during their growth beneath the PV panels.
Tomato (Solanum lycopersicum L.) certified seeds of the yellow date cultivar Dolly, used in this study, were sourced from the Botanical Garden of the University of Salento in Lecce, Italy. After soaking in running tap water for 2–3 h, the seeds were planted individually in 5 L plastic pots, all filled with the same commercial soil to ensure similar initial soil moisture and nutrient levels. The germination process took place in a controlled growth chamber, maintaining conditions at 22 °C temperature, 60% humidity, 25 μE light intensity, and a photoperiod of 16 h light and 8 h darkness. Following germination, a total of 24 tomato seedlings were transplanted into pots at the end of June 2023. Out of these, 12 seedlings were placed in plots exposed to full sun, while the remaining 12 were grown in shaded plots beneath the PV panels.
In each plot, the plants were further divided into two groups, each consisting of 6 tomato plants. These groups were subjected to different watering regimes. The watering process involved manually pouring 1000 mL of water every 2 days for each plant, using a graduated cylinder (Table 1).

Table 1.
Summary of the experimental design. For each treatment, six tomato plants were used. High and low watering regimes correspond to 1000 mL and 500 mL of water every 2 days, respectively.
This equated to a total of 35 L for the high-water group, supplied either in the light (HW-control) or in the shade (HW-PV panel). Similarly, the low-water group received 500 mL of water applied to each plant every 2 days using a graduated cylinder, resulting in a total of 17.5 L for plants in the light (LW-control) or shade (LW-PV panel) (Figure 1). After 75 days from sowing, tomato fruits within the full ripening stage, identified by their bright and uniformly yellow-orange color upon visual assessment, were harvested from the 6 plants within each different water supply group for yield determination and subsequent analyses.
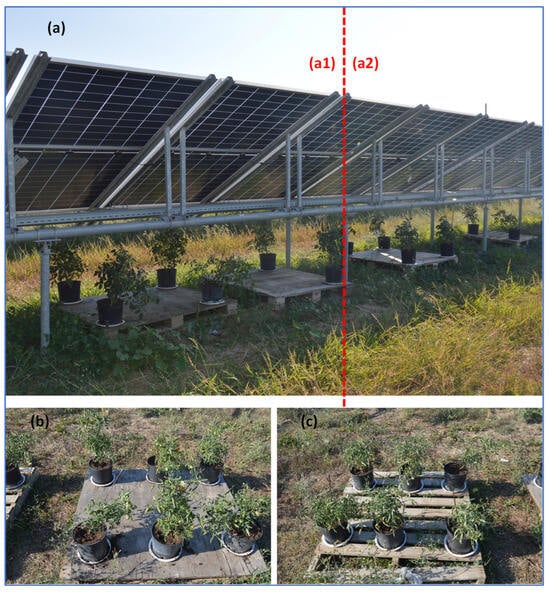
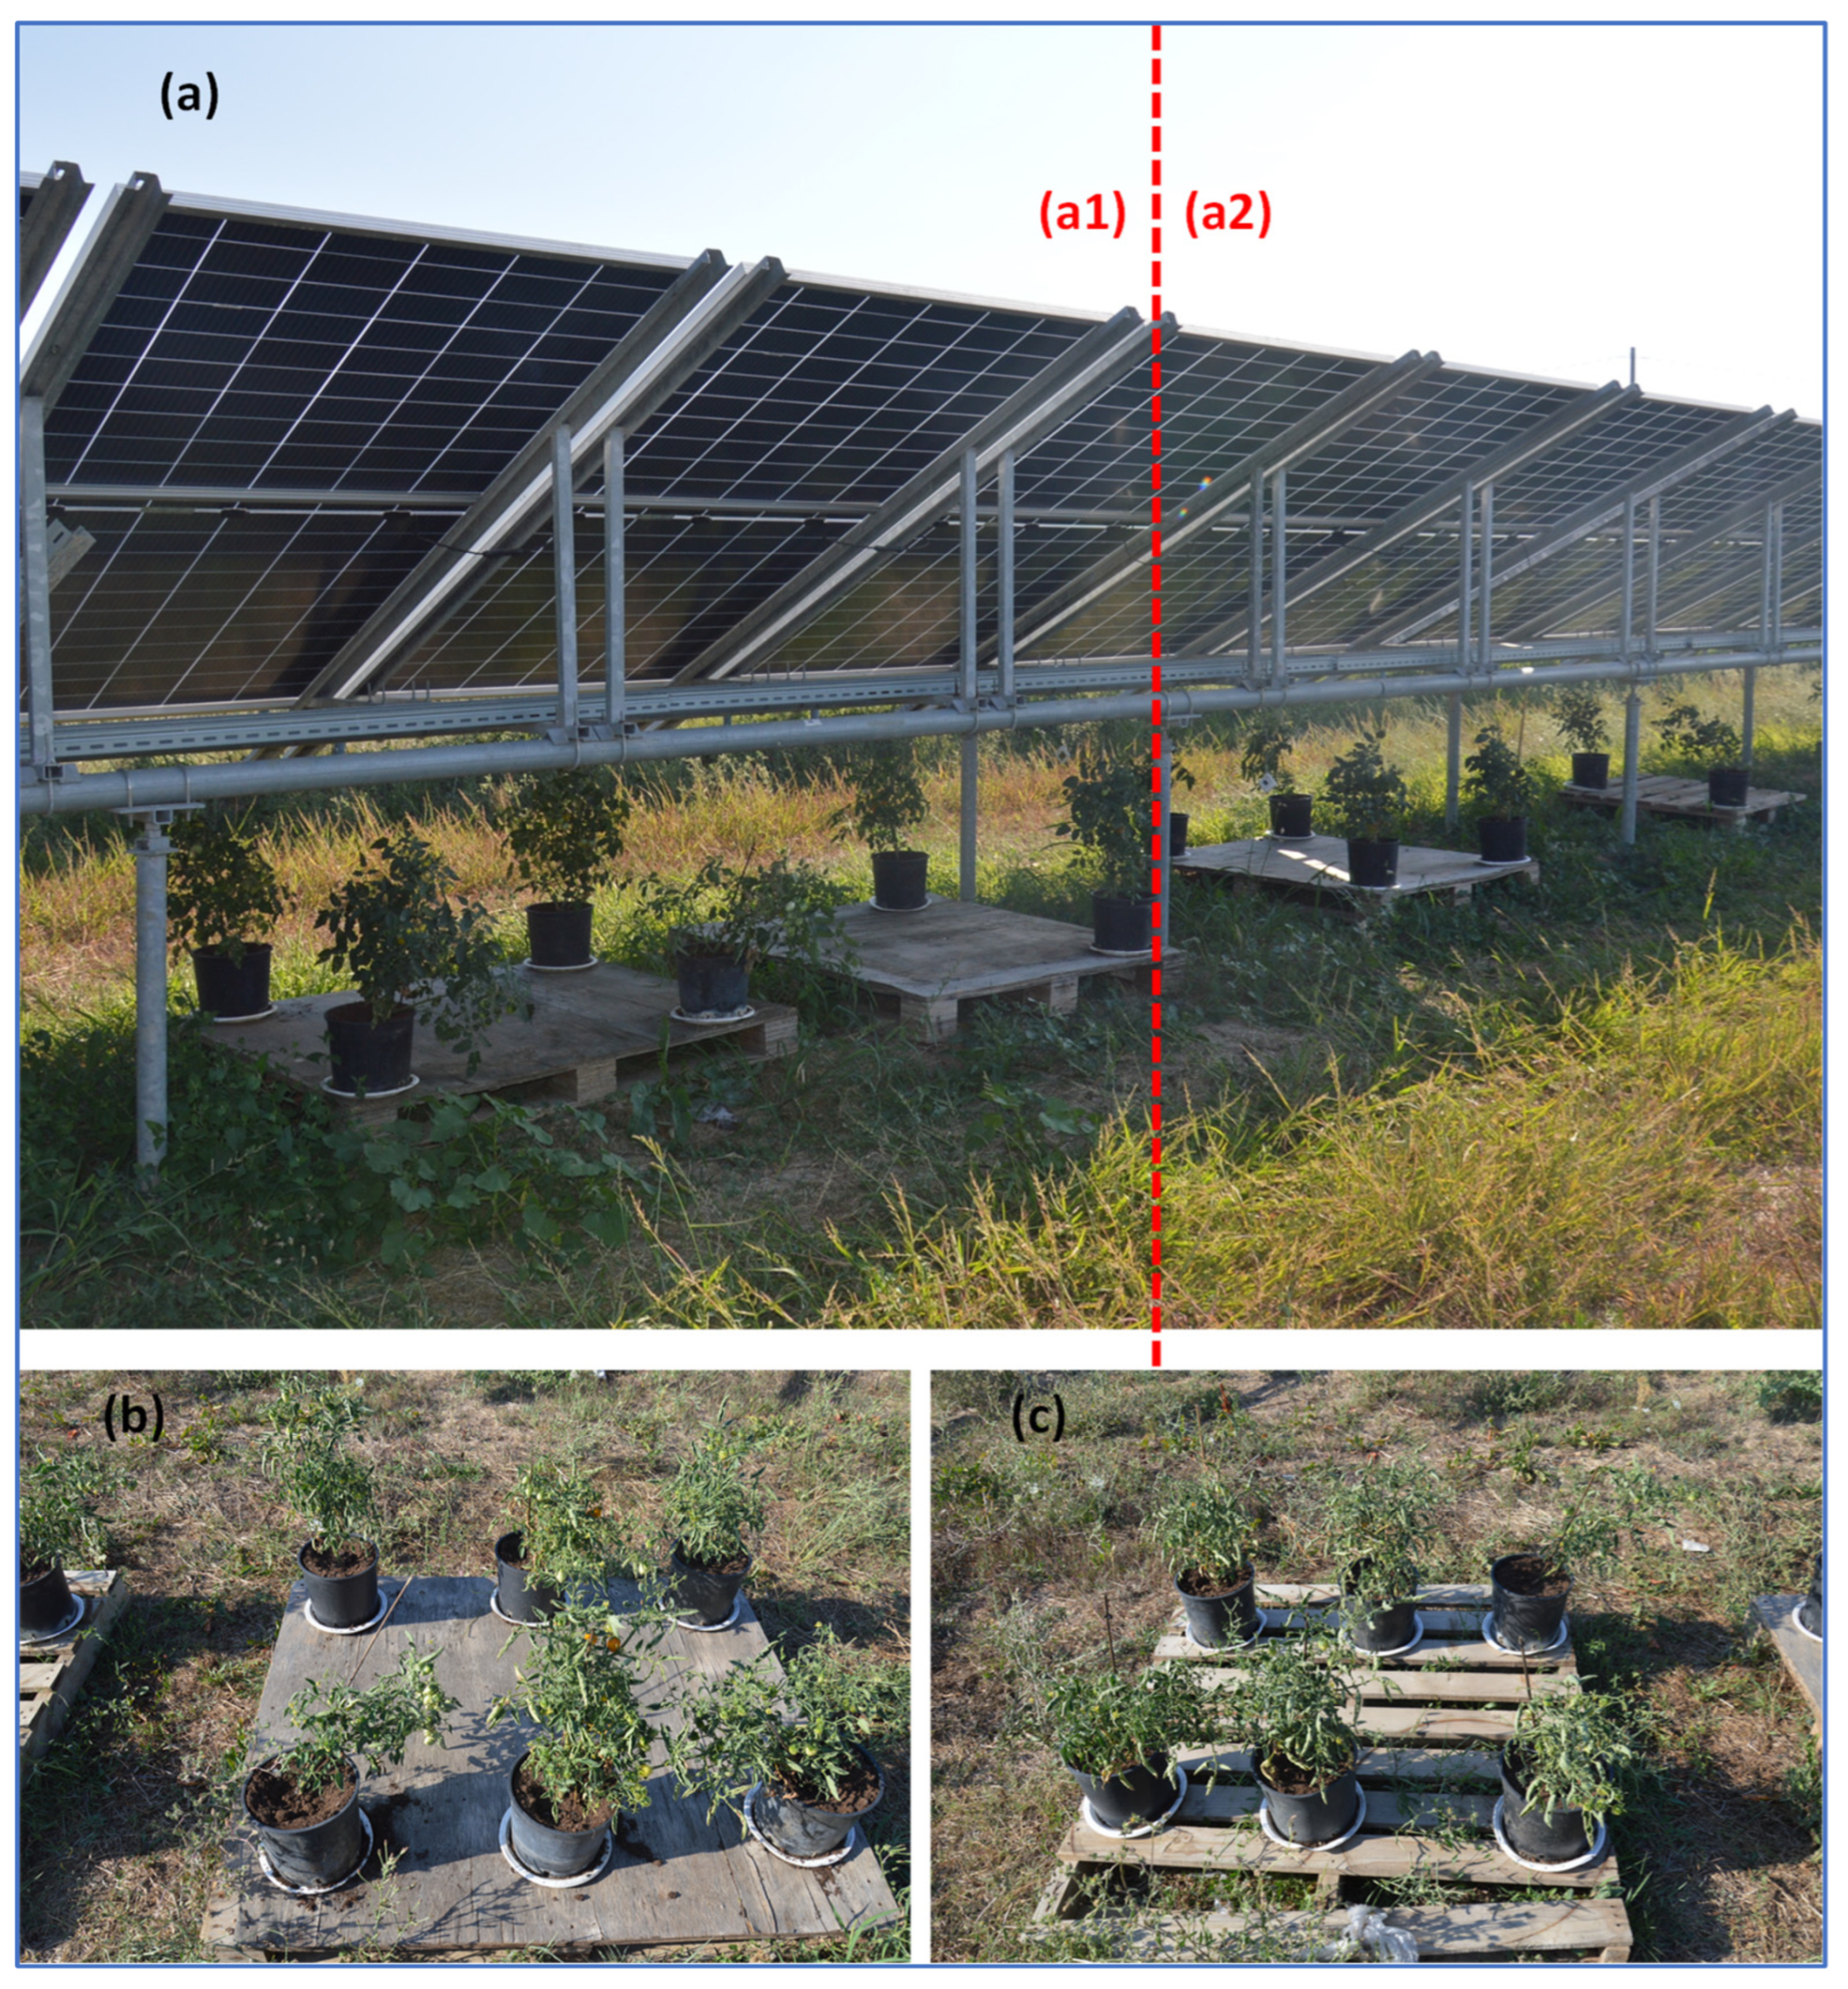
Figure 1.
Layout of tomato plots exposed to both open-field sunlight and shade beneath the panels in the same area: (a) Tomato plants positioned beneath PV panels. The dotted red line shows the two groups of plants with different water availabilities ((a1): HW-PV panel; (a2): LW-PV panel). (b) Tomato plants grown in the control (open-field sunlight) plots under high water supply (HW-Control) conditions. (c) Tomato plants of the control plots with a low water supply (LW-Control).
2.2. Yield, Morphometric, and Quality Analyses
The yield of ripe tomatoes under different experimental conditions was assessed by measuring the fresh weight (fw) of the sampled fruits immediately after harvesting using an analytical balance. Additionally, morphometric parameters, specifically the mean of the major and minor axes, were measured with a caliper.
The quality of each sampled tomato fruit was analyzed by measuring the soluble solids content (including sugars, carbohydrates, and organic acids, also known as Brix degrees) [32,33] by using an NR151 digital refractometer (Auxilab, Beriáin, Navarra, Spain). The water content and dry weight (dw) of tomatoes were measured gravimetrically using 1.0 g homogenized aliquots (three independent replicates) for each sample. The samples were dried at 105 °C until a constant weight was achieved, employing a Büchi TO-50 infrared dryer (Büchi Labortechnik AG, Postfach, Switzerland). The morphology, Brix degrees (°Bx), and average water content were compared to those of the same variety of tomato fruits available in a local supermarket to identify any differences with commercial standards.
The diverse environmental conditions among the plant plots were identified by regularly measuring the air temperature and humidity in the immediate vicinity of the plants, as well as the soil moisture and temperature within the pot of each plant.
2.3. Statistical Analysis
Statistical analysis was carried out by using PAST software. (Version 2.17) The mean and standard deviation (SD) were calculated for each analyzed parameter. The normality of data distribution was assessed using the Shapiro–Wilk test [34,35,36]. Statistical differences among the means of the four groups (HW-Control, LW-Control, HW-PV panel, LW-PV panel) were determined by conducting pairwise comparisons using Student’s t-test.
3. Results
3.1. Tomato Fruit Yield Grown under Different Light Exposures and Watering Regimes
The total number of fruits harvested from each of the four tomato plant groups was consistently higher in the control samples than in the PV panel plots, regardless of the water supply levels. Specifically, we harvested a total of 248 fully ripe fruits from the HW-Control, 158 from the LW-Control, 111 from the HW-PV panel, and 107 from the LW-PV panel plots. The calculated yield per plant stood at 0.283 ± 0.032 kg for the HW-Control group and 0.157 ± 0.012 kg for the LW-Control group. Similarly, the HW- and LW-PV panel groups achieved yields of 0.201 ± 0.044 kg and 0.148 ± 0.023 kg, respectively (Figure 2).
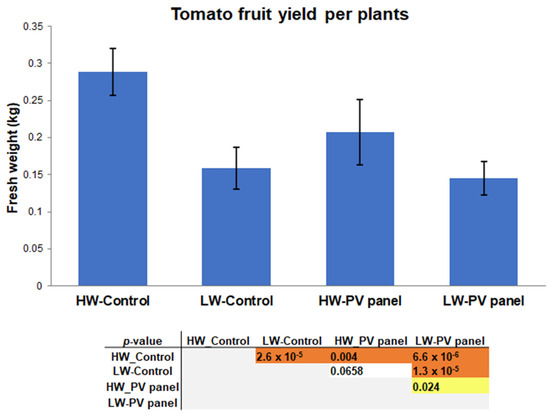
Figure 2.
Yield per plants of tomato fruits harvested in the control and PV panel groups. In the table, colored boxes denote statistically significant differences (yellow, p < 0.05; dark orange, p < 0.001) whereas, the colorless boxes represent non-significant differences. HW-Control: tomato fruits grown under control conditions with a high water supply; LW-Control: tomato fruits grown under control conditions with a low water supply; HW-PV panel: tomato fruits grown under PV panels with a high water supply; LW-PV panel: tomato fruits grown under PV panels with a low water supply.
Remarkably, we observed that tomato plants cultivated under the PV panels exhibited a faster rate of fruit development compared to their counterparts in the control plots. Indeed, around 20 days after the seedlings’ transplantation, all plants beneath the shadow of the panels initiated fruit production, whereas only half of the plants grown in the control plots had started bearing fruit by that date.
3.2. Morphometric Features and Tomato Fruit Quality Assessment
Tomato fruit fw and size were higher in the plants grown under the PV panels than in the control plots, regardless of the water supply. Specifically, the average fw of the tomato fruits from plants under the PV panels reached 10.9 ± 2.5 g with high watering (HW-PV panel), while it was 8.3 ± 1.9 g with reduced watering (LW-PV panel). In contrast, HW- and LW-Control tomato fruits had an average fw of 6.9 ± 1.7 g and 6.0 ± 1.4 g, respectively (Figure 3).
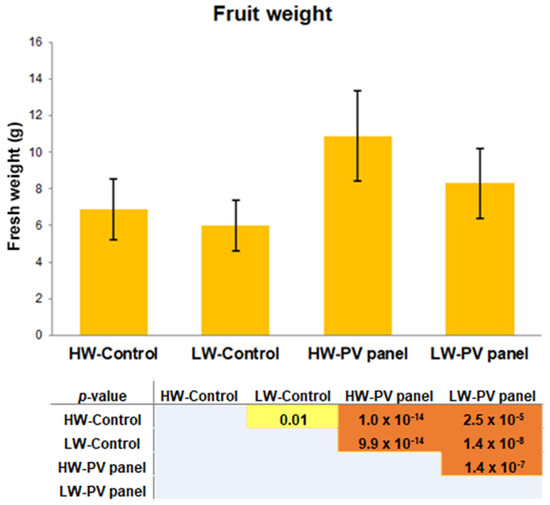
Figure 3.
Average fresh weight (mean ± SD) of tomato fruits collected from the control and the PV panel groups. In the table, colored boxes denote statistically significant differences (yellow, p < 0.05; dark orange, p < 0.001). HW-Control: tomato fruits grown under control conditions with a high water supply; LW-Control: tomato fruits grown under control conditions with a low water supply; HW-PV panel: tomato fruits grown under PV panels with a high water supply; LW-PV panel: tomato fruits grown under PV panels with a low water supply.
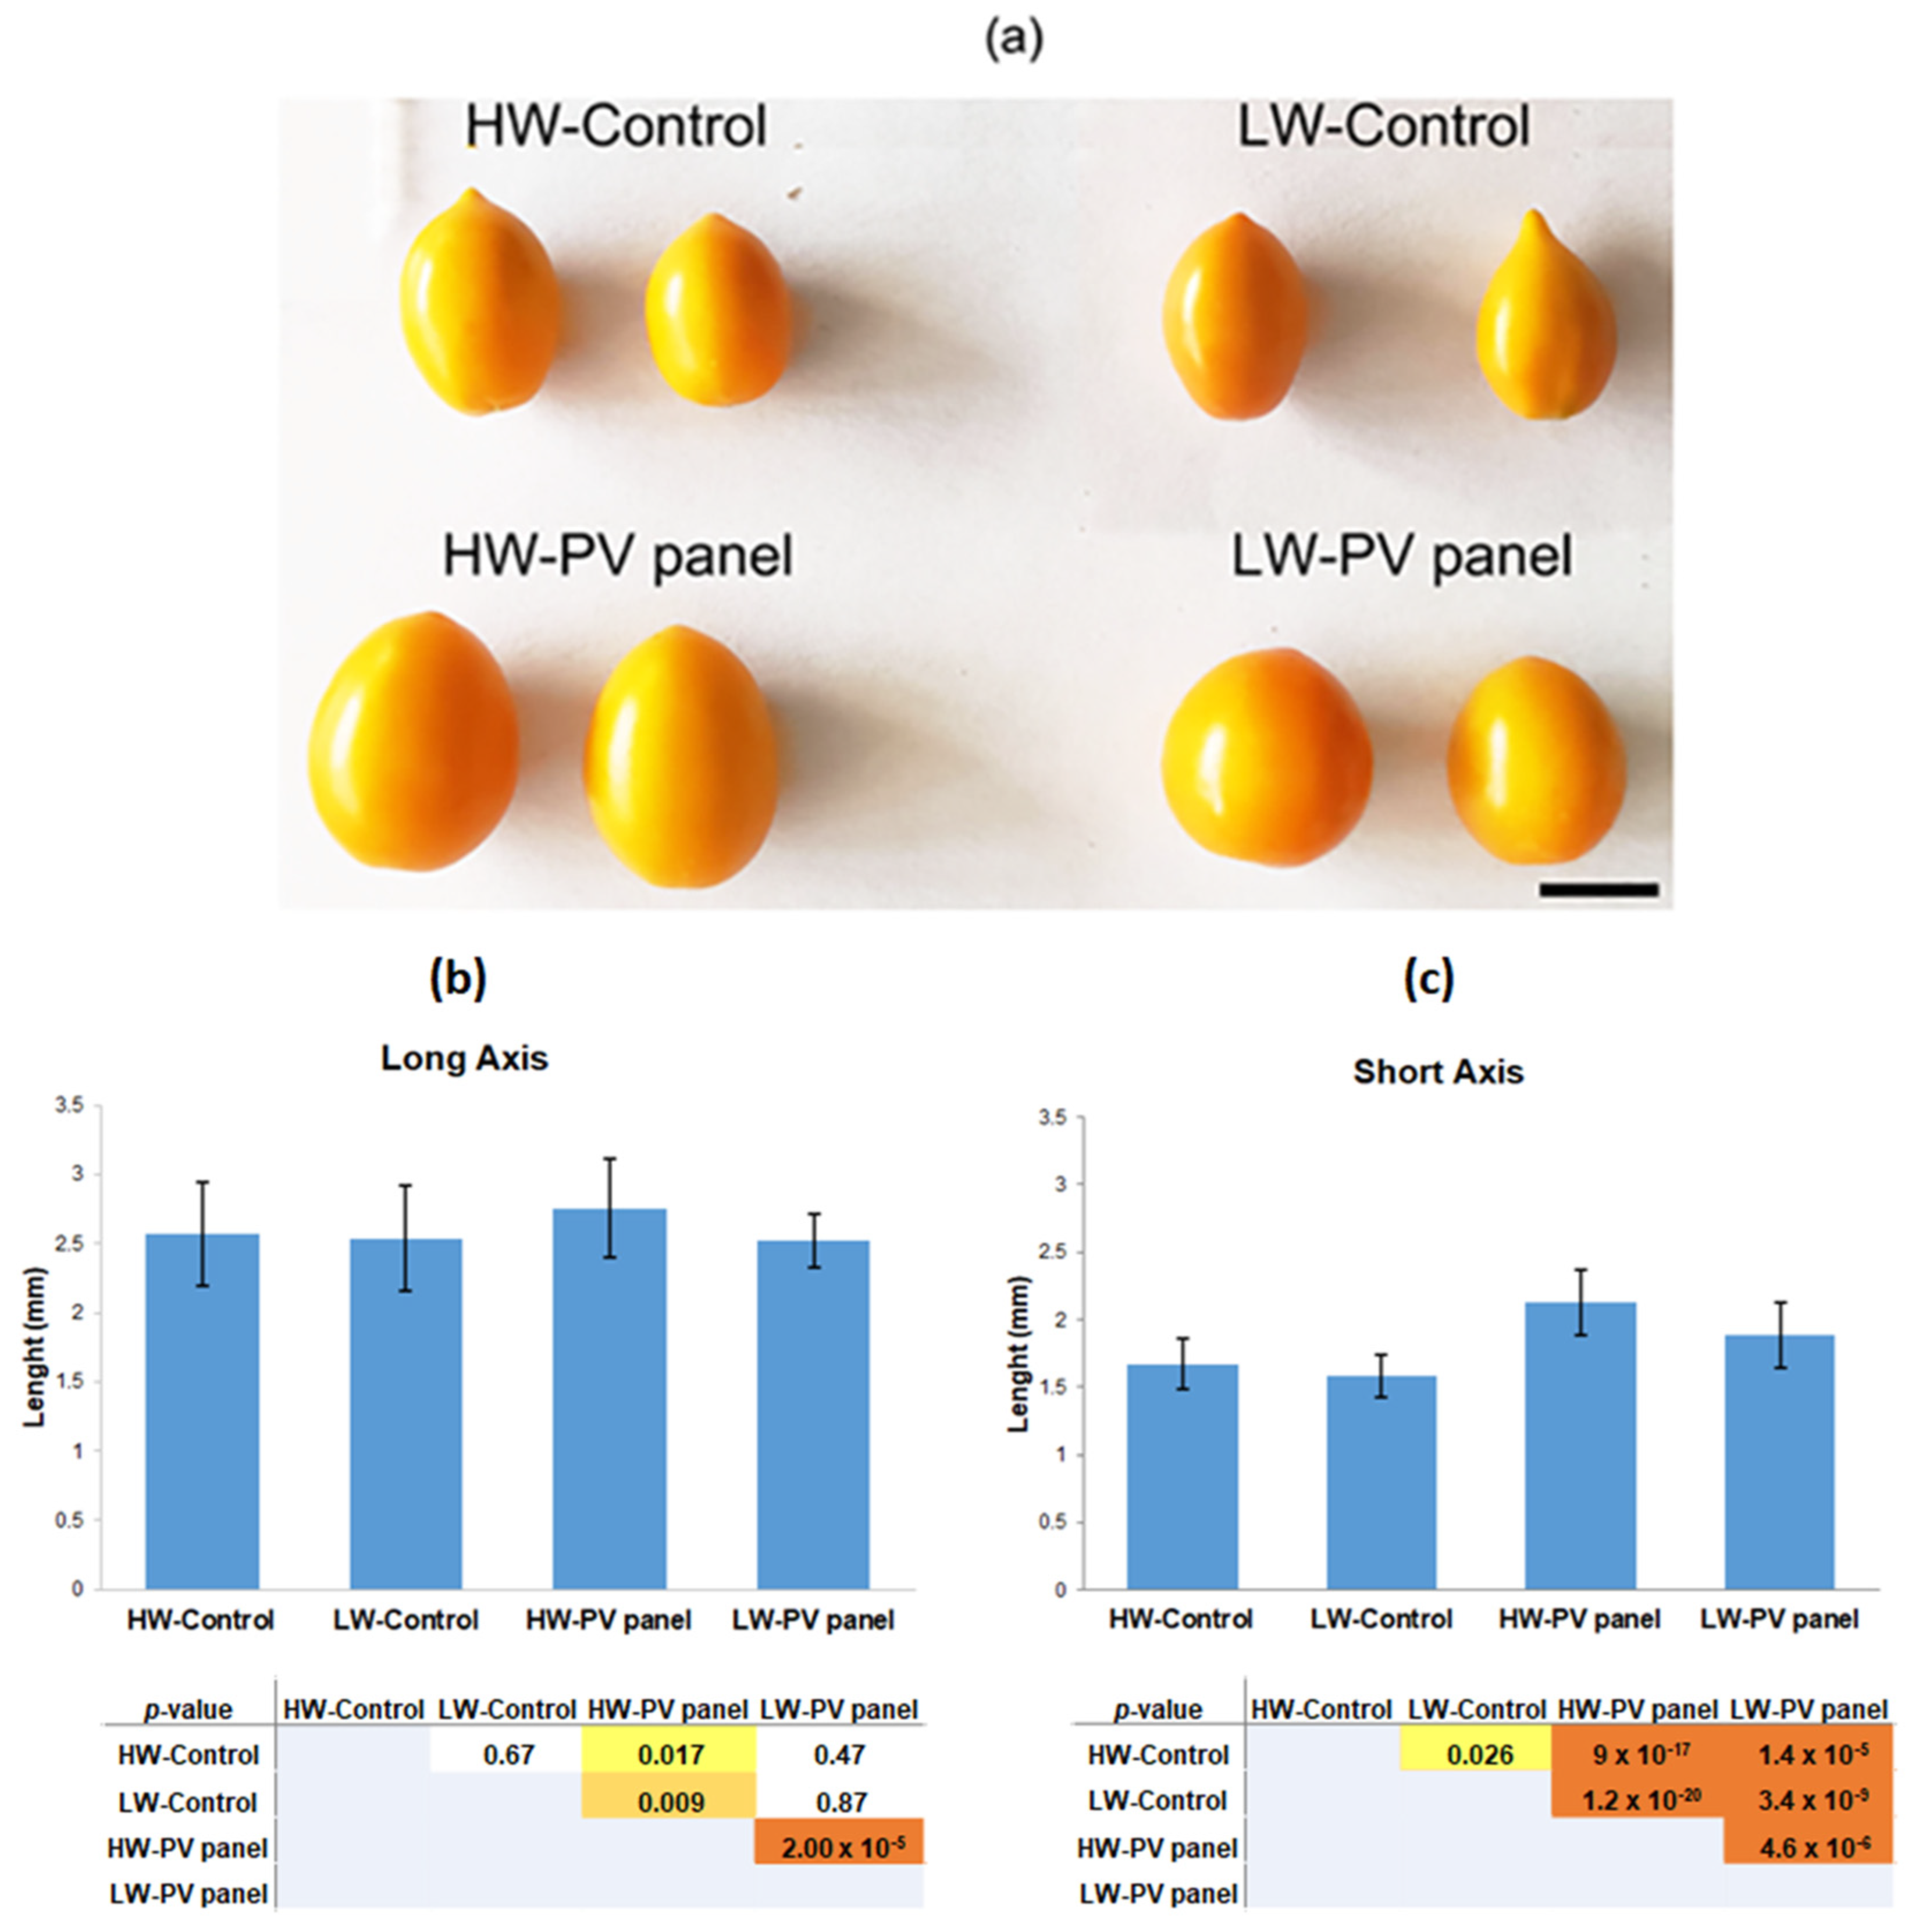
The most visually apparent impact of treatments in the morphology of tomato fruits was linked to their diameter (Figure 4a). Indeed, statistically significant differences were observed in the short axis values, with the HW-PV panel group exhibiting the highest values, followed by the LW-PV panel group (Figure 4b). Conversely, no statistical differences were detected in the long axis among groups, except for the HW-PV panel group showing a significantly greater long axis dimension (Figure 4c).

Figure 4.
Representative images of tomato fruits ripened under PV panel shadow with high (HW-PV panel) or reduced watering (LW-PV panel), and ripened in full sunlight with a high (HW-Control) or low (LW-Control) water supply (a). Graphical representation and statistical analysis of the average length (mean ± SD) of the short axis (b) and the long axis (c) of tomato fruits. In the tables, colored boxes denote statistically significant differences (yellow, p < 0.05; light orange, p < 0.01; dark orange, p < 0.001). Colorless boxes indicate the absence of statistically significant differences. Scale bar = 1 cm.
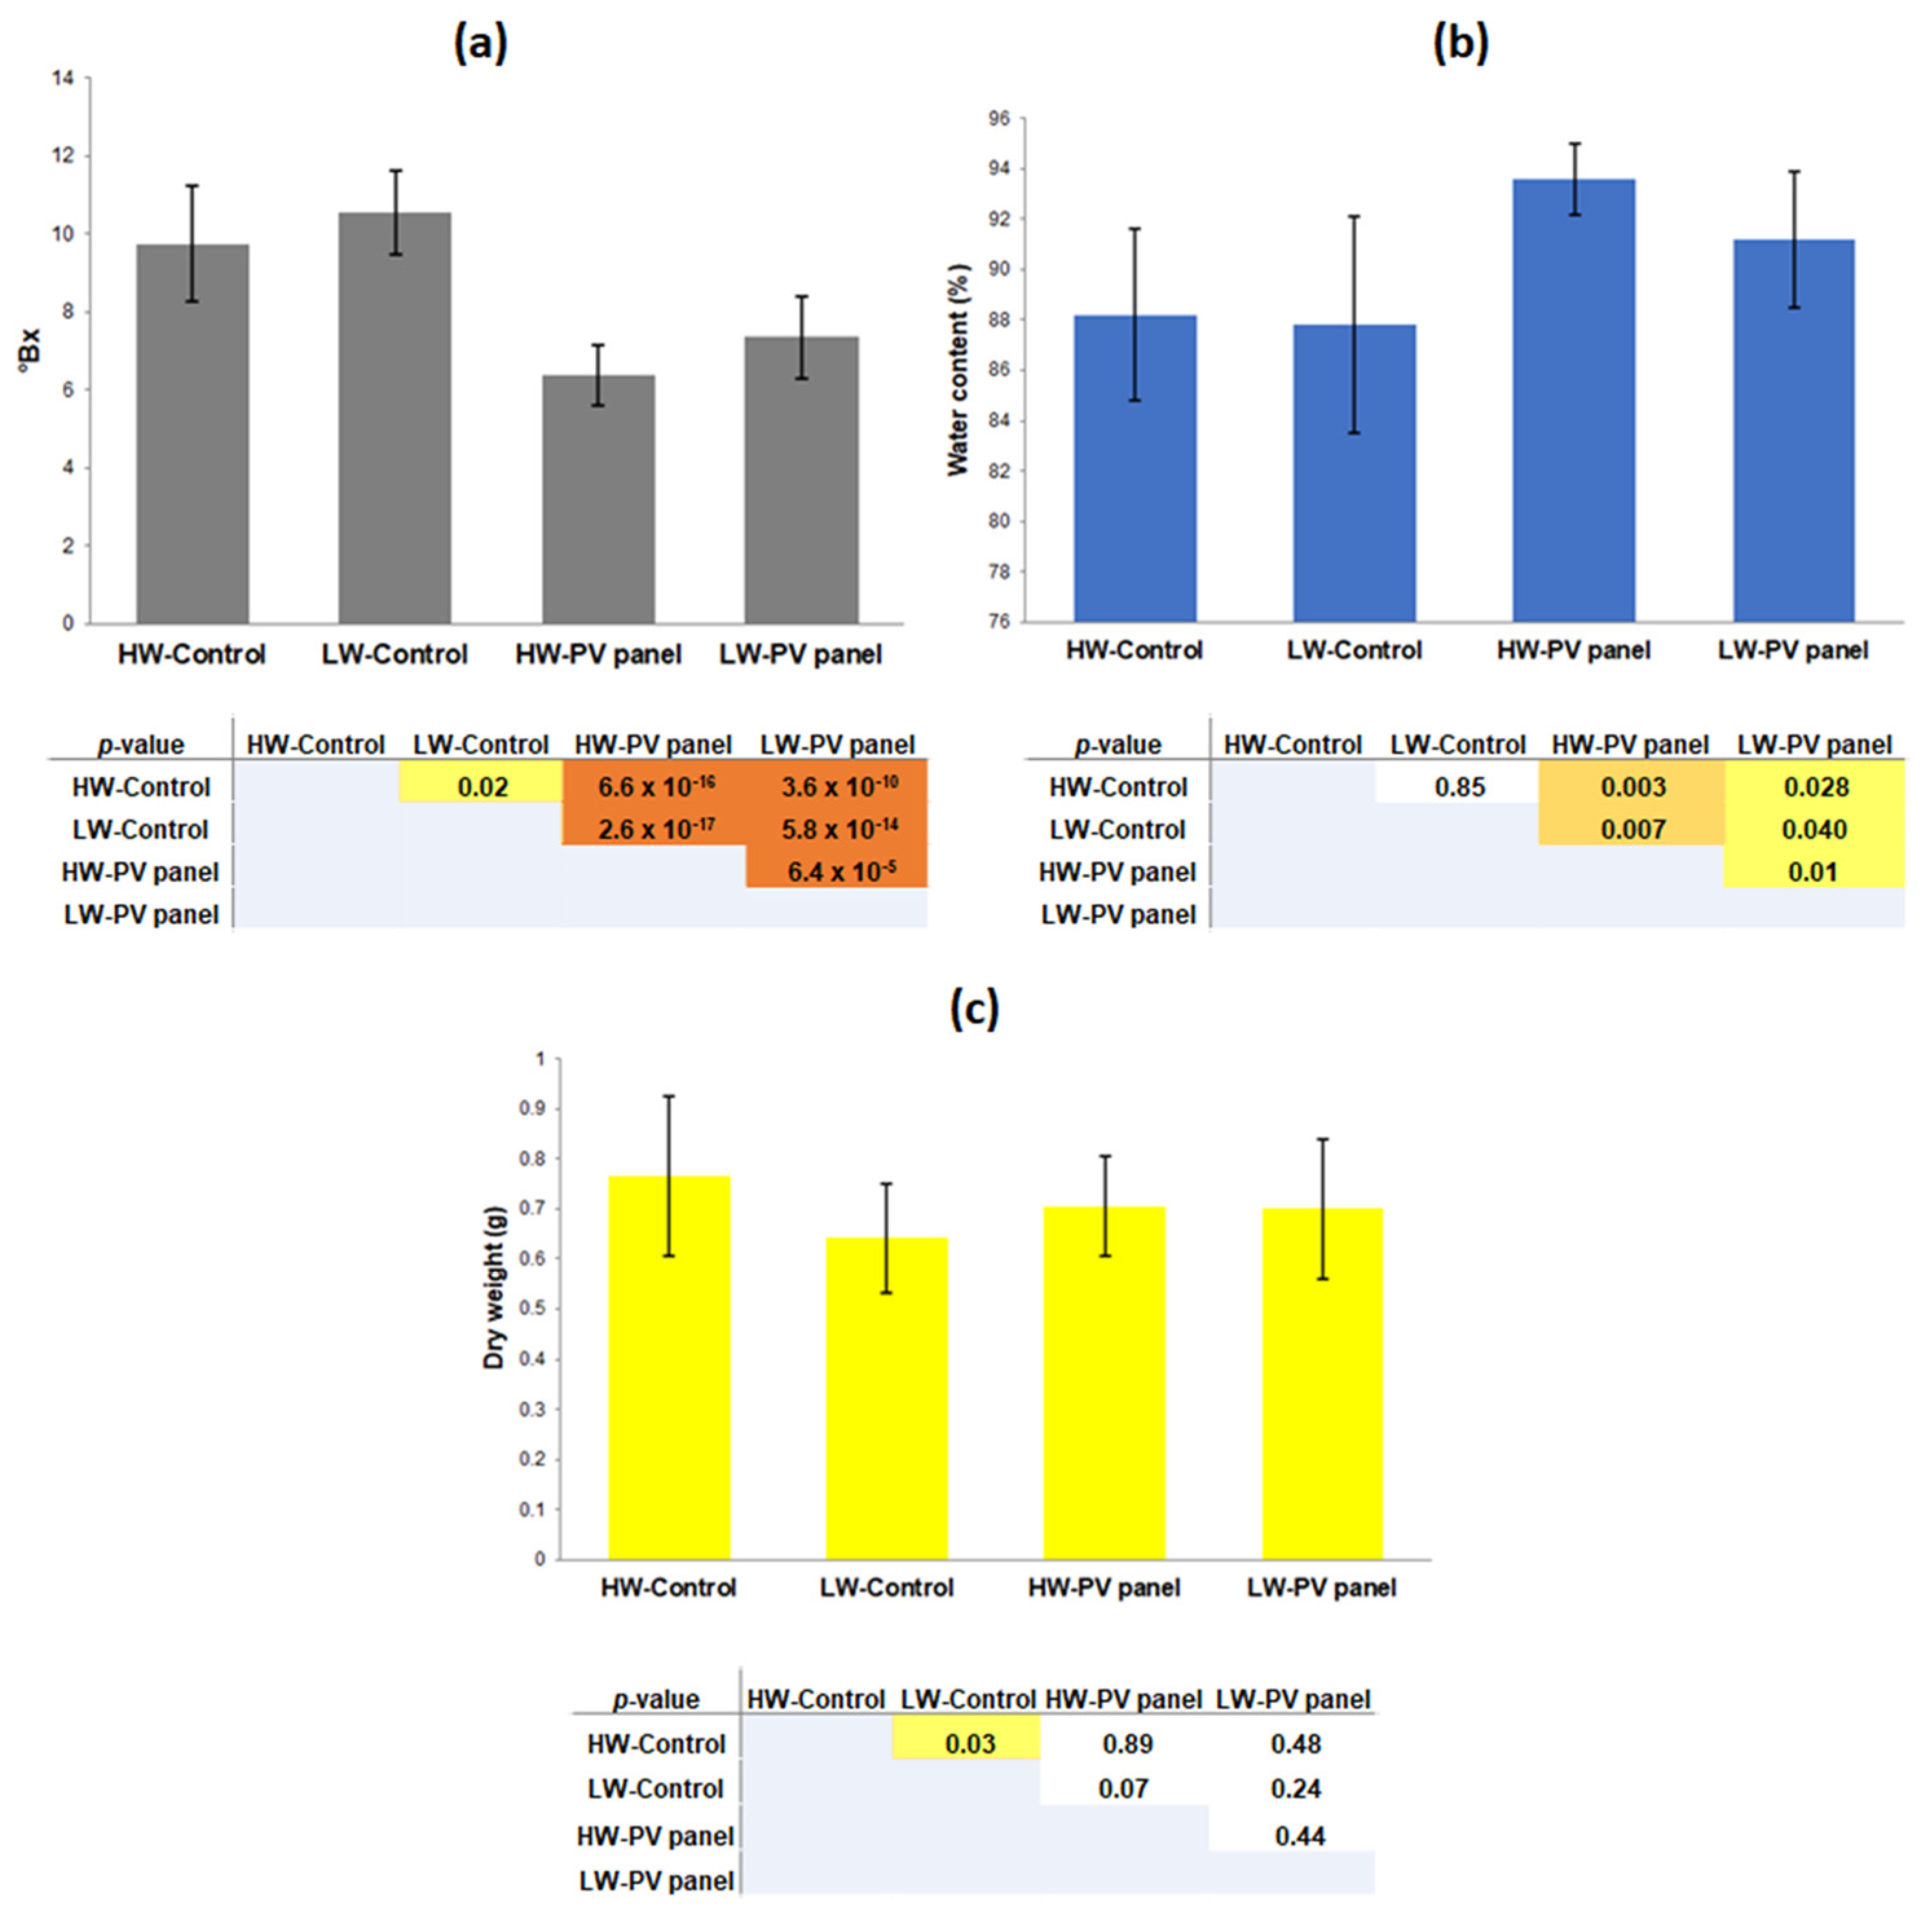
In terms of fruit quality, tomatoes grown in the control plots showed higher °Bx levels than those cultivated under the PV panels, irrespective of the water supply. Significant variations in the °Bx levels were observed among the four groups, with an average of 10.6 ± 1.1 for LW-Control, 9.7 ± 1.5 for HW-Control, 7.4 ± 1.1 for LW-PV panel, and 6.4 ± 0.8 for the HW-PV panel group (Figure 5a). Alongside that, the water content showed higher levels of tomato fruits grown under shadow conditions under the PV panels compared to the control ones (Figure 5b). The average water content was 93.1 ± 1% for the HW-PV panel group, 91.4 ± 1% for the LW-PV panel group, 88.2% ± 2 for the HW-Control group, and 87.9 ± 3% for LW-Control group. Consequently, the average dw of tomatoes was 0.77 g for HW-Control, 0.70 g for both HW panel and LW panel, and 0.64 for LW-Control, with no significant difference observed among them.
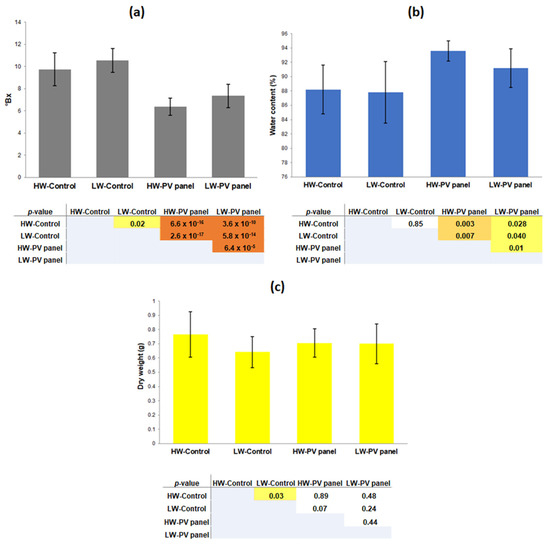
Figure 5.
Graphical representation of average Brix degrees (°Bx) with statistical analysis (a) of the water content percentage in tomato fruits with statistical analysis (b) and dry weight of tomato (c). In the tables, colored boxes denote statistically significant differences (yellow, p < 0.05; light orange, p < 0.01; dark orange, p < 0.001). Colorless boxes indicate the absence of statistically significant differences.
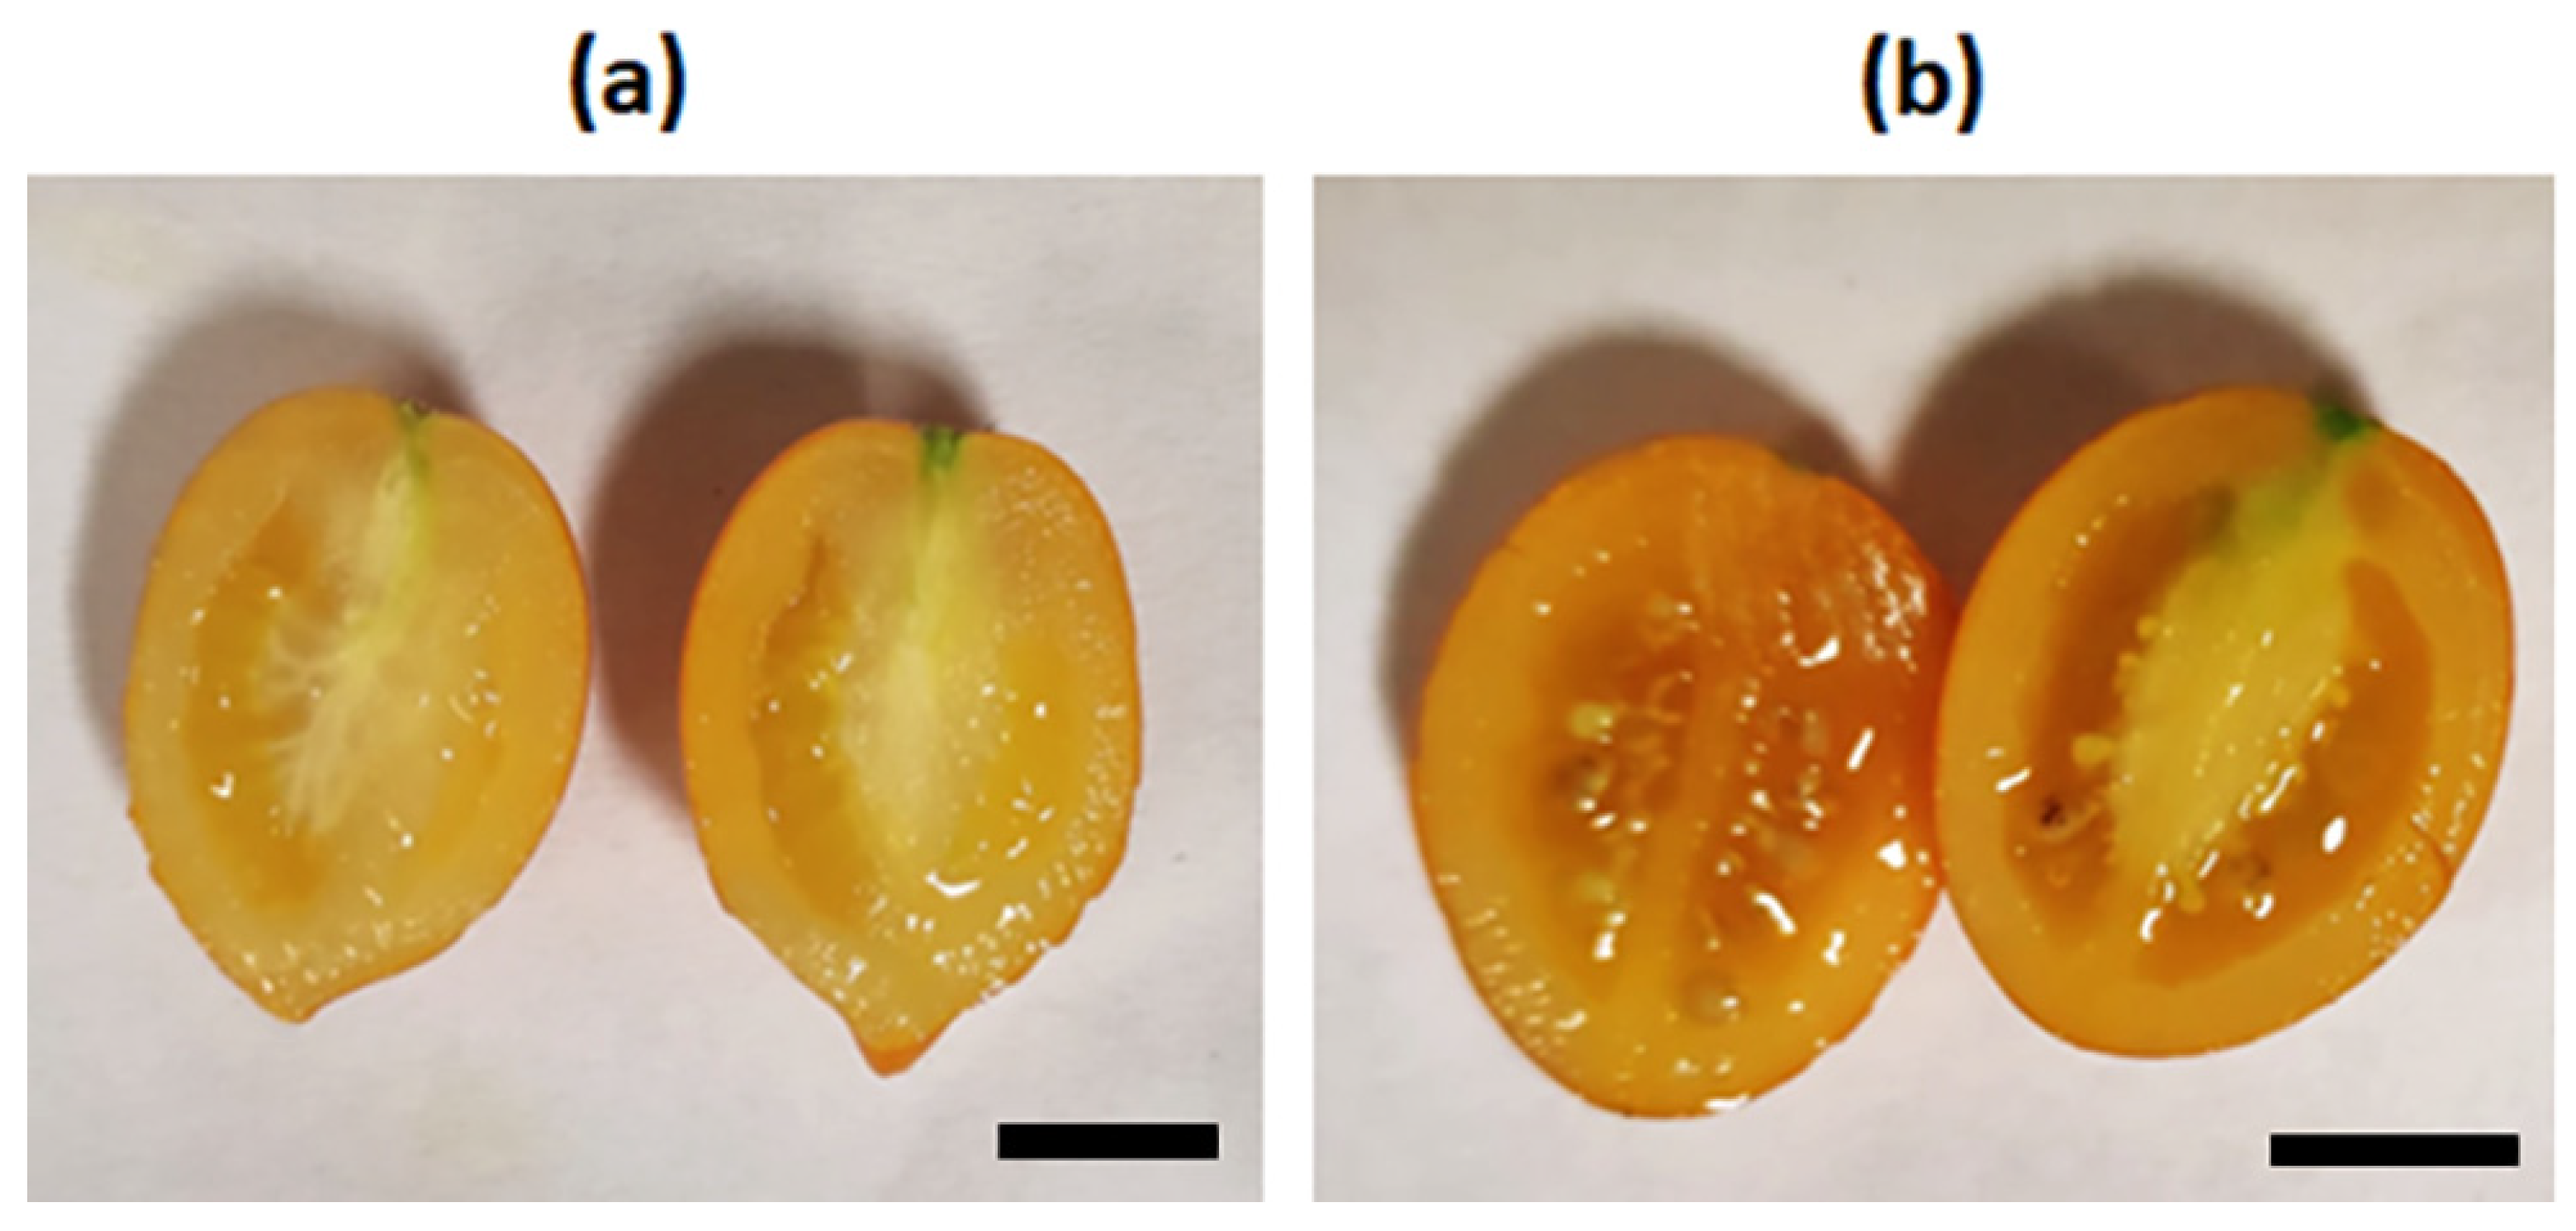
Furthermore, we noticed that roughly 50% of the tomato fruits grown in the control plots, under both watering conditions, had underdeveloped or absent seeds, in contrast to the fruits grown under the PV panels, which showed consistent and regular seed development (Figure 6).

Figure 6.
Representative images of tomato fruit grown in the control plot with seeds underdeveloped (a) and tomato fruit grown under the PV panel with regularly developed seeds (b). Scale bar = 1 cm.
3.3. Morphometric Features and Quality Assessment of Commercial Tomato Fruits
The commercial tomato fruits, used as the standard of reference, presented an average weight value of 12.1 ± 2.3 g, a short axis length averaging 2.1 ± 0.2 cm, and a long axis average of 2.8 ± 0.7 cm. The average °Bx value was 7.8 ± 0.5, and the water content constituted 92 ± 1% of the total tomato fruit fw, with an average dw of 0.96 ± 0.1 g. These analyses were performed on a sample of 60 commercial tomato fruits.
3.4. Environmental Conditions
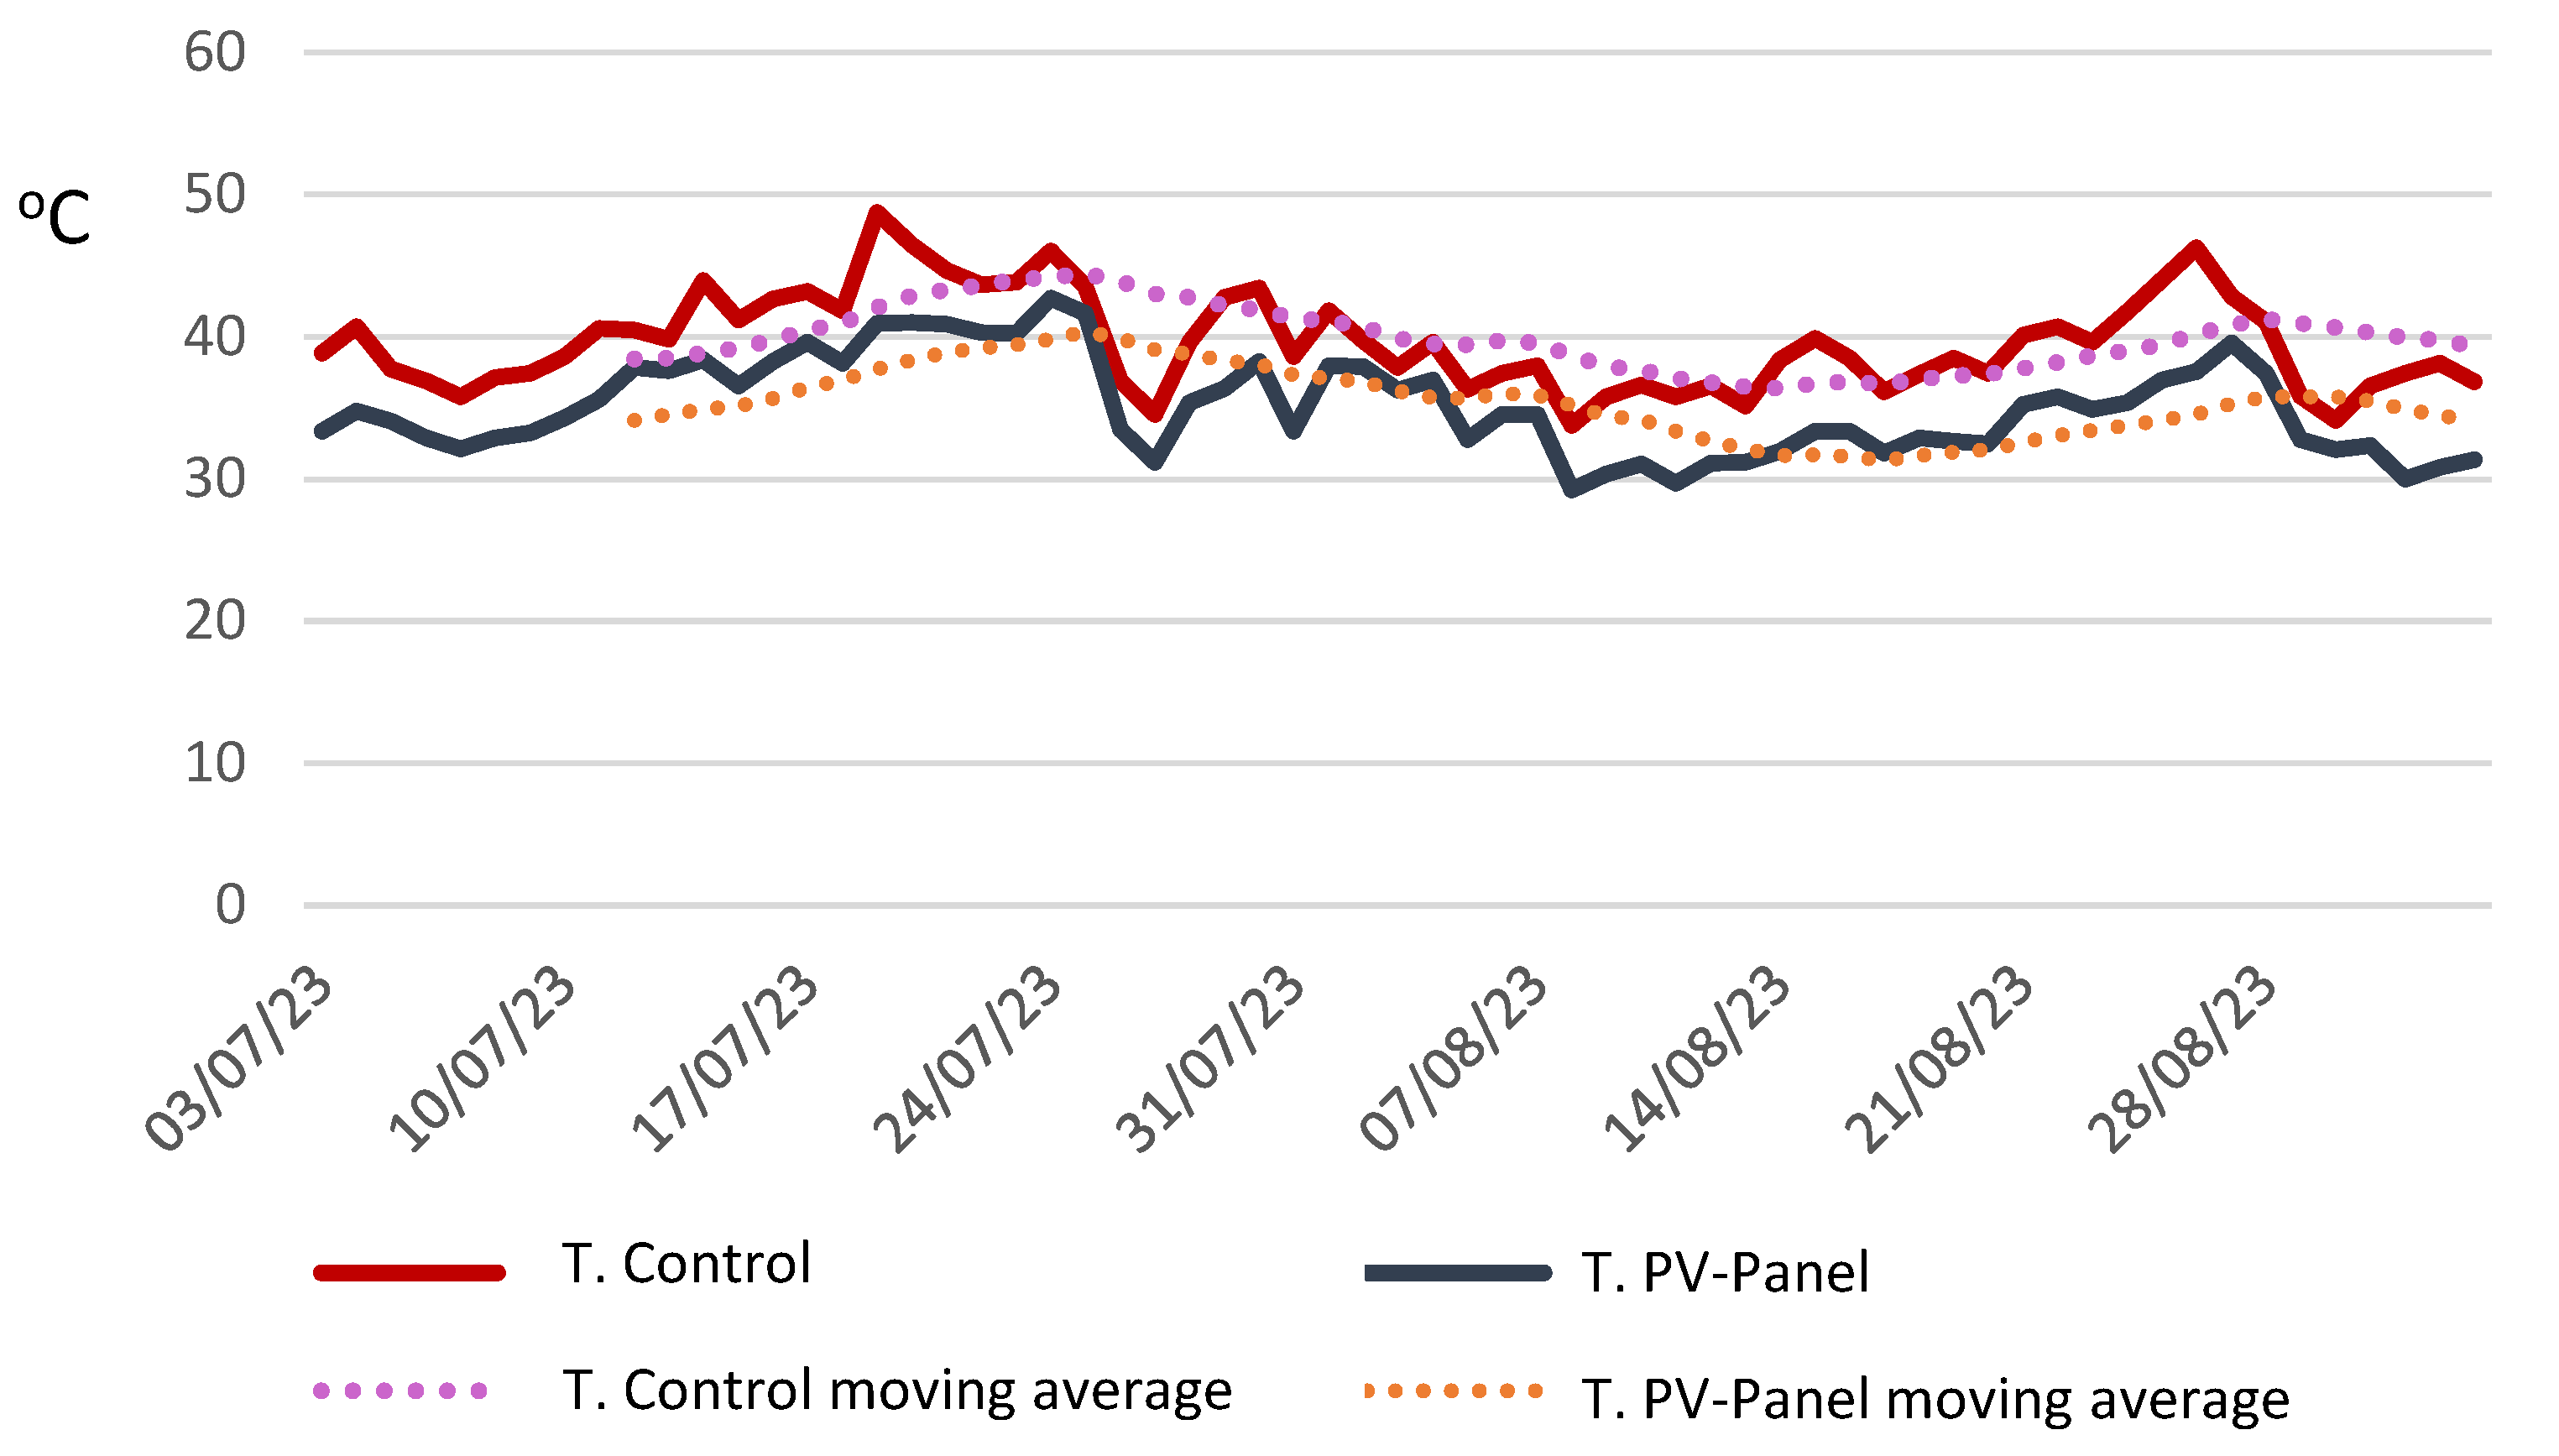
Figure 7 reports the daily air temperatures recorded throughout the growing season in this study. The maximum temperature registered in the control plots (48 °C) exceeded that observed beneath the PV panels (42 °C), with a maximum absolute difference of 8 °C. The temperature profile in both plots showed four distinct phases: an increase until 24 July, a subsequent decrease until 18 August, another increase from 19 August to 28 August, and a final decrease in the last 4 days of observation.

Figure 7.
The maximum temperature reached in the open-field sunlight control plots (HW Control and LW Control groups) and under the PV panel (HW-PV panel and LW-PV panel groups). The dashed line represents the moving average with a 10-day time window.
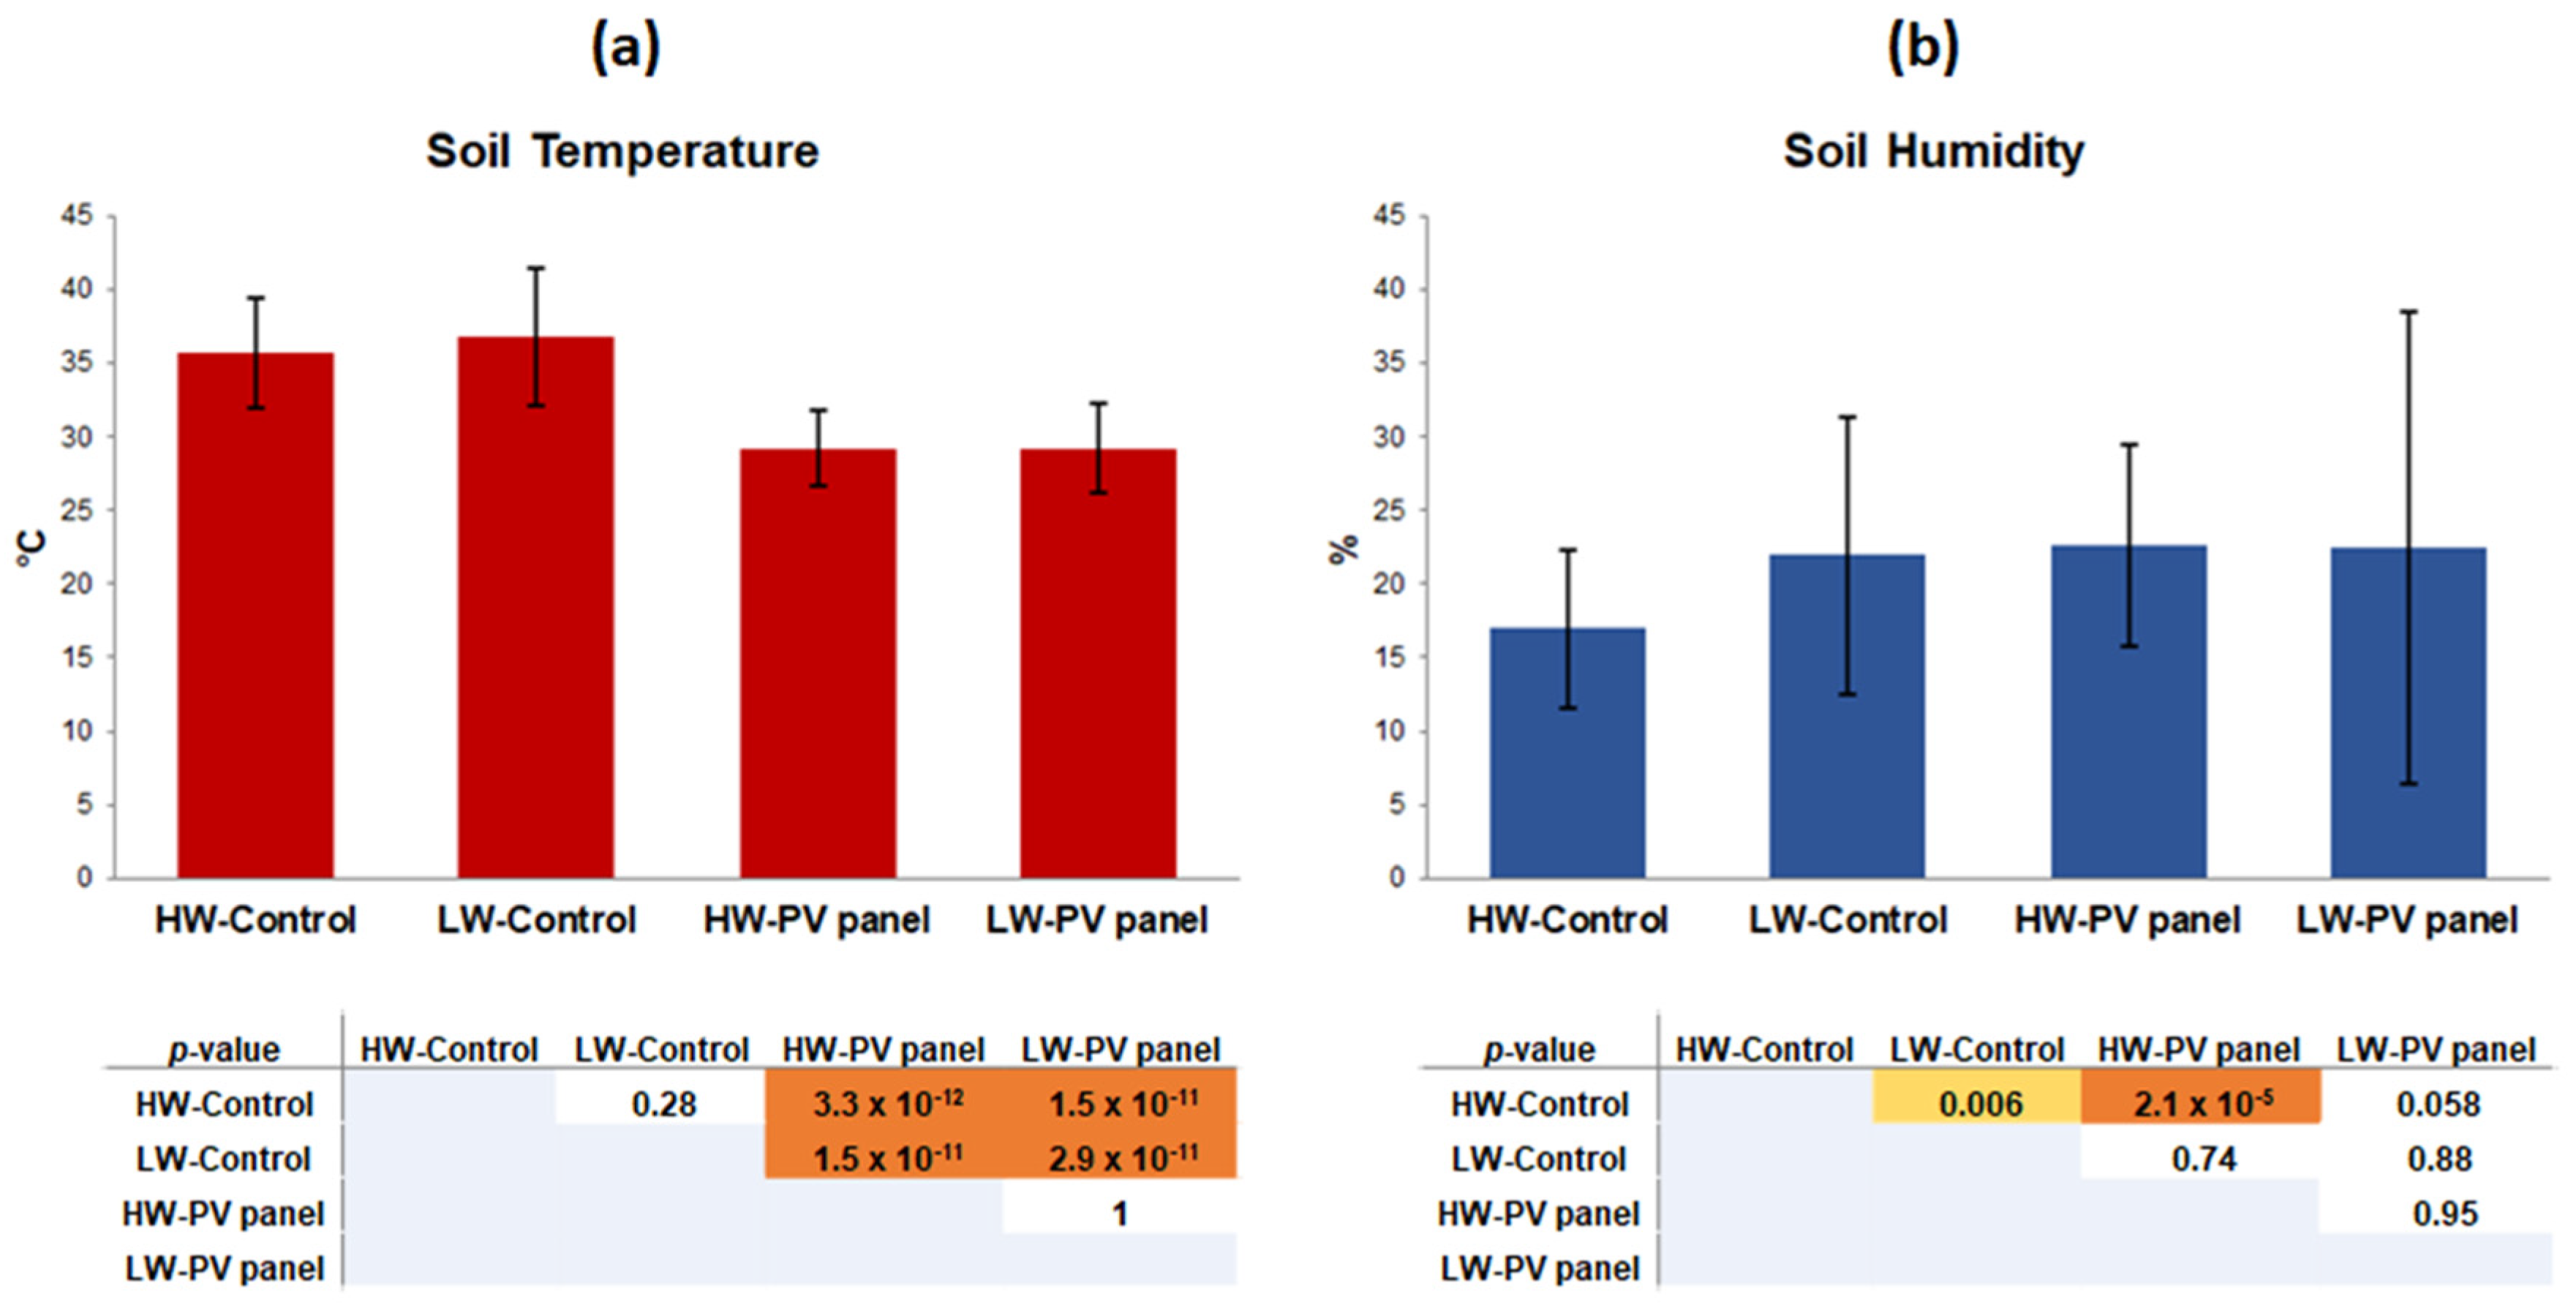
The maximum air temperature differences were also reflected in the soil temperature measured in each pot for both control and PV panel plots. The control plots showed higher soil temperatures, averaging 36.8 ± 4.7 °C in the LW-Control pots and 35.7 ± 3.7 °C in the HW-Control pots. In contrast, the average soil temperature under the PV panels was 29.2 ± 2.5 °C and 29.2 ± 3.1 °C for both the HW- and LW-PV panel plots. In particular, the difference was not significant between the LW- and the HW-Control plots, nor between the HW-PV panel and the LW-PV panel. However, it was significant between the two light conditions (control plots vs. PV panel plots) the regardless of irrigation regime (Figure 8a).
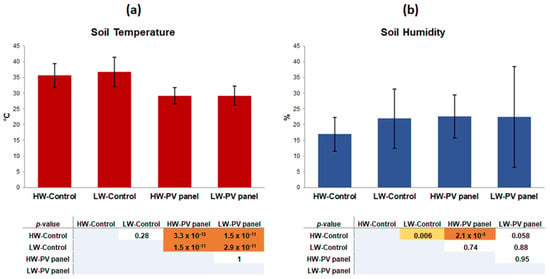
Figure 8.
Average soil temperature (a) and humidity (b) resulting from measurements in each pot within both the control and PV panel groups. In the tables, the colored boxes denote statistically significant differences (light orange, p < 0.01; dark orange, p < 0.001). Colorless boxes indicate the absence of statistically significant differences.
Soil humidity showed a lower average value in the pots located in the control plots (HW-Control and LW-Control) than the average humidity recorded under the pots beneath the PV panel (HW-PV panel and LW-PV panel groups). However, a significant difference was observed between the HW-Control and both the LW-Control and HW-PV panel conditions. No significant difference was noted between the HW-Control and LW-PV panel (Figure 8b).
The illuminance values recorded during the maximum shadow expansion beneath the panel were around 3999.00 ± 573.38 lx, while those measured in full sunlight reached approximately 125,125.00 ± 2904.05 lx.
4. Discussion
The study area is situated in a Mediterranean climate zone, primarily falling into the Warm Mediterranean Climate ‘Csa’ classification. In this region, the seasons are marked by hot and dry summers followed by mild and wet winters. Precipitation is concentrated during the winter season, while it remains relatively low throughout the summer months [37]. Our investigation was carried out during summer 2023, characterized by persistent and unusually hot climate conditions. This summer ranked among the hottest recorded in recent years, deviating significantly from the typical climate patterns of this geographic area [38,39,40]. Against this backdrop, the total tomato production was greater for plants grown in full sunlight exposure and under both watering regimes, compared to that obtained from plants grown under the PV panels. Specifically, a 55.3% and a 32% increase in the number of tomatoes was observed between HW-Control and HW-PV panel groups, and between the LW-Control and LW-PV panel plots, respectively.
The size of tomato fruits was greater in plants cultivated under shaded conditions compared to those grown in the open field under full sunlight. Specifically, the tomato fruit size in the HW-PV panel group was 37% larger than those produced in the HW-Control group, while the tomato fruit size in the LW-PV panel group was 28% higher than in the LW-Control group. Anyway, the weight of LW-PV panel tomatoes surpassed that of the HW-Control fruits by more than 17%. Thus, the higher quantity of tomato fruits produced in the control plot, characterized by sunlight exposure, is partially compensated by the reduced size of the fruits. This aligns with the SAS adaptation of the plant in the shade, as previous studies have demonstrated that under shaded conditions, plants tend to develop fewer flowers [27,41]. Indeed, similar findings regarding tomato fruit production have been reported in other studies [42,43]. However, this study highlights the importance of shade to guarantee tomato production, particularly in situations of water scarcity. Notably, the difference in tomato size was substantial. Thus, the difference in the total fruit fw harvested in the LW-PV panel group was only 6% lower than in the LW-Control group. On the other hand, in the case of higher watering, the difference was more pronounced at 29% (HW-Control vs. HW-PV panel).
Several studies have suggested a potential correlation between high productivity under PV panels and elevated soil humidity compared to the soil humidity under full sunlight conditions [42,43]. However, our study did not find a consistent correlation. Under the HW-Control conditions, characterized by lower soil humidity, we harvested a higher number of fruits. Moreover, there were no significant differences in soil humidity between LW-Control, HW-PV panel and LW-PV panel plots, despite variations in the total fruit weight harvested. Hence, we may infer that higher soil humidity under PV panels could affect the size of tomato fruits, which was greater in the shaded plots. Furthermore, our study revealed substantial differences in the soil temperature. There was a difference of up to 7.7 °C between the soil temperature under PV panels and the soil temperature in the control plots. Such discrepancy, also recorded in the air temperature, could have influenced the stress responses of the plants in terms of survival, flowering, and fruit setting [44]. Delayed flowering in plants exposed to full sunlight plots might be linked to the higher maximum air temperature recorded in the first part of the air temperature profile, potentially inducing stress in tomato plants. The impact of air temperature on flowering may have been mitigated by the shade in the PV panel plot. Furthermore, difference in sunlight and air temperature could have influenced the number and size of tomatoes produced.
It is worth of noting that the features of tomato fruits grown under HW-PV panel conditions closely resembled those of tomatoes of the same variety available on the market.
Light and air temperature can influence tomato quality, as evidenced by a higher water content under shade conditions (both HW- and LW-PV panel) compared to tomatoes from the control plot (HW- and LW-Control). Additionally, the Brix degrees were higher in the tomatoes grown in the control plots. However, the dimensions and Brix values observed in shade-grown tomato fruits were overall comparable to those recorded for commercially selected tomatoes. This comparison suggests a fruit quality that aligns better with commercial purposes and market demands. Typically, optimal °Brix falls within the range of 3.5 to 8.0, depending on the tomato variety [45,46,47,48,49].
Finally, another aspect revealed in this study was the occurrence of parthenocarpy in almost 50% of the fruits grown in the control plots exposed to full sunlight. This phenomenon indicates an ongoing stress condition inhibiting the normal plant reproduction, with potential implications for genetic preservation and future cultivation and breeding programs.
5. Conclusions
Under the conditions of high temperature stress, it is worth noting that all the features of tomato fruits grown in both HW- and LW-PV panel groups closely resembled those of tomatoes from the same variety available on the market. Therefore, in our specific experimental context, it became evident that in the face of climate change, agrivoltaic systems can play a significant role in sustaining crop production while meeting the market’s demand for high-quality fruits. Particularly, in scenarios of water scarcity, employing PV panels emerges as a valuable crop management strategy to alleviate drought stress in tomato fruits, enabling acceptable yield and production compared to plants grown in full sunlight.
Although agrivoltaics cannot be universally considered as a comprehensive strategy for agroecosystems to face climate change, their positive impact is contingent on factors such as the type of crop and field geographical location.
It is important to note that the results obtained were influenced by the relatively low height of the PV panels from the ground, aligning with national agricultural guidelines in Italy. In this study, the PV panel plot ensured only 3% of the sunlight intensity compared to full sunlight at zenith. Enhancing sunlight intensity to a minimum of 6% could potentially improve production quantity, as suggested by our previous study [20]. Therefore, future experiments should explore tomato production under conditions where PV panels are placed at different heights, providing valuable insights for optimizing agrivoltaic systems.
However, a limitation of this experiment was the height of the PV panel from the ground, which was lower than the minimum height recommended for agrivoltaic systems according to Italian guidelines, set at 2.10 m. This difference could result in a higher light flux underneath the PV panel compared to the experimental conditions in this study, potentially impacting fruit production. In future research, tomato crop will be tested under conditions more closely aligned with the specifications of agrivoltaic systems.
Author Contributions
Conceptualization, A.S. (Aurelia Scarano), T.S., G.P. and M.D.C.; methodology, A.S. (Aurelia Scarano), T.S., G.P. and M.D.C.; software, A.S. (Aurelia Scarano), T.S. and M.D.C.; validation, A.S. (Aurelia Scarano), T.S. and M.D.C.; formal analysis, A.S. (Aurelia Scarano), T.S. and M.D.C.; investigation, A.S. (Aurelia Scarano), T.S. and M.D.C.; resources, T.S., M.S.L., A.S. (Angelo Santino), G.P. and M.D.C.; data curation, T.S., A.S. (Aurelia Scarano), A.C., R.A., C.R., M.S.L., A.S. (Angelo Santino), G.P. and M.D.C.; writing—original draft preparation, A.S. (Aurelia Scarano), T.S. and M.D.C.; writing—review and editing, A.S. (Aurelia Scarano), T.S., A.C., R.A., C.R., M.S.L., A.S. (Angelo Santino), G.P. and M.D.C.; visualization, A.S. (Aurelia Scarano), T.S., A.C., R.A., C.R., M.S.L., A.S. (Angelo Santino), G.P. and M.D.C.; supervision, T.S., M.S.L., A.S. (Angelo Santino), G.P. and M.D.C.; funding acquisition, M.S.L., A.S. (Angelo Santino), G.P. and M.D.C. All authors have read and agreed to the published version of the manuscript.
Funding
This research received no external funding.
Institutional Review Board Statement
Not applicable.
Informed Consent Statement
Not applicable.
Data Availability Statement
The raw data supporting the conclusions of this article will be made available by the authors on request.
Acknowledgments
Teodoro Semeraro thanks the ITINERIS Project funded by the EU—Next Generation EU Mission 4 “Education and Research”—Component 2: “From research to business”—Investment 3.1: “Fund for the realisation of an integrated system of research and innovation infrastructures”—Project IR0000032—ITINERIS—Italian Integrated Environmental Research Infrastructures System—CUP B53C22002150006. He acknowledges the research infrastructures participating in the ITINERIS project with their Italian nodes: ACTRIS, ANAEE, ATLaS, CeTRA, DANUBIUS, DISSCO, e-LTER, ECORD, EMPHASIS, EMSO, EUFAR, Euro-Argo, EuroFleets, Geoscience, IBISBA, ICOS, JERICO, LIFEWATCH, LNS, N/R Laura Bassi, SIOS, SMINO. All authors thank Giuseppe Dalessandro for giving us his time, with dedication to reviewing the work, suggesting revisions of the text, clarification of some concepts and suggestions for parts to be developed. All authors are grateful to Mimmo Cornicello, Riccardo Rolli, and Antonio Cornicello for allowing us to carry out the experiment in the photovoltaic system and guaranteeing access to the system for our every need on an almost daily basis. Without their availability, the experiment would not have taken place.
Conflicts of Interest
The authors declare no conflicts of interest.
References
- Moonen, A.C.; Bàrberi, P. Functional biodiversity: An agroecosystem approach. Agric. Ecosyst. Environ. 2008, 127, 7–21. [Google Scholar] [CrossRef]
- Tan, P.Y.; Zhang, J.; Masoudi, M.; Alemu, J.B.; Edwards, P.J.; Grêt-Regamey, A.; Richards, D.R.; Saunders, J.; Song, X.P.; Wong, L.W. A conceptual framework to untangle the concept of urban ecosystem services. Landsc. Urban Plan 2020, 200, 103837. [Google Scholar] [CrossRef] [PubMed]
- Semeraro, T.; Turco, A.; Arzeni, S.; La Gioia, G.; D’Armento, R.; Taurino, R.; Medagli, P. Habitat Restoration: An Applicative Approach to “Biodiversity Heritage Relicts” in Social-Ecological Systems. Land 2021, 10, 898. [Google Scholar] [CrossRef]
- Semeraro, T.; Scarano, A.; Leggieri, A.; Calisi, A.; De Caroli, M. Impact of Climate Change on Agroecosystems and Potential Adaptation Strategies. Land 2023, 12, 1117. [Google Scholar] [CrossRef]
- FAO. The State of Food Security and Nutrition in the World: Building Climate Resilience for Food Security and Nutrition; Food and Agriculture Organization of the United Nations: Rome, Italy, 2018. [Google Scholar]
- HLPE. Food Security and Nutrition: Building a Global Narrative towards 2030; FAO: Rome, Italy, 2020; 112p, Available online: https://www.fao.org/3/ca9731en/ca9731en.pdf (accessed on 5 May 2022).
- Mirzabev, A.; Kerr, R.B.; Hasegawa, T.; Pradhan, P.; Wreford, A.; von der Pahlen, M.C.T.; Gurney-Smith, H. Severe climate change risks to food security and nutrition. Clim. Risk Manag. 2023, 39, 100473. [Google Scholar] [CrossRef]
- IPCC. Managing the Risks of Extreme Events and Disasters to Advance Climate Change Adaptation. A Special Report of Working Groups I and II of the Intergovernmental Panel on Climate Change; Field, C.B., Barros, V.R., Dokken, D.J., Mach, K.J., Mastrandrea, M.D., Bilir, T.E., Chatterjee, M., Ebi, K.L., Estrada, Y.O., Genova, R.C., et al., Eds.; Cambridge University Press: Cambridge, UK; New York, NY, USA, 2012; 582p. [Google Scholar]
- UNESCO. UNWater 2020: United Nations World Water Development Report 2020: Water and Climate Change; UNESCO: Paris, France, 2020; Available online: https://www.unesco.org/en/wwap/wwdr/2020 (accessed on 5 January 2024).
- Dixon, G. Chapter 17—The Impact of Climate and Global Change on Crop Production. In Letcher, Climate Change; Trevor, M., Ed.; Elsevier: Amsterdam, The Netherlands, 2009; pp. 307–324. ISBN 9780444533012. [Google Scholar] [CrossRef]
- Habib-ur-Rahman, M.; Ahmad, A.; Raza, A.; Hasnain, M.U.; Alharby, H.F.; Alzahrani, Y.M.; Bamagoos, A.A.; Hakeem, K.R.; Ahmad, S.; Nasim, W.; et al. Impact of climate change on agricultural production; Issues, challenges, and opportunities in Asia. Front. Plant Sci. 2022, 13, 925548. [Google Scholar] [CrossRef] [PubMed]
- Scharff, L.B.; Saltenis, V.L.R.; Jenen, P.E.; Baekelandt, A.; Burgess, A.J.; Burow, M.; Ceriotti, A.; Cohan, J.-P.; Geu-Flores, F.; Halkien, B.A.; et al. Prospects to improve nutritional quality of crops. Food Energy Secur. 2021, 11, e327. [Google Scholar] [CrossRef]
- Wu, J.; Wang, J.; Hui, W.; Zhao, F.; Wang, P.; Su, C.; Gong, W. Physiology of Plant Responses to Water Stress and Related Genes: A Review. Forests 2022, 13, 324. [Google Scholar] [CrossRef]
- Wiréhn, L. Nordic agriculture under climate change: A systematic review of challenges, opportunities and adaptation strategies for crop production. Land Use Policy 2018, 77, 63–74. [Google Scholar] [CrossRef]
- Kumar, N.; Khurana, P.K. Potential Push of Climate Change on Crop Production, Crop Adaptation, and Possible Strategies to Mitigate This; Ansari, M.W., Singh, A.K., Tuteja, N., Eds.; Wiley: Hoboken, NJ, USA, 2023. [Google Scholar] [CrossRef]
- Amaducci, S.; Yin, X.; Colauzzi, M. Agrivoltaic systems to optimise land use for electric energy production. Appl. Energy 2018, 220, 545–561. [Google Scholar] [CrossRef]
- Semeraro, T.; Scarano, A.; Santino, A.; Emmanuel, R.; Lenucci, M. An innovative approach to combine solar photovoltaic gardens with agricultural production and ecosystem services. Ecosyst. Serv. 2022, 56, 101450. [Google Scholar] [CrossRef]
- Kumpanalaisatit, M.; Setthapun, W.; Sintuya, H.; Pattiya, A.; Jansri, S.N. Current status of agrivoltaic systems and their benefits to energy, food, environment, economy, and society. Sustain. Prod. Consum. 2022, 33, 952–963. [Google Scholar] [CrossRef]
- Lee, S.; Lee, J.; Jeong, Y.; Kim, D.; Seo, B.; Seo, Y.; Kim, T.; Choi, W. Agrivoltaic system designing for sustainability and smart farming: Agronomic aspects and design criteria with safety assessment. Appl. Energy 2023, 341, 121130. [Google Scholar] [CrossRef]
- Semeraro, T.; Scarano, A.; Curci, L.M.; Leggieri, A.; Lenucci, M.; Basset, A.; Santino, A.; Piro, G.; De Caroli, M. Shading effects in agrivoltaic systems can make the difference in boosting food security in climate change. Appl. Energy 2024, 358, 122565. [Google Scholar] [CrossRef]
- Dinesh, H.; Pearce, J.M. The potential of agrivoltaic systems. Renew. Sustain. Energy Rev. 2016, 54, 299–308. Available online: http://linkinghub.elsevier.com/retrieve/pii/S136403211501103X (accessed on 7 January 2024). [CrossRef]
- Adeh, E.H.; Selker, J.S.; Higgins, C.W. Remarkable agrivoltaic influence on soil moisture, micrometeorology and water-use efficiency. PLoS ONE 2018, 13, e0203256. [Google Scholar] [CrossRef]
- Mamun, M.A.A.; Dargusch, P.; Wadley, D.; Zulkarnain, N.A. A review of research on agrivoltaic systems. Renew. Sustain. Energy Rev. 2022, 161, 112351. [Google Scholar] [CrossRef]
- Kim, D.; Oren, R.; Qian, S.S. Response to CO2 enrichment of understory vegetation in the shade of forests. Glob. Chang. Biol. 2016, 22, 944–956. [Google Scholar] [CrossRef] [PubMed]
- Yang, F.; Fan, Y.; Wu, X.; Cheng, Y.; Liu, Q.; Feng, L.; Chen, J.; Wang, Z.; Wang, X.; Yong, T.; et al. Auxin-to-Gibberellin ratio as a signal for light intensity and quality in regulating soybean growth and matter partitioning. Front. Plant Sci. 2018, 9, 56. [Google Scholar] [CrossRef]
- Hitz, T.; Hartung, J.; Graeff-Hönninger, S.; Munz, S. Morphological response of soybean (Glycine max (L.) Merr.) cultivars to light intensity and red to far-red ratio. Agronomy 2019, 9, 428. [Google Scholar] [CrossRef]
- Rezazadeh, A.; Harkess, R.; Telmadarrehei, T. The Effect of Light Intensity and Temperature on Flowering and Morphology of Potted Red Firespike. Horticulturae 2018, 4, 36. [Google Scholar] [CrossRef]
- Lyu, X.; Mu, R.; Liu, B. Shade avoidance syndrome in soybean and ideotype toward shade tolerance. Mol. Breed. 2023, 43, 31. [Google Scholar] [CrossRef]
- Semchenko, M.; Lepik, M.; Cotzenberger, L.; Zobel, K. Positive effect of shade on plant growth: Amelioration of stress or active regulation of growth rate? J. Ecol. 2012, 100, 459–466. [Google Scholar] [CrossRef]
- Li, L.; Wang, H. Editorial: Shade avoidance syndrome in plants. Front. Plant Sci. 2022, 13, 990982. [Google Scholar] [CrossRef]
- Schweiger, A.H.; Pataczek, L. How to reconcile renewable energy and agricultural production in a drying world. Plants People Planet 2023, 5, 650–661. [Google Scholar] [CrossRef]
- Helyes, L.; Pek, Z.; Lugasi, A. Tomato Fruit Quality and Content Depend on Stage of Matyrity. HortScience 2006, 41, 1400–1401. [Google Scholar] [CrossRef]
- Mohammedi, S.; Dragonetti, G.; Admane, N.; Fouial, A. The Impact of Agrivoltaic Systems on Tomato Crop: A Case Study in Southern Italy. Processes 2023, 11, 3370. [Google Scholar] [CrossRef]
- Jarque, C.M.; Bera, A.K. A test for normality of observations and regression residuals. Int. Stat. Rev. 1987, 55, 163–172. [Google Scholar] [CrossRef]
- Royston, P. A remark on AS 181: The W-test for normality. Appl. Stat. 1995, 44, 547–551. [Google Scholar] [CrossRef]
- Sano, T.; Horie, H.; Matsunaga, A.; Hirono, Y. Effect of shading intensity on morphological and color traits and on chemical components of new tea (Camellia sinensis L.) shoots under direct covering cultivation. J. Sci. Food Agric. 2017, 98, 5666–5676. [Google Scholar] [CrossRef]
- Kottek, M.; Grieser, M.; Beck, C.; Rudolf, B.; Rubel, F. World Map of the Köppen-Geiger climate classification. Meteorol. Z. 2006, 15, 259–263. [Google Scholar] [CrossRef] [PubMed]
- Annual 2023 Global Climate Report. Temperature Anomalies Time Series. Available online: https://www.ncei.noaa.gov/access/monitoring/monthly-report/global/202313 (accessed on 1 October 2023).
- Copernicus 2023. Climate Change Services. Copernicus: 2023 Is the Hottest Year on Record, with Global Temperatures Close to the 1.5 °C Limit. Available online: https://climate.copernicus.eu/copernicus-2023-hottest-year-record (accessed on 1 October 2023).
- NOAA National Centers for Environmental Information. Monthly Global Climate Report for Annual 2023. Available online: https://www.ncei.noaa.gov/access/monitoring/monthly-report/global/202313/supplemental/page-1 (accessed on 29 January 2024).
- Thomas, B.; Vince-Prue, D. Photoperiodism in Plants, 2nd ed.; Academic Press: New York, NY, USA, 1997; pp. 1–26. [Google Scholar]
- AL-agele, H.A.; Proctor, K.; Murthy, G.; Higgins, C. A Case Study of Tomato (Solanum lycopersicon var. Legend) Production and Water Productivity in Agrivoltaic Systems. Sustainability 2021, 13, 2850. [Google Scholar] [CrossRef]
- Potenza, E. Studying the Impact of Agrivoltaic Systems across the Water-Energy-Food (WEF) Nexus; Università Cattolica del Sacro Cuore: Piacenza, Italy, 2021; Available online: http://hdl.handle.net/10280/146609 (accessed on 7 January 2024).
- Scarano, A.; Olivieri, F.; Gerardi, C.; Liso, M.; Chiesa, M.; Chieppa, M.; Frusciante, L.; Barone, A.; Santino, A.; Rigano, M.M. Selection of tomato landraces with high fruit yield and nutritional quality under elevated temperatures. J. Sci. Food Agric. 2020, 100, 2791–2799. [Google Scholar] [CrossRef] [PubMed]
- Tandon, K.S.; Baldwin, E.A.; Scott, J.W.; Shewfelt, R.L. Linking sensory descriptors to volatile and nonvolatile components of fresh tomato flavor. J. Food Sci. 2003, 68, 2366–2371. [Google Scholar] [CrossRef]
- Peet, M.M.; Harlow, C.D.; Larrea, E.S. Fruit quality and yield in five small-fruited greenhouse tomato cultivars under high fertilization regime. Acta Hort. 2004, 659, 811–818. [Google Scholar] [CrossRef]
- Thybo, A.K.; Edelenbos, M.; Christensen, L.P.; Sorensen, J.N.; Thorup-Kristensen, K. Effect of organic growing systems on sensory quality and chemical composition of tomatoes. LWT 2006, 39, 835–843. [Google Scholar] [CrossRef]
- Barrett, D.M.; Weakley, C.; Diaz, J.V.; Watnik, M. Qualitative and nutritional differences in processing tomatoes grown under commercial organic and conventional production systems. J. Food Sci. 2007, 72, C441–C451. [Google Scholar] [CrossRef]
- Aldrich, H.T.; Salandanan, K.; Kendall, P.; Bunning, M.; Stonaker, F.; Kulen, O.; Stushnoff, C. Cultivar choice provides options for local production of organic and conventionally produced tomatoes with higher quality and antioxidant content. J. Sci. Food Agric. 2010, 90, 2548–2555. [Google Scholar] [CrossRef]


Disclaimer/Publisher’s Note: The statements, opinions and data contained in all publications are solely those of the individual author(s) and contributor(s) and not of MDPI and/or the editor(s). MDPI and/or the editor(s) disclaim responsibility for any injury to people or property resulting from any ideas, methods, instructions or products referred to in the content. |
© 2024 by the authors. Licensee MDPI, Basel, Switzerland. This article is an open access article distributed under the terms and conditions of the Creative Commons Attribution (CC BY) license (https://creativecommons.org/licenses/by/4.0/).