Abstract
The explosive growth of malware targeting Android devices has resulted in the demand for the acquisition and integration of comprehensive information to enable effective, robust, and user-friendly malware detection. In response to this challenge, this paper introduces HertDroid, an innovative Android malware detection method that leverages the hidden contextual information within application entities. Specifically, we formulate a heterogeneous graph encapsulating rich semantics of entities and their interactions to model the behavior of Android applications. To alleviate computational burdens, a filter is implemented to identify nodes containing crucial information. The Transformer architecture is then deployed for efficient information aggregation across diverse entities. In our experiments, HertDroid demonstrates superior performance by achieving the highest F1 scores when compared to baseline methods on a dataset comprising 10,361 benign and 11,043 malicious apps. Notably, HertDroid excels in maintaining a lightweight profile, and its performance is achieved without the necessity of manual meta-path configuration.
1. Introduction
Android has the highest market share of 70.26% in 2023 among the various mobile operating systems available on the market [1]. While attracting widespread attention, its open-source nature and popularity also make it a target of mobile malware. Statistical data indicate the interception of 6301 new instances of Android malware every day, signifying the detection of over four novel Android malware specimens per minute [2]. In addition, while Google proposes a permission mechanism, attackers can still engage in malicious behavior without obtaining permission [3]. To protect users’ privacy, there is an urgent need for a user-friendly detection method that is effective enough to identify Android malware.
While traditional Android malware detection methods primarily rely on signature-based approaches and heuristic analysis, the methods incorporating neural networks (NNs) surpass conventional models and can be divided into static analysis, dynamic analysis, and hybrid analysis methods that mix the above two methods [4]. Both of the latter two methods need program execution, which raises concerns about the computational cost and the risks of sandbox escape [5]. In contrast, static analysis, which examines code without execution, circumvents the drawbacks of dynamic analysis and attracts abundant studies to explore its potential. Researchers leverage techniques such as code analysis, permission mapping, and behavior modeling to uncover malicious patterns within Android applications. However, these detection methods usually use only one or a few static features, such as permission [6,7,8], frequency of API (i.e., Application Programming Interface) [9,10], and opcode sequence [11,12]. They are not designed to detect malware based on interactions between these features; therefore, it is relatively easy to evade these models using techniques of code obfuscation, such as the substitution of semantically equivalent commands for the original ones.
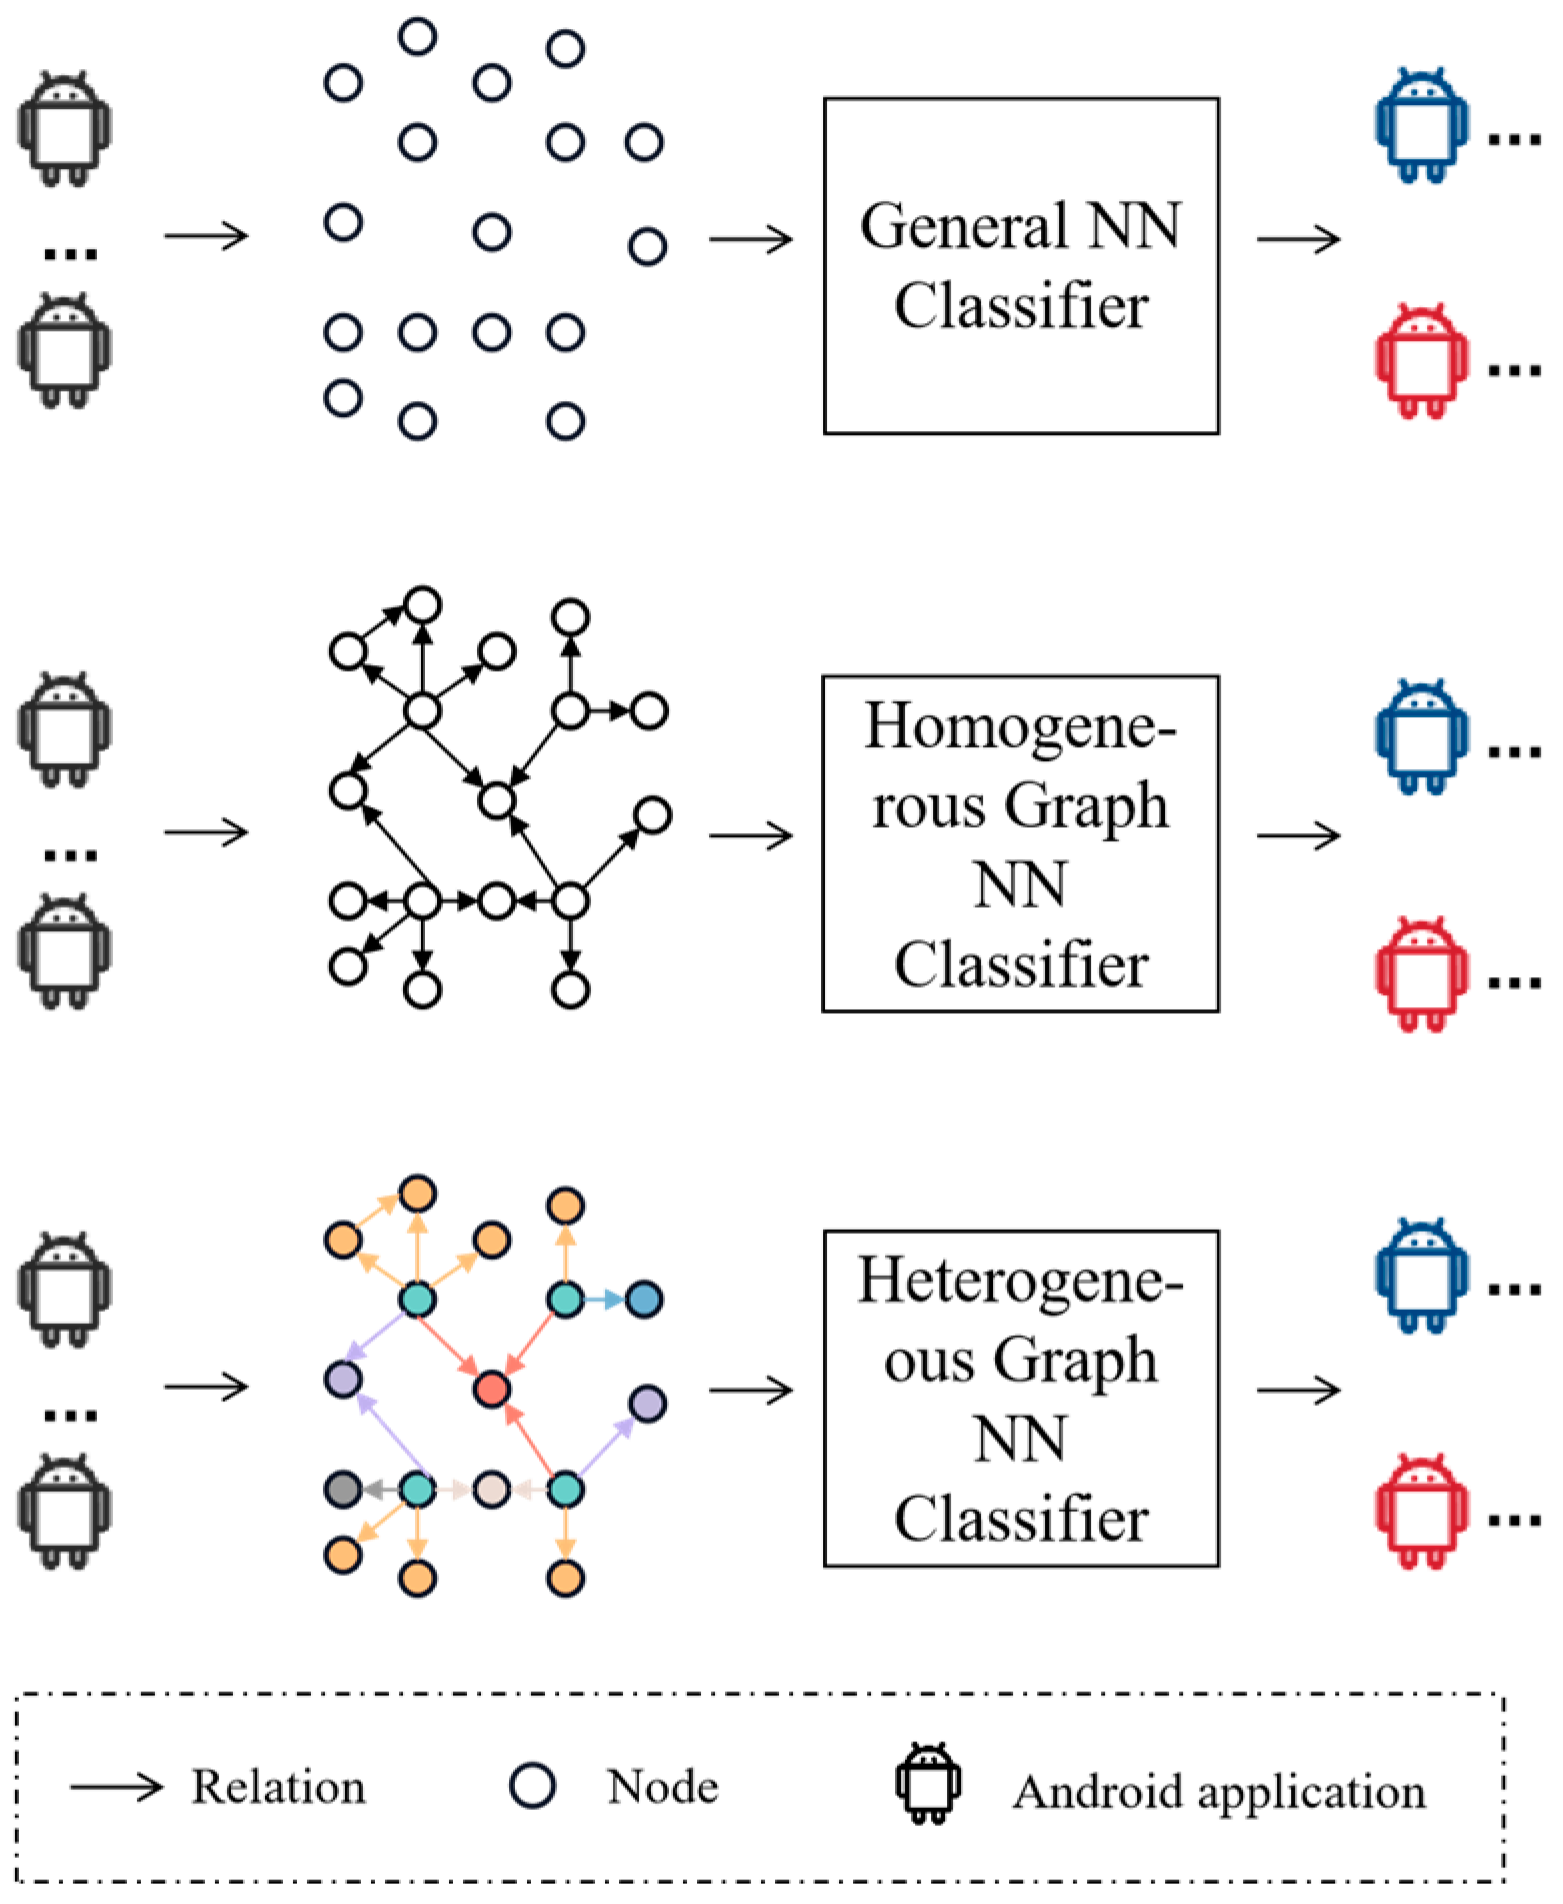
As highlighted by [13], a graph neural network (GNN) is a specialized NN architecture adept at leveraging the inherent structural information of graphs. For example, each node in the graph in a graph convolutional network (GCN) [14] updates its embedding until the final balance due to the influence of neighbors and further nodes via a Laplace matrix. The closer the relationship between the neighbors, the greater the influence. This ability to adjust node embedding according to connected nodes is proof of exploiting graph topology to improve node classification of GNN. Further, similar to the principles elucidated in the works of Wu et al. [15] and Zhang et al. [16], we recognize the intrinsic heterogeneity of our data in the domain of Android malware detection, which drives us to employ the capability of the heterogeneous graph to improve the performance of our model. The introduced semantics in this paper can be illustrated briefly in Figure 1, depicting the process of identifying Android malware using three distinct models. The detection method based on general NNs treats the components of applications as a group of features of the same type. In contrast, the homogeneous GNN-based method not only regards these components as a group of features but also incorporates the network structure. Addressing the limitations of both, the heterogeneous GNN-based method effectively manages applications with multi-type features and the associated network structure. By encoding these relationships within the graph, we aim to enhance the discriminative power of our malware detection model, enabling it to identify subtle patterns and abnormal behaviors indicative of malicious software. Specifically, considering the large number of entities involved in an Android application, we only combine the crucial entities into our graph.
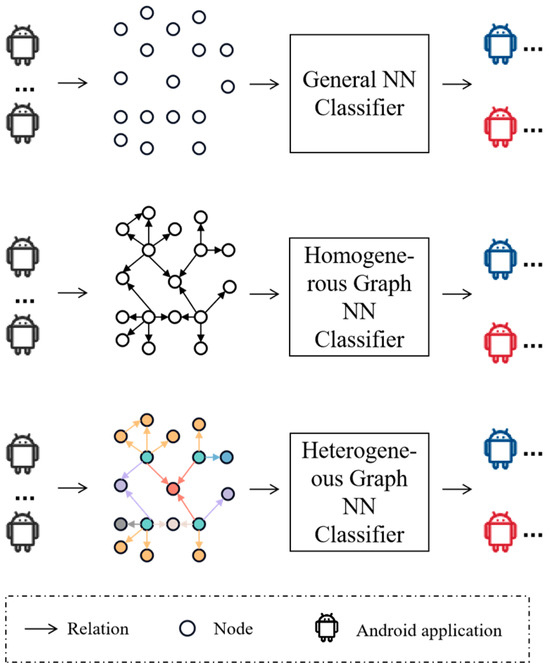
Figure 1.
Example illustrating the differences among three structured approaches. NN: neural network. Android application in blue, red and black: benign application, malicious application and uncategorized application, respectively. Nodes and relations in multiple colors: multiple types of nodes and relations.
In this paper, we present an Android malware detection system, named HertDroid, based on a heterogeneous graph with a crucial node filter and a customized Android Transformer. It is capable of modeling the abundant semantics of multi-type components of Android applications as a heterogeneous graph and summarizing it into numerical representations to identify whether an Android application is malicious or not. Specifically, the first step in this method is to extract the entities in Android applications, including API calls, permissions, shared object files, intents, Apps, and features, and the relations among them in Android application packages as a structured heterogeneous graph. HertDroid employs a module called Android APK (Android Application Package) Transformer to differentiate between benign and malicious applications. To address the issue of the redundancy of APIs, the Android APK Transformer performs a targeted API dropout on the heterogeneous graph based on a series of centralities, which not only improves the performance of detection but also reduces resource consumption. The processed heterogeneous graph is fed into a multi-component self-attention module to embed the nodes in the graph into the same embedding space. Finally, a Multilayer Perceptron (MLP) will be trained to detect malicious Android applications deploying these node embeddings.
The contributions we make to Android malware detection in this paper can be encapsulated as follows:
Efficient method. The method we proposed outperforms the baselines by 9.25% on our dataset dated from 2018 to 2022.
User-friendly method. The method we proposed can identify malicious behavior based on the heterogeneous graph without manually designing meta paths.
Lightweight method. The method we propose has a relatively small number of parameters, making it capable of handling larger-scale data under limited resources.
2. Related Work
Over the last few years, the detection of Android malware has been considered a crucial research field, prompting numerous teams to propose various methods and techniques to address the increasing number of malware-related issues. In this section, we specifically focus on malware detection using GNNs, which is relevant to the approach presented in this paper.
GNNs have been successfully employed in various fields, including malware detection. GNNs are well-suited for capturing complex relationships and patterns between entities represented as nodes in a graph. By leveraging the attributes and connections of nodes, GNNs can effectively detect and classify malicious behavior in Android applications. BejaGNN [17] is a revolutionary Java malware detection method employing a GNN including a GCN [14], graph attention network (GAT) [18], and graph isomorphism network (GIN) to create a control flow graph inherent in Java program files, and then refine them to maintain the precision of the graph. Another method for classifying families of Android malware is GDroid [19], which utilizes GCNs. It involves constructing a heterogeneous network with two types of relations, processed by the GCN model to generate node representations that consider both topological structure and node properties. The first work to combine Android malware detection with heterogeneous graphs is the Hindroid [20]. It first creates a heterogeneous network outlining the connections between APIs and Apps as well as their internal relationships. It then isolates feature matrices from decompiled APKs and uses a multiple kernel SVM (support vector machines) classifier to categorize them. Hawk [21], with its description of Android entities and behavioral links as a heterogeneous information network, is a malware detection framework for applications on the Android operating system. Additionally, to address dynamically appearing applications, an incremental learning model is developed rather than the entire heterogeneous graph and subsequent embedding model. The method proposed by [22] captures the behaviors of applications through runtime executions and constructs a heterogeneous graph to produce node representations.
Due to the success of malware detection methods based on GNNs, we drew inspiration from the heterogeneous graph transformer [23], which has been proven effective on large academic heterogeneous graphs, and developed a customized Android APK Transformer module specifically for Android malware detection tasks.
3. Preliminary
Heterogeneous graph (HG): The HG [24] (i.e., heterogeneous information network) can be defined as where and denote the collection of nodes and edges, respectively. For each node , the node type of belongs to the set of node types . Similarly, for any , the type of belongs to the set of edge types . When the elements of or are greater than 1, the graph is called a heterogeneous information network.
Meta-path: A meta-path [25] is a sequence of relations associating a source node type with a target node. Walking by a meta-path is a way to obtain graph structure. Formally, a meta-path can be represented as , which can be abbreviated as , where represents a type of node and represents a type of edge.
4. HertDroid Model
4.1. Architecture
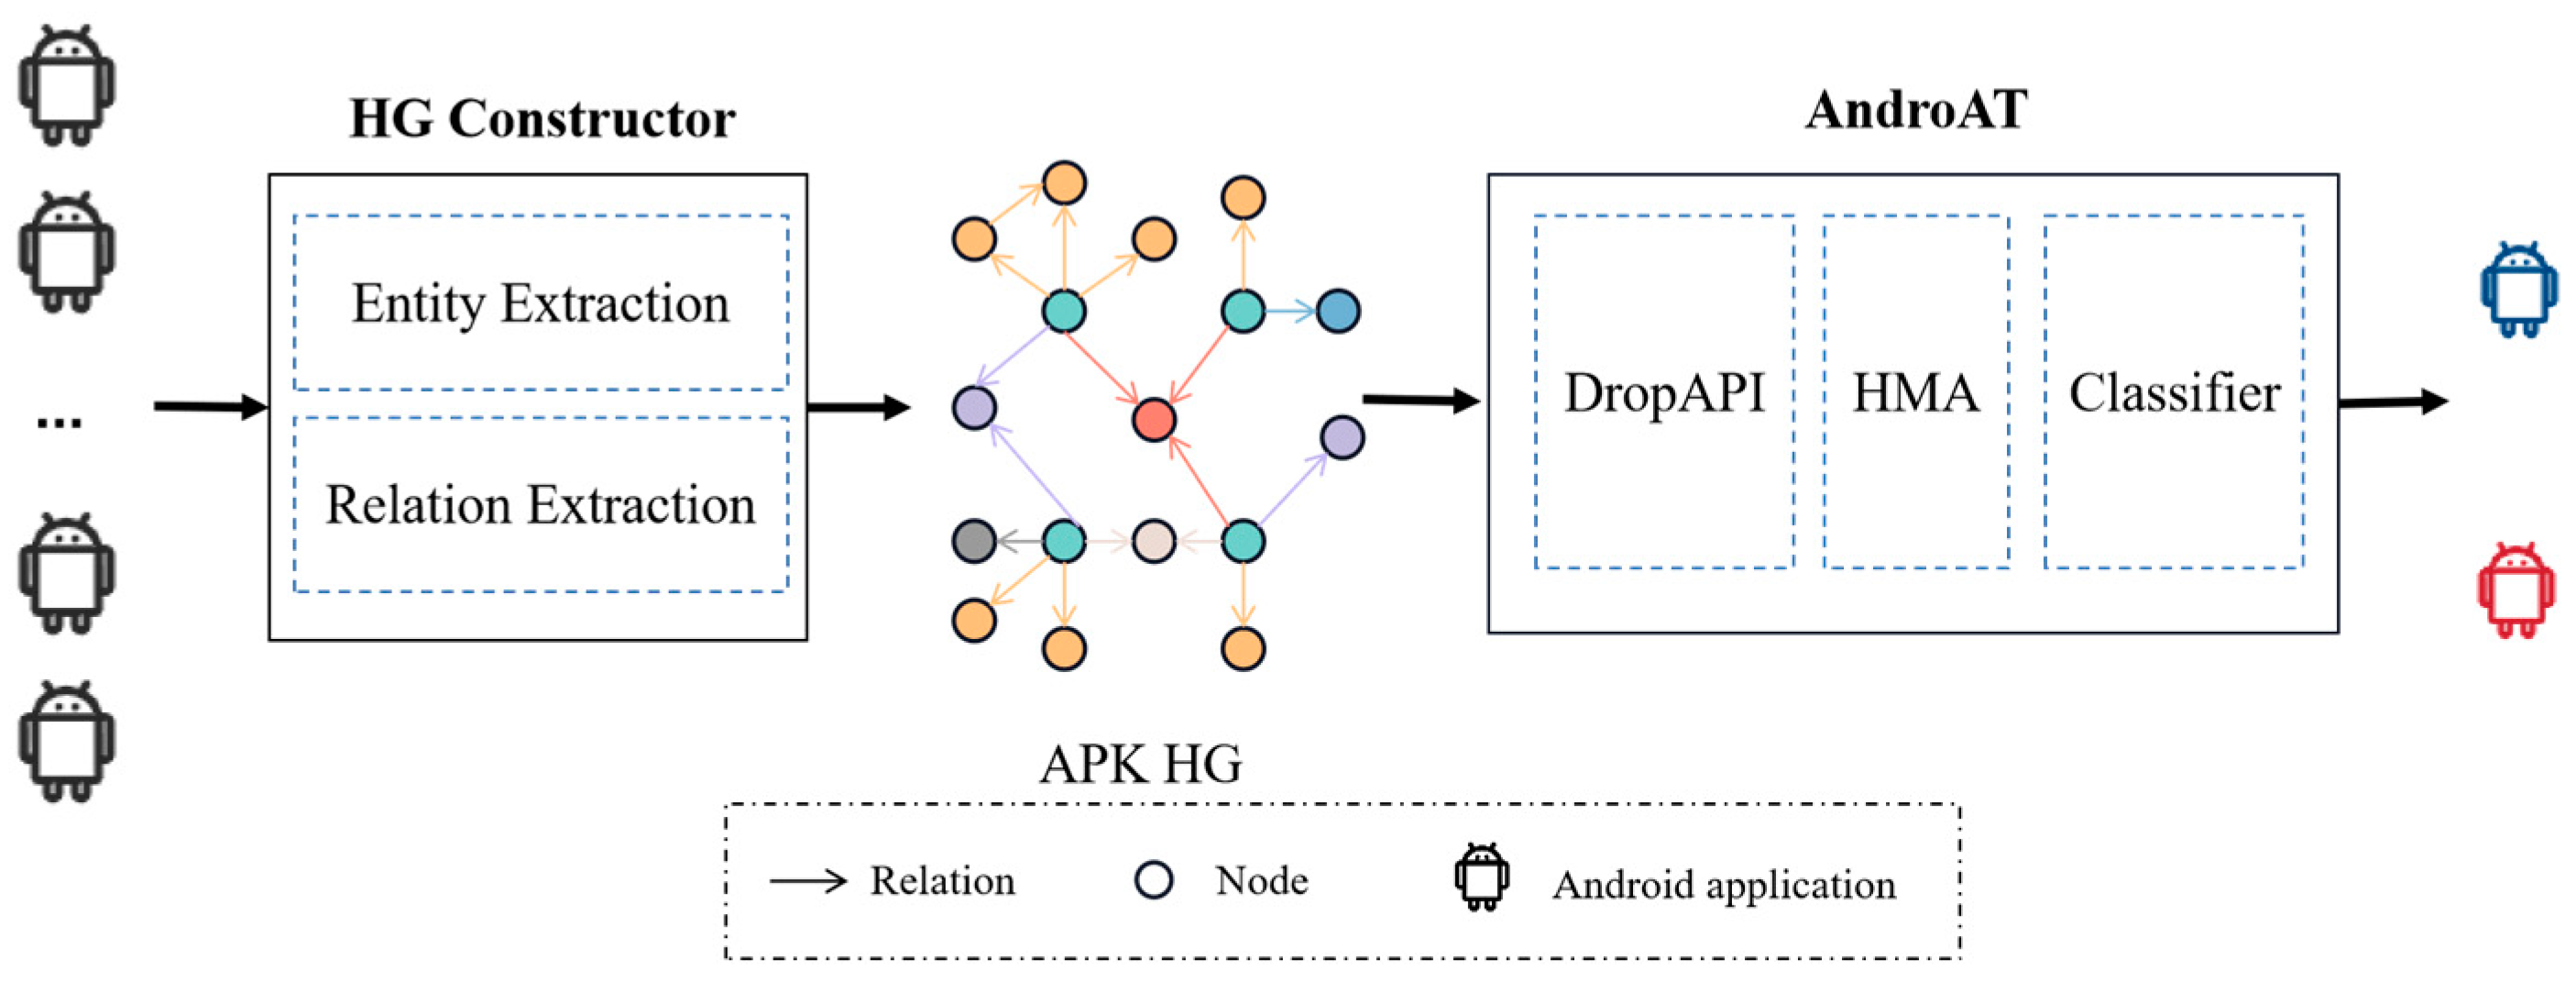
We propose an Android malware detection framework called HertDroid which can not only model the rich behavior patterns of malicious applications but can also incorporate complex structures of graphs and heterogeneous node features to identify malware without manually setting the meta-paths. Figure 2 illustrates the structure of HertDroid, which includes Heterogeneous Graph Constructor (i.e., HG Constructor) and Android APK Transformer (i.e., AndroAT) modules. In particular, HG constructor decompiles and extracts six types of entities and six types of relations with Androguard [26] respectively through Entity Extraction and Relation Extraction sub-modules to obtain APK Heterogeneous Graph (i.e., APK HG). The APK HG will be processed by AndroAT, which is in charge of fitting APK HG into an embedding generating module and determining whether the involved applications are malicious or not.
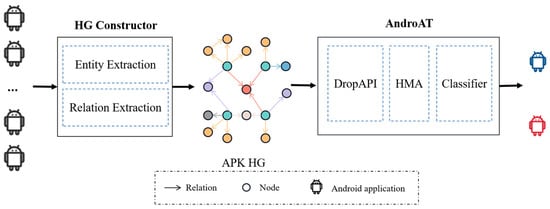
Figure 2.
Architecture of HertDroid. Android application in blue, red and black: benign application, malicious application and uncategorized application, respectively. Nodes and relations in multiple colors: multiple types of nodes and relations. APK HG: APK Heterogeneous Graph. AndroAT: Android APK Transformer. DropAPI: the DropAPI module. HMA: Heterogeneous Multi-component Attention.
4.2. Heterogeneous Graph Constructor
The present study employs the APK, which contains all of the necessary components for installing Android applications, as the input. To structure the abundant components in APKs, we introduce two sub-modules to build the HG.
The first sub-module is Entity Extraction. Table 1 displays the six types of nodes extracted from APKs based on domain knowledge. The node type called App represents the application analyzed by our method, while API, Feature, Permission, So, and Intent represent internal components of the APK. We extract these entities using Androguard and store them in Neo4j [27], a graph database management system capable of efficiently storing nodes, edges, and their properties, executing query statements, and providing query results. It is important to note that the name of a node is unique. Consequently, a new node is generated only if the entity is not present in the database during our analysis of each entity. This uniqueness feature ensures that two App nodes that share an entity are indirectly connected to each other. Additionally, to generate the features of these entities, we initialize the features of these types of nodes through One-hot encoding or Bag-of-words based on their names or properties.

Table 1.
Node types defined in HertDroid.
The second sub-module is Relation Extraction. Table 2 depicts the six types of relations in the APK HG that we have chosen. The DECLARES, PASSES, USES, HAS, CALLS type represent the appearance of a certain type of node in an Android application, while INVOKES shows the usage relationships between two APIs. We store these relations in Neo4j, similar to the process in Entity Extraction.
Table 2.
Relation types defined in HertDroid.
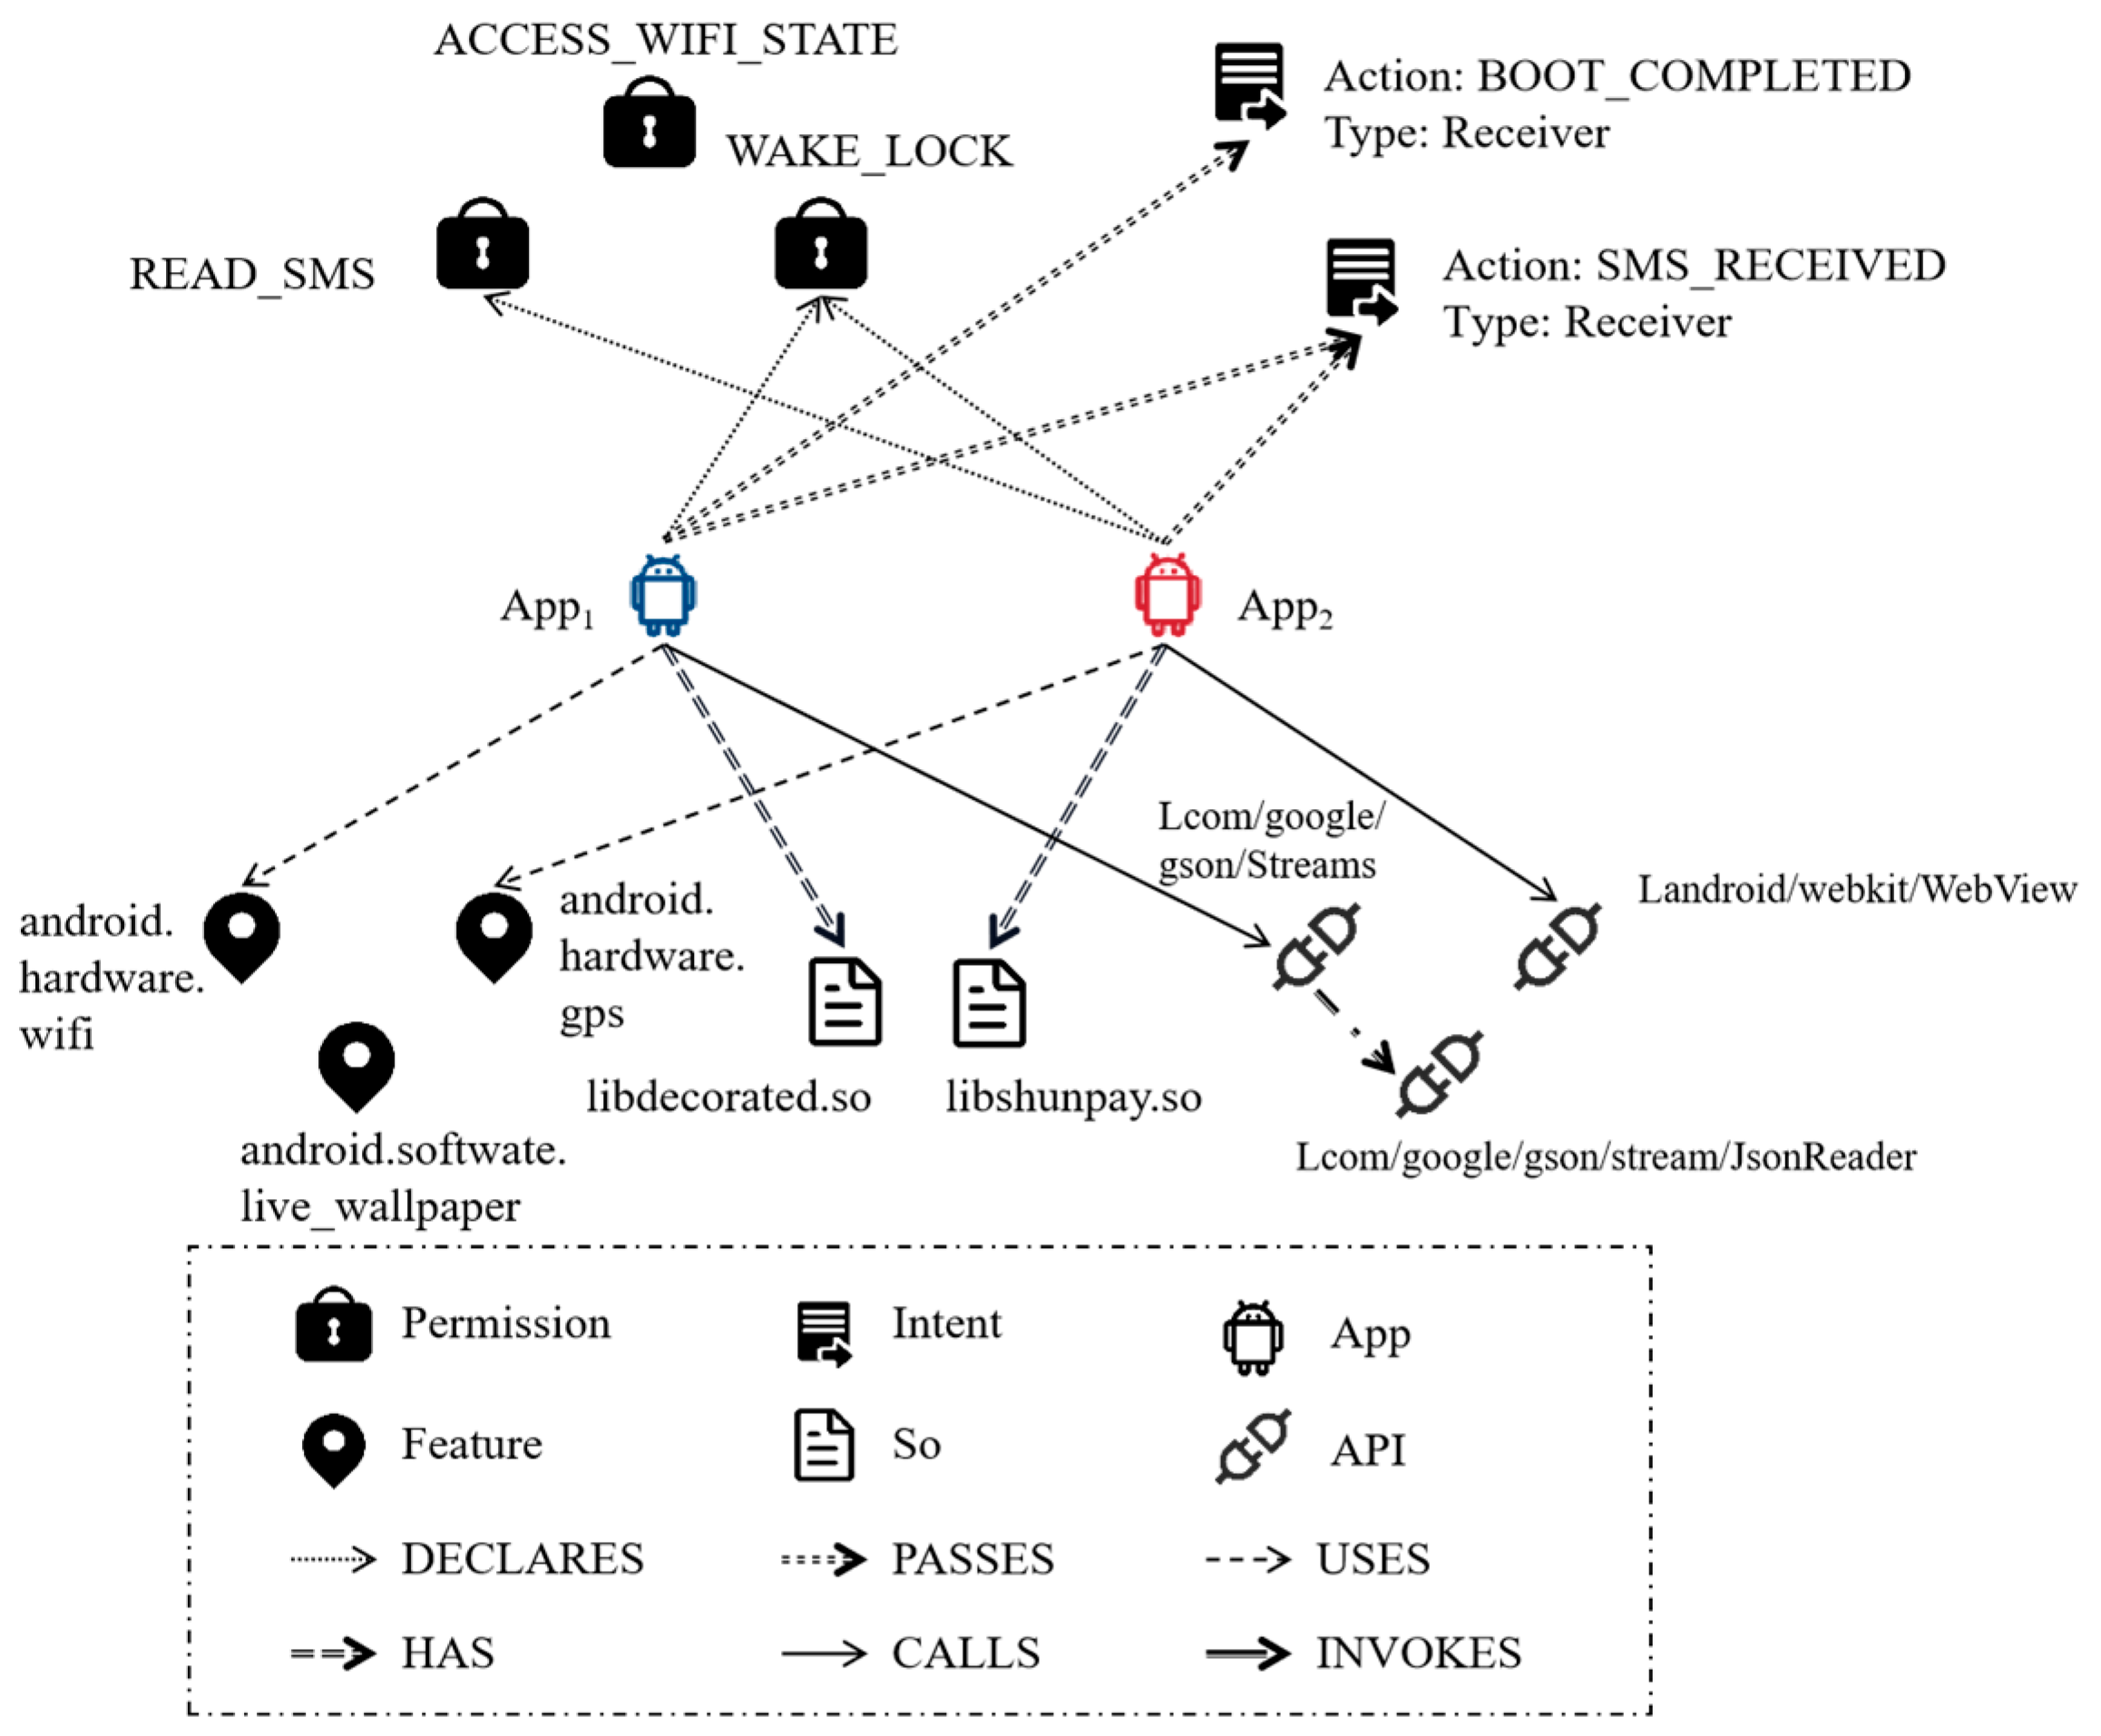
To provide a clearer illustration, consider a simplified APK HG depicted in Figure 3. This graph contains six types of nodes and six relations, namely node type and edge type . The malware application App1 declares a permission named READ_SMS, allowing it to access the content of SMS messages. Additionally, it utilizes an intent with the action of SMS_RECEIVED to inform the application that a new SMS message has been received by the device. Furthermore, the application employs a payment-related dynamic library file named libshunpay.so. It is possible that the application is designed to engage in misleading payment behavior by intercepting SMS verification codes. Although the benign application App2 also employs an intent with the action SMS_RECEIVED, no malicious behavior is identified based on other relationships associated with the application. Therefore, it can still be classified as benign. Moreover, additional malicious behavior patterns can be identified by analyzing influential API calls and features within the application.

Figure 3.
Simple example of an Android heterogeneous graph.
4.3. Android APK Transformer
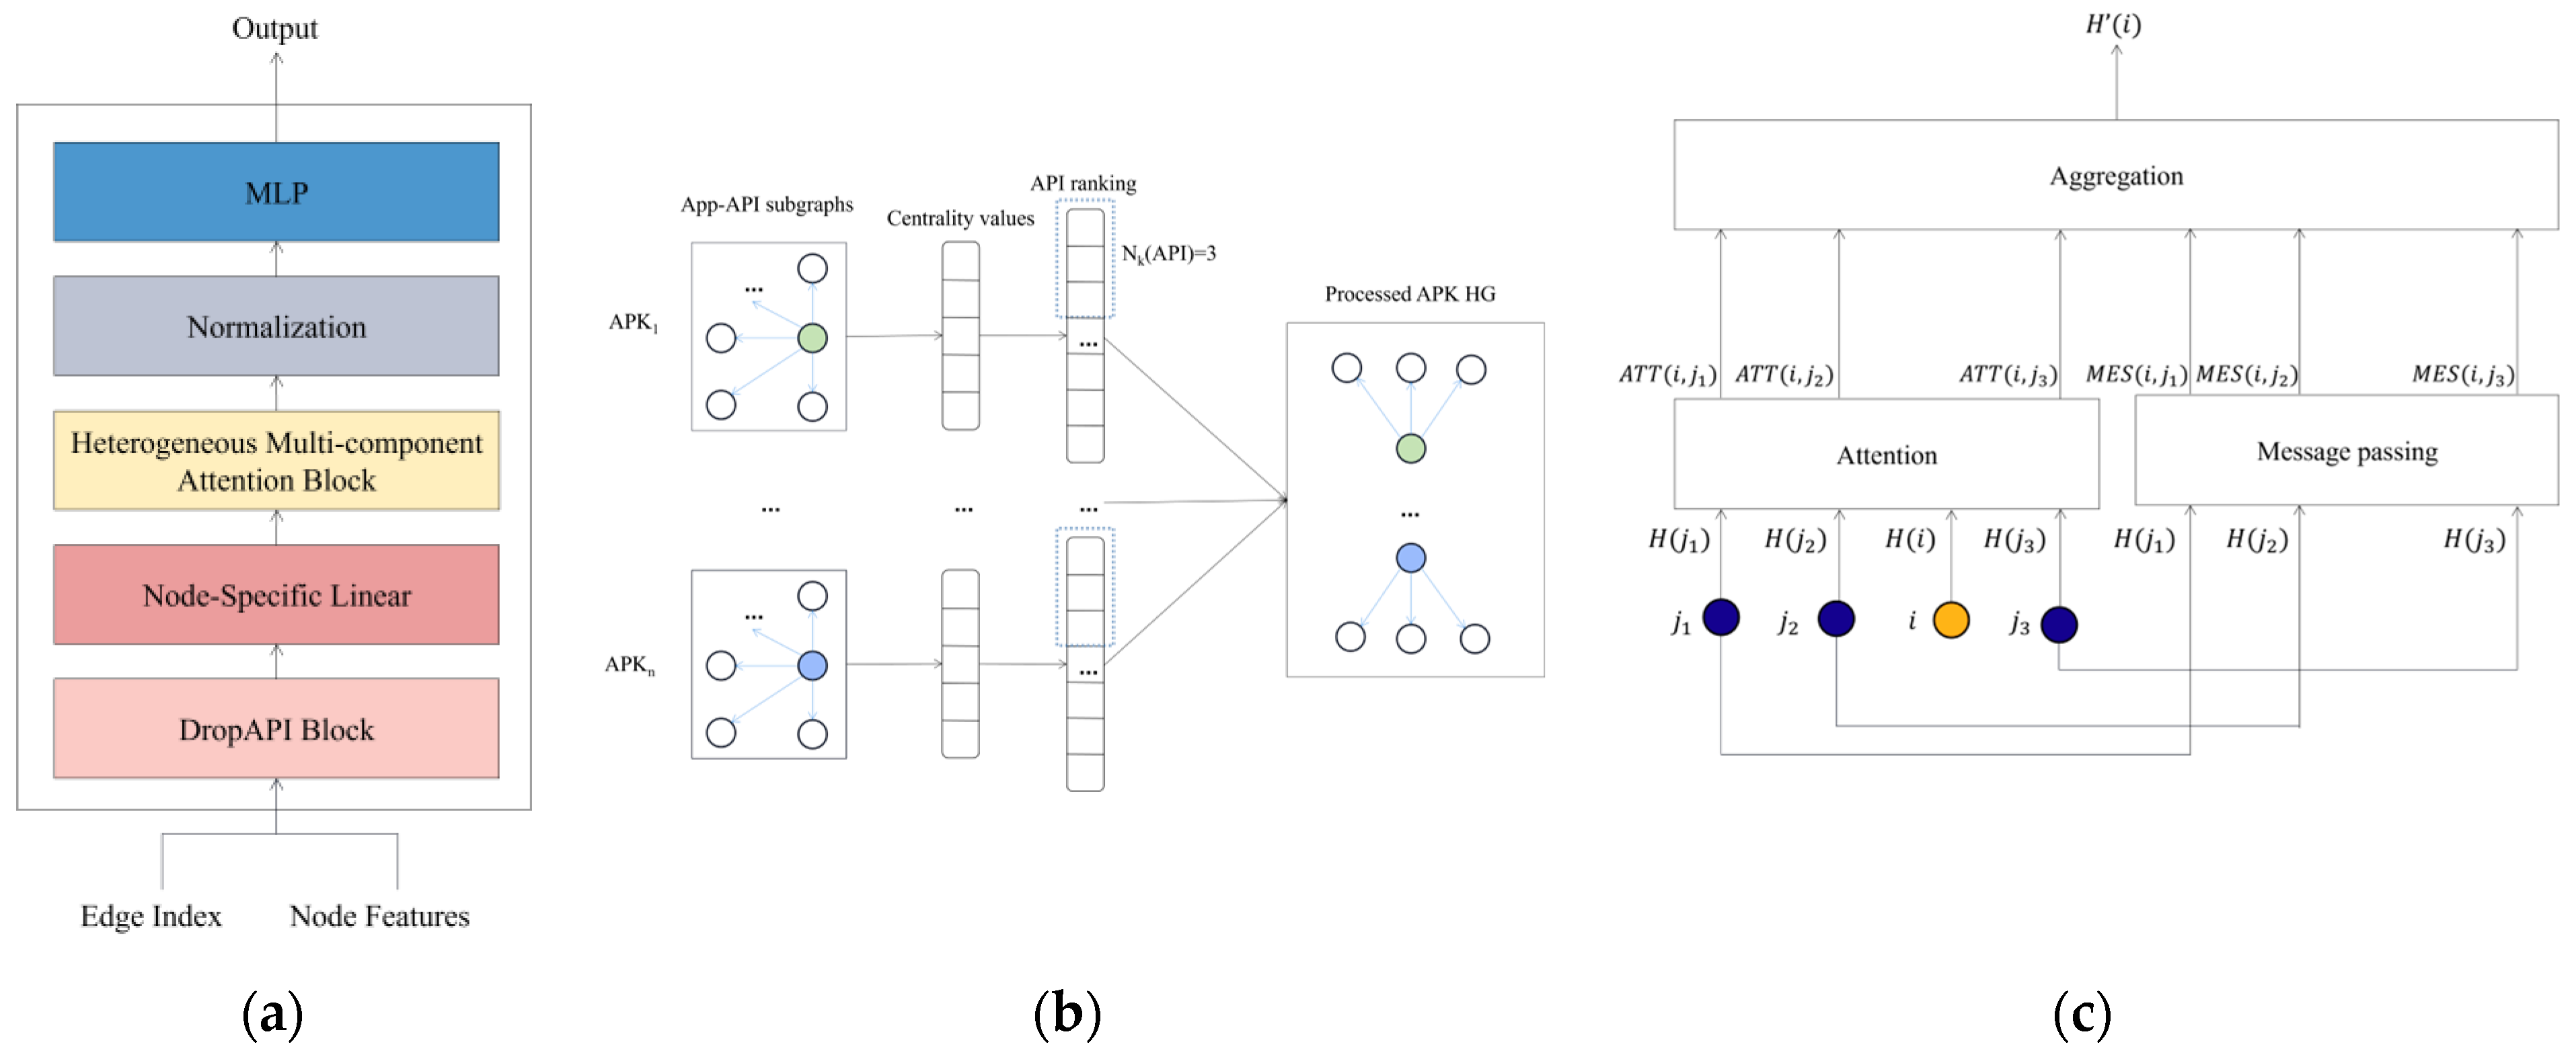
Android APK Transformer is designed to distinguish between benign applications and malware based on the APK HG. The architecture of AndroAT is shown in Figure 4a. AndroAT accepts node features and edge indices from the APK HG stored in the Neo4j database as input. This input is then converted into a dataset in the PyTorch Geometric (PyG) package [28] for subsequent processing. To improve the performance and reduce source consumption, we first remove a portion of APIs through the DropAPI module. Then, for each type of node, we apply a linear transformation and aggregate all features from neighbors using the heterogeneous multi-component self-attention module. After that, the embeddings of Apps are normalized and fed into a Multi-Layer Perceptron (MLP) to determine if the application poses a threat or not.

Figure 4.
Architecture of HertDroid. (a) Architecture of AndroAT; (b) architecture of DropAPI; (c) architecture of heterogeneous multi-component attention.
4.3.1. DropAPI
In order to increase the efficiency of HertDroid and reduce computational costs, we have designed a mechanism called DropAPI, the process of which is shown in Figure 4b. We first conduct a series of centrality calculations on the subgraph that includes both APP and API nodes for each application. Then, we employ a decision-making method called VIKOR [29] to rank API nodes according to their influence based on the centrality values described above. We only retain API nodes for each subgraph, which are the most important API nodes in subgraph. In other words, the less important API nodes will be dropped from the APK HG. Finally, the remaining nodes will be recombined to process the APK HG for use by later modules.
Centrality analysis allows for the evaluation of node influence or importance in a network. In this paper, we consider the flowing aspects to measure the influence of API nodes.
Betweenness Centrality (BC): The BC of a node represents the number of times that node lies on the shortest path between any two pairs of nodes in the graph:
where represents the number of nodes in the giant component, represents the number of shortest distances from node to node , and represents the number of shortest paths from node to node that pass through node .
Initially, we attempted to compute the betweenness centrality algorithm exactly. However, its computation time exceeded our tolerance threshold. For instance, when we applied an exact betweenness centrality computation to a test subgraph containing 712,687 nodes and 1,263,320 edges, it took more than 10 h to compute. Consequently, we turned to the approximate computation method proposed by Riondato and Kornaropoulos [30], implemented through Networkit [31]. This method employs random sampling of shortest paths to achieve an approximate betweenness centrality computation. Importantly, it provides theoretical probabilistic guarantees on the quality of the estimation.
Degree Centrality (DC): DC is calculated as the number of neighboring nodes divided by the total number of nodes in the network. In a directed graph, two nodes connected by an edge are considered neighbors of each other regardless of the direction of the edge, while in an undirected graph, they are considered neighbors if there is an edge between them. The formula for undirected graphs is as follows.
where is the th row and th column element of the adjacency matrix ; the value is the weight for weighted graphs and 1 for unweighted graphs. Node and are therefore required to be unequal in order to avoid the effect of self-loop on DC.
Harmonic Centrality (HC): HC indicates how close a node is to other nodes in the graph. A higher HC value indicates that the sum of distances from a node to other nodes in the graph is shorter:
where represents the number of nodes in the giant component, and represents the shortest distance from node to node .
PageRank (PR): PR represents the importance of a node based on both the incoming edges and the importance of the source nodes:
where represents a damping factor of [0, 1], represents a node pointing to node , a subset of the set of graph nodes, and represents the out-degree of .
In order to identify the most influential API nodes based on a series of centrality values, we conduct an algorithm called VIKOR. In VIKOR, describes the centrality values of API nodes in a subgraph of an application, where denotes the th API node and denotes the th centrality value. The and are collections of positive and negative centrality, respectively. Then, represents the weight of each centrality value generated by the coefficient of variation method, while is a coefficient between 0 and 1. The output of VIKOR is , which denotes the importance score of these API nodes. Subsequently, we rank the API nodes based on their , with nodes having smaller values ranked higher in importance. Finally, APK HG retains only the top API nodes in this subgraph.
Technically, considering the relatively large size of the graph, we implemented a strategy where, for each calculation, only a subset of connected components (consisting solely of APP nodes and API nodes) with a total node count of less than half a million and an edge count of less than one million were loaded. After completing the computation, only the important nodes are retained and stored in the database. Additionally, all unimportant API nodes are discarded before loading the complete graph.
4.3.2. Heterogeneous Multi-Component Attention
To handle the heterogeneity of APK HG, we build a heterogeneous multi-component attention (HMA) module to generate the embedding of APKs. The architecture of HMA is illustrated in Figure 4c.
To get the embedding of target node , formally, HMA can be expressed as below:
where denotes the source nodes of , and is the feature of . The activation function [32] is applied to the expression involving attention mechanism and neighborhood aggregation . Moreover, denotes the node type of , and both the trainable parameter and learnable matrix are specific to .
The calculates the weight of importance between pairs of nodes based on the associated node and edge types:
where is the dimension of nodes and denotes stacking. HMA employs a multi-head attention mechanism containing heads to calculate the weight of source node . Each attention head captures hidden relationships between target node and source node . It is worth noting that two different trainable transforms (i.e., and ) are specific to node type, and a projection matrix is specific to edge type .
Similar to , the message passing operator also involves a multi-head mechanism, which can be expressed formally as below.
where and are projection matrices.
5. Experiments
5.1. Datasets
To evaluate the effectiveness of our proposed method, we downloaded more than 25,000 APKs and removed the samples that cannot be analyzed by Androguard. Our final dataset consists of 20,297 APKs, with 10,361 classified as benign and 11,043 as malicious, spanning the years 2018 to 2022, as shown in Table 3. The benign samples were obtained from Google Play Store and AppChina with the assistance of Androzoo [33], while the malicious samples were acquired from VirusShare [34]. Specifically, we consider APKs from Androzoo as benign only if fewer than five antivirus engines from VirusTotal detected them as malware. The distribution of samples across each year is approximately equal, considering cases where APKs failed to be analyzed by Androguard or APKTool [35]. The dataset is partitioned into three subsets for training, validation, and testing, with a ratio of 8:1:1, respectively. It is worth noting that, due to memory constraints, experiments were conducted on datasets of varying sizes, all of which are subsets of the larger dataset containing 21,404 APKs.
Table 3.
Statistics of the datasets.
For our proposed model and the baselines based on GNNs, we begin by extracting six node types and six edge types using Androguard to construct a heterogeneous graph for our dataset. The graph is then stored in a Neo4j database for further use. Our constructed graph comprises over 178,000 nodes and 1.36 million edges based on our dataset. As for other baselines, the dataset is decompiled into Smali code using APKTool and prepared to be fed into these models.
5.2. Baselines and Evaluation Criteria
To validate the effectiveness of HertDroid, we compare it with the following state-of-the-art baselines using the evaluation criteria shown in Table 4. In the table, TP (i.e., True Positive) and FP (i.e., False Positive) represent the number of applications predicted to be malicious accurately and inaccurately, respectively, while TN (i.e., True Negative) and FN (i.e., False Negative) represent the number of applications predicted to be benign accurately and inaccurately, respectively.
Table 4.
Measurements of HertDroid and baselines.
To test the effectiveness of AndroAT, we employ several generic GNNs as our baselines, including:
- GCN [14] aggregates graph structure and node features through graph convolutions for homogeneous graphs to generate node embeddings;
- GAT [18] treats all nodes as nodes of the same type and computes attention for each node’s neighbor node.
- GATv2 [36] is an improvement of GAT that replaces the static attention mechanism with dynamic attention. This means that GATv2 is capable of changing the ranking of attention weights based on the query node.
- GraphSAGE [37] learns node representations by aggregating information from the node’s neighbors and recursively aggregates information from the node’s k-hop neighbors until a fixed-depth is reached. Similar to GAT, it is also a node generation method designed for homogeneous graphs.
- HAN [38] is a heterogeneous graph network utilizing meta-paths and attention mechanism. It first performs attention computation on the connected nodes of the target node and then performs attention computation on each meta-path after computing all nodes.
- Metapath2vec [39] is a node representation generation method for HG. Metapath2vec first specifies a meta-path and follows that path to randomly wander, constructs the heterogeneous neighborhood of each vertex, and finally computes the node embedding using the Skip-Gram model.
To further evaluate whether HertDroid performs well among the models based on heterogeneous GNNs, we convert GAT and GraphSAGE into heterogeneous GNNs. This involves duplicating the convolutional layers for each edge type and summing up the results to form the output embeddings, following the method proposed by Schlichtkrull et al. [40]. We refer to these two heterogeneous models as GAT-hete and GraphSAGE-hete. To evaluate these baselines, we replace these neural networks with AndroAT.
The second type of baseline consists of the methods specific for the area of Android malware detection, including:
- HinDroid [20] utilizes API calls and three types of relations to construct heterogeneous graphs and classify based on multi-kernel support vector machines.
- DroidEvlover [41] extracts features based on API occurrence and determines whether the application is benign or malicious by implementing a model pool such as Passive Aggressive and Online Gradient Descent.
5.3. Experiment Setup
In our experiments, we implemented the baselines based on GNNs with Pyg, while for DroidEvolver, we utilized the source codes provided in the original paper. Additionally, we re-implemented HinDroid. These experiments were conducted in the environment specified in Table 5. In addition, we utilized two-hop paths between nodes of different types (e.g., Permission) in methods that required manual specification of meta-paths. It is worth noting that for the generic baselines, we adopted a structure comprising two convolutional layers and one linear layer in our experiments.
For our proposed framework, we configured the learning rate to be 0.01 and employed the mini-batch technique with a batch size of 512. The weight decay of the optimizer was set to 0.0005. Furthermore, we specified that all multi-headed attention or multi-headed messaging should utilize eight heads, and we set the hidden channels to 128. For the baselines, we set the hyperparameters according to the recommended parameters of each baseline’s paper. In cases where the baseline papers did not explicitly specify certain hyperparameters, we aligned them consistently with the configuration of HertDroid.
With regards to the training techniques, the experiments were optimized using the AdamW optimizer [42]. To control the number of epochs, we implemented the early stopping method based on the validation loss, with a maximum of 200 epochs and a patience threshold set to 20 epochs. Furthermore, we employed the mini-batch technique with a heterogeneous graph sampler [23] and a neighbor sampler [37] for heterogeneous and homogeneous graphs, respectively. The number of input nodes for loaders was set to 128, and we sampled 512 nodes per iteration for four iterations. It is noteworthy that we used different loaders for the training, validation, and testing sets. This ensures that the application nodes in the testing set do not appear in the training or validation sets, thereby preventing potential information leakage.
Table 5.
Environment of evaluation.
Table 5.
Environment of evaluation.
| Environment | Version | Environment Type |
|---|---|---|
| GPU | NVIDIA RTX4090 | Hardware |
| Python | 3.8.10 | Programming language |
| Androguard [26] | 3.3.5 | Decompiled tool |
| Pytorch [43] | 1.12.1 | Python package |
| Pytorch Geometric [28] | 2.1.0.post1 | Python package |
| Networkit [31] | 10.1 | Python package |
| Pandas [44] | 1.5.2 | Python package |
| Matplotlib [45] | 3.5.2 | Python package |
| Neo4j [27] | 4.4.17 | Database |
5.4. Experiment Results and Discussion
We trained each baseline and our proposed method five times and selected the training with the median F1 scores; the experimental results are presented below.
5.4.1. Comparison with Domain-Specific Baselines
The comparative experimental results of methods dedicated to Android malware detection are presented in Table 6. Our approach surpasses the performance of these two baseline methods, with average improvements of 2.42% and 5.78%, respectively, on a smaller dataset.
Table 6.
Comparative experimental results of domain-specific baselines.
The reason we employed a limited dataset is as follows. In our experimentation with HinDroid, we utilized a dataset comprising 21,404 APKs and encountered issues related to memory overflow. Due to constraints in available memory, we opted to adhere to the sample size specified in [20] to experiment with our specialized Android malware detection models. This small dataset comprises 1834 training APKs (with 920 benign and 914 malicious samples) and 500 testing APKs (with 198 benign and 302 malicious samples). Additionally, for HinDroid, we only considered the results of the meta-path ABA, as it demonstrated superior performance within the HinDroid framework.
5.4.2. Comparison with GNN Baselines
From Table 7, we can see that HertDroid outperforms these generic baselines and achieves the highest F1 value. The average F1 improvements of HertDroid is 7.94% compared to homogeneous baselines, such as GAT, GATv2, GCN, GraphSAGE, and 12.49% compared to heterogenous baselines like GAT-hete, Graph-hete, HAN, and Metapath2vec.
Table 7.
Comparative experimental results of GNN baselines.
Furthermore, the number of parameters of HertDroid is smaller than most of the baselines except GCN and GAT. For instance, the number of parameters of GATv2 is approximately 10 times that of HertDroid.
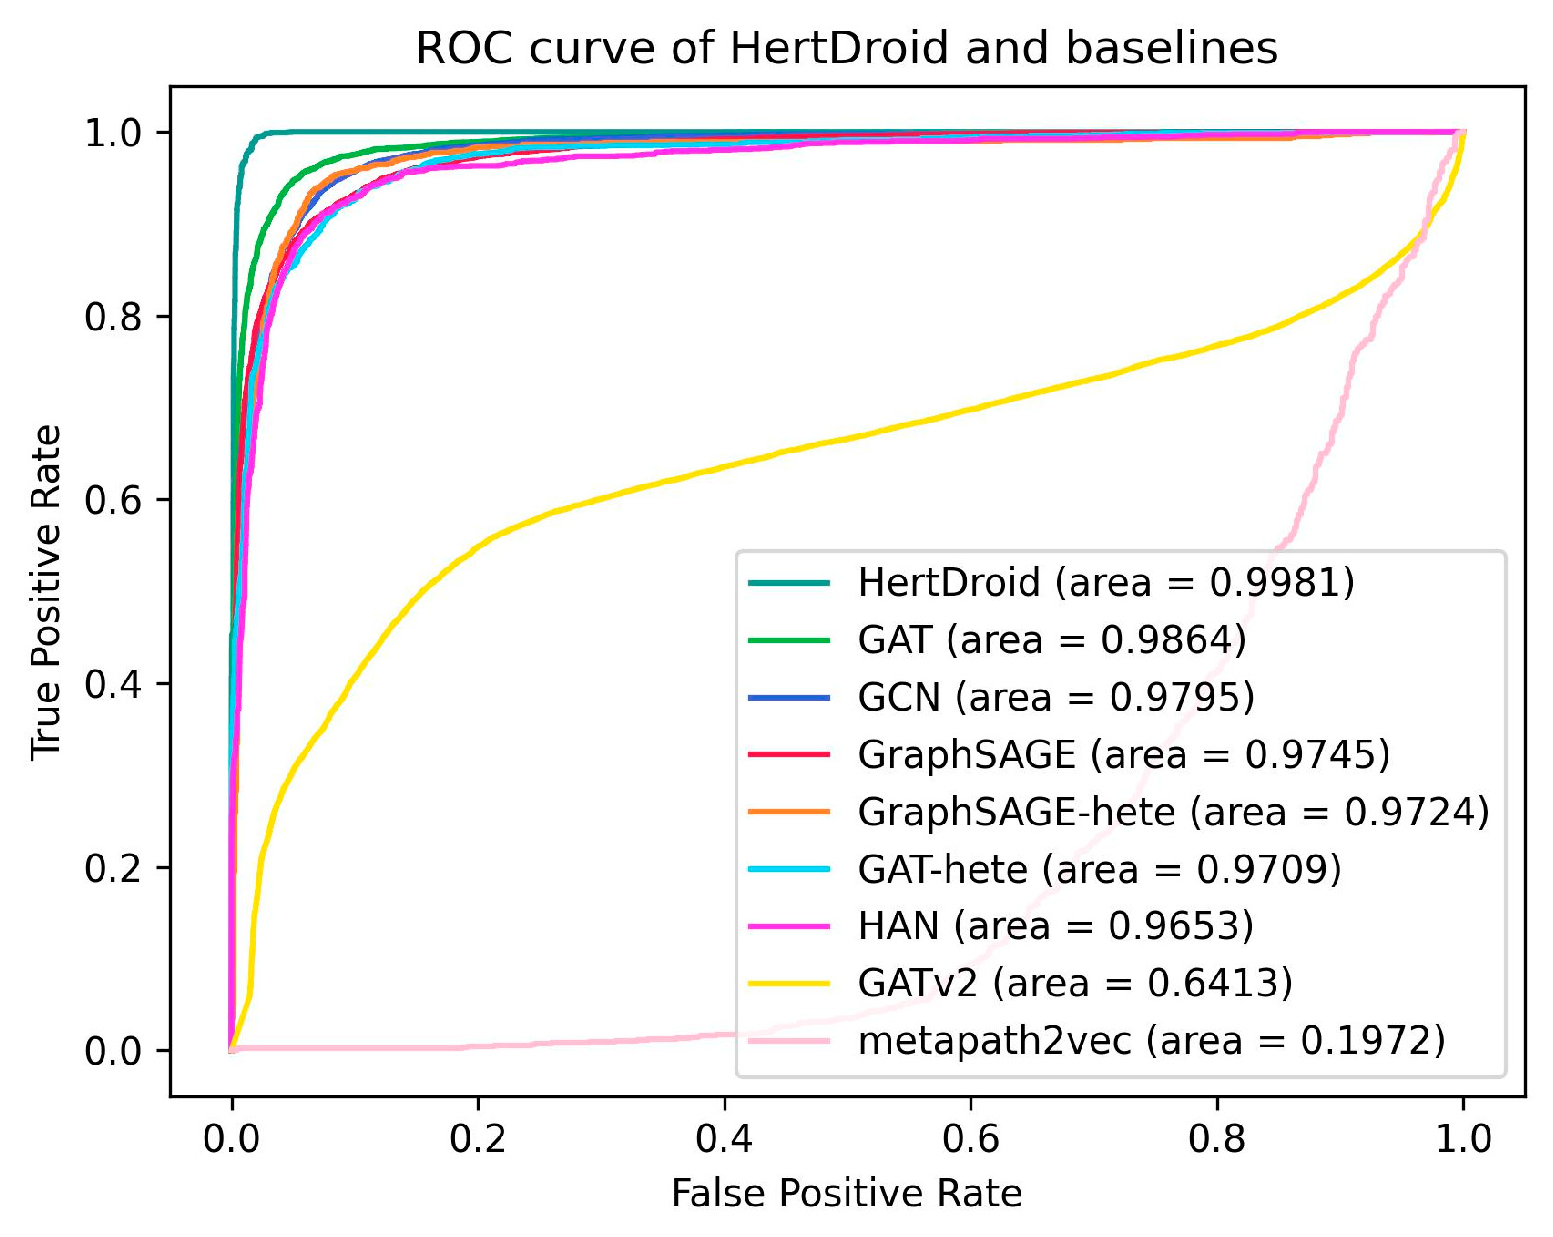
To access the recognition capabilities of each model for the malicious samples, we present the ROC (Receiver Operating Characteristic) curve of baselines and HertDroid in Figure 5. The figure reveals that HertDroid attains the highest area under the ROC curve (AUC) value, specifically 99.81%. Following closely, GAT achieves the next highest AUC value. Therefore, compared with generic baselines, HertDroid is more suitable for Android malware detection with the highest sensitivity and the lowest false positive rate.
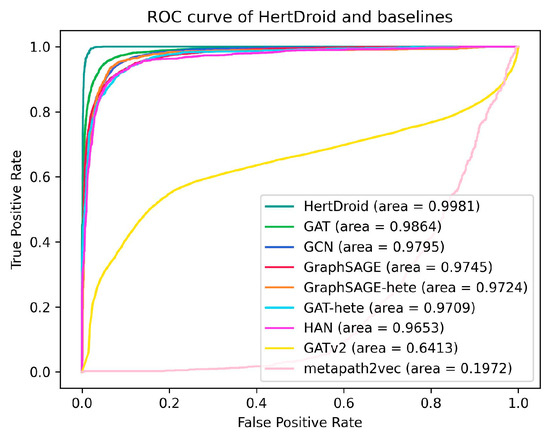
Figure 5.
ROC curves of HertDroid and baselines.
In summary, our method demonstrates superior performance compared to all baselines, while also maintaining a lower parameter count compared to heterogeneous baselines. Importantly, our approach achieves this without the need for manual configuration of meta-paths, highlighting its efficiency and effectiveness in the domain of Android malware detection.
5.5. Components Evaluation
5.5.1. Importance of DropAPI
The DropAPI is necessary for two reasons. First, it addresses the issue of high computational costs associated with incorporating too many APIs [46]. To illustrate, we randomly selected a sample set comprising 200 applications, with an equal split between benign and malicious ones. Constructing a heterogeneous graph (HG) containing all API calls from these APKs, we analyzed them using Androguard. The resulting Neo4j database contained 284,464 nodes for API nodes and 102 nodes for the other four types combined, indicating that 99.89% of the nodes were API nodes. Additionally, when we increased the number of applications to 500 for training our baselines and HertDroid, we encountered memory overflow problems in all models. This underscores that the absence of the DropAPI module would substantially increase computational costs.
Second, including this module is imperative due to the problem of low performance associated with incorporating too many weakly correlated APIs [47]. We fed the HG with 200 applications into the GAT and GCN models, two models with the fewest parameters among the baselines. Both GAT and GCN models yielded F1 values of less than 0.7. In summary, the DropAPI module adopted in this paper not only reduces the consumption of computing resources but also improves the detection ability of the entire model.
5.5.2. Importance of Using HG to Express Android APKs
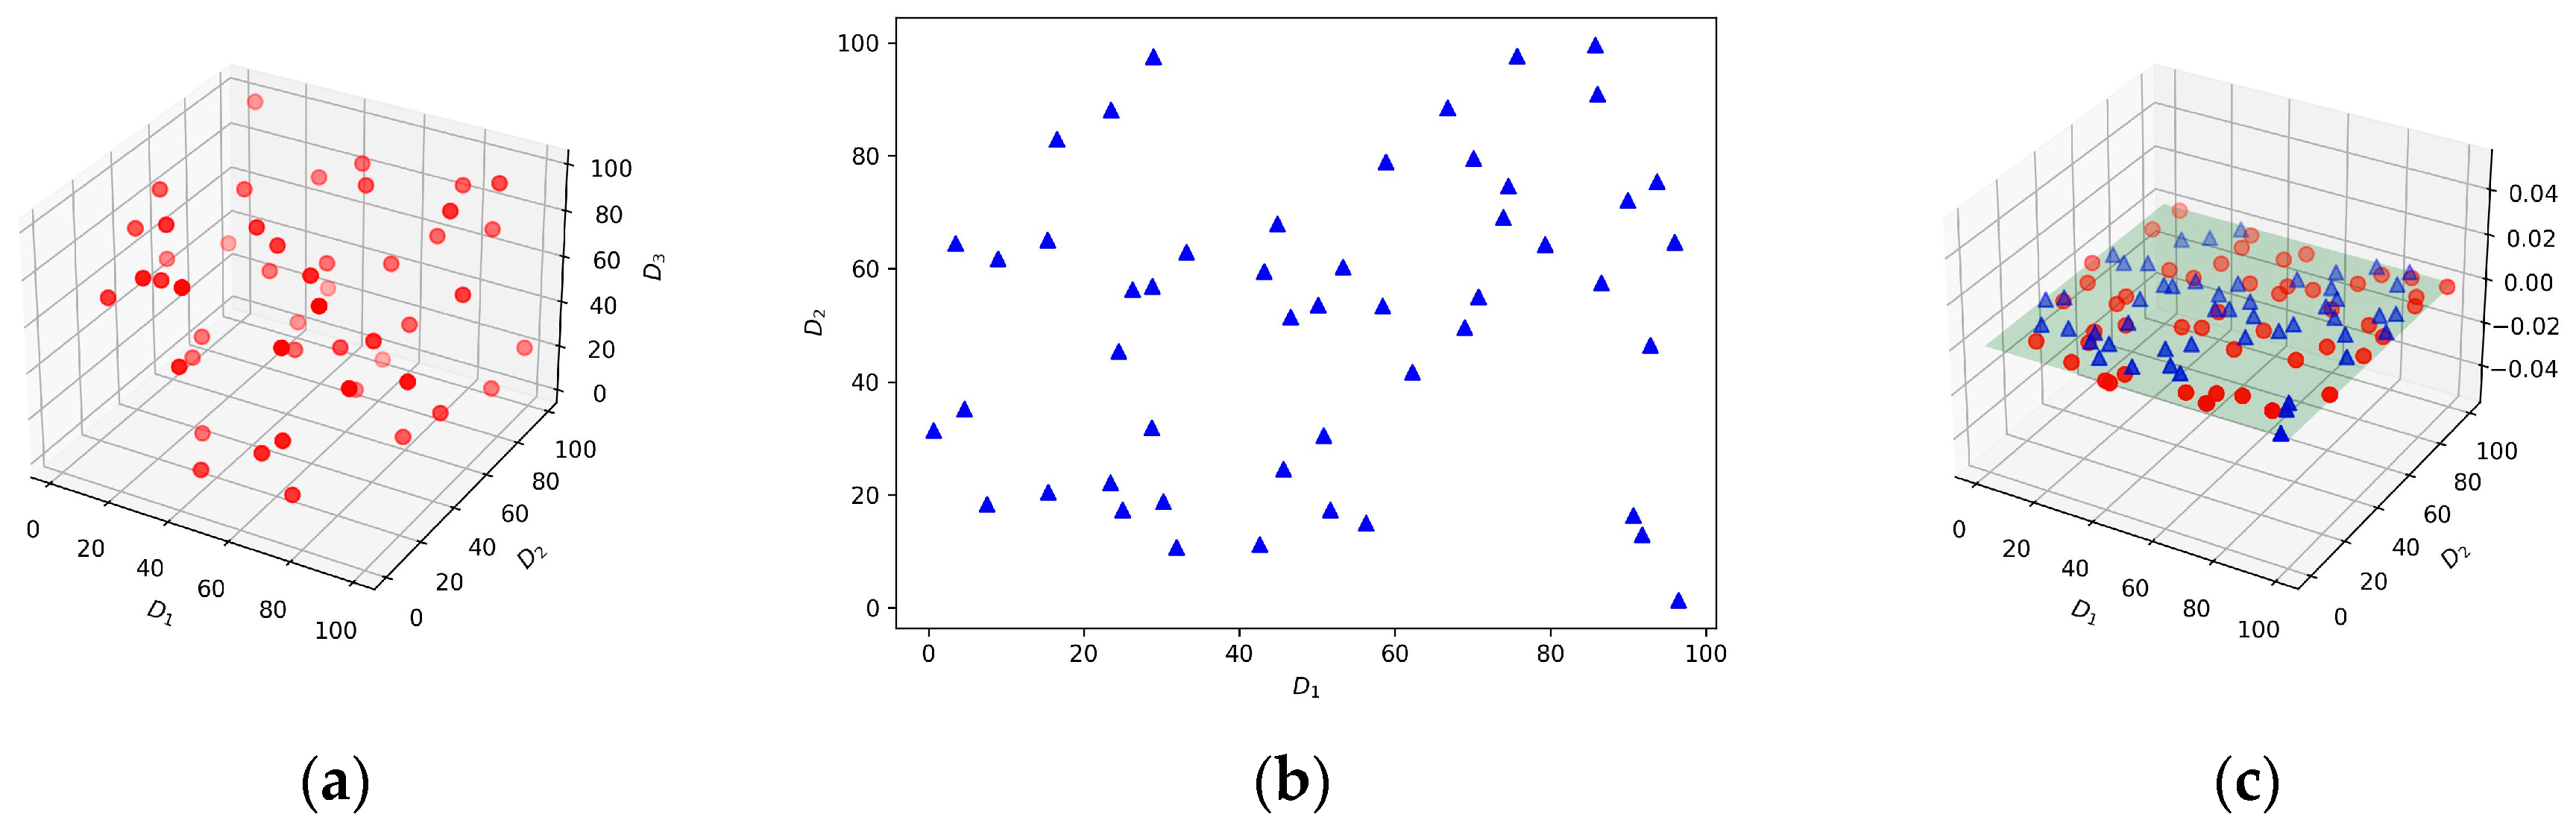
Suppose that Permission and So are represented as 3-dimensional and 2-dimensional vectors, as depicted in Figure 6a and Figure 6b, respectively. If treated as distinct node types, the 3D Permission and 2D So nodes will be directed to separate linear layers. The parameters of these layers will undergo individual adjustments through backward propagation. This segregation in processing allows for tailored parameter updates based on the characteristics inherent to each node type. Conversely, in the case of transforming these nodes into a homogeneous graph, all nodes, regardless of their type (3D Permission or 2D So), will inhabit a unified feature space, as illustrated in Figure 6c. Consequently, the adoption of a heterogeneous graph becomes imperative for effectively capturing and extracting the nuanced semantics of diverse behaviors within the model.
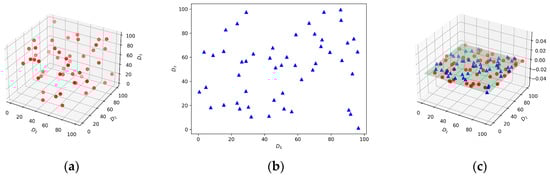
Figure 6.
Examples of feature space in heterogeneous and homogeneous graphs. (a) Feature space of Permission nodes; (b) feature space of So nodes; (c) feature space in a homogeneous graph. The blue and red nodes represent benign samples and malicious samples, respectively.
5.5.3. Importance of Embedding Model for HG without Manually Setting Meta-Paths
A graph embedding model can efficiently convert graph data into low-dimensional vectors, supporting downstream tasks such as classification and visualization [48]. Our method adopts the embedding model based on three primary considerations. Firstly, the embedding model approach effectively preserves the complex topology of graph data [49]. This method involves analyzing the connections between nodes during the conversion of high-dimensional graph data into low-dimensional vectors. Secondly, the embedding models have lower computational and memory resource requirements. Traditional machine learning methods often entail the storage of a large number of feature vectors, which can significantly increase computation and memory demands, especially on large-scale datasets. In contrast, embedding models typically have fewer parameters and many of them support the mini-batch technique, which allows them to process large datasets efficiently under limited computational resources. Thirdly, the graph embedding model has been demonstrated to enhance performance across various tasks [50]. One reason for this improvement is the automatic learning of features. While the embedding model also involves feature generation for each component of the Android application, it distinguishes itself from traditional machine learning methods by eliminating the need for manual feature engineering. Instead, the embedding model enhances performance by learning how to represent the data optimally.
Meta-paths define the complex semantic relationships between source nodes and target nodes, which is a common method to structure heterogeneous graphs. In the context of malware detection, an intuitive meta-path is denoted as App-X-App, where X signifies other node types excluding App. This implies that two applications are similar if they share the same entity, such as a permission.
However, the experimental results of HAN and Metapath2vec in Section 5.4 reveal that the schema of meta-paths like App-X-App is not efficient in modeling the structure of APK HGs. Despite the general efficacy of heterogeneous embedding models based on meta-paths, the identification of effective meta-paths within a specific domain is profoundly context-dependent.
Thus, we employ an embedding generation model for HGs capable of autonomously learning meta-paths and adjusting their importance. This approach is adopted to optimize the model’s performance and simplify its usability, as it allows the model to dynamically adapt and optimize the relevance of meta-paths without manual intervention.
5.6. Visualization
To present the experimental results more intuitively, the embeddings of APP nodes are visualized in Figure 7, where the purple nodes represent malicious applications, and the yellow nodes represent benign applications. First, we selected the baseline with the fewest parameters, i.e., GAT, and the baseline with the highest F1 value, GraphSAGE-hete. Second, we employed the t-SNE algorithm [51] with Euclidean distance to reduce high-dimensional vectors to 2-dimensional vectors. Third, we randomly selected 2000 nodes and displayed the results on the canvas.
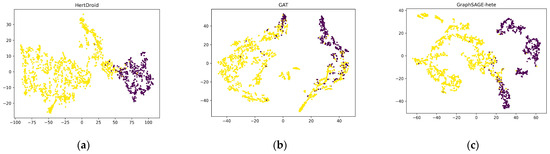
Figure 7.
Visualization of embedding of APP type. (a) Embedding of APP nodes generated by HertDroid; (b) embedding of APP nodes generated by GAT; (c) embedding of APP nodes generated by GraphSAGE-hete. Purple nodes represent malicious applications; yellow nodes represent benign applications.
The visualization indicates that, in HertDroid, the two clusters of malicious and benign applications are farther apart than in the other two models. Compared with GraphSAGE-hete, HertDroid has a clearer boundary between the two clusters. Moreover, there are more purple points in the yellow cluster in GAT, indicating the outperformance of HertDroid. Therefore, HertDroid can accurately capture the semantic relationship between malicious and benign Android applications, enabling better judgment of whether the application poses a threat of malicious activity.
6. Conclusions
This paper introduces HertDroid, an Android malware detection method based on centrality calculation and a transformer for Android heterogeneous graph analysis. Initially, entities and relations from APKs are modeled as a heterogeneous graph. Subsequently, a method incorporating centrality calculation from multiple perspectives is employed, followed by decision-making utilizing the VIKOR algorithm. The processed heterogeneous graph undergoes analysis by the Android APK Transformer without the need for manually setting meta-paths, resulting in the generation of embeddings for each application. These embeddings are then utilized to train a classifier for identifying Android malwares.
Experimental results based on 10,361 benign and 11,043 malicious applications demonstrate that HertDroid outperforms both domain-specific and generic baselines in terms of F1 scores. Compared with domain-specific baselines, HertDroid not only processes more data but also supports mini-batch processing, thereby reducing memory requirements during execution. Furthermore, HertDroid maintains a relatively small number of parameters compared to generic baselines.
Author Contributions
Conceptualization, D.L. and X.M.; methodology, D.L. and X.M.; software, X.M.; validation, D.L.; formal analysis, D.L. and X.M.; investigation, D.L. and X.M.; resources, D.L.; data curation, D.L. and X.M.; writing—original draft preparation, X.M.; writing—review and editing, D.L.; supervision, D.L.; project administration, D.L.; funding acquisition, D.L. All authors have read and agreed to the published version of the manuscript.
Funding
This research was funded by the National Natural Science Foundation of China (NSFC) through grant 61662004.
Institutional Review Board Statement
Not applicable.
Informed Consent Statement
Not applicable.
Data Availability Statement
The data presented in this study are available on request from the corresponding author. The data are not publicly available due to privacy.
Acknowledgments
We express our gratitude to the editor and the anonymous reviewers of this paper for their valuable and constructive feedback.
Conflicts of Interest
The authors declare no conflicts of interest.
References
- Statcounter. Available online: https://gs.statcounter.com/os-market-share/mobile/worldwide/#yearly-2023-2023-bar (accessed on 10 February 2024).
- Wu, Y.; Li, M.; Zeng, Q.; Yang, T.; Wang, J.; Fang, Z.; Cheng, L. DroidRL: Feature selection for android malware detection with reinforcement learning. Comput. Secur. 2023, 128, 103126. [Google Scholar] [CrossRef]
- Sharma, T.; Rattan, D. Malicious application detection in android—A systematic literature review. Comput. Sci. Rev. 2021, 40, 100373. [Google Scholar] [CrossRef]
- Pan, Y.; Ge, X.; Fang, C.; Fan, Y. A systematic literature review of android malware detection using static analysis. IEEE Access 2020, 8, 116363–116379. [Google Scholar] [CrossRef]
- Sharma, A.; Gupta, B.B.; Singh, A.K.; Saraswat, V. Orchestration of APT malware evasive manoeuvers employed for eluding anti-virus and sandbox defense. Comput. Secur. 2022, 115, 102627. [Google Scholar] [CrossRef]
- Şahin, D.Ö.; Kural, O.E.; Akleylek, S.; Kl, E. A novel permission-based Android malware detection system using feature selection based on linear regression. Neural Comput. Appl. 2021, 35, 4903–4918. [Google Scholar] [CrossRef]
- Arora, A.; Peddoju, S.K.; Conti, M. Permpair: Android malware detection using permission pairs. IEEE Trans. Inf. Forensics Secur. 2019, 15, 1968–1982. [Google Scholar] [CrossRef]
- Mohamad Arif, J.; Ab Razak, M.F.; Awang, S.; Tuan Mat, S.R.; Ismail, N.S.N.; Firdaus, A. A static analysis approach for Android permission-based malware detection systems. PLoS ONE 2021, 16, e0257968. [Google Scholar] [CrossRef] [PubMed]
- Shen, F.; Del Vecchio, J.; Mohaisen, A.; Ko, S.Y.; Ziarek, L. Android malware detection using complex-flows. IEEE Trans. Mob. Comput. 2018, 18, 1231–1245. [Google Scholar] [CrossRef]
- Pektaş, A.; Acarman, T. Deep learning for effective Android malware detection using API call graph embeddings. Soft Comput. 2020, 24, 1027–1043. [Google Scholar] [CrossRef]
- Li, D.; Zhao, L.; Cheng, Q.; Lu, N.; Shi, W. Opcode sequence analysis of Android malware by a convolutional neural network. Concurr. Comput. Pract. Exp. 2020, 32, e5308. [Google Scholar] [CrossRef]
- Tang, J.; Li, R.; Jiang, Y.; Gu, X.; Li, Y. Android malware obfuscation variants detection method based on multi-granularity opcode features. Future Gener. Comput. Syst. 2022, 129, 141–151. [Google Scholar] [CrossRef]
- Zhou, J.; Cui, G.; Hu, S.; Zhang, Z.; Yang, C.; Liu, Z.; Wang, L.; Li, C.; Sun, M. Graph neural networks: A review of methods and applications. AI Open 2020, 1, 57–81. [Google Scholar] [CrossRef]
- Kipf, T.N.; Welling, M. Semi-supervised classification with graph convolutional networks. arXiv 2016, arXiv:1609.02907. [Google Scholar]
- Wu, Z.; Pan, S.; Chen, F.; Long, G.; Zhang, C.; Philip, S.Y. A comprehensive survey on graph neural networks. IEEE Trans. Neural Netw. Learn. Syst. 2020, 32, 4–24. [Google Scholar] [CrossRef]
- Zhang, S.; Tong, H.; Xu, J.; Maciejewski, R. Graph convolutional networks: A comprehensive review. Comput. Soc. Netw. 2019, 6, 11. [Google Scholar] [CrossRef] [PubMed]
- Feng, P.; Yang, L.; Lu, D.; Xi, N.; Ma, J. BejaGNN: Behavior-based Java Malware Detection via Graph Neural Network. J. Supercomput. 2023, 79, 15390–15414. [Google Scholar] [CrossRef] [PubMed]
- Velikovi, P.; Cucurull, G.; Casanova, A.; Romero, A.; Lio, P.; Bengio, Y. Graph attention networks. arXiv 2017, arXiv:1710.10903. [Google Scholar]
- Gao, H.; Cheng, S.; Zhang, W. GDroid: Android malware detection and classification with graph convolutional network. Comput. Secur. 2021, 106, 102264. [Google Scholar] [CrossRef]
- Hou, S.; Ye, Y.; Song, Y.; Abdulhayoglu, M. Hindroid: An intelligent android malware detection system based on structured heterogeneous information network. In Proceedings of the 23rd ACM SIGKDD International Conference on Knowledge Discovery and Data Mining, Halifax, NS, Canada, 13–17 August 2017; pp. 1507–1515. [Google Scholar]
- Hei, Y.; Yang, R.; Peng, H.; Wang, L.; Xu, X.; Liu, J.; Liu, H.; Xu, J.; Sun, L. Hawk: Rapid android malware detection through heterogeneous graph attention networks. IEEE Trans. Neural Netw. Learn. Syst. 2021, 35, 4703–4717. [Google Scholar] [CrossRef] [PubMed]
- Ye, Y.; Hou, S.; Chen, L.; Lei, J.; Wan, W.; Wang, J.; Xiong, Q.; Shao, F. Out-of-sample node representation learning for heterogeneous graph in real-time android malware detection. In Proceedings of the 28th International Joint Conference on Artificial Intelligence (IJCAI), Macao, China, 10–16 August 2019. [Google Scholar]
- Hu, Z.; Dong, Y.; Wang, K.; Sun, Y. Heterogeneous graph transformer. In Proceedings of the Web Conference 2020, Taipei, Taiwan, 20–24 April 2020; pp. 2704–2710. [Google Scholar]
- Yang, X.; Yan, M.; Pan, S.; Ye, X.; Fan, D. Simple and efficient heterogeneous graph neural network. In Proceedings of the AAAI Conference on Artificial Intelligence, Washington, DC, USA, 7–14 February 2023; pp. 10816–10824. [Google Scholar]
- Sun, Y.; Han, J.; Yan, X.; Yu, P.S.; Wu, T. Pathsim: Meta path-based top-k similarity search in heterogeneous information networks. Proc. VLDB Endow. 2011, 4, 992–1003. [Google Scholar] [CrossRef]
- Androguard. Available online: https://github.com/androguard/androguard (accessed on 10 April 2023).
- Neo4j. Available online: https://github.com/neo4j/neo4j (accessed on 13 April 2023).
- Fey, M.; Lenssen, J.E. Fast graph representation learning with PyTorch Geometric. arXiv 2019, arXiv:1903.02428. [Google Scholar]
- Akram, M.; Kahraman, C.; Zahid, K. Group decision-making based on complex spherical fuzzy VIKOR approach. Knowl. Based Syst. 2021, 216, 106793. [Google Scholar] [CrossRef]
- Riondato, M.; Kornaropoulos, E.M. Fast approximation of betweenness centrality through sampling. In Proceedings of the 7th ACM International Conference on Web Search and Data Mining, New York, NY, USA, 24–28 February 2014; pp. 413–422. [Google Scholar]
- Angriman, E.; van der Grinten, A.; Hamann, M.; Meyerhenke, H.; Penschuck, M. Algorithms for large-scale network analysis and the NetworKit toolkit. In Algorithms for Big Data: DFG Priority Program 1736; Springer Nature: Cham, Switzerland, 2023; pp. 3–20. [Google Scholar]
- Misra, D. Mish: A Self Regularized Non-Monotonic Activation Function. In Proceedings of the British Machine Vision Conference, Virtual, 7–10 September 2020. [Google Scholar]
- Allix, K.; Bissyand, T.F.; Klein, J.; Le Traon, Y. Androzoo: Collecting millions of android apps for the research community. In Proceedings of the 13th International Conference on Mining Software Repositories, Austin, TX, USA, 14–15 May 2016; pp. 468–471. [Google Scholar]
- VirusShare. Available online: https://virusshare.com (accessed on 5 April 2023).
- APKtool. Available online: https://github.com/iBotPeaches/Apktool (accessed on 10 April 2023).
- Brody, S.; Alon, U.; Yahav, E. How attentive are graph attention networks? arXiv 2021, arXiv:2105.14491. [Google Scholar]
- Hamilton, W.; Ying, Z.; Leskovec, J. Inductive representation learning on large graphs. In Proceedings of the 31st International Conference on Neural Information Processing Systems, Long Beach, CA, USA, 4–9 December 2017. [Google Scholar]
- Wang, X.; Ji, H.; Shi, C.; Wang, B.; Ye, Y.; Cui, P.; Yu, P.S. Heterogeneous graph attention network. In Proceedings of the world Wide Web Conference, San Francisco, CA, USA, 13–17 May 2019; pp. 2022–2032. [Google Scholar]
- Dong, Y.; Chawla, N.V.; Swami, A. metapath2vec: Scalable representation learning for heterogeneous networks. In Proceedings of the 23rd ACM SIGKDD International Conference on Knowledge Discovery and Data Mining, Halifax, NS, Canada, 13–17 August 2017; pp. 135–144. [Google Scholar]
- Schlichtkrull, M.; Kipf, T.N.; Bloem, P.; Van Den Berg, R.; Titov, I.; Welling, M. Modeling relational data with graph convolutional networks. In Proceedings of the Semantic Web: 15th International Conference, ESWC 2018, Heraklion, Crete, Greece, 3–7 June 2018; Proceedings 15. pp. 593–607. [Google Scholar]
- Xu, K.; Li, Y.; Deng, R.; Chen, K.; Xu, J. Droidevolver: Self-evolving android malware detection system. In Proceedings of the 2019 IEEE European Symposium on Security and Privacy (EuroS&P), Stockholm, Sweden, 17–19 June 2019; pp. 47–62. [Google Scholar]
- Loshchilov, I.; Hutter, F. Decoupled weight decay regularization. arXiv 2017, arXiv:1711.05101. [Google Scholar]
- Pytorch. Available online: https://pytorch.org/ (accessed on 13 April 2023).
- Pandas. Available online: https://pandas.pydata.org/ (accessed on 13 April 2023).
- Matplotlib. Available online: https://matplotlib.org/ (accessed on 13 April 2023).
- Chen, D.; Lin, Y.; Li, W.; Li, P.; Zhou, J.; Sun, X. Measuring and relieving the over-smoothing problem for graph neural networks from the topological view. In Proceedings of the AAAI Conference on Artificial Intelligence, New York, NY, USA, 7–12 February 2020; pp. 3438–3445. [Google Scholar]
- Zhang, C.; Song, D.; Huang, C.; Swami, A.; Chawla, N.V. Heterogeneous graph neural network. In Proceedings of the 25th ACM SIGKDD International Conference on Knowledge Discovery & Data Mining, Anchorage, AK, USA, 4–8 August 2019; pp. 793–803. [Google Scholar]
- Xu, M. Understanding graph embedding methods and their applications. SIAM Rev. 2021, 63, 825–853. [Google Scholar] [CrossRef]
- Cai, H.; Zheng, V.W.; Chang, K.C.-C. A comprehensive survey of graph embedding: Problems, techniques, and applications. IEEE Trans. Knowl. Data Eng. 2018, 30, 1616–1637. [Google Scholar] [CrossRef]
- Goyal, P.; Ferrara, E. Graph embedding techniques, applications, and performance: A survey. Knowl. Based Syst. 2018, 151, 78–94. [Google Scholar] [CrossRef]
- Van der Maaten, L.; Hinton, G. Visualizing data using t-SNE. J. Mach. Learn. Res. 2008, 9, 2579–2605. [Google Scholar]

Disclaimer/Publisher’s Note: The statements, opinions and data contained in all publications are solely those of the individual author(s) and contributor(s) and not of MDPI and/or the editor(s). MDPI and/or the editor(s) disclaim responsibility for any injury to people or property resulting from any ideas, methods, instructions or products referred to in the content. |
© 2024 by the authors. Licensee MDPI, Basel, Switzerland. This article is an open access article distributed under the terms and conditions of the Creative Commons Attribution (CC BY) license (https://creativecommons.org/licenses/by/4.0/).