Article

High-Precision Position Detection and Communication Fusion Technology Using Beacon Spread-Spectrum Modulation with Four-Quadrant Detector

1
School of Optoelectronic Engineering, Changchun University of Science and Technology, Changchun 130022, China
2
Institute of Space Optoelectronics Technology, Changchun University of Science and Technology, Changchun 130022, China
*
Author to whom correspondence should be addressed.
Appl. Sci. 2024, 14(8), 3362; https://doi.org/10.3390/app14083362
Submission received: 21 February 2024 / Revised: 5 April 2024 / Accepted: 8 April 2024 / Published: 16 April 2024
(This article belongs to the Section Optics and Lasers)

Abstract

:
In space laser communication, the wide divergence angle of beacon light leads to substantial spatial losses, compounded by background light and detector noise; this results in compromised precision in the detection of the beacon light position. To solve this problem, a high-precision detection technique and communication composite technology employing a four-quadrant detector (QD) with beacon spread-spectrum modulation are proposed. Pseudo-random sequences (PRNs) are employed to spread the beacon communication spectrum, with the spread-spectrum signal utilized to modulate the intensity of the transmitted beacon light at the transmitter end. At the receiver, QD photocurrent signals are cross-correlated with an identical PRN that is used for modulation. The strong auto-correlation properties of PRNs, which are uncorrelated with noise, enhance the output signal-to-noise ratio (SNR), enabling precise position detection and beacon communication under high-SNR conditions. Theoretical analysis is used to explore the effects of spreading gain on the sensitivity of system detection and the precision of position detection. The experimental results demonstrate that the beacon spread-spectrum modulation scheme effectively detects the position of the light spot. At a received optical power of −37 dBm and spreading sequence PRN depths of 1023, 127, and 31, the root-mean-square error (RMSE) values are 0.983 μm, 2.876 μm, and 7.275 μm, respectively. This corresponds to improvements of 14.96 dB, 10.29, dB, and 6.26 dB compared to direct detection precision (30.811 μm). Additionally, under an identical signal bandwidth, the sensitivity improves by 14.6 dB, 10.1 dB, and 6.4 dB, respectively. The proposed beacon spread-spectrum scheme mitigates the limitations of hardware reception sensitivity and position-detection precision, demonstrating its potential application in high-precision detection in long-distance interstellar laser communication.

1. Introduction

Compared to microwave communication, free-space optical communication offers various advantages, including high speed, high confidentiality, low power consumption, and small size; it is therefore widely used in interstellar, inter-satellite, and satellite-to-ground links [1,2,3,4]. Using beacon light in laser communication can enhance the likelihood of acquisition and shorten the time required to establish laser communication links [5,6]. However, the utilization of wide-beam divergent beacon light in laser communication exacerbates the loss of spatial energy and renders it susceptible to interference from background radiation and detector noise, thereby diminishing the precision of beacon-light position detection. The precision of beacon-light position detection plays a critical role in shaping the maintained establishment of system communication links [7]. Therefore, in long-range laser communication, employing beacon light presents challenges that are associated with establishing dynamic laser links in a stable manner, consequently restricting the utilization of beacons in laser communication.
The quadrant detector (QD), characterized by its high sensitivity, fine resolution, and rapid responsivity, is extensively employed in laser communication for the precise measurement and tracking of position [8]. In order to achieve the stable establishment of links in laser communication systems, in recent years, researchers have endeavored to explore methodologies aimed at enhancing the precision of QD position detection. In [9], the nonlinear characteristics of spot detection positions are analyzed, and a linear correction method based on the Boltzmann function is proposed. In [10], error compensation factors and detector gap sizes are introduced into the spot position-detection model while digital filtering is applied to the detected light signals, thus enhancing the precision of spot position detection. In [11,12], a neural network for backpropagation is constructed by analyzing measurement data, and a neural network-based method that enhances the measurement precision of QD is presented. In [13], a new and improved polynomial fitting algorithm for position detection that improves the linear range and precision of QD is proposed. In [14], two algorithms, the integral infinite log-ratio algorithm, and an integral infinity log-ratio algorithm based on the signal-to-noise ratio are proposed for QD position detection. The appropriate algorithm is selected based on the SNR of the received signal to achieve higher measurement accuracy. The aforementioned studies primarily focus on enhancing the precision of detection through the refinement of localization algorithms. However, the principal factor contributing to the degradation of the precision of QD spot position detection is the signal-to-noise ratio (SNR) of the detection signal [15]. In the event of a low SNR in the QD detection signal, achieving the high-precision detection of the spot centroid position becomes challenging when using the aforementioned methods. In some cases, the signal-to-noise ratio of the QD detection signal is low. In [16], the cyclic cross-correlation method is utilized to denoise the modulated sine-wave beacon light, resulting in a detection root-mean-square error one-quarter of that of the direct position-detection method. In [17], the Kalman filter is applied to process the modulated sine-wave beacon light, leading to a reduction in the detection root-mean-square error to 51.5%. However, its effect on improving detection accuracy was limited. Different from previous detection technologies, this article proposes a simple method that relies solely on On–Off Keying (OOK) modulation. This method not only achieves high-precision detection but also incorporates beacon communication multiplexing technology.
In this study, we applied spread-spectrum technology to QD detection. Spread-spectrum technology refers to a technology that uses pseudo-random sequences (PRNs) to expand the bandwidth of transmitted information and uses the same PRNs at the receiving end to perform the despreading of correlation and recover communication data [18,19,20]. Because noise is uncorrelated with the PRN, once the correlation operation has been performed, the spectrum of noise is spread, and the spectral density is reduced. Therefore, the power of the interference signals falling into the communication signal frequency band is reduced, thereby achieving anti-interference and improving the SNR at the receiver output [21,22,23]. Spread-spectrum technology is applied to beacon light detection. At the transmitter, beacon communication data are spread-spectrum-modulated with the PRN. The spread-spectrum signal is used to modulate the transmitted beacon light power. At the receiver end, the QD receives the beacon light and generates photocurrent signals. These signals are then correlated with the same PRN that was used at the transmitter to suppress background light and detector noise, resulting in high-SNR output signals. We utilize high-SNR signals for beacon communication and to estimate the centroid position of the light spot, enhancing the precision of QD position detection and the sensitivity of the system detector.
This article aims to investigate the influence of beacon spread-spectrum modulation on the precision and sensitivity of QD position detection. The detection principle of the QD under beacon spread-spectrum technology is analyzed, and a mathematical model is formulated to characterize the precision of position detection under spread-spectrum modulation in terms of the spread-spectrum gain, system SNR, Gaussian beam waist radius, and spot centroid position. Theoretical derivations are conducted, and simulations are performed to assess the improvements achieved by spread-spectrum technology in the sensitivity of the detector and precision of position detection. Subsequently, a beacon spread-spectrum-modulated QD system is constructed to validate the effectiveness of this method and evaluate the enhancement in system sensitivity and the precision of position detection under varying spread-spectrum gains. The experimental results are consistent with the theoretical analysis. This technology is therefore anticipated to facilitate the high-precision detection of beacon light in complex optical backgrounds over long distances.

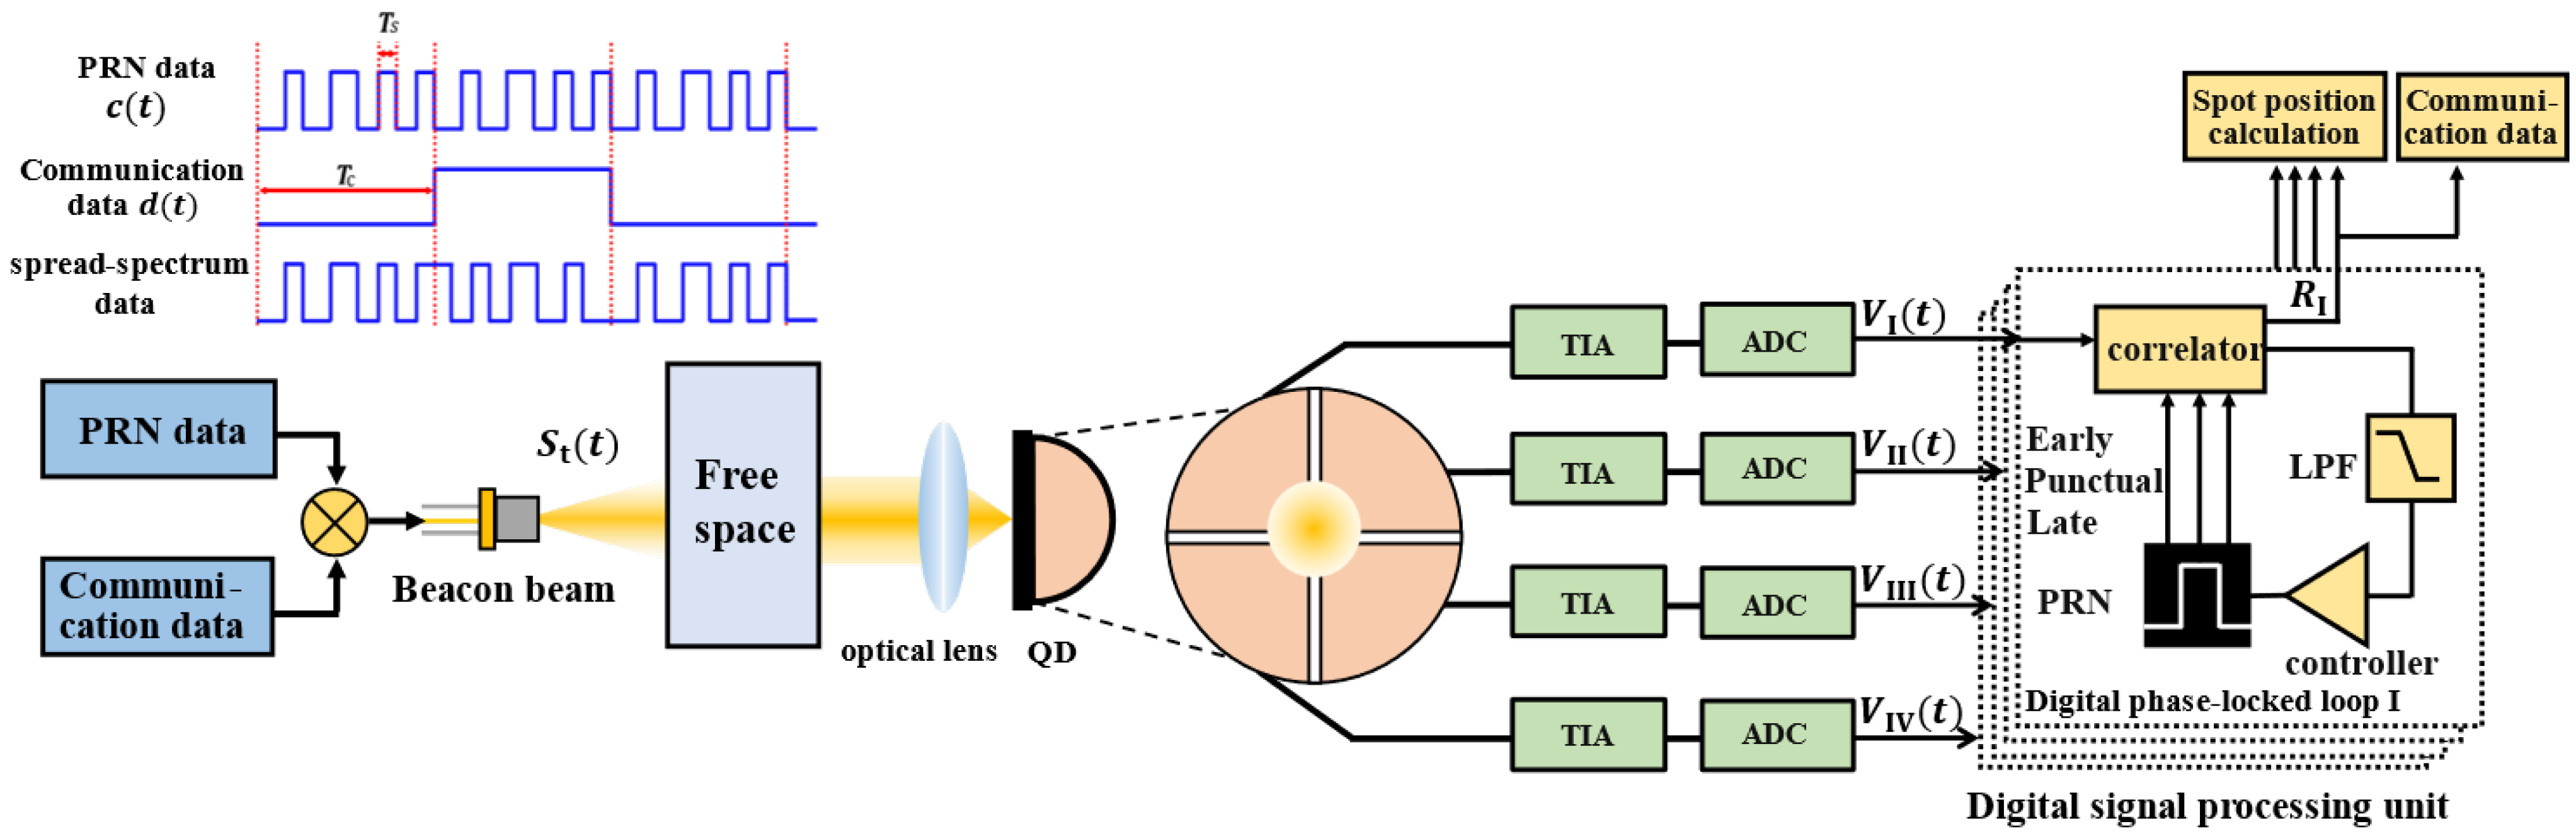
2. Principle and Methods

This section analyzes the mechanism of spread-spectrum technology when employed in QD spot position detection and communication. A block diagram of the QD system utilized for beacon spread-spectrum modulation is shown in Figure 1. Communication data are spread-spectrum-modulated by PRNs. This involves performing an exclusive OR (XOR) operation between the communication data and a pseudo-random code. Subsequently, the spread-spectrum data are modulated onto the laser, thereby enabling the transmission of laser signals in the space link. The output optical power signal after modulation is represented by the following:
S t t = P s d t   X O R   c t
where S t ( t ) represents the output optical power signal of the laser, P s represents the average optical power output of the laser, d ( t ) represents the communication data used for the beacon, and c ( t ) represents the PRN data. At the same time, the names and descriptions of the variables in Section 2 are listed in Table 1.
The PRN is a deterministic sequence that exhibits statistical properties similar to random noise. It possesses good autocorrelation characteristics and relatively weak cross-correlation characteristics. This article refers to the PRN design of Global Positioning System (GPS) during the design of pseudo-random codes and selects Gold sequences as the spreading codes [24,25,26]. The Gold sequence has small cross-correlation values, and both its autocorrelation and cross-correlation functions are bounded. Its autocorrelation function is expressed as follows [27,28,29]:
R τ = 1 T c 0 T c c i t c i t + τ d t , τ T s / 2 , T s / 2
where R τ represents the autocorrelation value of the PRN, T c represents the period of communication data bits, T s represents the bit period of the PRN, and τ represents the clock delay between PRNs.
According to the definition of correlation, when τ = 0 (that is, when the phases between the PRN sequences are aligned), we can obtain the following:
R 0 = 1 T c 0 T c c t c t d t = 1 T c 0 T c c 2 t d t = 1
when τ 0 , if τ = i T c and i is a non-zero integer, τ is the integer multiple of the chip length, n is the bit width of the PRN register, and N represents the depth of the PRN periodic sequence, Thus, according to Gold theory, the results of the cross-correlation triples are as follows:
R i i T c = 1 N , 1 2 n + 2 / 2 N , 2 n + 2 / 2 1 N
when i T c < τ < i + 1 T c (that is, when τ is not an integer multiple of the chip length), the cross-correlation result is given by Δ τ = τ i T c :
R τ = R i T c Δ τ T c + R i + 1 T c T c Δ τ T c
Therefore, when R τ takes a non-integer value, the value of the correlation result changes linearly between R i T c and R i + 1 T c .
The receiver uses a QD to detect the beacon light, which consists of four identical p-n junction photodiodes. When the QD receives the beacon light, each quadrant independently outputs a photocurrent that is proportional to the received optical power. The position of the optical spot is estimated by the ratio of the amplitudes of the photocurrent signals from the four quadrants. The photocurrent outputs from each quadrant are represented as follows:
I j ( t ) = η P j d t c t
where j takes values of I, II, III, and IV, representing the four quadrants of the quadrant detector; I j t represents the photocurrent signal collected by the j-th quadrant; η represents the responsivity of the QD; and P j represents the optical signal power received by the j -th quadrant.
The weak photocurrent signals are amplified into voltage signals using the transimpedance amplifier (TIA), and the amplified signals are then collected using an ADC. The voltage signals collected from each quadrant are as follows:
V j ( t ) = K η p j d ( t ) c ( t ) + n j ( t )
where V j t represents the j -th quadrant photoelectric signal collected by the ADC, K is the transimpedance amplifier gain of the circuit, and n j ( t ) represents the background light noise and detector noise received by the j -th quadrant, both of which are Gaussian white noise [30].
The digital signal processing unit is used to receive the signal, despread it, and output the position of the detected optical spot on the QD and the beacon communication data. Initially, the receiver constructs digital delay-locked loops for each quadrant’s collected voltage signals in order to generate three sets of local PRNs: the Early code, the Punctual code, and the Late code; these are identical to the modulated PRN at the transmitter and differ in phase by half a chip. Then, each set is subjected to cross-correlation operations that are performed with the received voltage signal using a correlator. The process of cross-correlation between the local pseudo-random sequence and the received signal can be expressed as follows:
R j τ = E V j t c t + τ = 1 T c 0 T c K η p i d ( t ) c ( t ) c t + τ + n ( t ) c t + τ d t = R s j τ + R n j τ
where R j represents the correlation value between the received signal and the PRN in the j -th quadrant, R s j τ represents the correlation value between the j -th quadrant beacon signal and the PRN, and R n j τ represents the correlation value between the noise in the j -th quadrant and the PRN.
After the correlation operation, the main purpose of the correlation calculator when used for the Punctual code is data recovery and position calculation. The difference between the results of the correlation calculator regarding the Early code and the Late code is used to control the error signal in the loop. By using a low-pass filter (LFP) to control the phase delay of the input signal in the code generator update, the local pseudo-random sequence can track the phase of the input signal. This ensures that when the phase of the local PRN matches the phase of the input PRN signal (that is, τ = 0 ), the correlation result between the Punctual code in the local pseudo-random sequence and the received photoelectric signal can be obtained according to Equation (3):
R s j τ = η p j d ( t ) T c 0 T c c ( t ) c t + τ d t = η p j d ( t )
Therefore, in the j -th quadrant, the cross-correlation result between the received signal and the local pseudo-random sequence can be expressed as follows:
R j τ = η p j d ( t ) + 1 T c 0 T c n ( t ) c t + τ d t
Due to the lack of correlation between noise and the local PRN, according to Equation (10), the correlation operation between the noise and the Punctual code is significantly smaller than the correlation between the photoelectric signal and the Punctual phase of the local pseudo-random sequence. Therefore, the cross-correlation operation of the despreading algorithm effectively suppresses the noise and improves the SNR of the output signal. Considering the absolute value of the result after correlation eliminates the influence of the polarity of the communication data encoding d ( t ) Via substitution into the formula used to calculate the center of the optical spot [31], the relative position of the optical spot under the beacon spread-spectrum modulation detected by QD is as follows:
x r = P I + P IV P II + P III P I + P II + P III + P IV = R I + R IV R II + R III R I + R II + R III + R IV y r = P I + P II P III + P IV P I + P II + P III + P IV = R I + R II R III + R IV R I + R II + R III + R IV
where x r , y r represents the relative position coordinates of the optical spot center; P I , P II , P III and P IV , respectively, denote the received optical power in each quadrant of the QD; and R I , R II , R III and R IV , respectively, represent the correlation values between the Punctual code and the received signal.
Therefore, it can be inferred from Equations (8)–(11) that applying spreading technology to QD beacon light detection effectively suppresses background light and detector noise during despreading operations. This enhances the SNR of the detection position signal, thereby improving the precision of optical spot position detection and reducing the bit error rate of communication data.

3. Detection Precision and Sensitivity Analysis

3.1. Precision Analysis of Quadrant Detector under Beacon Spread-Spectrum Modulation

For the QD, the root-mean-square error (RMSE) of the position of the detection spot is used as a measure of the position-detection precision. Due to the symmetric response characteristics of the QD in the x and y directions, we will only discuss the x direction. As the correlation between the noise and the local PRN after the cross-correlation operation is significantly lower than the correlation between the received photocurrent signal and the local PRN, the relative position of the QD output spot is as follows:
x r = R I + R IV R II + R III R I + R II + R III + R IV = R s I τ + R s I V τ + R n I τ + R n I V τ R s I I τ + R s I I I τ + R n I I τ + R n I I I τ R s I τ + R s I I τ + R s I I I τ + R s I V τ + R n I τ + R n I I τ + R n I I I τ + R n I V τ R s I τ + R s I V τ R s I I τ + R s I I I τ R s I τ + R s I I τ + R s I I I τ + R s I V τ + 2 R n I τ + R n I V τ R s I I τ + R s I I I τ R n I I τ + R n I I I τ R s I τ + R s I V τ R s I τ + R s I I τ + R s I I I τ + R s I V τ 2
It can be inferred from Equation (12) that, under the influence of noise factors, the relative value of the QD output spot x r fluctuates within a certain range. The variance σ x r 2 is used to characterize the jitter caused by noise. Assuming that the noise power in each quadrant is approximately the same, I n 2 represents the square of the root-mean error of the noise in a single quadrant of the detector: I n 2 R n I 2 R n I I 2 R n I I I 2 R n I V 2 . The expression used to represent the precision of position detection is as follows:
σ x r 2 = R s I τ + R s I V τ 2 + R s I I τ + R s I I I τ 2 R s I τ + R s I I τ + R s I I I τ + R s I V τ 4 8 I n 2 = k 4 I n 2 R s I τ + R s I I τ + R s I I I τ + R s I V τ 2
where the scaling factor k = 2 R s I τ + R s I V τ 2 + R s I I τ + R s I I I τ 2 R s I τ + R s I I τ + R s I I I τ + R s I V τ 2 . R s I τ + R s I I τ + R s I I I τ + R s I V τ 2 represents the total power of the Gaussian beam correlation peaks (excluding noise factors), and 4 I n 2 represents the total power of the detector’s correlated post-noise current in four quadrants. The total SNR after despreading RSNRL is defined as follows:
R S N R L = R s I τ + R s I I τ + R s I I I τ + R s I V τ 2 4 I n 2
In a spread-spectrum communication system, the SNR of the output relative to the SNR of the received signal at the receiver undergoes certain improvements after despreading. The ratio of the output to input SNR in the receiving system is defined as the spreading gain, which can be expressed as the ratio of the bandwidth after spreading to the bandwidth before spreading [32,33,34].
G p = S / N o u t S / N i n = T c T s
where ( S / N ) o u t represents the SNR of the output signal after despreading, and ( S / N ) i n represents the SNR of the input signal before despreading.
When R SNRE is defined as the SNR of the detector-received photoelectric signal, according to Equation (15), the total SNR after despreading is related to the SNR of the detector’s received photoelectric signal, as follows:
R SNRL = G p · R SNRE
Therefore, the relationship between the actual position x 0 of the beam centroid and its relative position can be expressed as follows: x 0 = ω 2 e r f 1 x r . Then, the relationship between k and the actual value x 0 : k = 1 + e r f 2 2 x 0 ω is established. The variance in the value can be obtained from the below formula:
σ x r = 1 G p · R SNRE 1 + e r f 2 2 x 0 ω
By establishing a mathematical model to determine the precision of relative position detection under beacon spread-spectrum modulation, it can be observed from the mathematical model that the precision of relative position detection σ x 0 is related to the waist radius ω of the Gaussian beam, the actual position x 0 of the beam centroid, the SNR of the detector-received photoelectric signal R SNRE , and the spreading gain G P . When spread-spectrum technology is employed, the position-detection performance of the quadrant detector is improved by a factor of G P . Spread-spectrum technology effectively improves the accuracy of position detection by enhancing the signal-to-noise ratio of optoelectronic signals.
Therefore, simulations based on Equation (17) were conducted to assess the precision of the position detection performed by the QD under different spreading gains. At the same time, since all four p-n junction photodiodes of the QD need to receive the beacon light simultaneously for the correct spot output position, the centroid position x 0 of the spot must be less than the radius ω of the optical plate when the model is valid.
When the centroid of the light spot is positioned at the origin of the detector, the spot radius is 0.7 mm, and R SNRE = 20 dB, according to Equations (15) and (17). The spreading gain G P of the system and the precision of the position detection performed by the QD at the center position are shown in Table 2. PRN depths of 1023, 511, 255, 127, 63, 31, and 1, respectively, represent pseudo-random sequence periods of 1023, 511, 255, 127, 63, and 31 for the modulation of communication data, in addition to direct detection without spread-spectrum technology. σ represents the theoretical precision of the position detection performed by the QD according to Equation (17). σ G p = 1 / σ represents the theoretical ratio of the position-detection accuracy achieved by the QD when modulating the PRN at different depths to that of the unspread spectrum, which is used to characterize the optimization of the position-detection precision.
From Table 2, it can be inferred that the precision of position detection achieved by the detector without spread-spectrum technology is 100μm. When the modulation PRN period is 1023, the precision of position detection achieved by the QD at the center position is 3.12 μm. In this case, the precision of the position detection under spread-spectrum technology is 15.05 dB higher than the precision of the position detection achieved without spread-spectrum technology. Therefore, adopting beacon spread-spectrum modulation significantly improves the precision of position detection. When the R SNRE is within the range of 10 dB to 30 dB, as the depth of modulation of different spreading sequences increases from 31 to 1023, the simulated performance of the QD position detection is as follows:
It is evident from Figure 2 that when the spreading gain is kept constant, increasing the SNR effectively improves the precision of position detection achieved by the detector. At the same SNR, as the spreading gain increases, i.e., the depth of the modulating PRN becomes greater, the precision of the position detection achieved by the QD improves.

3.2. Analysis of Detection Sensitivity for QD under Spread-Spectrum Technology

During the process of detection using the QD system, the correlation operation performed during despreading suppresses noise factors, thereby providing a certain spreading gain that enhances the SNR. Consequently, a further analysis of the sensitivity of the QD with regard to the use of spread-spectrum technology is warranted. In laser communication using intensity modulation, the relationship between the bit error rate (BER) and the Receiver SNR of the detector output photocurrent is represented by the following [35,36]:
B E R = 1 2 e r f c 1 2 2 S N R
when the detector receives beacon light, it is affected by detector noise; this includes thermal noise, shot noise, etc. Therefore, the expression used to represent the Receiver SNR Enhancement ( R SNRE ) of the detector receiver is as follows [37]:
R SNRE = ρ 2 P i n 2 M 2 2 e ρ P s + I D N D M 2 F M Δ f + 4 N D k B T Δ f / R L
where P i n represents the received optical power, ρ represents the detector responsivity, M represents the avalanche multiplication factor, N D represents the number of quadrants of the detector, e represents the elementary charge, Δ f represents the bandwidth of the receiver, T represents the temperature of the quadrant detector, F M represents the excess noise factor of the quadrant detector, R L represents the load resistance, I D represents the dark current of the quadrant detector, and k B represents the Boltzmann constant.
When the system bit error rate is 1 × 10⁻⁶ [38], the received optical power of the detector can be obtained from Equations (20) and (21); as such, the receiver detection sensitivity and its expression are as follows:
P min = R S N E 2 e ρ P i n + I D N D M 2 F ( M ) Δ f + 4 N D k B T Δ f / R L ρ 2 M 2
when receiving low-power beacon light, the main sources of detector noise are thermal noise and dark current. Therefore, according to Formula (22), we know that P min R S N R E . According to Formula (15), when spread-spectrum technology is used, the output SNR after despreading is G P times the SNR of the received optical signal. Therefore, the detection sensitivity of the quadrant detector will increase by a factor of G P .
According to Formula (22), the detection performance of the QA-4000 quadrant detector from the First Sensor company is simulated. The detector’s parameters are as follows: the photosensitive area diameter is 4 mm, the responsivity ρ is 0.36 A/W, the avalanche multiplication factor M is 100, the bandwidth Δ f is 50 MHz, the dark current in each quadrant I D is 7 nA, and the load resistance R L is 10 kΩ. Since the experiment was conducted at room temperature and thermal noise is influenced by temperature variations, we used 296 K in the simulation to simulate a room-temperature environment. The excess noise factor F M is 1. The change in the received optical power and bit error rate of the detector under different spreading gains is depicted in the following figure:
It is evident from Figure 3 that, under the same spreading gain, the SNR increases and the bit error rate decreases as the received optical power increases. When considering different spreading gains, a larger spreading gain results in the detector having a lower required optical power at the same bit error rate. For example, if the system operates under a threshold condition (bit error rate of 1 × 10⁻⁶), with spreading gains of 1023, 255, 127, 63, 31, 15, and 1, the sensitivity of the QD is −62.6 dBm, −61.1 dBm, −59.6 dBm, −58 dBm, −56.5 dBm, −54.9 dBm, and −47.1 dBm, respectively. That is, when the spread-spectrum gain is 1023, the received optical power required for spread-spectrum communication drops from approximately −47.1 dBm to −62.6 dBm. Therefore, by modulating the PRNs of different depths to expand the spectrum of the transmitted signal, SNR gain can be obtained, thereby improving the sensitivity of the detector.

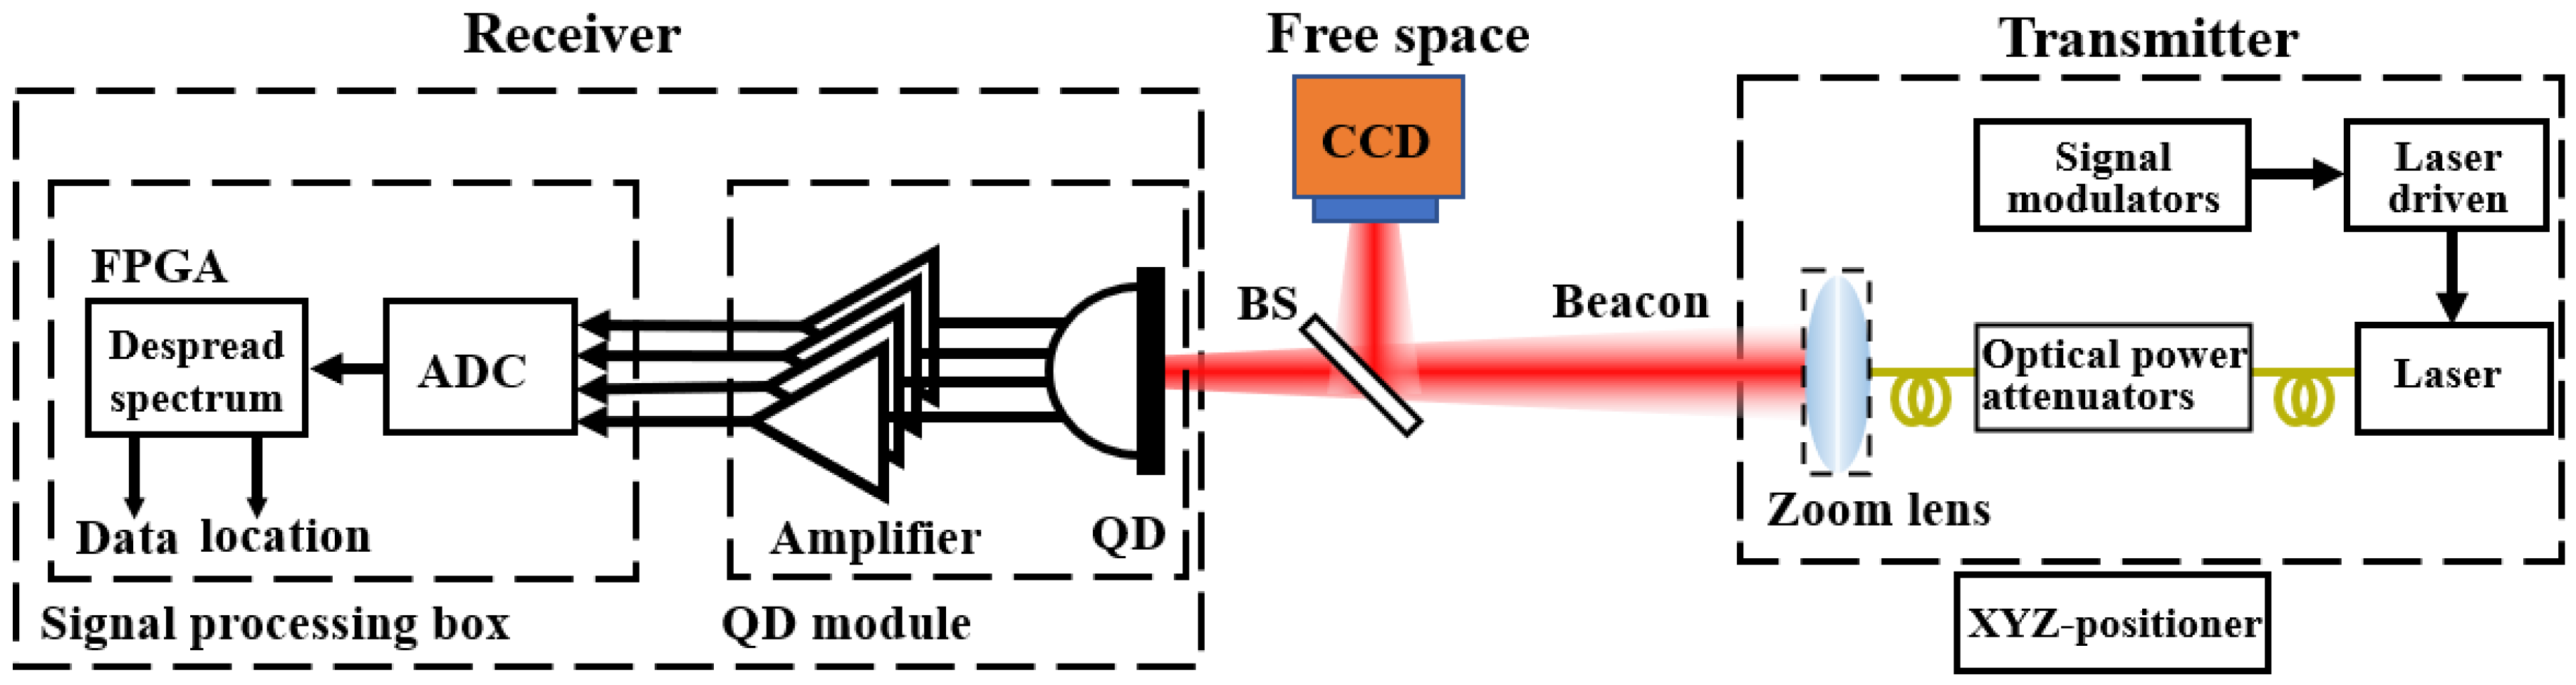
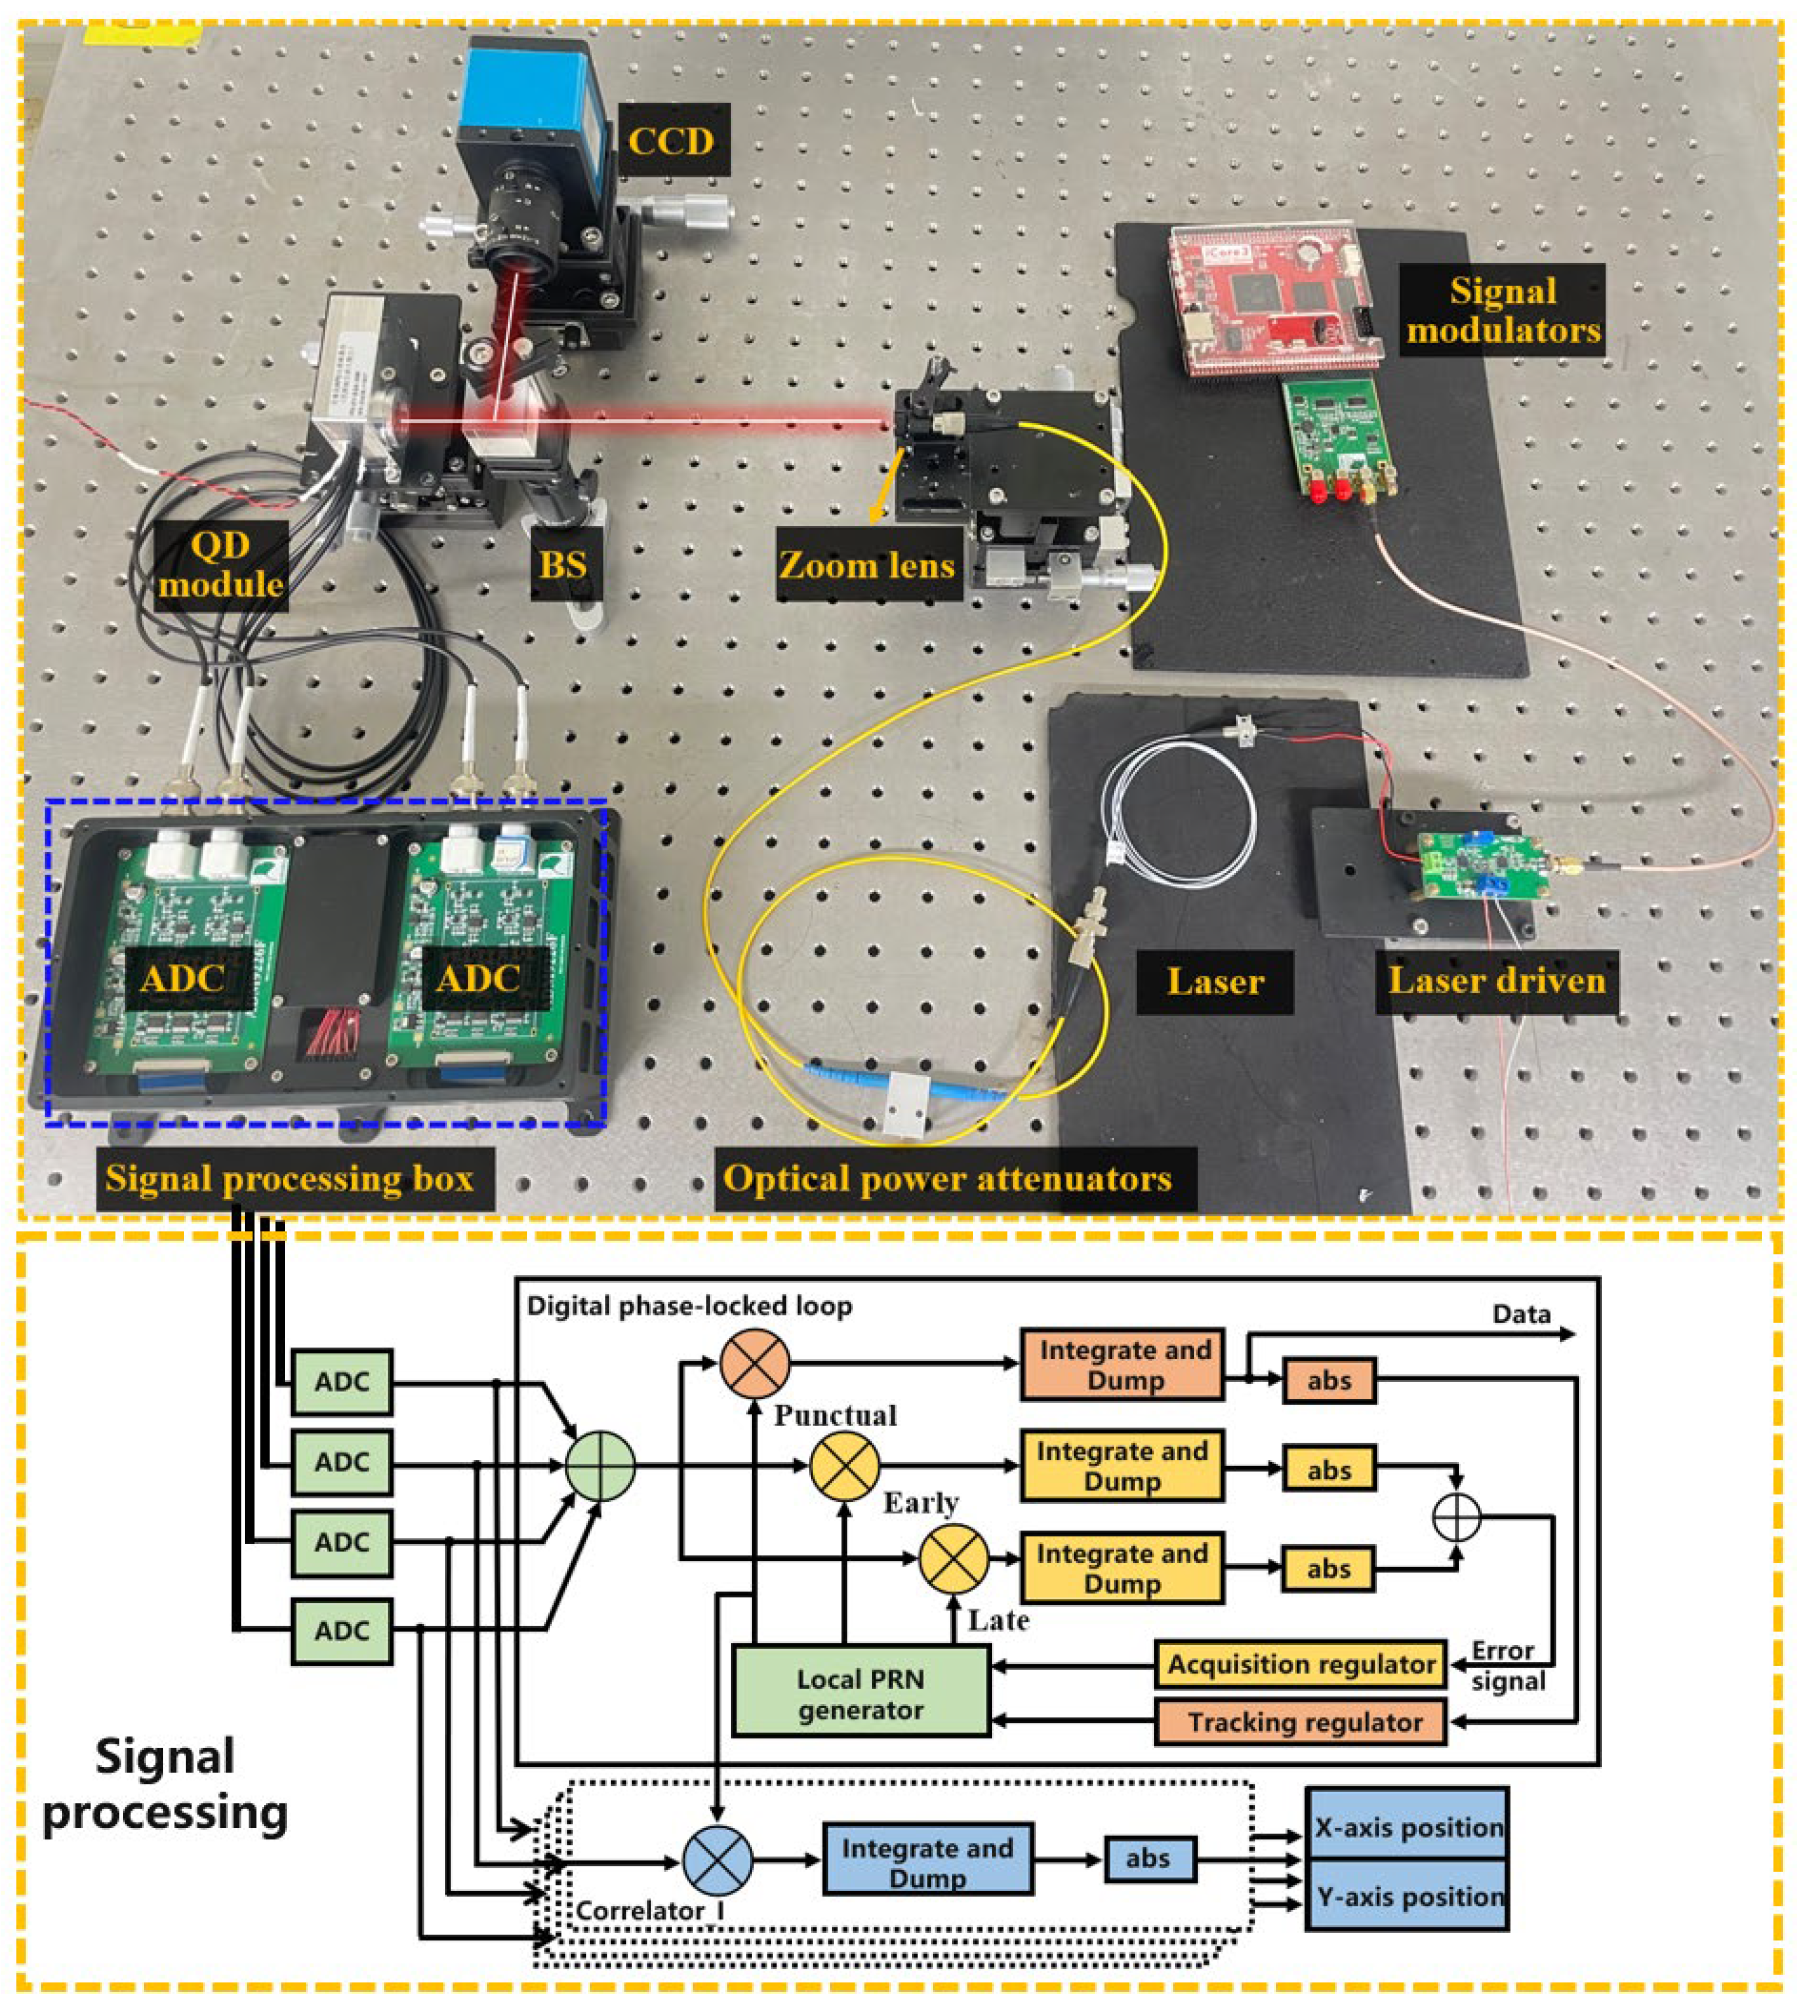
4. Construction of QD Experimental System and Digital Signal Processing

To validate the ability of spread-spectrum technology to enhance the precision of position detection and reception sensitivity achieved by the QD, an experimental setup was constructed; this is shown in Figure 4. The setup primarily consists of a signal transmission board, laser driver board, laser emitter, optical power attenuator, zoom lens, semi-transparent half-mirror, Charge-Coupled Device (CCD) camera, QD module, and digital signal processing box. The QD module comprises the QD and a transimpedance amplifier, while the digital signal processing box includes an ADC and a field-programmable gate array (FPGA). A block diagram of the quadrant detector experimental system is shown in Figure 4. Experimental equipment parameters and models can be found in Table 3.
As shown in Figure 4, the QD utilized in the experiment is the QA-4000 model from First Sensor, with a bandwidth of 50 MHz and a target surface diameter of 4 mm. The laser and QD are fixed on a three-dimensional displacement stage (with an accuracy of 0.01 mm), allowing the incident spot position on the QD surface to be adjusted via the manipulation of the lower displacement stage of the laser. The incident spot radius is adjusted using a variable-focus lens in front of the laser. The experimental system employs a laser diode with a wavelength of 850 nm as the light source. At the transmission end, the PRN signal is modulated at a frequency of 10 MHz, and an optical power attenuator is used to control the transmitted light power. A half-transparent and half-reflective mirror splits the incident light, with half of the light power directed into the camera for the fine calibration of the incident spot radius and displacement. The other half of the light power enters the QD module, generating analog optoelectronic signals. Finally, the optoelectronic signals outputted by the QD are collected using a signal-processing box. The A/D converter in the digital signal processing box has a sampling rate of 50 Mbps and an output data width of 12 bits. It converts the amplified analog optoelectronic signals into digital signals, which are then processed digitally based on an FPGA used for signal despreading, outputting the spot position, and communication data.
Based on the block diagram of the QD experimental system shown in Figure 4, a desktop experimental system was constructed, as illustrated in Figure 5. In this setup, the QD module receives spatial light, and within the digital signal processing unit, a digital phase-locked loop based on FPGA is constructed for local PRNs; this is in order to acquire and track the phase of the input photoelectric signal and thus achieve signal despreading. Since the frequency of the PRN signal modulated on the beacon light is much lower than the light frequency, the phases of the photocurrent signals received by the four quadrants of the QD can be considered to be approximately the same. Therefore, only the phase of the sum signal of the four quadrants of the QD is tracked, thus enabling the local PRN to be tracked for the four input signals of the QD quadrants. Additionally, four correlators were set up to perform correlation operations between the tracked local code and the photocurrent signals of each quadrant. This enabled the PRN signals received by each quadrant to be despread.
The digital delay-locked loop (DLL) consists of three main modules: a delay detector, loop filter, and local PRN code generator. The local PRN code generator is used to generate three sets of PRNs that are the same type as the input PRN but have different phases: the Punctual code, the Early code, and the Late code. The delay detector comprises a multiplier, an integrate, and dump, and an absolute value module. The multiplier, the integrate, and the dump form a correlator, which calculates the correlation values between the input signal and the local PRNs with different phases. The correlation value obtained from the Punctual code correlator is used for data recovery and phase acquisition, while the correlation values from the Early code and Late code correlators are used to track the phase of the input PRN signal using the local PRN. The polarity of the correlated values after integration is utilized to extract communication data from the input signal. The absolute value of the correlated values is input into the loop filter. The loop filter mainly consists of two states: phase acquisition and phase tracking.
Phase acquisition: The local PRN generator is adjusted with half-a-chip period resolution until a certain phase deviation between the locally generated reference code and the input code is achieved. At the delayed location, correlation values that are higher than the threshold required to complete phase acquisition are detected. Phase tracking: Once phase acquisition is completed, the difference between the Early PRN correlator and the Late PRN sequence correlator is used as the error signal in the control loop to determine the phase deviation with a higher resolution. This enables the phase of the Punctual code to the input PRN signal to be tracked. As shown in Figure 6 below, when the spread-spectrum modulation PRN depth is 1023 and the received signal power is −40 dBm, the correlator exhibits correlation values in two modes. During the acquisition phase, when the phases are close, there are higher correlation values. When the correlation value exceeds the threshold, the system enters the acquisition state. At this point, the despreading signal exhibits minimal jitter.
The loop filter utilizes the error signal to update the oscillation frequency, which is then input into the local PRN generator. The local PRN generator generates the local PRN using a Numerically Controlled Oscillator (NCO). The updated oscillation frequency is added to the NCO’s fixed-point numbers, changing the step size of the code NCO and thus modifying the code clock frequency. Eventually, the change in the local code phase is integrated to achieve phase tracking between the input signal and the local code’s Punctual code phase. At this point, the digital phase-locked loop achieves the demodulation of the received beacon light communication data, while also tracking the phase of the input photoelectric signal using the local PRN. The Punctual code of the local PRN is input into four correlators in order to perform correlation operations. The results of the correlation operation are then input into the calculation of the optical spot position, achieving the calculation of the received optical spot position.
To compare the positive effect that spread-spectrum technology has on detection performance, the RMSE of the detected output positions is evaluated. Here, L represents the number of times the position of the detected optical spot is output; x i represents the x-axis output position for the i-th detection; and x r e a l represents the true value of the x-axis, i.e., the actual distance moved by the displacement platform calibrated with the camera.
σ x = i = 1 L x i x r e a l 2 L

5. Simulation and Analysis

From the analysis presented in Section 3, it is evident that spread-spectrum technology effectively enhances the SNR post-despreading, thereby influencing the precision and sensitivity of QD position detection. To validate the efficacy of this method, experiments were conducted using the experimental system constructed in Section 4 to assess the precision and sensitivity of QD position detection under beacon spread-spectrum modulation. The PRN signal was set to 10 MHz, with modulation PRN depths of 1023, 127, and 31; these corresponded to spread-spectrum gains of 30.09 dB, 21.03 dB, and 14.91 dB, respectively. These configurations were compared with direct detection performed under non-spread-spectrum technology to verify the effective detection of light-spot positions under beacon spread-spectrum modulation; this was also in order to evaluate the improvements observed in the precision and sensitivity of QD position detection across different spread-spectrum depths.

5.1. Position Detection of Light Spot under Beacon Spread-Spectrum Modulation

To verify the effective detection of the light-spot position under beacon spread-spectrum modulation, the range and linear region of light-spot detection were tested and compared with direct detection. When the power of the beacon light received by the QD was −36 dBm, the light-spot positions were recorded for two different incident light-spot radii under both methods; these were 0.7 mm and 1 mm, respectively. When employing spread-spectrum technology, the depth of the modulation PRN was set to 127. For comparison purposes, under the same conditions regarding the light-spot radius and QD output SNR, direct detection was utilized to detect the light-spot position. As this paper investigates integrated measurement and communication technology, the direct method directly modulates the laser using beacon data. At the receiving end, the position was calculated using the absolute value of the signal. The position data were recorded along the x-axis as the light spot moved, with measurements taken every 10 µm. The true light-spot position was calculated based on the collected voltages and compared with the method proposed in this paper. In Figure 7, ω represents the light-spot radius. The red solid line and green dashed line represent the x-coordinate curves obtained via direct detection with a modulation PRN depth of 127 and without spread-spectrum technology ( G p = 1 ), respectively.
As shown in Figure 7, the beacon spread-spectrum modulation method effectively detects the receiving position of the light spot. Its detection range and linear region are similar to those of direct detection, with the x-coordinate curves maintaining good linearity within the interval (−0.2, 0.2). At the same time, as the spot radius increases, the linear areas of the two increase when the radius is 1 mm. Figure 7 demonstrates that spread-spectrum technology can effectively detect the position of the light spot without affecting the detection range or radius of the light spot. Both detection methods are affected by the relationship between the true position and the relative position. Therefore, employing the optimized light-spot linear region method proposed in references [9,11,12,13] can further enhance the relationship between the relative position and the true position of QD light-spot detection using spread-spectrum technology. This optimization aims to maintain the linearity of QD detection within a broader range. Moreover, it can be inferred from Figure 7 that, under beacon spread-spectrum modulation, the jitter of the detected light-spot position is reduced compared to direct detection, thereby enhancing the ability of the QD to perform light-spot position detection. As discussed in Section 3, the modulation of spreading sequences with different depths can achieve varying gain effects. Therefore, this study further compares the variation in the precision of QD position detection under different SNRs by modulating PRN sequences of different depths.

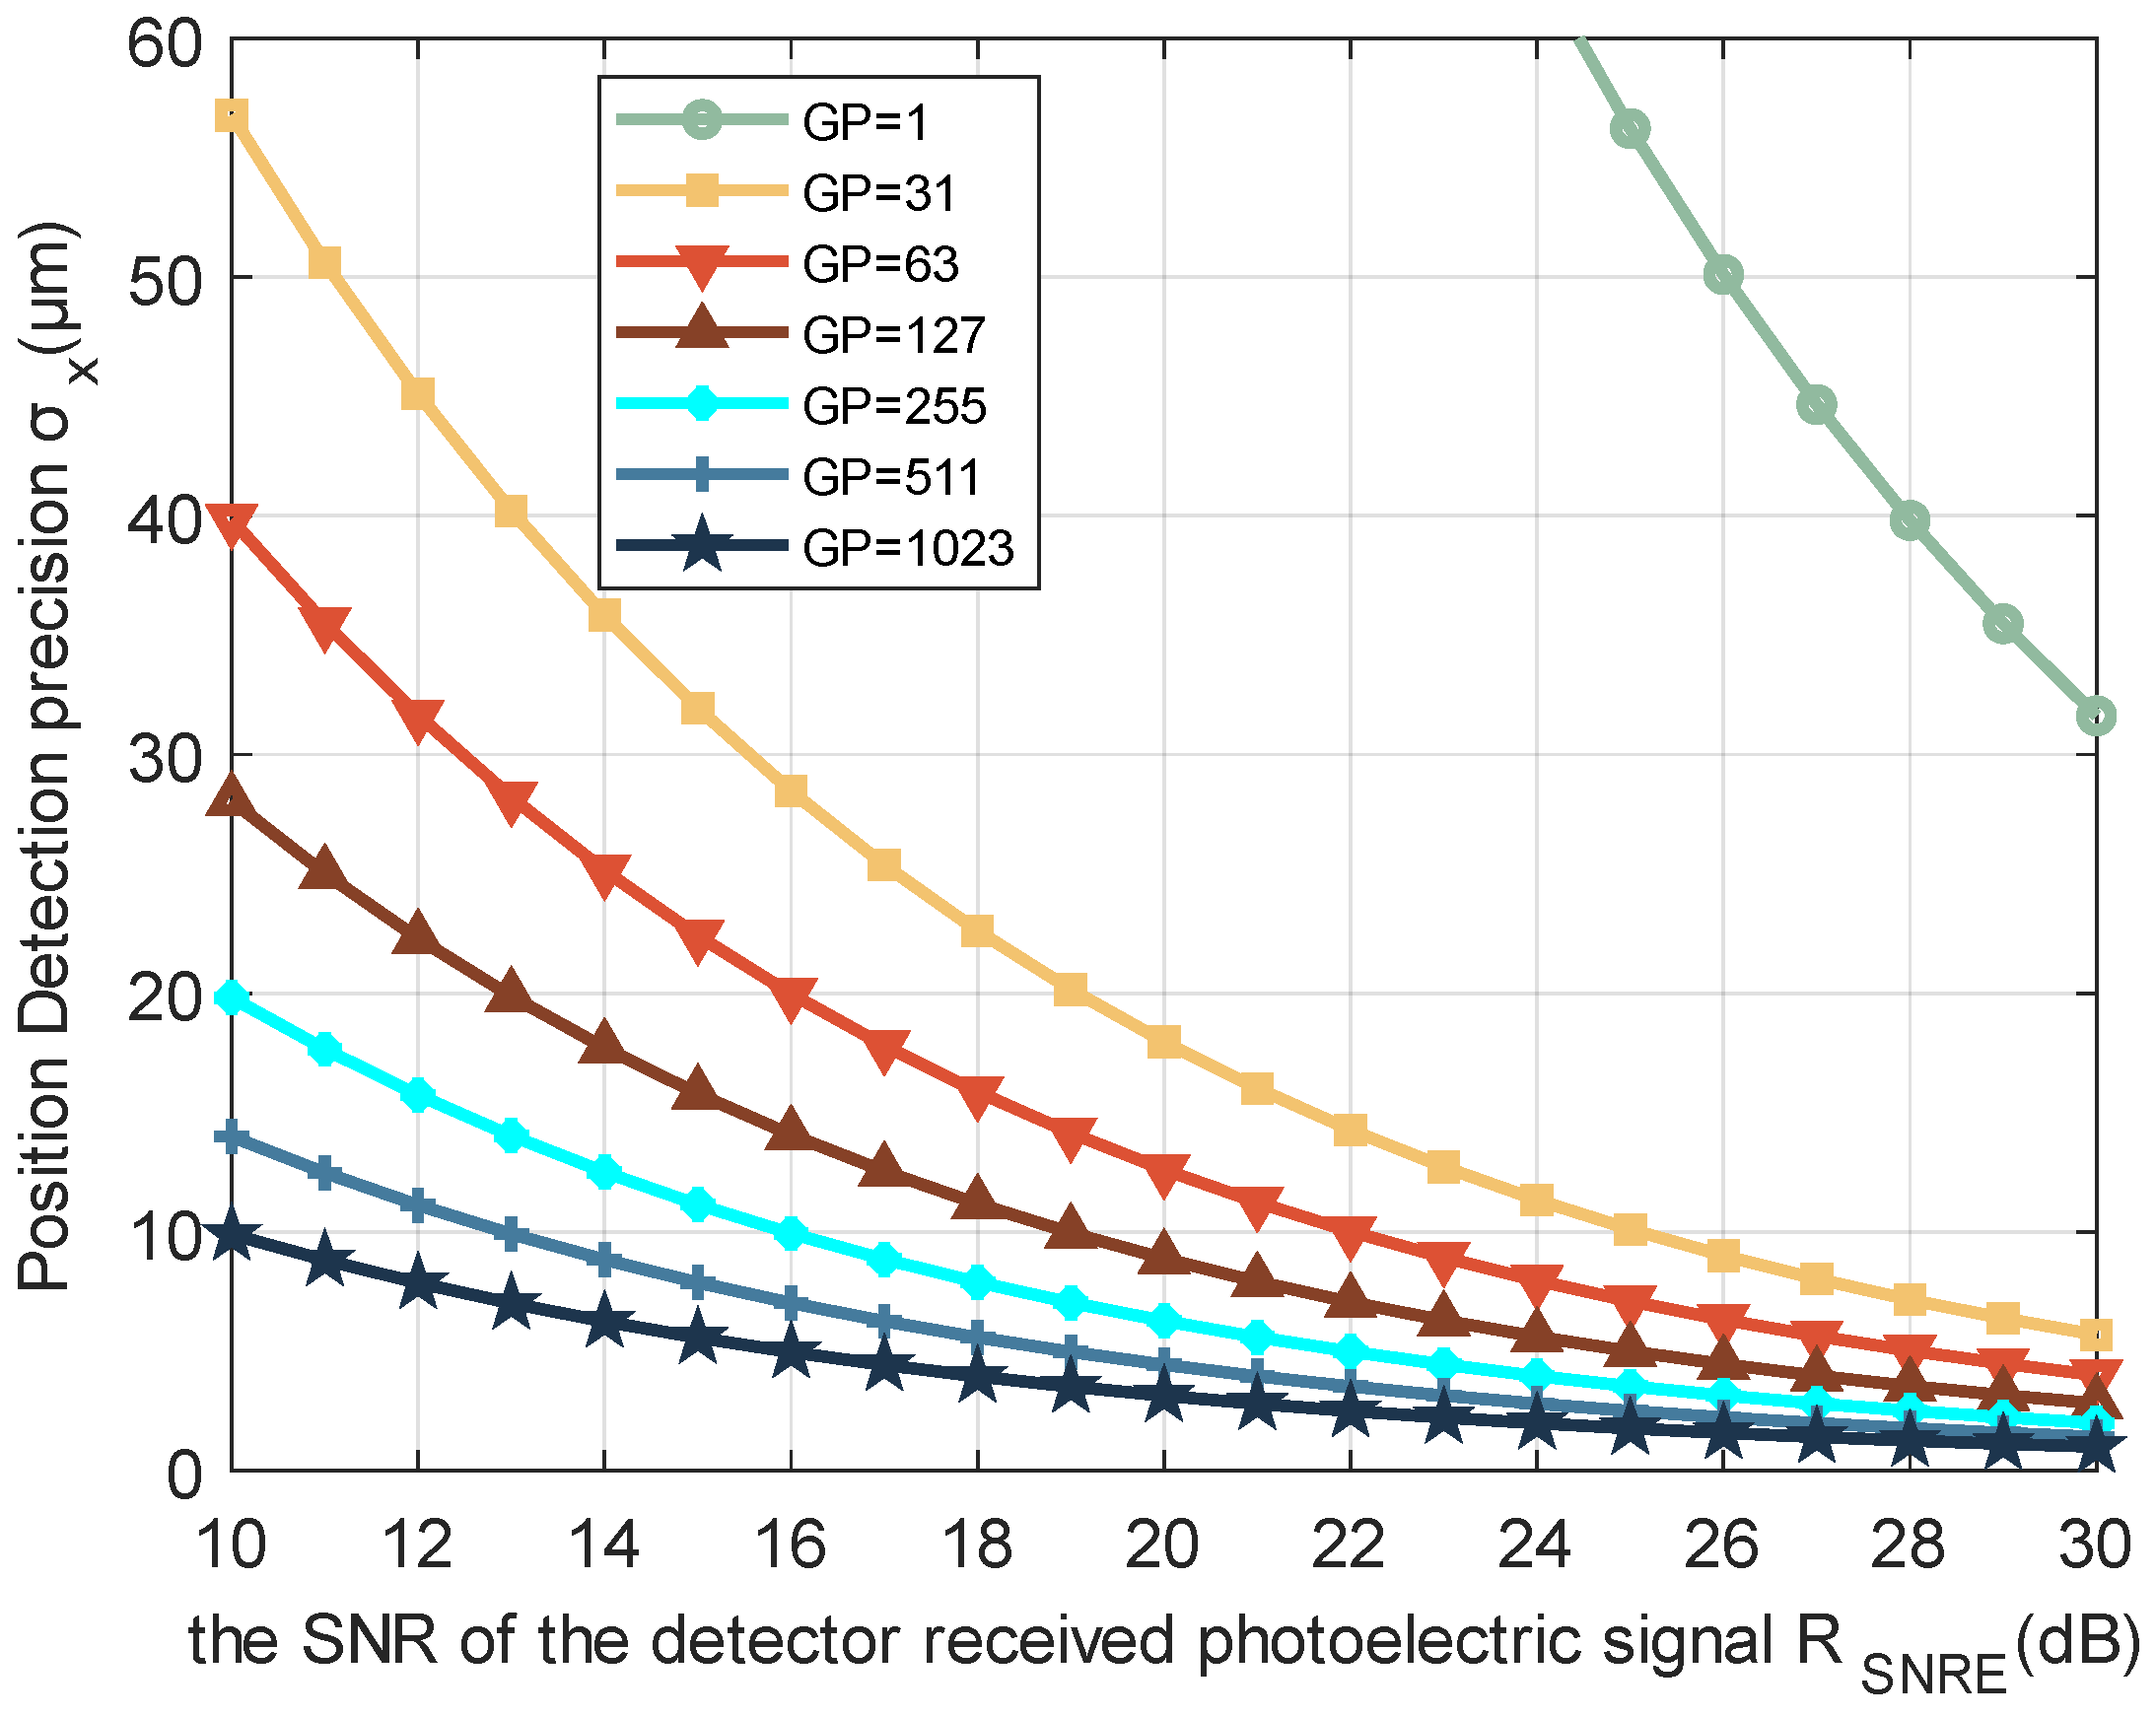
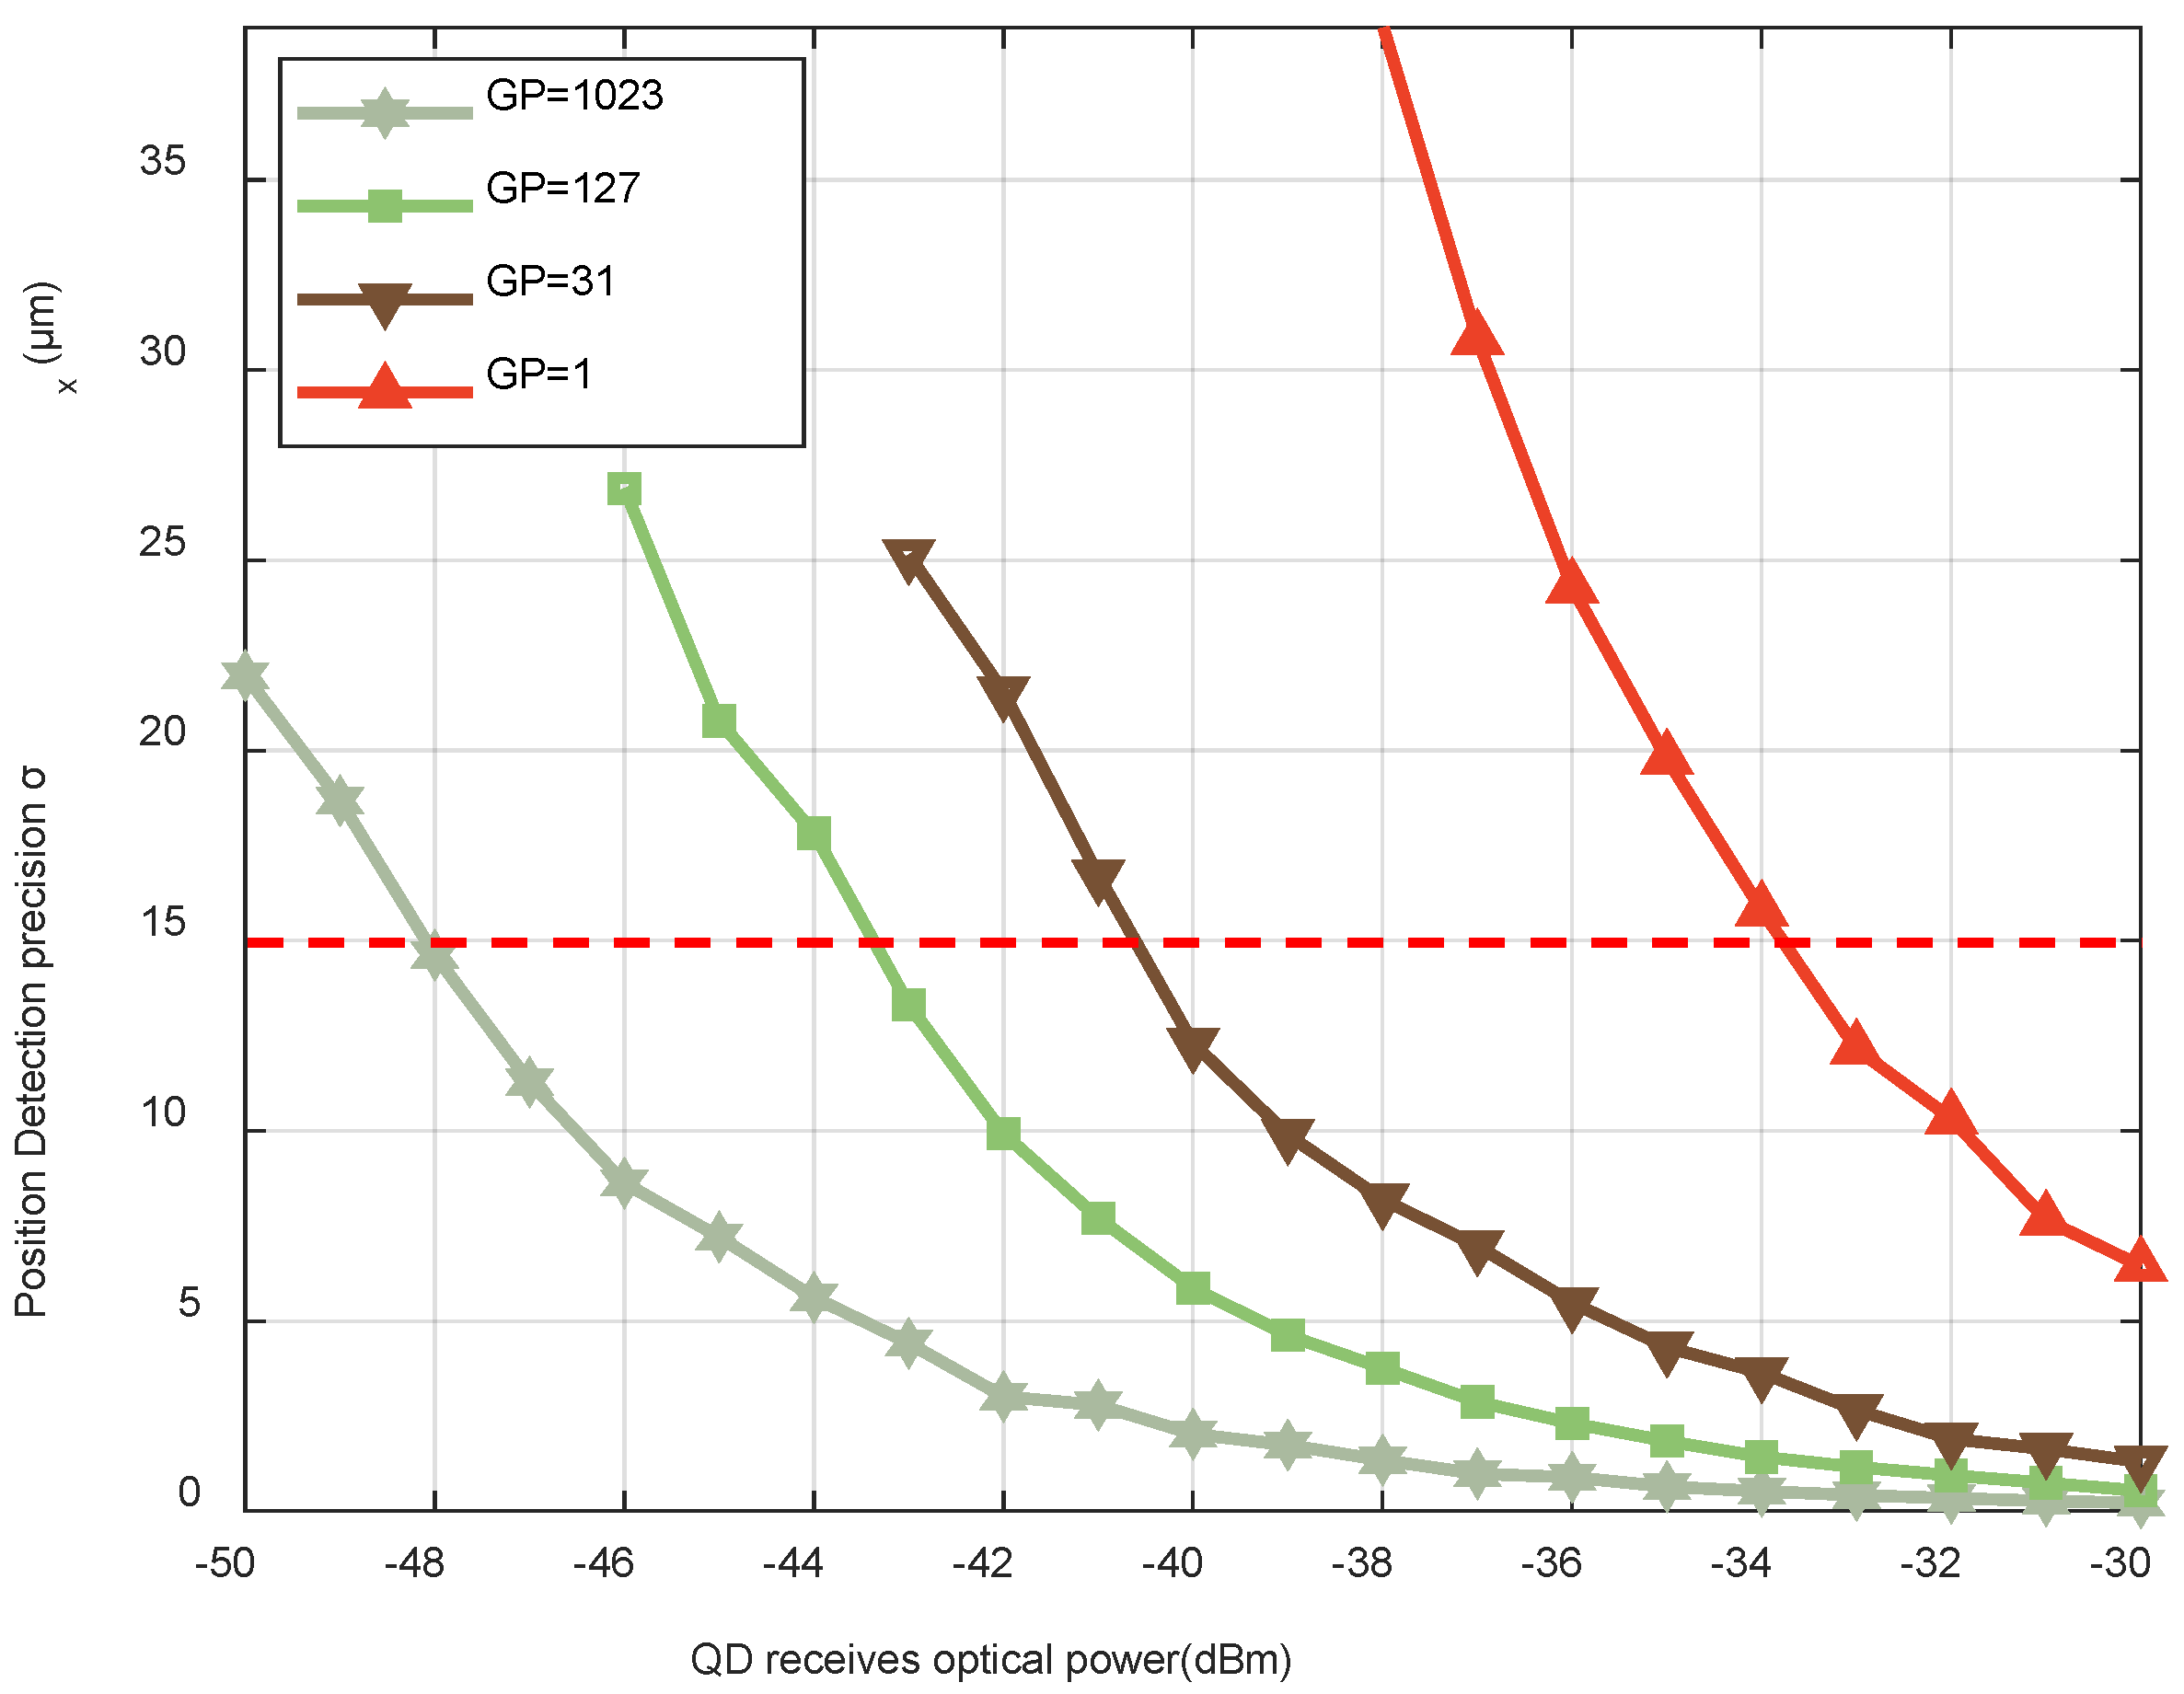
5.2. The Impact of Spread-Spectrum Sequence Depth on Position-Detection Precision

The SNR is a critical factor affecting the system error rate and the precision of QD position detection. Employing spread-spectrum technology effectively enhances the SNR after despreading, thereby influencing the precision of light-spot position detection. To compare the impact of spread-spectrum sequences of different depths on the precision of light-spot position detection under the same received optical power and to avoid the nonlinear effects of QD position detection, statistical analysis was conducted on the output positions of the QD when the incident light spot was positioned at the center of the detector (true position equals relative position, x 0 = x r = 0 ), when the optical power received by the QD was −40 dBm, and when the incident light-spot radius was 0.7 mm.
Figure 8 presents the experimental results of modulation when using PRNs with depths of 1023, 127, and 31, and direct detection. In the figure, 2000 detected spot positions are sampled, with the y-axis representing the calculated actual position x. Via comparison with Figure 8, it can be observed that as the modulation PRN depth increases, the spread-spectrum gain becomes larger, and the fluctuation of the calculated values of x decreases. When the spread-spectrum gains are 1023, 127, 31, and 1, the corresponding σ x values are 1.73 μm, 5.86 μm, 12.3 μm, and 62.31 μm, respectively. Therefore, adopting spread-spectrum technology can effectively improve the precision of QD position detection; the greater the spread-spectrum gain, the better the precision of position-detection precision under the same receiving power.
To further analyze the improvement in the precision of position detection under low-SNR conditions, in Figure 9, the centroid position of the spot is set at the origin of the detector and a spot radius of 0.7 mm is employed. The variation in the precision of position detection is illustrated as a function of the detector’s received optical power within the range of −50 dBm to −30 dBm. The abscissa represents the received optical power of the QD, while the ordinate denotes the RMSE of the detection output positions. The results are presented in Figure 9:
As shown in Figure 9, the beacon spread-spectrum modulation detection method is significantly superior to direct detection. Under the same spread-spectrum gain, the received optical power (that is, the signal-to-noise ratio) affects the accuracy of position detection; as the received optical power increases, the system output σ x decreases, resulting in QD position detection with higher precision. If the system achieves a position-detection precision of 15 μm and a G p of 1023, 127, 31, and 1, the received optical powers of the QD are −48.2 dBm, −43.8 dBm, −40.7 dBm, and −33.8 dBm, respectively. Therefore, compared to direct detection, this represents 14.4 dB, 10 dB, and 6.9 dB reductions in the optical power requirements, respectively. Hence, while maintaining the precision of detection, it is possible to reduce the demand for the received optical power of the QD by modulating pseudo-random code sequences of different depths. Additionally, an analysis of the performance of the QD when detecting the position of the light spot under the same received optical power is presented in Table 4.
Table 4 presents the accuracy of position detection under three different spread-spectrum gain settings, as well as the experimental and theoretical improvements in the precision of position detection under each spread-spectrum gain. When the received optical power of the received signal remains constant, it is evident that the position-detection precision achieved by the direct detection system σ x is significantly lower than that of the spread-spectrum detection system. Furthermore, as the spreading gain increases, the improvement in the position-detection precision achieved by the system becomes more pronounced. The gain in SNR achieved via the use of spread-spectrum technology effectively enhances the system’s detection precision. When the received optical power at the QD is −37 dBm, the σ x for spreading depths of 1023, 127, and 31 is 0.983 μm, 2.876 μm, and 7.275 μm, respectively. This represents improvements of 14.96 dB, 10.29 dB, and 6.26 dB compared to the position-detection precision achieved by the direct method, which is 30.811 μm. When comparing the theoretical values provided in the table, it is evident that the spreading gain obtained by the spread spectrum is slightly lower than the theoretical calculation due to the influence of the phase-locking performance of the digital phase-locked loop. Additionally, σ x decreases as the depth of the modulation PRN increases, resulting in an increase in the position-detection precision; this aligns with the results of the theoretical simulation analysis.

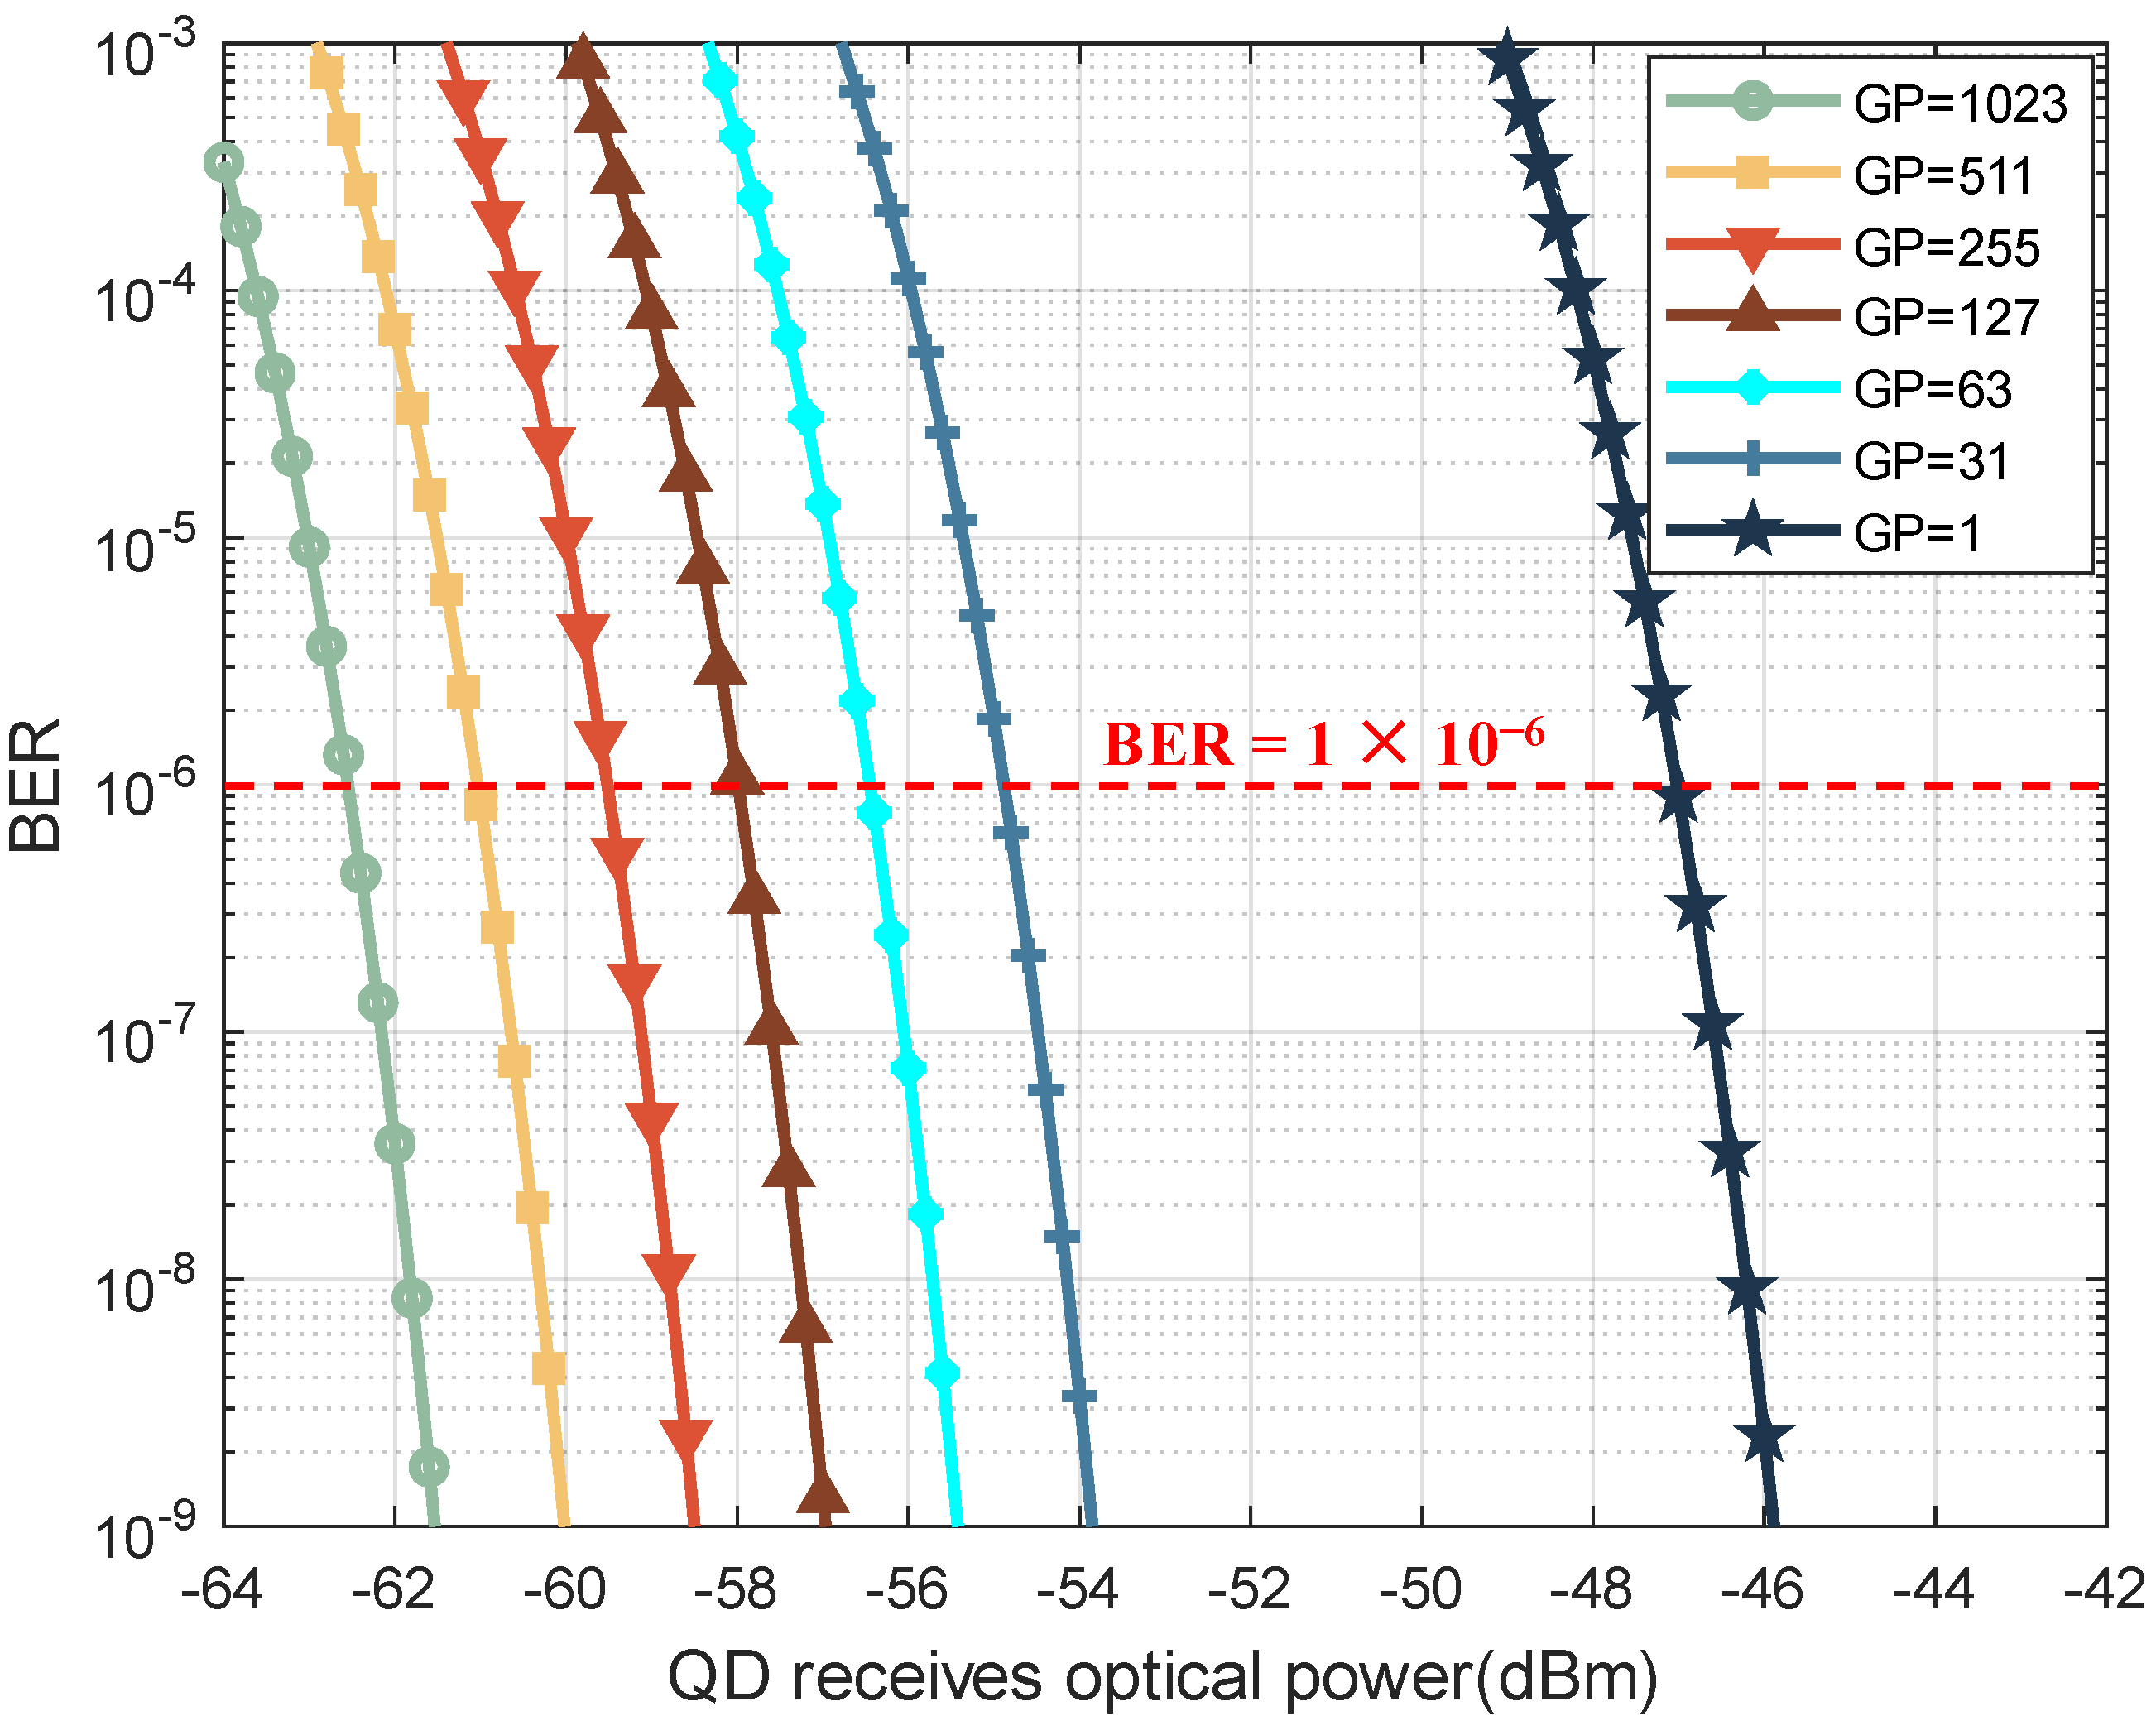
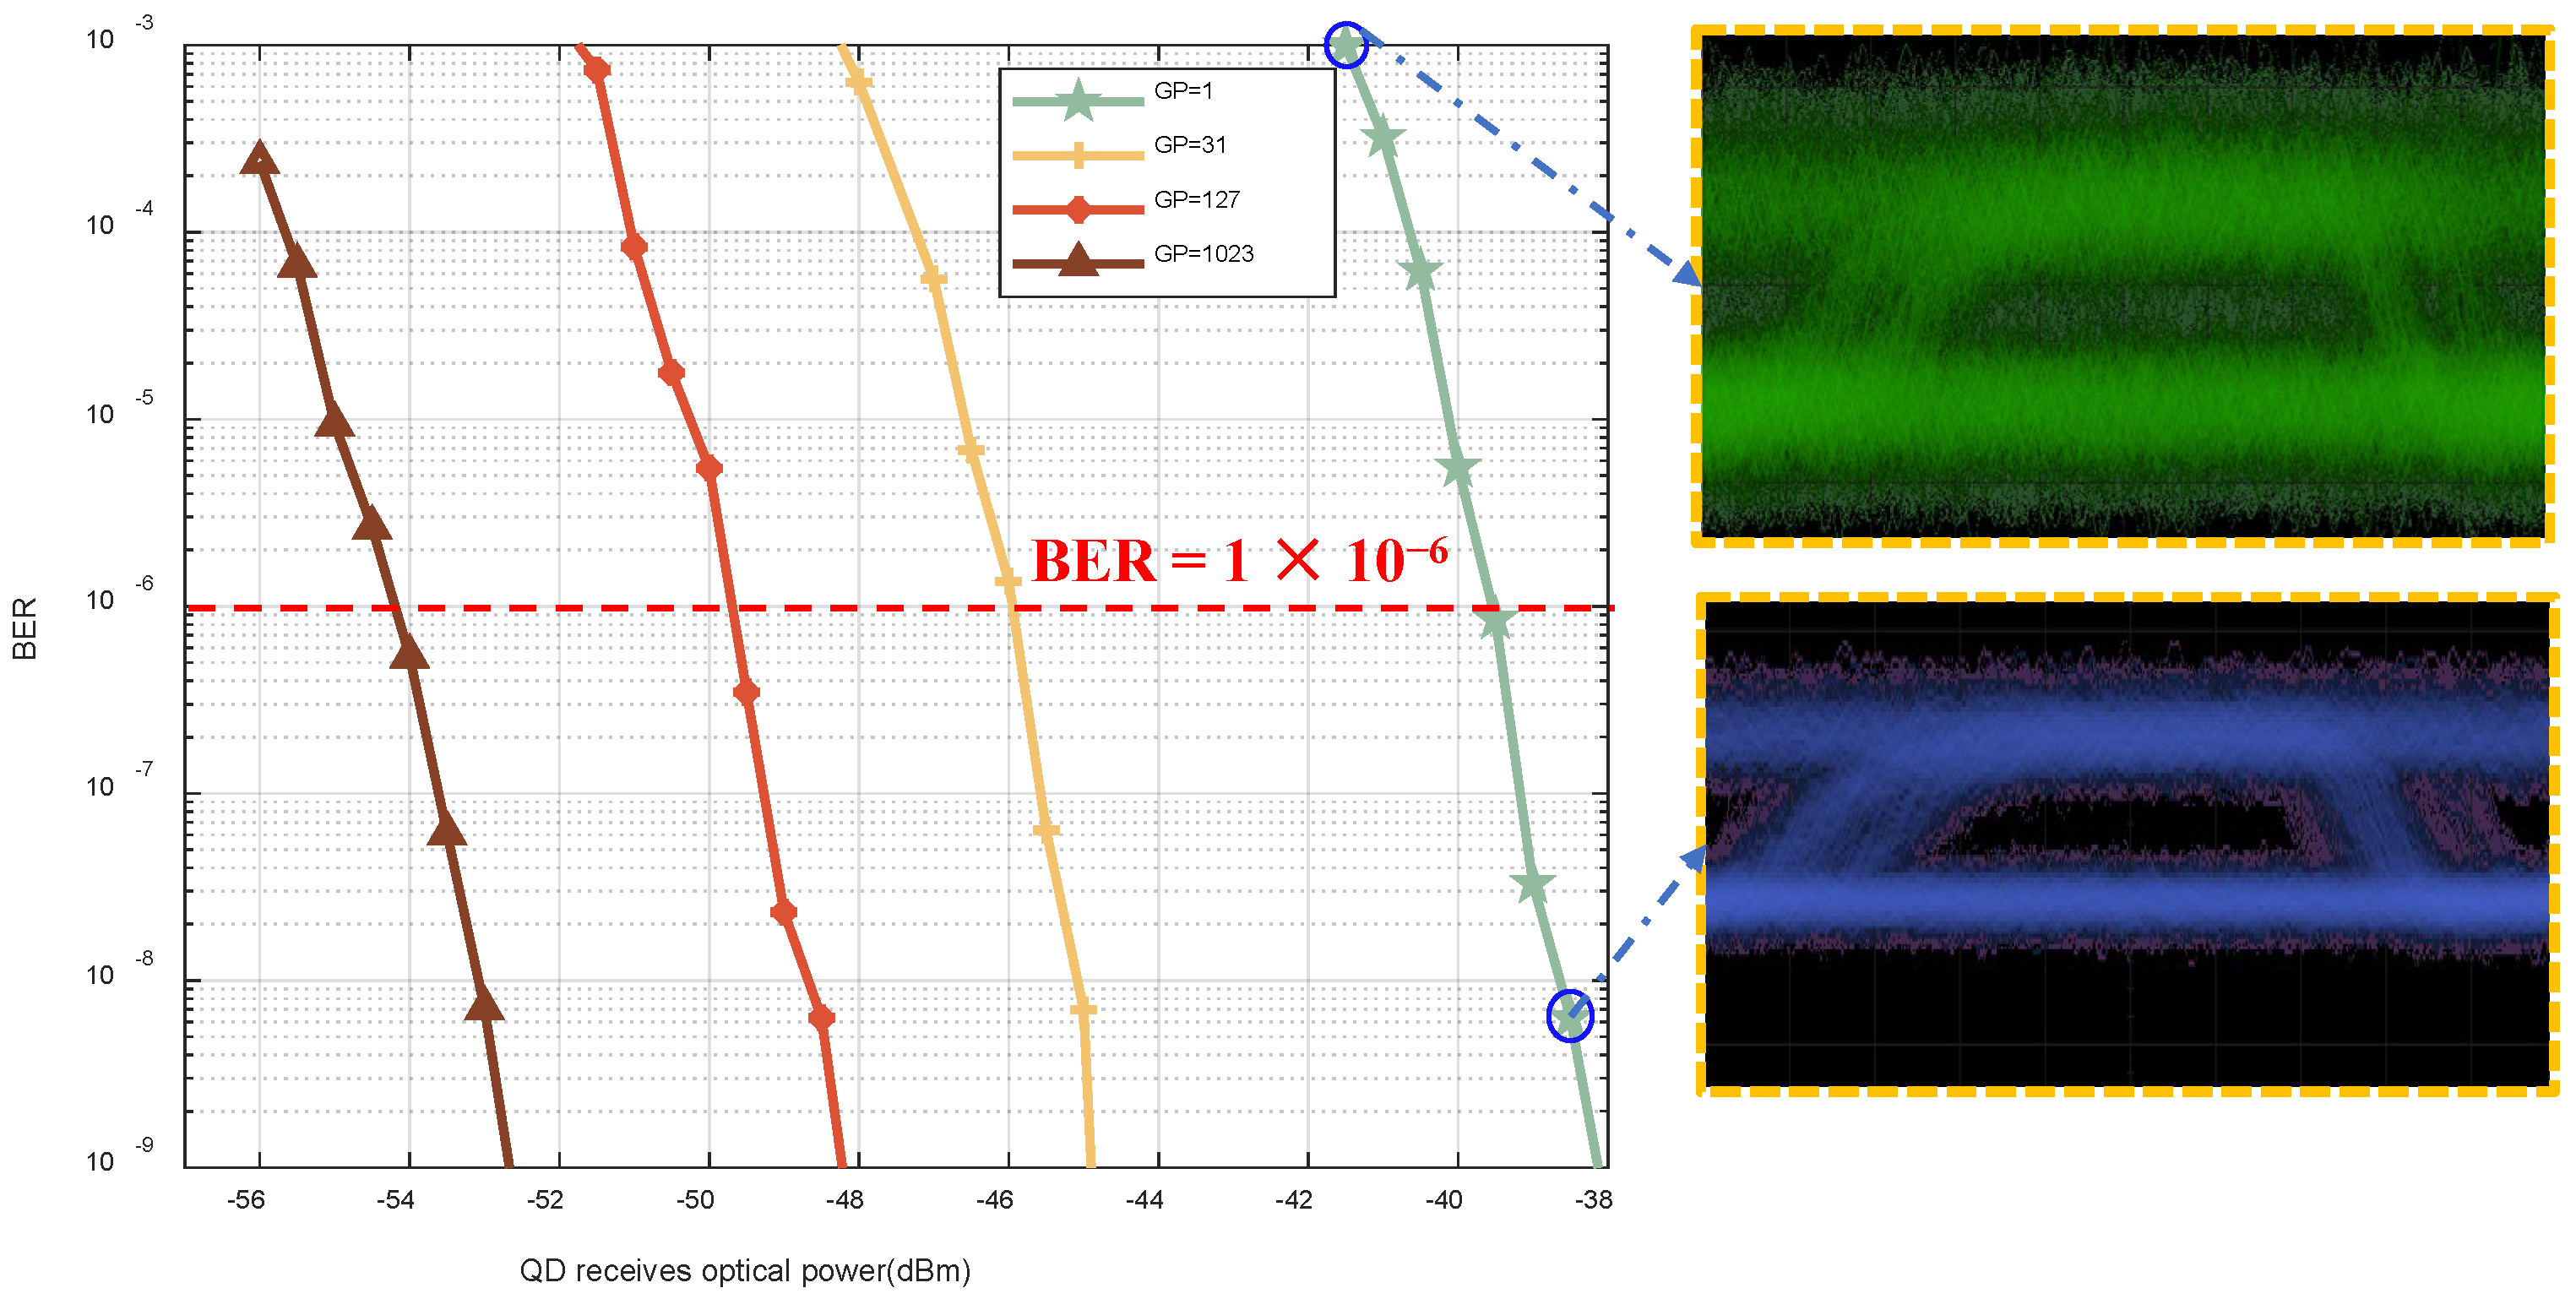
5.3. The Impact of Spread-Spectrum Sequence Depth on System Sensitivity

In order to verify the relationship between spreading gain and the sensitivity of the detector system, signals with different spreading gains were designed and transmitted. These included spread signals with PRN depths of 1023, 127, and 31. At a signal bandwidth of 10 MHz, the corresponding effective data rates for these spread signals are 9.7 kbps, 78.74 kbps, and 322.58 kbps, respectively. The non-spread signal and spread signals maintain the same bandwidth, with a data rate of 10 Mbit/s. The experimental results obtained for the received optical power and beacon communication data error rate under different spreading gains are shown in Figure 10.
It can be observed in Figure 10 that different spreading gains result in varying degrees of improvement in the reception sensitivity. In addition, higher spreading gains lead to a superior enhancement in sensitivity. Compared to the non-spread signal (with a sensitivity of −39.6 dBm), the spread signal with a modulation PRN of 1023 achieves a reception sensitivity of −54.2 dBm, resulting in an improvement of 14.6 dB.
Additionally, Table 5 presents the sensitivity of spread signals with PRN depths of 1023, 127, and 31, achieving a system-detection error rate of 1 × 10⁻⁶. It also presents their improvements in sensitivity when compared to those achieved using direct detection with a spreading gain of 1. The improvements in sensitivity achieved are 14.6 dB, 10.1 dB, and 6.4 dB for PRN depths of 1023, 127, and 31, respectively. The enhancement in sensitivity is approximately proportional to G P . Therefore, spread-spectrum detection can effectively improve the sensitivity of the detector, and the received optical power required by the QD is lower when the communication bit error rate is met.

6. Conclusions

This paper applies spread-spectrum technology to the detection of the QD’s low beacon optical-power position and communication. By increasing the bandwidth of the transmitted beacon communication data signal via spread-spectrum technology, gains are achieved in the SNR after despreading. This enhances the position-detection precision achieved by the QD and the sensitivity of the system. The experimental results demonstrate that the beacon spread-spectrum modulation scheme can effectively detect light-spot positions, with a detection range and linear region similar to those of direct detection. When the received optical power at the QD is −37 dBm, the RMSE values for spreading depths of 1023, 127, and 31 are 0.983 μm, 2.876 μm, and 7.275 μm, respectively. This represents improvements of 14.96 dB, 10.29 dB, and 6.26 dB compared to the position-detection precision of the direct method, which is 30.811 mm. Additionally, under an identical signal bandwidth, the sensitivity improves by 14.6 dB, 10.1 dB, and 6.4 dB, respectively. Therefore, spread-spectrum technology is able to overcome the hardware limitations associated with reception sensitivity and the precision of position detection to some extent. This comes at the expense of bandwidth, but it leads to higher sensitivity and precision in position detection. Thus, this method could be applied in practical scenarios requiring high-precision detection and long-distance space laser communication using quadrant detectors.

Author Contributions

Conceptualization, S.C. and X.Y.; methodology, X.Y. and S.C.; software, S.C., P.L. and J.Y.; validation, T.W. and Z.Z.; formal analysis, L.X.; investigation, S.C.; resources, S.C. and Z.Z.; data curation, S.C., X.Y., P.L. and J.Y.; writing—original draft preparation, S.C. and L.X.; writing—review and editing, S.C., X.Y. and P.L.; visualization, S.C., X.Y., P.L., J.Y. and T.W.; supervision, X.Y. and P.L.; project administration, L.X. and T.W.; funding acquisition, X.Y. and S.C. All authors have read and agreed to the published version of the manuscript.

Funding

This research was funded by the National Key R&D Program of China (2022YFB3902500, 2022YFB2903402, 2021YFA0718804).

Institutional Review Board Statement

Not applicable.

Informed Consent Statement

Not applicable.

Data Availability Statement

The data presented in this study are available in the article.

Conflicts of Interest

The authors declare no conflicts of interest.

References

  1. Pimentel, P.M.; Rödiger, B.; Schmidt, C.; Fuchs, C.; Rochow, C.; Hiemstra, T.; Zager, A.; Wertz, P.; Knopp, M.; Lehmann, M.; et al. Cube laser communication terminal (CubeLCT) state of the art. Acta Astronaut. 2023, 211, 326–332. [Google Scholar] [CrossRef]
  2. Gao, D.; Li, T.; Sun, Y.; Wang, W.; Hu, H.; Meng, J.; Zheng, Y.; Xie, X. Latest developments and trends of space laser communication. Chin. Opt. 2018, 11, 901–913. [Google Scholar]
  3. Toyoshima, M. Recent trends in space laser communications for small satellites and constellations. J. Light. Technol. 2021, 39, 693–699. [Google Scholar] [CrossRef]
  4. Li, R.; Lin, B.; Liu, Y.; Dong, M.; Zhao, S. A survey on laser space network: Terminals, links, and architectures. IEEE Access 2022, 10, 34815–34834. [Google Scholar] [CrossRef]
  5. Li, L.; Xuejiao, Z.; Jianhua, Z.; Changzhi, X.; Yi, J. Advanced space laser communication technology on cubesats. ZTE Commun. 2021, 18, 45–54. [Google Scholar]
  6. Jiang, H.L.; Tong, S.F. Space Laser Communication Technology and System; National Defence Industry Press: Beijing, China, 2011; pp. 9–22. [Google Scholar]
  7. Zhang, W.; Guo, W.; Zhang, C.; Zhang, S. An Improved Method for Spot Position Detection of a Laser Tracking and Positioning System Based on a Four-Quadrant Detector. Sensors 2019, 19, 4722. [Google Scholar] [CrossRef] [PubMed]
  8. Bao, R.; Yu, D.; Chen, F.; Lv, Z.; Xue, J.; Pan, Q.; Zhang, R. Research on High-Precision Position Detection Based on a Driven Laser Spot in an Extreme Ultraviolet Light Source. Photonics 2024, 11, 75. [Google Scholar] [CrossRef]
  9. Jiabin, W.; Bo, Z.; Zhiyong, W. Improved measurement accuracy of the spot position on an InGaAs quadrant detector by introducing Boltzmann function. In Proceedings of the 2015 International Conference on Optoelectronics and Microelectronics (ICOM), Changchun, China, 16–18 July 2015; pp. 183–185. [Google Scholar]
  10. Wang, X.; Su, X.; Liu, G.; Han, J.; Wang, K.; Zhu, W. A Method for Improving the Detection Accuracy of the Spot Position of the Four-Quadrant Detector in a Free Space Optical Communication System. Sensors 2020, 20, 7164. [Google Scholar] [CrossRef] [PubMed]
  11. Baleya, M.; Shalaby, H.; Kato, K.; Elsabrouty, M. Neural Network Ensemble for Precise Laser Spot Position Determination on a Quadrant Detector. IEEE Photonics Technol. Lett. 2023, 36, 115–118. [Google Scholar] [CrossRef]
  12. Wang, X.; Su, X.; Liu, G.; Han, J.; Zhu, W.; Liu, Z. Method to improve the detection accuracy of quadrant detector based on neural network. IEEE Photonics Technol. Lett. 2021, 33, 1254–1257. [Google Scholar] [CrossRef]
  13. Vo, Q.; Zhang, X.; Fang, F. Extended the linear measurement range of four-quadrant detector by using modified polynomial fitting algorithm in micro-displacement measuring system. Opt. Laser Technol. 2019, 112, 332–338. [Google Scholar] [CrossRef]
  14. Huo, L.; Wu, Z.; Wu, J.; Gao, S.; Chen, Y.; Song, Y.; Wang, S. High-Precision Log-Ratio Spot Position Detection Algorithm with a Quadrant Detector under Different SNR Environments. Sensors 2022, 22, 3092. [Google Scholar] [CrossRef]
  15. Zhang, H.; Chen, Y.; Geng, T.; Wu, J.; Chen, T. Study on main factors affecting position detection accuracy of four-quadrant detector. Chin. J. Lasers 2015, 42, 1217002. [Google Scholar] [CrossRef]
  16. Li, Q.; Xu, S.; Yu, J.; Yan, L.; Huang, Y. An improved method for the position detection of a quadrant detector for free space optical communication. Sensors 2019, 19, 175. [Google Scholar] [CrossRef] [PubMed]
  17. Yu, J.; Li, Q.; Li, H.; Wang, Q.; Zhou, G.; He, D.; Xu, S.; Xia, Y.; Huang, Y. High-precision light spot position detection in low SNR condition based on quadrant detector. Appl. Sci. 2019, 9, 1299. [Google Scholar] [CrossRef]
  18. Bai, W.; Zou, X.; Li, P.; Ye, J.; Yang, Y.; Yan, L.; Pan, W.; Yan, L. Photonic millimeter-wave joint radar communication system using spectrum-spreading phase-coding. IEEE Trans. Microw. Theory Tech. 2022, 70, 1552–1561. [Google Scholar] [CrossRef]
  19. Deshmukh, S.; Bhosle, U. Performance evaluation of spread spectrum system using different modulation schemes. Procedia Comput. Sci. 2016, 85, 176–182. [Google Scholar] [CrossRef]
  20. Elayan, H.; Amin, O.; Shihada, B.; Shubair, R.M.; Alouini, M.-S. Terahertz band: The last piece of RF spectrum puzzle for communication systems. IEEE Open J. Commun. Soc. 2019, 1, 1–32. [Google Scholar] [CrossRef]
  21. Lyu, W.; Zhao, M.; Chen, X.; Yang, X.; Qiu, Y.; Tong, Z.; Xu, J. Experimental demonstration of an underwater wireless optical communication employing spread spectrum technology. Opt. Express 2020, 28, 10027–10038. [Google Scholar] [CrossRef] [PubMed]
  22. Lu, T.; Hu, Q.; Xu, D.; Feng, X.; Zhang, Y. Design and Verification of Underwater Electric Field Communication System Based Spread Spectrum Techniques. In Proceedings of the International Conference on Autonomous Unmanned Systems, Xi’an, China, 23–25 September 2022; Springer Nature: Singapore, 2022; pp. 1421–1431. [Google Scholar]
  23. Zhang, L.; Tang, X.; Sun, C.; Chen, Z.; Li, Z.; Wang, H.; Jiang, R.; Shi, W.; Zhang, A. Over 10 attenuation length gigabits per second underwater wireless optical communication using a silicon photomultiplier (SiPM) based receiver. Opt. Express 2020, 28, 24968–24980. [Google Scholar] [CrossRef] [PubMed]
  24. Spilker, J.J., Jr.; Axelrad, P.; Parkinson, B.W.; Enge, P. (Eds.) . Global Positioning System: Theory and Applications; American Institute of Aeronautics and Astronautics: Reston, VA, USA, 1996; Volume I. [Google Scholar]
  25. Gavriloaia, G.; Halunga, S.; Narita, R.M. Coarse/Acquisition GPS Codes Correlation Properties and Vulnerability to Noise. In Proceedings of the 2007 8th International Conference on Telecommunications in Modern Satellite, Cable and Broadcasting Services, Nis, Serbia and Montenegro, Nis, Serbia, 26–28 September 2007; pp. 554–557. [Google Scholar] [CrossRef]
  26. Ndili, A. GPS pseudolite signal design. In Proceedings of the Institute of Navigation GPS-94, Salt Lake City, UT, USA, 20–23 September 1994; pp. 1375–1382. [Google Scholar]
  27. El-Khamyj, S.E.; Balamesh, A.S.; Morfequ, B.H. On the generation and correlation measurements of Gold codes. Int. J. Electron. 1988, 64, 481–492. [Google Scholar] [CrossRef]
  28. Sarwate, D.V.; Pursley, M.B. Crosscorrelation properties of pseudorandom and related sequences. Proc. IEEE 1980, 68, 593–619. [Google Scholar] [CrossRef]
  29. Sharma, A.; Anwar, T.; Sharma, D.K. Simulation of Gold Code Sequences for Spread Spectrum Application. Int. J. Eng. Tech. Res. (IJETR) 2014, 2, 129–132. [Google Scholar]
  30. Guo, X.; Qian, W.; Gu, G.; Chen, Q.; Cao, E.; Hu, X. Study of laser location based on four-quadrant detector APD. In Advanced Laser Manufacturing Technology; SPIE: Bellingham, WA, USA, 2016; Volume 10153, pp. 153–162. [Google Scholar]
  31. Cao, W.; Huang, Y.; Fan, K.-C.; Zhang, J. A novel machine learning algorithm for large measurement range of quadrant photodetector. Optik 2021, 227, 165971. [Google Scholar] [CrossRef]
  32. Reynders, B.; Pollin, S. Chirp spread spectrum as a modulation technique for long range communication. In Proceedings of the 2016 Symposium on Communications and Vehicular Technologies (SCVT), Mons, Belgium, 22 November 2016; pp. 1–5. [Google Scholar]
  33. Fakatselis, J. Processing gain in spread spectrum signals. Harris Semiconductor application note. 1998.
  34. Milstein, L.B.; Simon, M.K. Spread spectrum communications. In The Mobile Communications Handbook; CRC Press: Boca Raton, FL, USA, 1999; p. 19990749. [Google Scholar]
  35. Trichili, A.; Cox, M.A.; Ooi, B.S.; Alouini, M.S. Roadmap to free space optics. JOSA B 2020, 37, A184–A201. [Google Scholar] [CrossRef]
  36. Basudewa, M.I.; Bagaskara, Z.H.; Damita, S.S.A.; Putra, R.F.; Ahmadi, D. Bit error rate performance analysis for free space optic communication. In IOP Conference Series: Materials Science and Engineering; IOP Publishing: Bristol, UK, 2020; Volume 850, p. 012056. [Google Scholar]
  37. Wang, R.; Yu, X.; Tong, S.; Chen, X.; Wu, T.; Zhao, B. Design of digital tracking and communication composite receiver for four quadrant detector. In Fiber Optic Sensing and Optical Communication; SPIE: Bellingham, WA, USA, 2018; Volume 10849, pp. 196–203. [Google Scholar]
  38. Yu, X.; Chen, X.; Song, Y.; Zhang, L.; Jiang, J.; Wang, T.; Tong, S. Design and evaluation of a high-sensitivity digital receiver with the finite impulse response filter algorithm for free-space laser communication. Opt. Eng. 2020, 59, 036105. [Google Scholar] [CrossRef]
Figure 1. Block diagram of QD system for beacon spread-spectrum modulation. ADC represents the Analog-to-Digital Converter. TIA represents the transimpedance amplifier, and LPF represents the low-pass filter. Early, Punctual, and Late represent the Early code, the Punctual code, and the Late code. R I represents the correlation values between the Punctual code and the received signal.
Applsci 14 03362 g001
Figure 2. The various levels of position-detection accuracy achieved by the detector under different spreading gains and SNRs.
Applsci 14 03362 g002
Figure 3. The relationship between the received optical power and signal bit error rate under different spreading gains.
Applsci 14 03362 g003
Figure 4. Block diagram of QD experimental system. “BS” stands for beam splitter, which is a half-transparent and half-reflective mirror.
Applsci 14 03362 g004
Figure 5. The construction of the QD experimental system and digital signal processing.
Applsci 14 03362 g005
Figure 6. The auto-correlation values of the Punctual code under the phase acquisition and tracking states of the digital phase-locked loop.
Applsci 14 03362 g006
Figure 7. Different radii: QD system detects light-spot positions under beacon spread-spectrum modulation and direct detection: (a) Spot radius is 0.7 mm; (b) Spot radius is 0.1 mm.
Applsci 14 03362 g007
Figure 8. The detector system detects the position of the light spot for spread-spectrum gains of 1, 31, 127, and 1023.
Applsci 14 03362 g008
Figure 9. Variation in precision of QD position detection with different received optical powers.
Applsci 14 03362 g009
Figure 10. Graph depicting the relationship between the BER and the received optical power at the QD.
Applsci 14 03362 g010
Table 1. Names and descriptions of the variables in Section 2.
Variable NameDescriptionVariable NameDescription
P s Average optical power output of the laser I j t j -th quadrant
d ( t ) Communication data j Takes values of I, II, III, and IV
c ( t ) PRN data η The responsivity of the QD
S t ( t ) Output optical power signal of the laser P j j -th quadrant
R τ Autocorrelation value n j ( t ) j -th quadrant
T c Period of communication data bits K Transimpedance amplifier gain of the circuit
T s Bit period of the PRN V j t j -th quadrant photoelectric signal collected by the ADC
τ Clock delay between pseudo-random codes R j j -th quadrant
i A non-zero integer R s j τ Correlation value between the j-th quadrant beacon signal and the PRN
N The depth of the PRN periodic sequence R n j τ j -th quadrant and the PRN
n Bit width of the PRN register x r , y r The relative position coordinates of the optical spot center
Table 2. When R SNRE = 20 dB, the precision of the position detection achieved by the QD at the center position under different spreading gains.
Pseudocode Sequence Depth131631272555111023
G P (dB)014.9117.921.0324.0627.0830.09
σ (μm)10017.9612.598.876.264.423.12
σ G p = 1 / σ   ( dB ) 07.458.9910.5212.0313.5415.05
Table 3. Experimental equipment parameters and models.
Experimental ApparatusParameters
Quadrant DetectorModel: QA4000-10-TO
Responsivity: 36 A/W
Active Area: 4000 μm
LaserModel: CTLP-850-002m-4-B-PD
Wavelength: 850 nm
Fiber Optic AttenuatorsWavelength Range: 780 nm~980 nm
Beam SplitterT:R = 50%:50%
ADCSampling rate: 65 MSPS
FPGAModel: EP4CE10F17I7N
Table 4. Position-detection precision achieved by the four-quadrant detector under different spreading gains.
Pseudocode Sequence DepthReceived Optical Power is −34 dBm, σ
(μm)
The Improvement in Position Detection Precision σ G p = 1 / σ   ( dB ) Received Optical Power is −37 dBm, σ
(μm)
The Improvement in Position-Detection Precision σ G p = 1 / σ   ( dB ) Theoretical Optimization σ G p = 1 / σ   ( dB )
115.395130.81110
313.6416.267.2756.267.45
1271.42510.332.87610.2910.52
10230.52514.670.98314.9615.05
Table 5. Sensitivity of QD system at different spreading gain levels.
Pseudocode Sequence DepthReceived Optical Power (dBm)Comparison of Detection Sensitivity Improvement with Direct Detection (dB)Theoretical Sensitivity Improvement
(dB)
1−39.600
31−466.47.45
127−49.710.110.51
1023−54.214.615.04
Disclaimer/Publisher’s Note: The statements, opinions and data contained in all publications are solely those of the individual author(s) and contributor(s) and not of MDPI and/or the editor(s). MDPI and/or the editor(s) disclaim responsibility for any injury to people or property resulting from any ideas, methods, instructions or products referred to in the content.

