1. Introduction
In the last century, high-intensity earthquakes have occurred in seismically active regions around the world, evidencing the importance of designing buildings capable of coping with the forces that these events produce on their structures to avoid the loss of human lives. To attain this goal, a relatively recent and undoubtedly effective seismic risk prevention and mitigation strategy is represented by structural control. Among the passive control techniques, seismic isolation [
1,
2,
3] and energy dissipation [
4,
5,
6,
7,
8,
9] have found greater application in recent years. The present research concentrates on seismic isolation, which involves the interposition of devices, the isolators, between the structure and the foundation, with low horizontal stiffness and high vertical stiffness. The presence of the isolators modifies the building dynamic response to seismic events; it aims to decouple the building from ground motions. In particular, this research is focused on fiber-reinforced elastomeric isolators, which involve the use of fiber fabrics as reinforcements, like those employed in the retrofitting of existing structures [
10], instead of the steel plates used for conventional steel-reinforced elastomeric isolators. Moreover, FREIs do not have steel end plates for anchorage to the sub- and superstructures, but they are simply interposed between them. For this reason, they are also called unbonded-FREIs (U-FREIs).
There are several studies on the behavior of U-FREIs in the literature, and these isolators are still under development. For evidence, it is sufficient to consider the review of Van Engelen [
11], which alone contains mentions of 80 publications. This is because U-FREIs are particularly promising for widespread utilization, while SREI use is limited to specific categories of buildings of strategic importance or bridges, due to their high cost. The high cost of SREIs is connected to their production method, the thick steel plates used for anchoring to the sub- and superstructures, and their heavy weight, involving transportation and installation technical difficulties. The absence of plates for anchoring and the use of fiber fabrics, much lighter than steel reinforcements, make U-FREIs lighter than SREIs and easier to move and install [
12,
13]. Moreover, U-FREIs can be produced in the shape of long strips and then cut to obtain isolators of the desired dimensions [
14]. Thus, overall, U-FREIs are cheaper than SREIs and may be employed widely for buildings, as well as in poor developing countries, allowing for the protection of human lives against earthquakes all over the world [
15,
16,
17]. The good isolating behavior and effectiveness of U-FREIs in isolated buildings have already been widely demonstrated by experimentation on the devices [
18,
19,
20,
21], by tests on small-scale buildings isolated by U-FREIs on a shake table [
22,
23], and by numerical simulations [
24,
25,
26,
27,
28,
29].
In this research work, the differences in behavior between SREIs and U-FREIs are highlighted. The regulatory constraints for the application of U-FREIs in real buildings are outlined. From this analysis, it results that the main problem to be addressed for the use of U-FREIs in real structures is the necessity to restrain them against horizontal sliding. To this end, a possible constraint system is investigated. The proposed device has the objective to restrain the horizontal sliding of U-FREIs, without producing relevant modifications of their base behavior. An experimental methodology is used to investigate the method to install the device, its influence on the behavior of the U-FREIs and its effectiveness in counteracting the isolator horizontal sliding.
Tests under simple compression and combined compression and shear on FREIs in both unbonded and horizontally constrained configurations are carried out. A comparison of the results obtained from these configurations is performed to evaluate the variation in the behavior of FREIs due to the constraint system.
Shear tests for different values of compression are also performed, to assess the ability of the proposed constraint system in counteracting the sliding of the isolators for low values of compression.
The key study contributions regard the demonstration of feasibility of using the device, highlighting its limits and suggestions for possible improvements.
2. Similarities and Differences between SREIs and U-FREIs
The behavior of U-FREIs is similar to that of SREIs but with some differences, both under simple compression and under combined compression and shear.
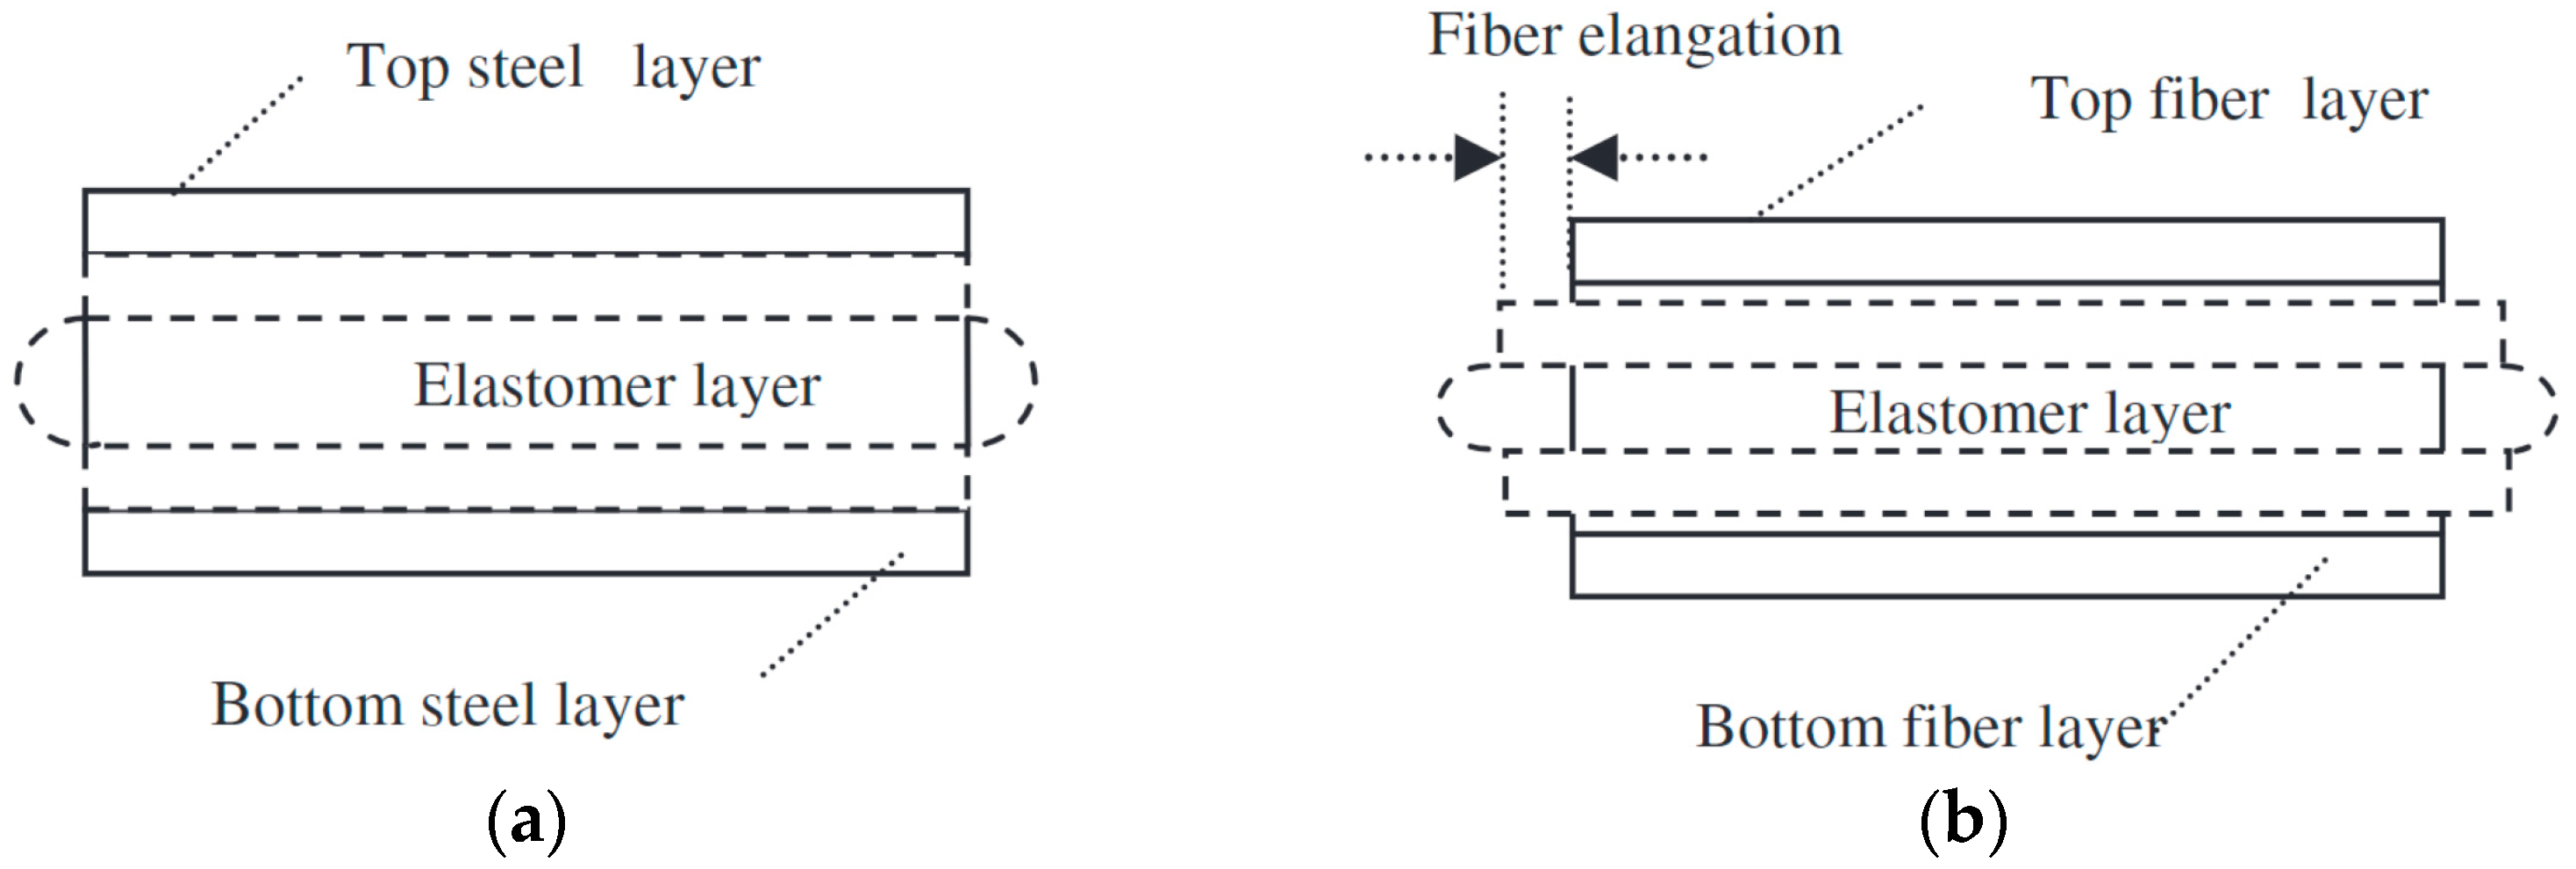
SREIs, whose reinforcements are rigid, when subjected to compression action, show only the bulging of the elastomer layers between two consecutive steel layers without deformation of the latter (
Figure 1a) [
30]. However, in U-FREIs, whose fiber fabrics are not pre-tensioned, the elastomer deformation is initially accompanied by the deformation of the fiber fabric layers. Only when the fibers come into traction do they begin to exert the containing action on the contiguous elastomeric layers (
Figure 1b). Hence, when U-FREIs are subjected to an increasing compression load, they show a low initial vertical stiffness, and only after the fibers have been reorganized and put into traction does the vertical stiffness become higher and comparable with that of SREIs [
14,
19,
31].
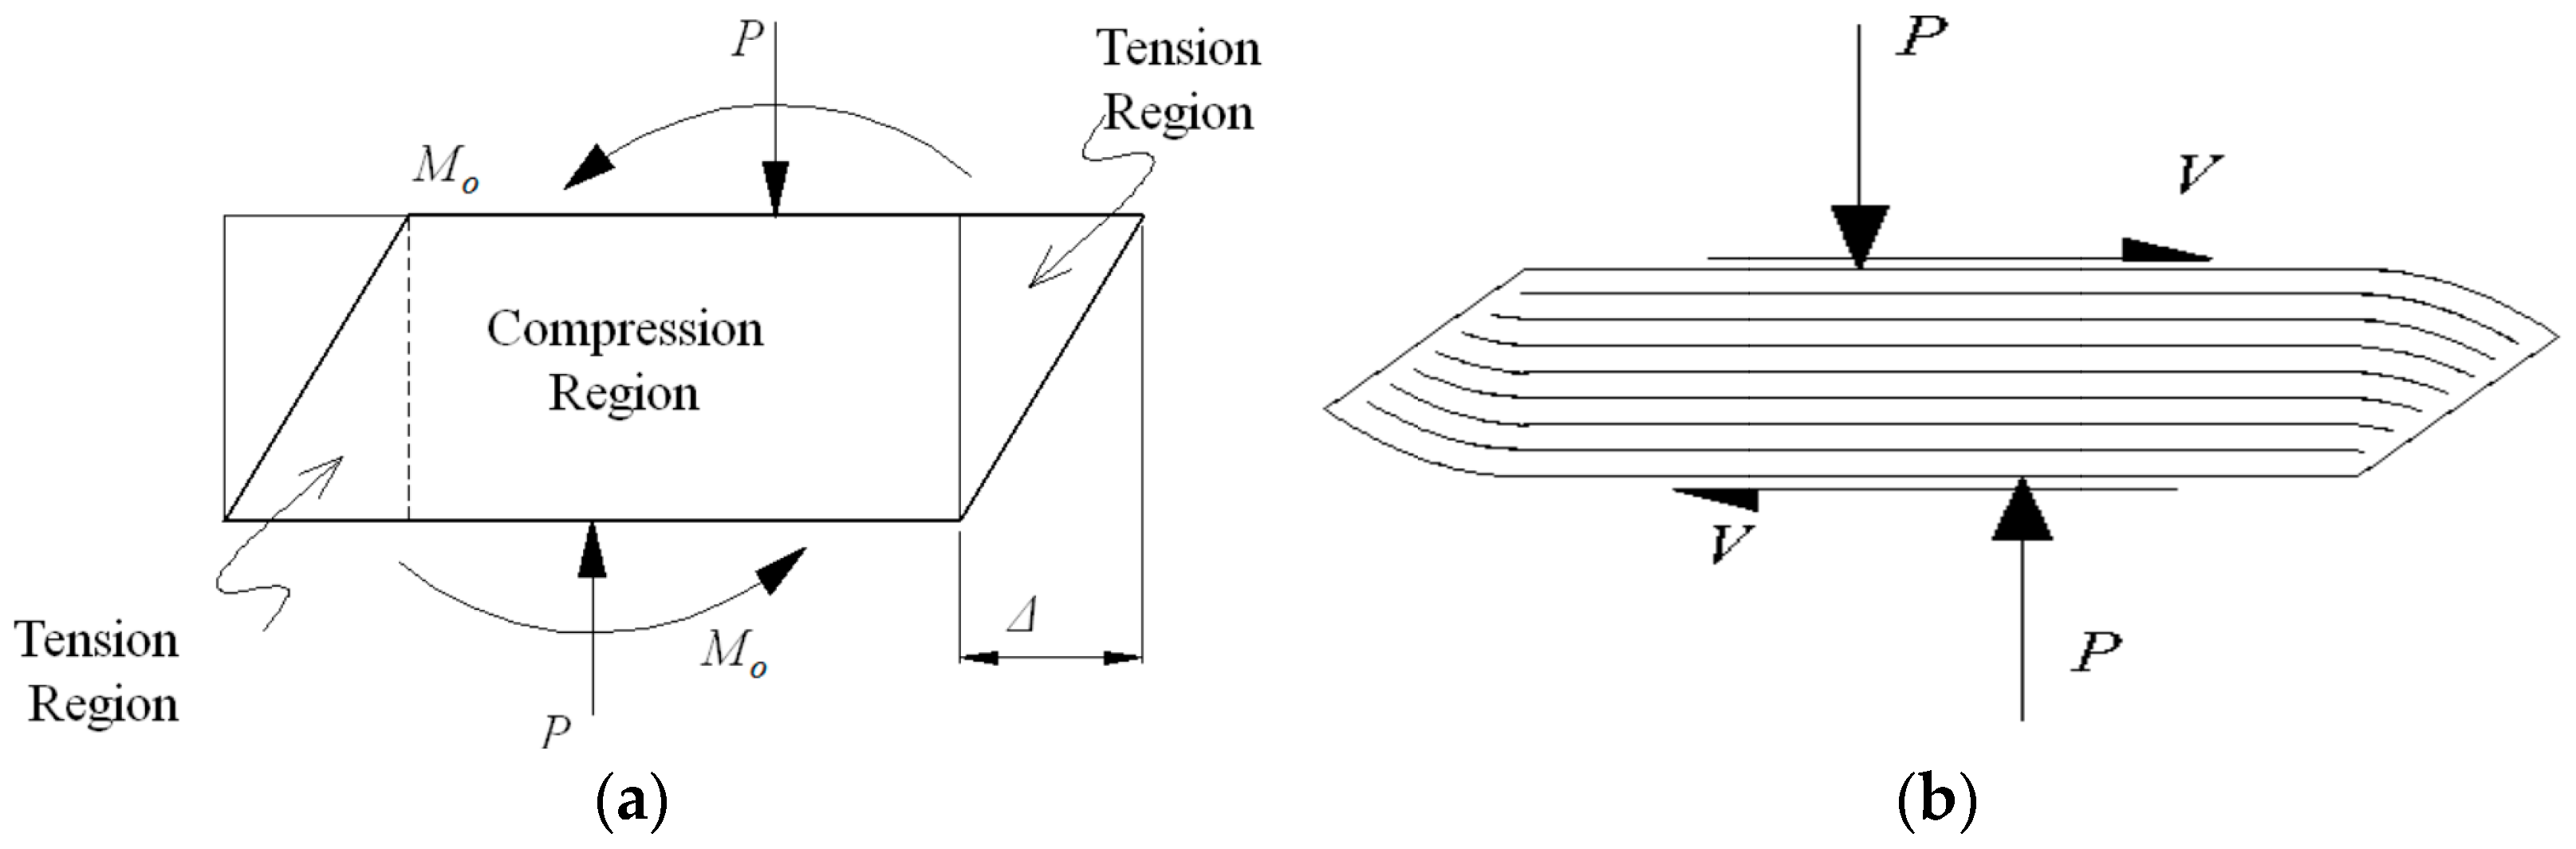
Regarding their behavior under compression and shear loads, SREIs are subjected to the stresses shown in
Figure 2a. In particular, compression is applied in the overlap region between the top and bottom surfaces, and the unbalanced moment, generated by the acting forces, is transferred by the tension stresses in the regions outside of the overlap. Under great horizontal deformation, these stresses can damage SREIs, producing delamination between the steel and elastomer layers [
32].
In U-FREIs, the moment created by the offset of the resultant compressive load,
P, balances the moment created by the shear, V, as shown in
Figure 2b [
31]. As it can be seen in this figure, since U-FREIs are not anchored to the sub- or superstructure and their reinforcements are flexible, they can roll off the support surfaces, and no tension stresses are produced, which is different from SREIs. Hence, U-FREIs can deform without damage under displacements of seismic magnitude. While the detached portions are approximately unstressed in U-FREIs, the portion remaining in contact performs a nearly pure shear deformation. By increasing the maximum imposed shear strain, the area of the isolator surfaces in contact with the support surfaces decreases and, therefore, the isolator average horizontal stiffness also decreases [
19].
This is positive for the purpose of seismic isolation because it lengthens the isolation period. In contrast, in SREIs, the horizontal stiffness remains almost constant up to a deformation of about 150% and then increases.
Due to the absence of anchorages, U-FREIs, differently from SREIs, can be subjected to horizontal sliding, depending on the amount of applied horizontal force, the acting compression load, and the friction conditions at the isolator–support contact surface.
3. Regulatory Constraints for the Possible Use of U-FREIs
Given the general good behavior of U-FREIs as isolating devices, as confirmed by extensive research [
11], the next step could be their use in real applications. For these applications, specific standards for the use of U-FREIs are not currently available yet, but there are regulations in different countries regarding the use of isolation systems. Reference to these regulations may be made for using U-FREIs in real applications. In Europe, two standards must be considered: UNI EN 1337-3 [
33] and UNI EN 15129 [
34].
UNI EN 1337-3 [
33] applies to elastomeric bearings with or without complementary bearing devices, such as flat sliding elements or a sliding surface, as used in bridge structures or any other structure with comparable support conditions. According to this standard, bearings do not need to be connected to the sub-and superstructures, and, to maintain their position, they can resist through friction.
UNI EN 1337-3 specifies that in the case of structures subjected to dynamic stresses with possible extreme fluctuations in the load, for example, railway bridges and anti-seismic structures, the friction shall be assumed to be equal to zero. In these cases, the standard specifies that it is mandatory to use fastening devices able to resist the maximum horizontal force acting on the bearing. In particular, UNI EN 1337-3 requires that the fastening devices limit the movement between the structure and the supporting surfaces to within 5 mm or less. Moreover, the devices must be such that the support can be removed with the structure raised by no more than 10 mm, unless otherwise agreed upon with the designer of the structure.
UNI EN 15129 [
34] covers the design of devices that are provided in structures with the aim of modifying their response to seismic action. It states that all types of isolators shall be attached to the structure by mechanical anchorages only, and at least 75% of the horizontal load shall be supported by the anchorage, unless the minimum vertical load on the isolators during seismic action has been determined by dynamic analysis.
According to the two above-mentioned standards, U-FREIs, for their utilization, should have a constraint system against at least horizontal forces, thus becoming Horizontal Sliding Constrained FREIs (HSC-FREIs).
4. Investigated Constraint System
In the case of U-FREIs, transfer of the seismic horizontal force from the superstructure to the sub-structure occurs thanks to the friction present at the isolator contact surfaces. Since U-FREIs undergo roll-over deformation, the contact areas decrease with increases in the superstructure displacement (
Figure 2b). Moreover, the axial load acting on the isolator varies during earthquake events, depending on the position of the isolator in the plane and on the direction of the seismic action. The friction coefficient, which depends on the materials of the contact surfaces, and the axial load determine the maximum horizontal force that can be transferred by the isolator.
When this force is reached, the isolator shear strain does not increase anymore, and the isolator starts to slide with respect to the contact surfaces. Consequently, the transferred horizontal force decreases to smaller values. To prevent the isolator from sliding and to take account of the guidelines of UNI EN 1337-3 [
34], a constraint system at least against horizontal forces is required.
Considering the peculiar behavior of U-FREIs, the constraint system should allow the upper and lower surfaces of the isolator to detach from the supports and the lateral surfaces to tilt and lean on them in a similar way to what happens in the absence of constraints. This to avoid the occurrence of additional stresses in the isolator and to maintain decreases in the horizontal stiffness with increases in the isolator deformation. Moreover, the constraint system should not preclude the return of the isolator to its initial configuration at the end of the seismic event. Finally, the device used to realize the constraint system should withstand the seismic actions for which the isolator is designed and allow their transfer to the contact surfaces.
Some research works already exist on Partially Bonded FREIs (PB-FREIs) [
35,
36,
37,
38,
39], and bonded [
40] or restrained FREIs [
41]. In a PB-FREI, two thick steel mounting plates were bonded to portions of the outer surfaces at the top and bottom of the isolator. The mounting plates were then bolted to the top and bottom contact supports of the isolator. Thus, the vertical lift and horizontal sliding of the PB-FREIs were restrained.
In this research work, a different system, restraining only the horizontal sliding of FREIs, is investigated. The constraint to up-lift is not considered herein, because this event is limited generally to isolated tall buildings [
42], isolated buildings with vertical setbacks [
43], and short piers of isolated bridges with piers of different lengths [
44]. In low/medium-rise isolated buildings, this phenomenon usually does not occur or can occur only for a very short time in the accelerogram time history. Moreover, this solution, in comparison with the partial bonding, produces negligible detachment traction between elastomeric layers and fibers. The main criterion used to select the constraint device was to choose a device which is able to maintain these advantages, restraining at the same time the horizontal sliding.
In this research work, attention has been concentrated on reclosable hook and loop fastening systems, similar to the Velcro
® system, as possible devices for the constraint system. Velcro
® devices (Headquarters, UK) consist of two elements covered with protrusions that interact and fit together with those of the opposite surface, forming a union that can be assembled and disassembled multiple times. Regarding the mechanical characteristics of this system, results from load tests in different material configurations are reported in [
45]. It is shown that Velcro
®’s strength does not undergo significant decreases after repeated use. Based on this observation, a device that fulfills the operating principle of hook and loop fastening but with superior strength to Velcro
®, suitable for applications in the construction sector, was, therefore, sought. The found device is called Metaklett
®, from the German Metall (Finnentrop, Germany), “metal”, and klettband, Velcro
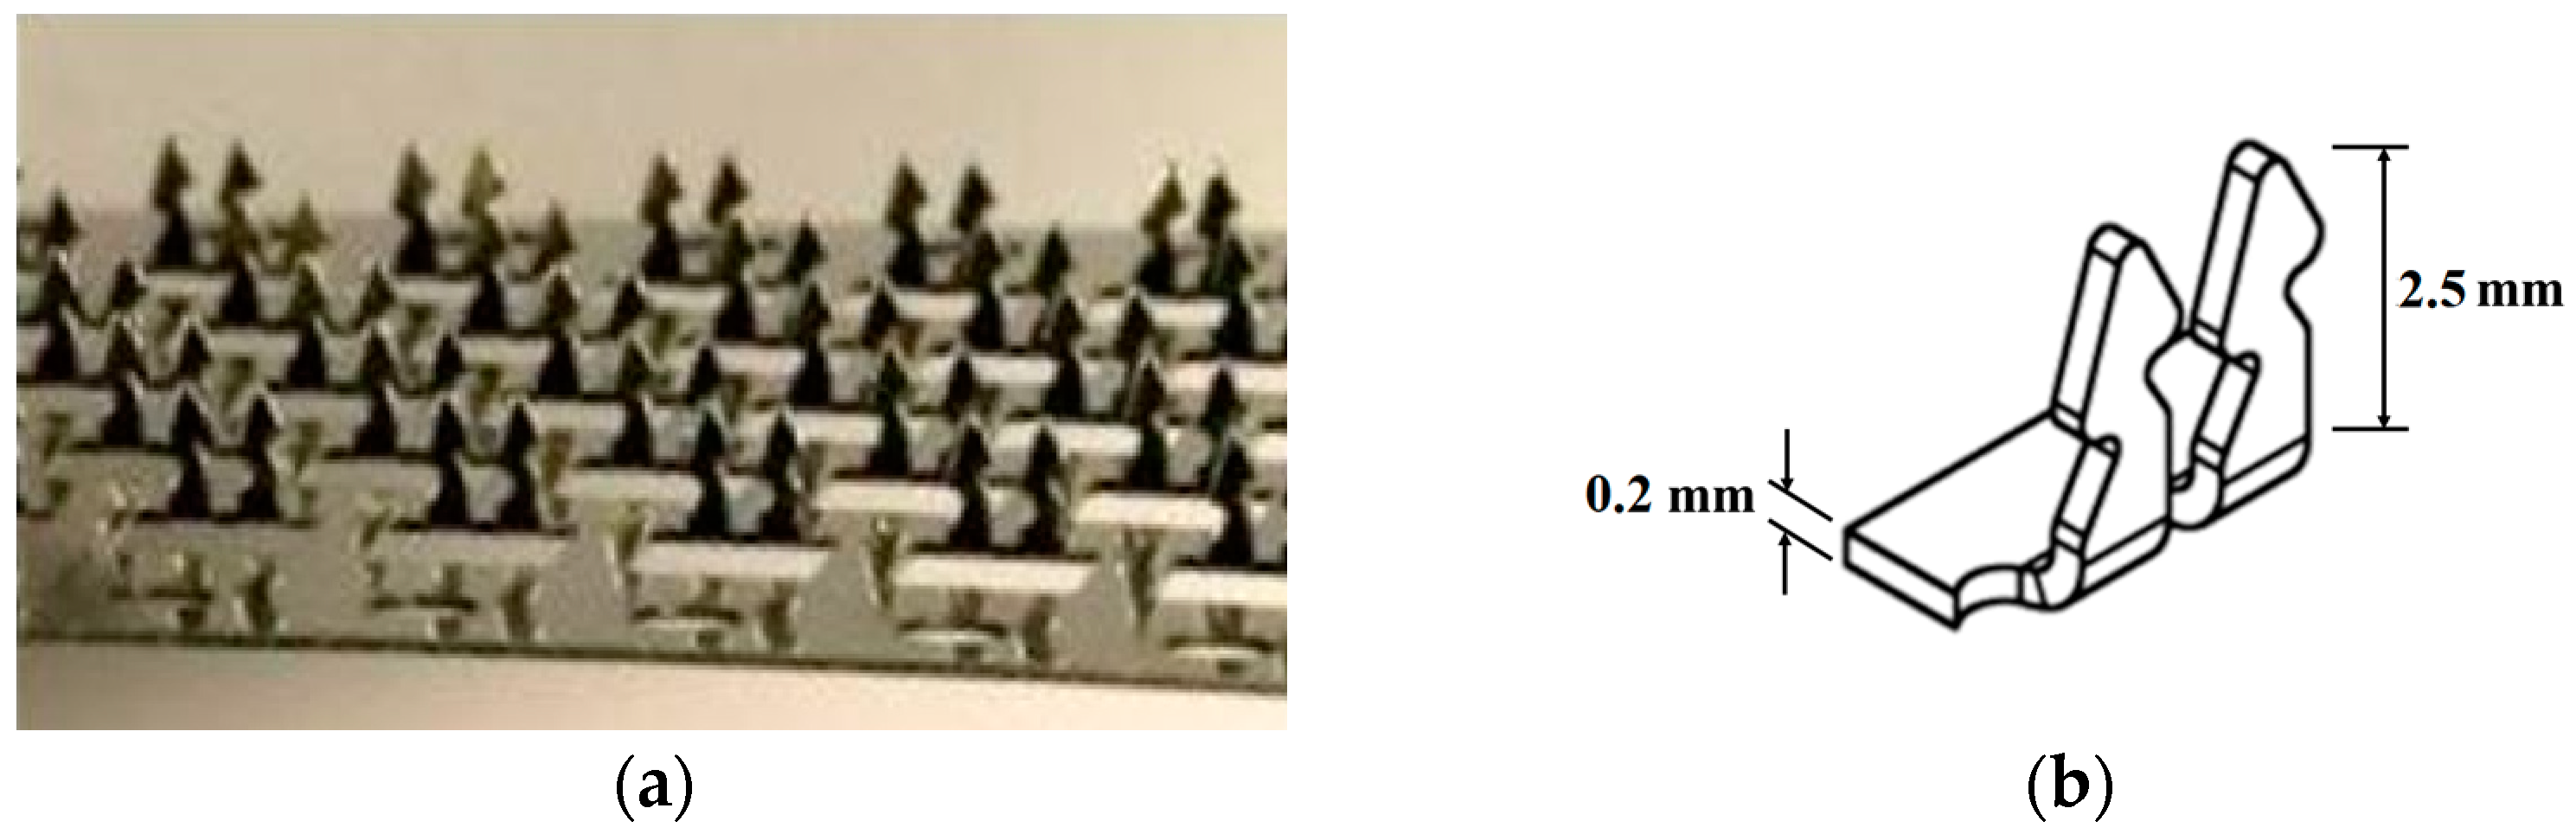
® strip. It is a metal fastening that combines the advantages of the rapid assembly–disassembly characteristic of hook and loop fasteners, with the performance characteristics of metal, such as high mechanical strength and resistance to high temperatures and acids. This device is made out of austenitic stainless-steel strips 30 mm wide and 0.2 mm thick, classified as 1.430 according to the German standard DIN 10088 [
46], and it is produced in strips. There are different variants of the device, among which the one with “duck head” hooks (entenkopf) has been considered in this research. The strip with duck head hooks, which are 2.5 mm long, is shown in
Figure 3a. From the sketch in
Figure 3b, it is clear that the hooks have greater stiffness and flexural strength in one direction, along the longitudinal axis of the strip, while they have minor ones in the orthogonal direction.
For the application presented herein, the strip with loops fitting the strip with hooks shown in
Figure 3 is not necessary, because it is proposed that the elastomeric isolator is directly fixed to the latter. In particular, the isolator is fixed to the strips with hooks shown in
Figure 3 by means of penetration of the hooks in the upper and lower external elastomer layers in contact with the strips. The strips with hooks, in turn, are glued to the supports, as shown in the following. It is expected that the penetration of the hooks in the external elastomer layers will help in preventing the isolator horizontal sliding under shear load in the presence of low vertical compression stresses.
5. Test Specimens
The test specimens were built by ILPEA Industries, Italy. They are made out of layers of elastomer material alternating with reinforcement elements consisting of sheets of carbon fiber fabrics.
As an elastomer material, two different types of rubber were used to make the isolators: low-damping neoprene (ldn) with Shore A, durometer hardness of 60 ± 5, and G = 1.15 MPa, and high-damping natural rubber (hdnr) with Shore A, Durometer hardness of 54.5 ± 5, and shear modulus G = 0.8 MPa. As reinforcement, two types of fabrics were used: a bi-directional (bd) fabric and a quadri-directional (qd) one. The bd fabric had fibers along two principal directions, at 0° and 90°, and the qd fabric had them in four directions, at 0°, 45°, 90°, and 135°. The superficial density was 200 g/m2 for the bd fabric and 380 g/m2 for the qd fabric, and the thicknesses were 0.112 mm and 0.212 mm, respectively. The Young’s modulus was 230,000 MPa, and the ultimate fabric strength was 3500 MPa for both fabrics.
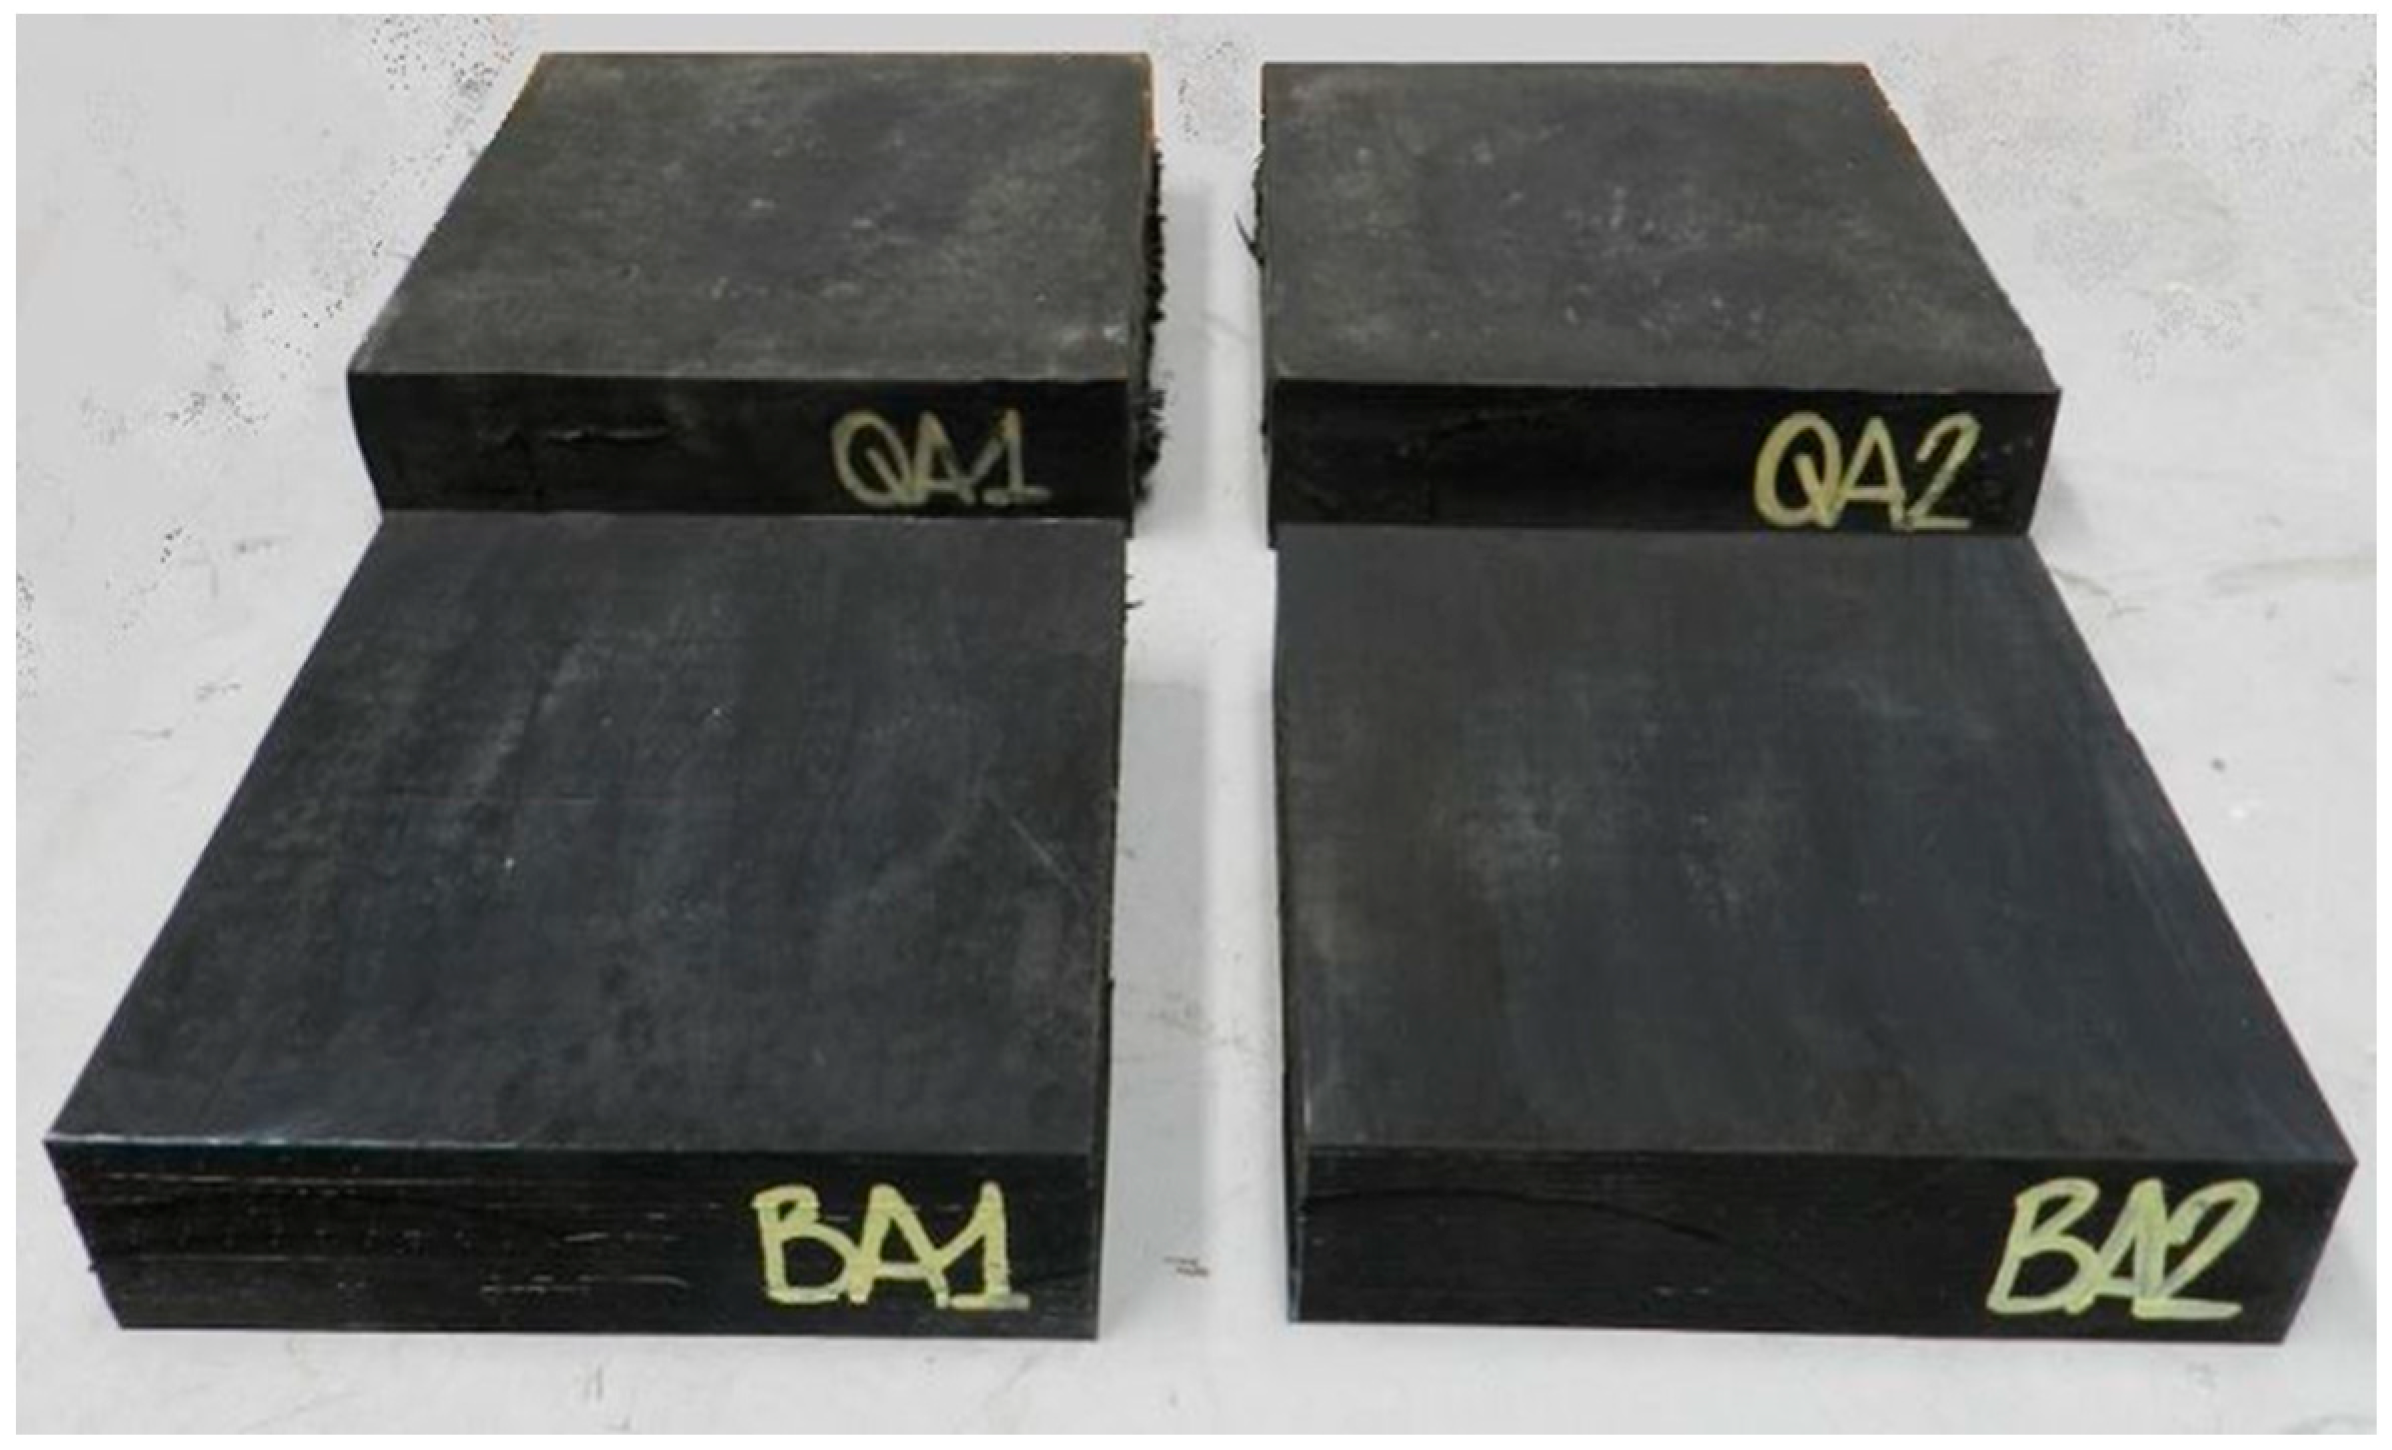
Four square-shaped isolators, in identical pairs (
Figure 4), were built and subjected to testing.
The isolator name, elastomer, fabric type, side length
l, single-rubber-layer thickness
t, number of elastomer layers
n, total thickness of the elastomer layers
te, total thickness
H, and shape factor
S (given by the ratio between the loaded and the free areas of a single rubber layer, i.e.,
), are reported in
Table 1.
Specimens Q1 and Q2 had an elastomer layer with a thickness of 5 mm coating all the lateral (unloaded) surfaces, while specimens B1 and B2 did not have this layer. All specimens had already been tested 7 years before the test campaign carried out for this research. Q1 and Q2 maintained their original geometry, while specimens B1 and B2 were cut all around, and their base side length was reduced from 240 mm to 210 mm to eliminate the lateral coating layer and to see the layers of fibers on the isolator lateral surfaces during the tests.
Constraint System Configuration
The constraint system should guarantee the transfer of at least horizontal forces, but it should also allow the roll-over deformation of the fiber-reinforced isolator, i.e., the detachment of the isolator ends. The last requirement can be fulfilled through a constraint that does not involve the entire isolator contact surface. The realization of a partial constraint was, therefore, sought.
By considering U-FREIs under roll-over deformation, the length of the isolator portion detaching from the contact surface depends on the applied displacement [
39]. By neglecting the isolator vertical deformation due to the compression force, it can be assumed that the detaching length is equal to the applied displacement. Therefore, to allow the isolator to roll over in all directions of the seismic motion, the constraint device should be placed in the central portion of the isolator and should extend for a length equal to
where
is the length of the constraint device, l is the isolator dimension in the considered direction, and
is the isolator maximum design displacement. Depending on the isolator base shape, rectangular or circular, the constraint device will also have a rectangular or circular shape, respectively. Thus,
represents the rectangle side length or the circle diameter, respectively.
Since the specimens during the test campaign were subjected to a displacement equal to the overall elastomer height, according to Equation (1), the side length of the constraint system had to be lower than (210 − 2 × 50) = 110 mm for specimens B and (240 − 2 × 50) = 140 mm for specimens Q.
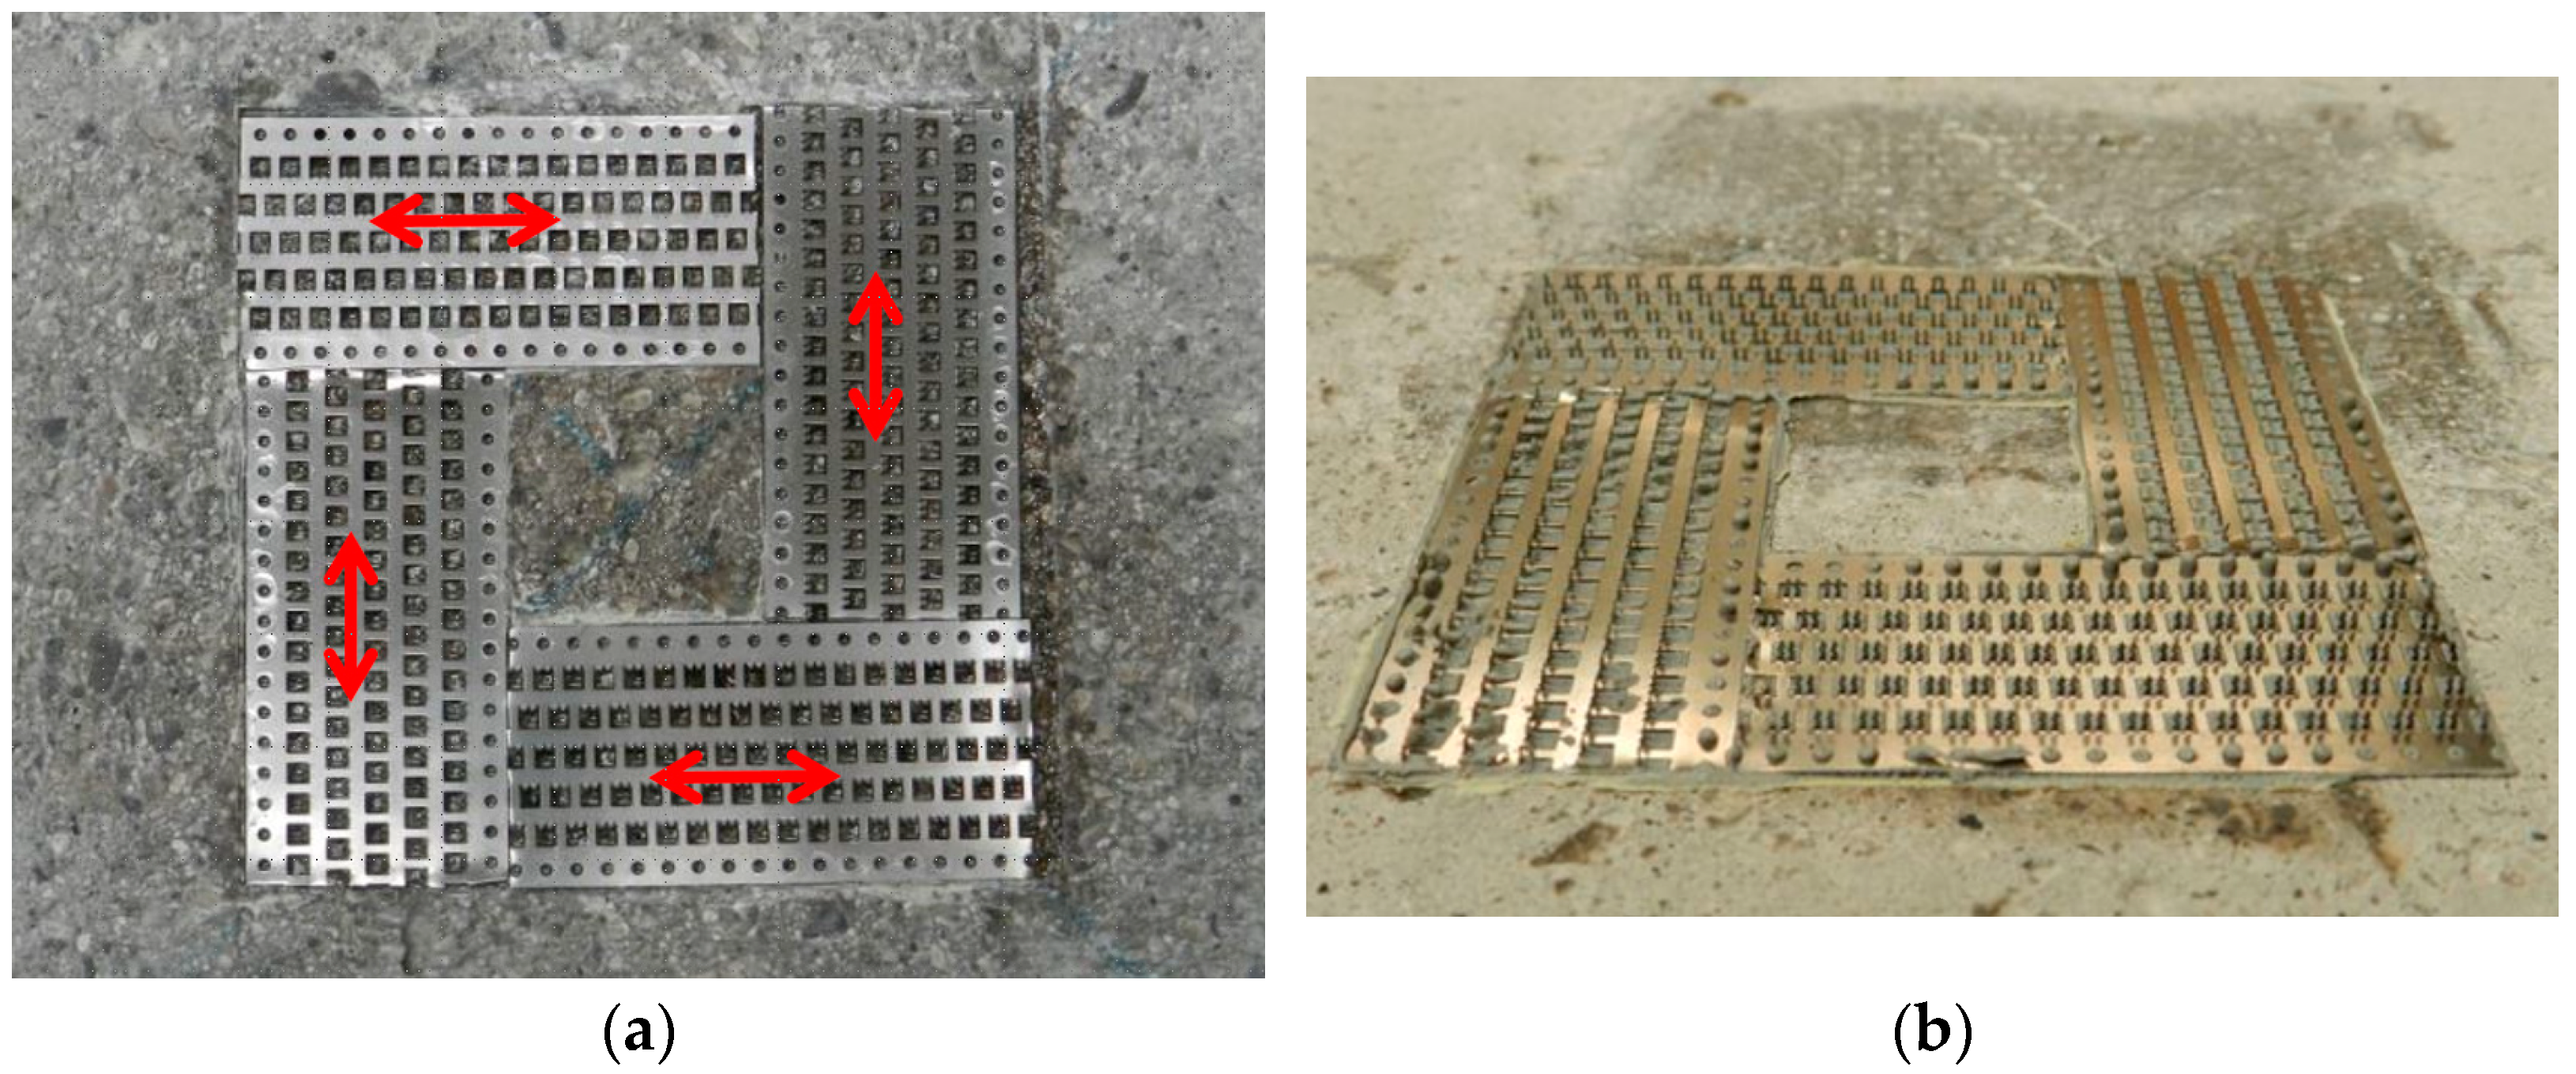
Taking into account the constraint device used (
Figure 3), the configuration chosen for the constraint system is shown in
Figure 5a, with a side length of 90 mm and an empty square space in the center. This length satisfies the previous limits for both specimen types. Considering that the hooks have greater stiffness and flexural strength along the strip longitudinal direction, the arrangement of the metal strips was defined with the aim of ensuring the same stiffness and strength along the two main directions of the isolator, as it should be for the isolator in real applications. For this reason, two strips were oriented in one direction, and the other two in the orthogonal direction. The red arrows in
Figure 5a indicate the direction of the hooks’ greater strength. It is expected that the acting shear force will be distributed according to the hooks’ horizontal stiffness; hence, the hooks having maximum strength along the loading direction will bear the greater part of it.
A two-component thixotropic epoxy resin with a pasty consistency was chosen to bond the constraint system to the concrete blocks (
Figure 5b). In the application of the resin, attention was paid to avoid the formation of cavities between the metal strips and the concrete surface and to prevent excess resin from emerging through the holes and enveloping the individual metal hooks.
6. Test Setup and Instrumentation
All of the tests were performed in the laboratory for tests on materials and structures at the University of Udine. The specimens were tested to assess the suitability of the studied device to simultaneously counteract the sliding of the UFREIs without modifying the isolator mechanical behavior.
Two typical tests were performed: simple compression and combined compression and shear (the latter is simply called the shear test hereafter). Both of them were carried out with and without the constraint device to evaluate whether and/or how the isolator behavior was influenced by the device.
6.1. Compression Test Setup
Figure 6a shows a general view of the compression test setup, for which a 500 kN MTS machine was used. The specimens were placed between two concrete blocks (300 × 300 × 150 mm), which reproduced the sub- and the superstructures. Between the steel plates in contact with the machine actuators and the concrete blocks, a linoleum sheet was inserted for a better adaptation of the steel plates to the irregularities of the concrete surfaces. Four inductive transducers were vertically positioned on the lateral surfaces of the concrete blocks (
Figure 4) in symmetric positions. They allowed for measuring the vertical (axial) shortening of the specimens, evaluated as the average of the four transducers’ readings.
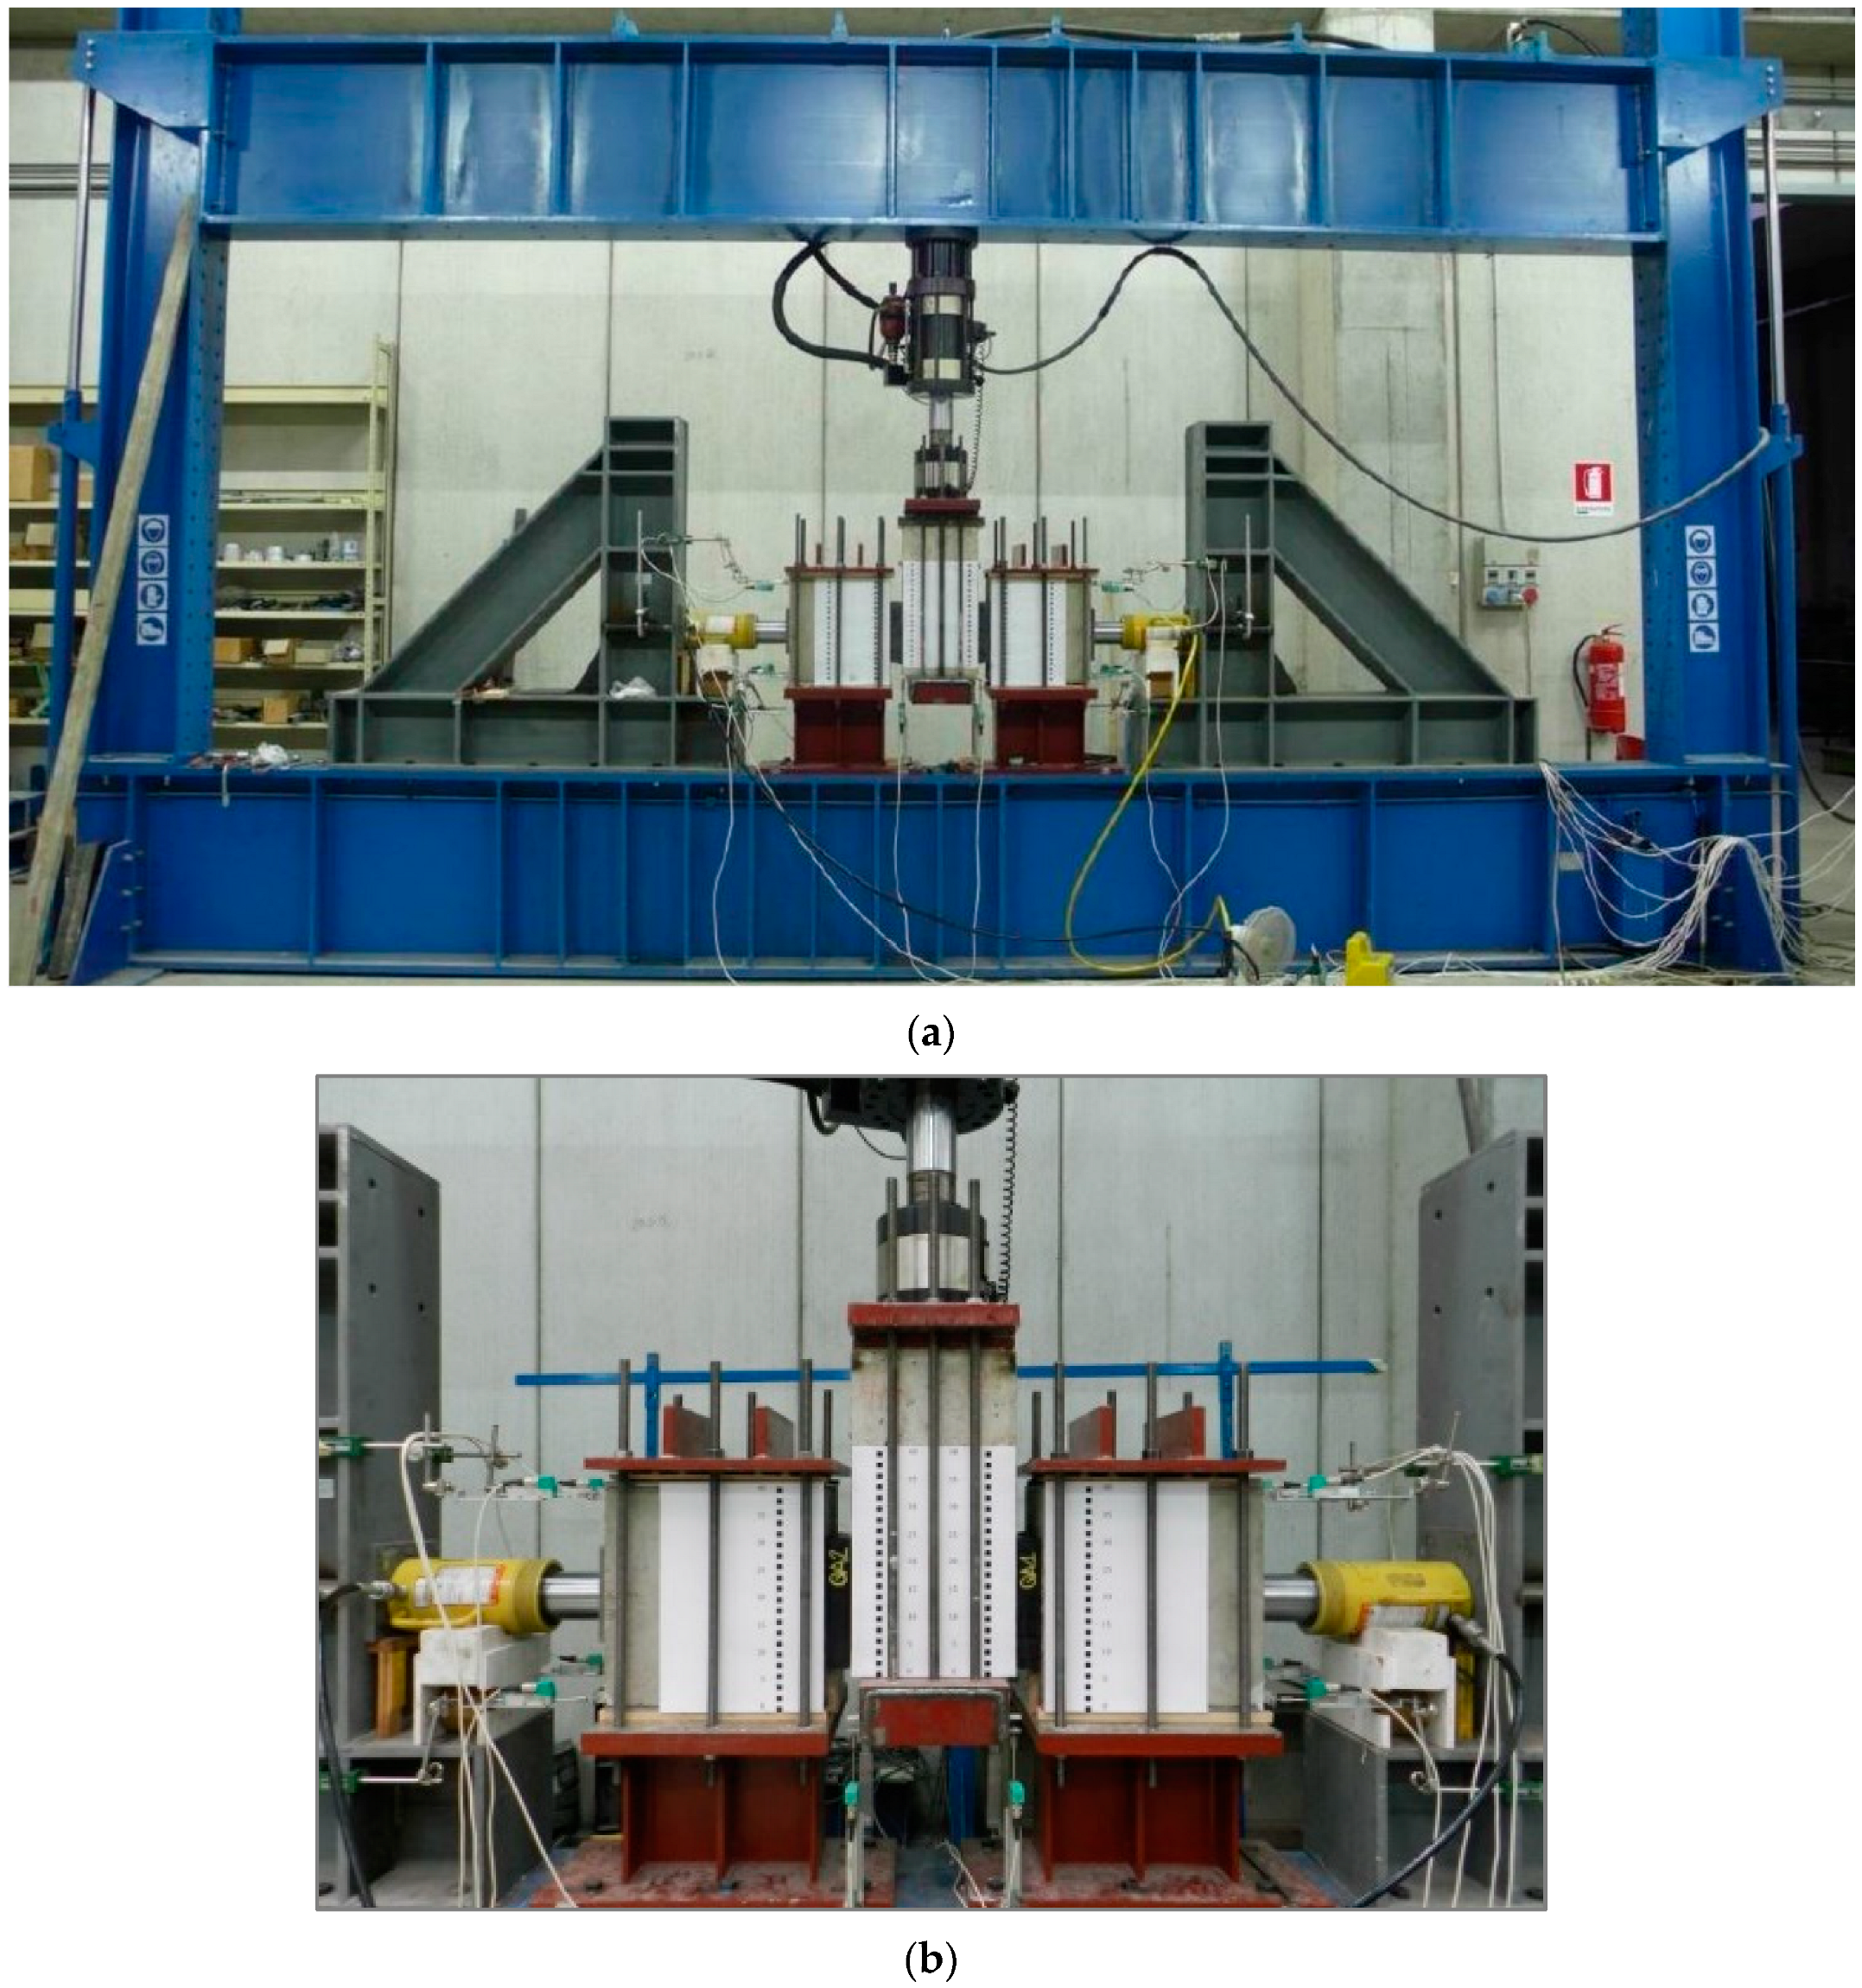
6.2. Shear Test Setup
Figure 7a shows a general view of the shear test setup. Note that, in this case, to obtain a symmetrical setup, two identical specimens were vertically oriented and subjected to tests at the same time (
Figure 7b). Each specimen was positioned in contact with the central concrete block and one of the lateral blocks, shown in
Figure 7, to simulate their placement between the sub- and superstructures.
Compressive force was applied to the isolators using two horizontal hydraulic jacks acting on the two lateral concrete blocks. These blocks were placed upon steel rollers to leave them free to move horizontally under the force applied by the hydraulic jacks. These latter operated in load control to maintain the average compressive stress at a constant value.
Shear displacements were applied to the specimens using the central concrete block, which was connected to a vertical 300 kN INSTRON hydraulic actuator (Instron, Norwood, MA, USA). The vertical actuator operated under displacement control (the corresponding force was continuously recorded). Clearly, the shear force acting on each isolator was obtained by halving the force applied by the actuator. Four potentiometric displacement transducers were vertically positioned at the corners of the bottom face of the concrete central block to record the vertical displacements.
Two sheet papers with graduated scale were glued on the front surface of the lateral blocks to aid in the immediate visual observation of the test evolution and in the detection of any possible relative displacement between the blocks and the isolators (
Figure 7b).
For the tests on the U-FREIs, the concrete blocks were preliminarily roughened and cleaned to assure adequate adhesion conditions. After each test, the block surfaces on contact with the isolators were cleaned to ensure the same adhesion conditions for all tests.
For the tests on HSC-FREIs, the concrete blocks were provided by the constraint system shown in
Figure 5.
7. Test Program
7.1. Compression Test (CT)
Three cycles of compression loading–unloading were performed for each specimen with a 0.01 mm/s loading rate. The maximum value of compressive stress for each cycle was equal to 6 MPa.
The parameter used to make the comparison among the compression tests was the compression stiffness, K
V, calculated with the following formula [
35]:
where P
max and
are the maximum axial force applied and the corresponding axial displacement, respectively, and
is the displacement corresponding to one-third of the maximum axial force. The considered displacements are measured at the first load cycle.
7.2. Shear Test (ST)
The shear tests were performed in the following order:
- -
Bond test;
- -
Quasi-static shear test;
- -
Dynamic shear test.
The bond test was performed under a monodirectional load, while the quasi-static and dynamic tests were of the cyclic type.
Both the quasi-static and dynamic tests were performed by first subjecting the specimens to an average compressive stress equal to 6 MPa, applied using the horizontal yellow jacks in
Figure 7, and then to shear deformation, applied by the vertical Instron actuator under displacement control.
7.2.1. Bond Test
The bond test consisted of applying increasing shear strains up to a value of to the specimens, and then unloading. The test was repeated for different values of compression stresses: 6 MPa, 3 MPa, 1 MPa, 0.5 MPa, 0.375 MPa, and 0.25 MPa. The test was used to evaluate for which compression stress values isolator sliding instability occurred. This type of failure involves uncontrolled sliding of the isolator during lateral loading. It can be recognized from the force–displacement curves, which, in the presence of sliding instability, present a zero or negative slope beyond a certain displacement value.
7.2.2. Quasi-Static Shear Test
The quasi-static shear test consisted of three loading–unloading cycles up to a shear strain (
equal to 1, at a loading rate of 0.4 mm/s. This test was used to evaluate the isolator static secant stiffness, K
sec, calculated from the third cycle by means of the following formula [
34]:
where
and
are the forces corresponding to the relative displacement between the isolator contact surfaces, equal to 0.58 t
e and 0.27 t
e, respectively.
7.2.3. Dynamic Shear Test
The dynamic shear test consisted of three reversal loading cycles of the sinusoidal type with a maximum shear strain equal to
and a loading rate equal to 70 mm/s (0.35 Hz). This test was used to evaluate the isolator dynamic stiffness, K
b, and the equivalent viscous damping ratio,
, calculated from the third cycle by means of the following formulae, respectively [
35]:
where
and
are the maximum and minimum values of displacement in the third cycle,
and
are the values of force at these displacements, respectively, and H is the area of the hysteresis loop at the third cycle.
7.3. Chronological Order of Tests
All of the specimens were subjected to the compression test (CT) and shear tests (ST). The tests were carried out first without and then with the constraint system.
Table 2 reports the list of the tests carried out, where the increasing Roman numbers denote the test chronological order, and the number after the name of the test has the following meaning: 0 for no constraint, 1 for constraint only on one isolator contact surface, and 2 for constraints on both the contact surfaces.
Specimens Q1 and Q2 were damaged after tests ST-1 of the bond type, so they were not subjected to the last tests.
8. Test Results and Observations
8.1. Compression Test Results
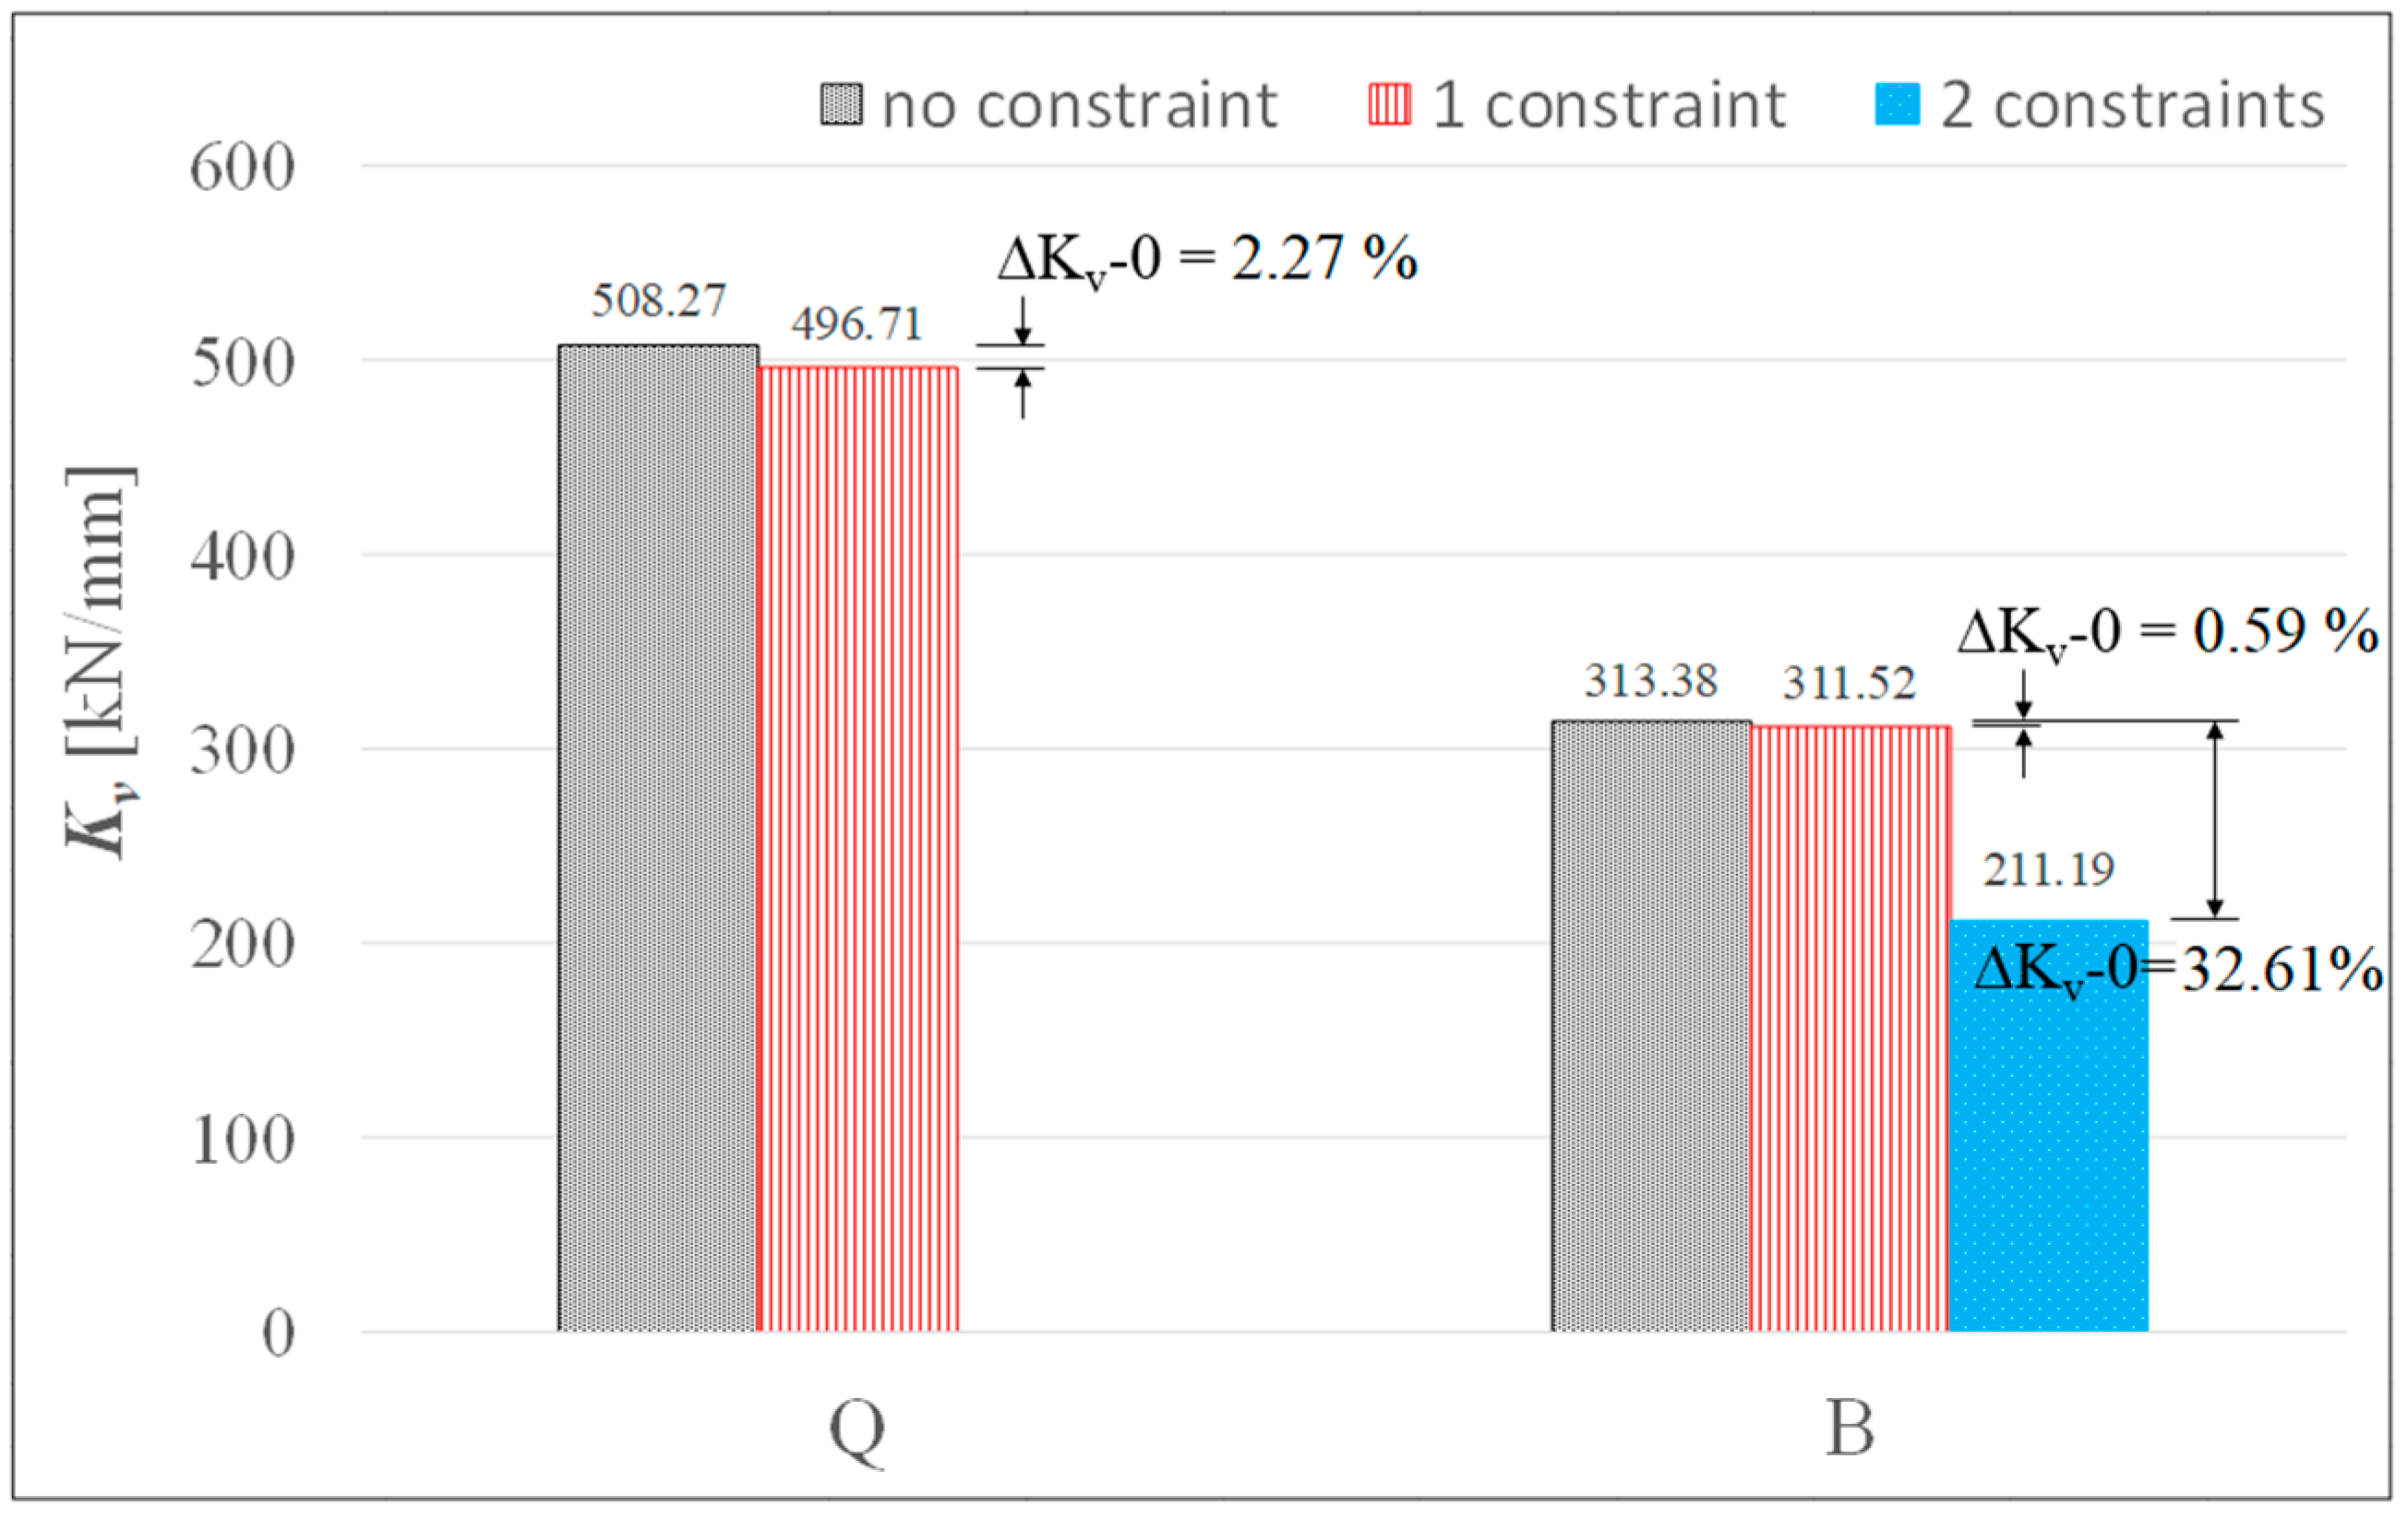
Figure 8 and
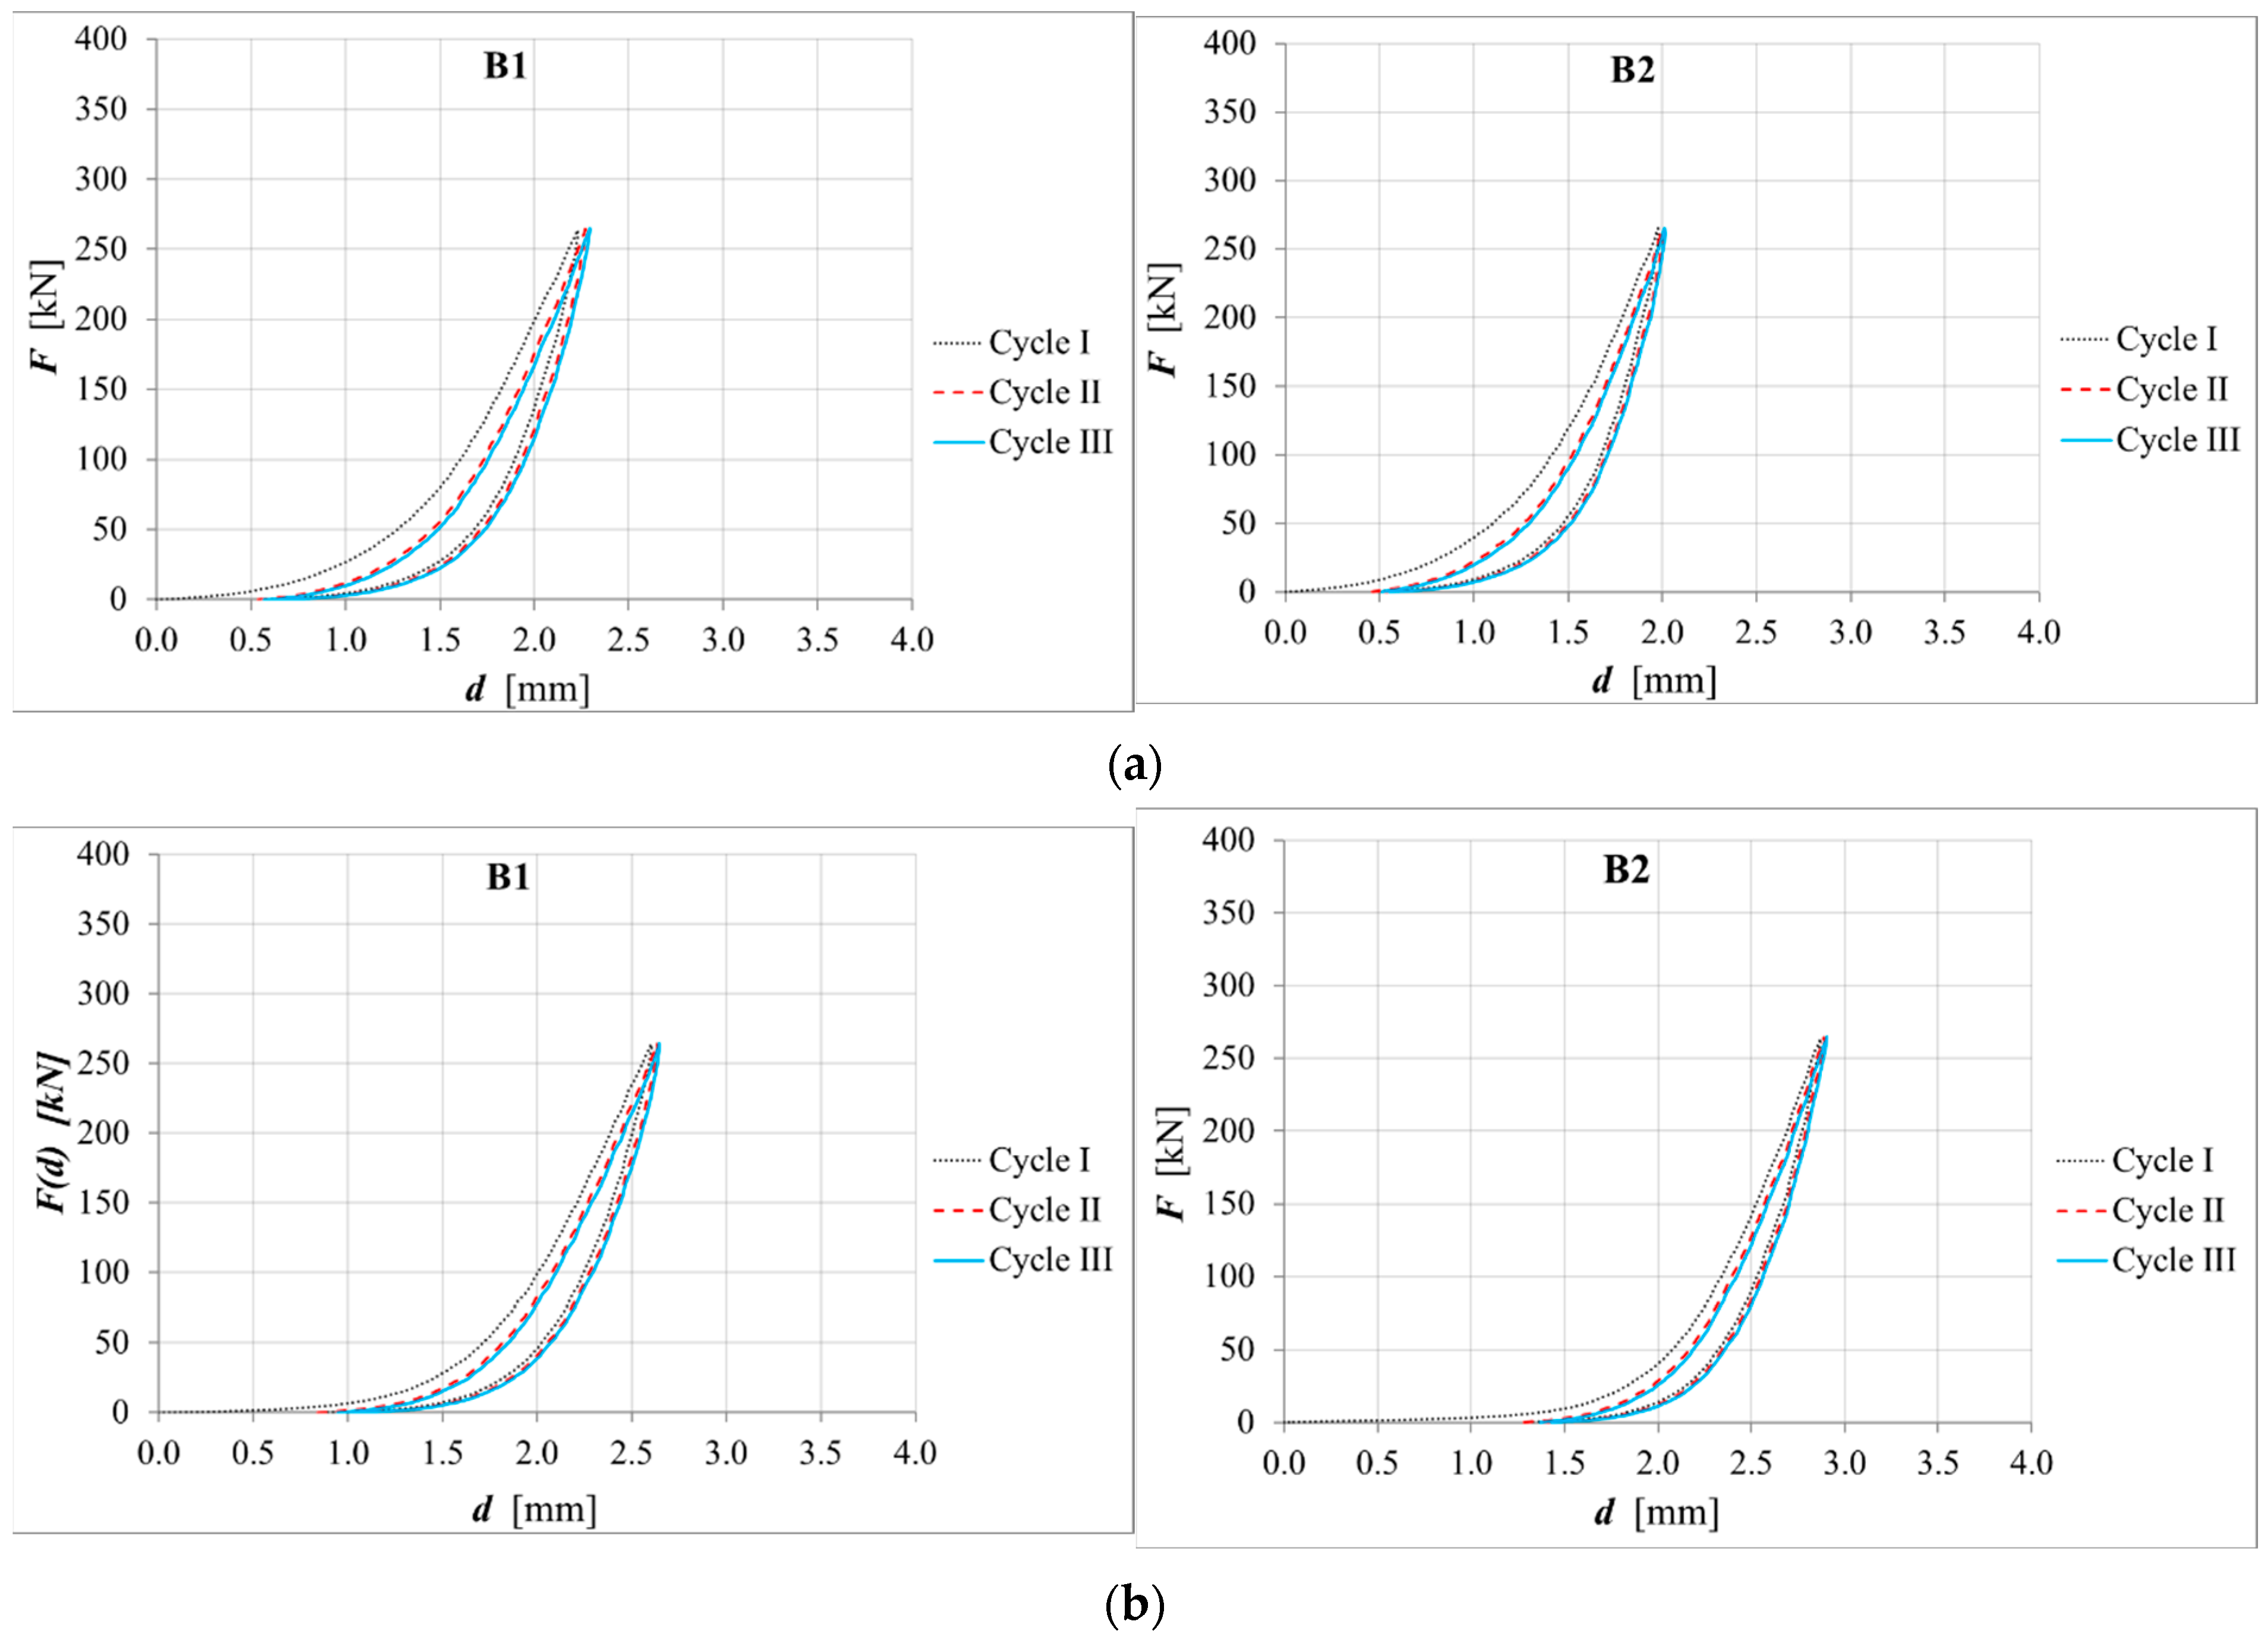
Figure 9 show the load–displacement curves of all the performed compression tests. In all cases, it can be observed that the loading path presents a low slope in the first part, which corresponds to high deformability, with a high slope (low deformability) in the second one. This is because the carbon fiber fabrics were not pre-tensioned during the isolator production process. Hence, the fabrics need the elastomer to be deformed to be put under tension and to exert their containing action to elastomer deformations. This occurs in the first part of the loading path. After the fibers were put under tension, the slope of the loading path became steep.
At the end of every cycle, a residual displacement was observed due to the viscous–elastic properties of the elastomer. The residual displacement increased from the first to the second cycle, while it approximately stabilized at the third cycle, according to the Mullins effect [
47].
Table 3 reports the vertical stiffness values,
KV, calculated according to Equation (2) at each loading cycle for all of the tested specimens and configurations. In this table, the specimen’s name is followed by a dash and a number, where the number has the same meaning as in
Table 2.
Table 3 also reports the average of the
KV values obtained from identical specimens at the third cycle, and these values’ variations between the test configuration with one constraint and the configuration with no constraint (∆K
V-0), and between two constraints and one constraint (∆K
V-1).
Table 3 shows that the
KV values increased from the first cycle to the third. The explanation of this phenomenon lies in the fact that the containment action of the fibers is more effective starting from the second cycle. As with the presence of the residual displacement, the elastomer is already deformed; therefore, a shorter load path is sufficient to induce tension in the fibers. It can be said that the vertical stiffness of the isolator when the structure is progressively loaded by gravitational forces during its construction is that of the first cycle. When the structure is subjected to an earthquake, instead, the value more representative of the real isolator vertical stiffness is that of the third cycle, earthquakes being a cyclic action.
From
Table 3, it can be observed that, even if the isolators are identical in pairs, there are differences in the vertical stiffness. By considering the
KV values at the third cycle, the percentage difference between the identical specimens, calculated on the lower value, is between 3% and 12% when the configurations without constraints and with constraints on one contact surface are considered. These differences lie in a range that can be attributed to the isolator building process, because the fiber fabric pieces are cut and inserted into the mold by hand. Due to this, the isolators may exhibit little differences.
Considering the average vertical stiffness values calculated at the third cycle, it can be observed that the specimens with quadri-directional fabrics (Q) were vertically stiffer than the specimens with bi-directional fabrics (B) due to their higher shape factor (
Figure 10).
Considering the average KV values in the presence of the constraints, the following observations can be made:
- -
For both specimens Q and B, the presence of one constraint had negligible influence on the vertical stiffness; indeed, the KV percentage variations were lower than 3%.
- -
For specimens B, in the presence of two constraints, there were decreases in the stiffness by about 33% and 32% with respect to the cases without and with one constraint, respectively; however, in this case, the results were influenced by the damage induced in the specimens by the shear tests.
For greater clarity, these results are shown also in graph form in
Figure 10.
8.2. Shear Test Results
8.2.1. Bond Test
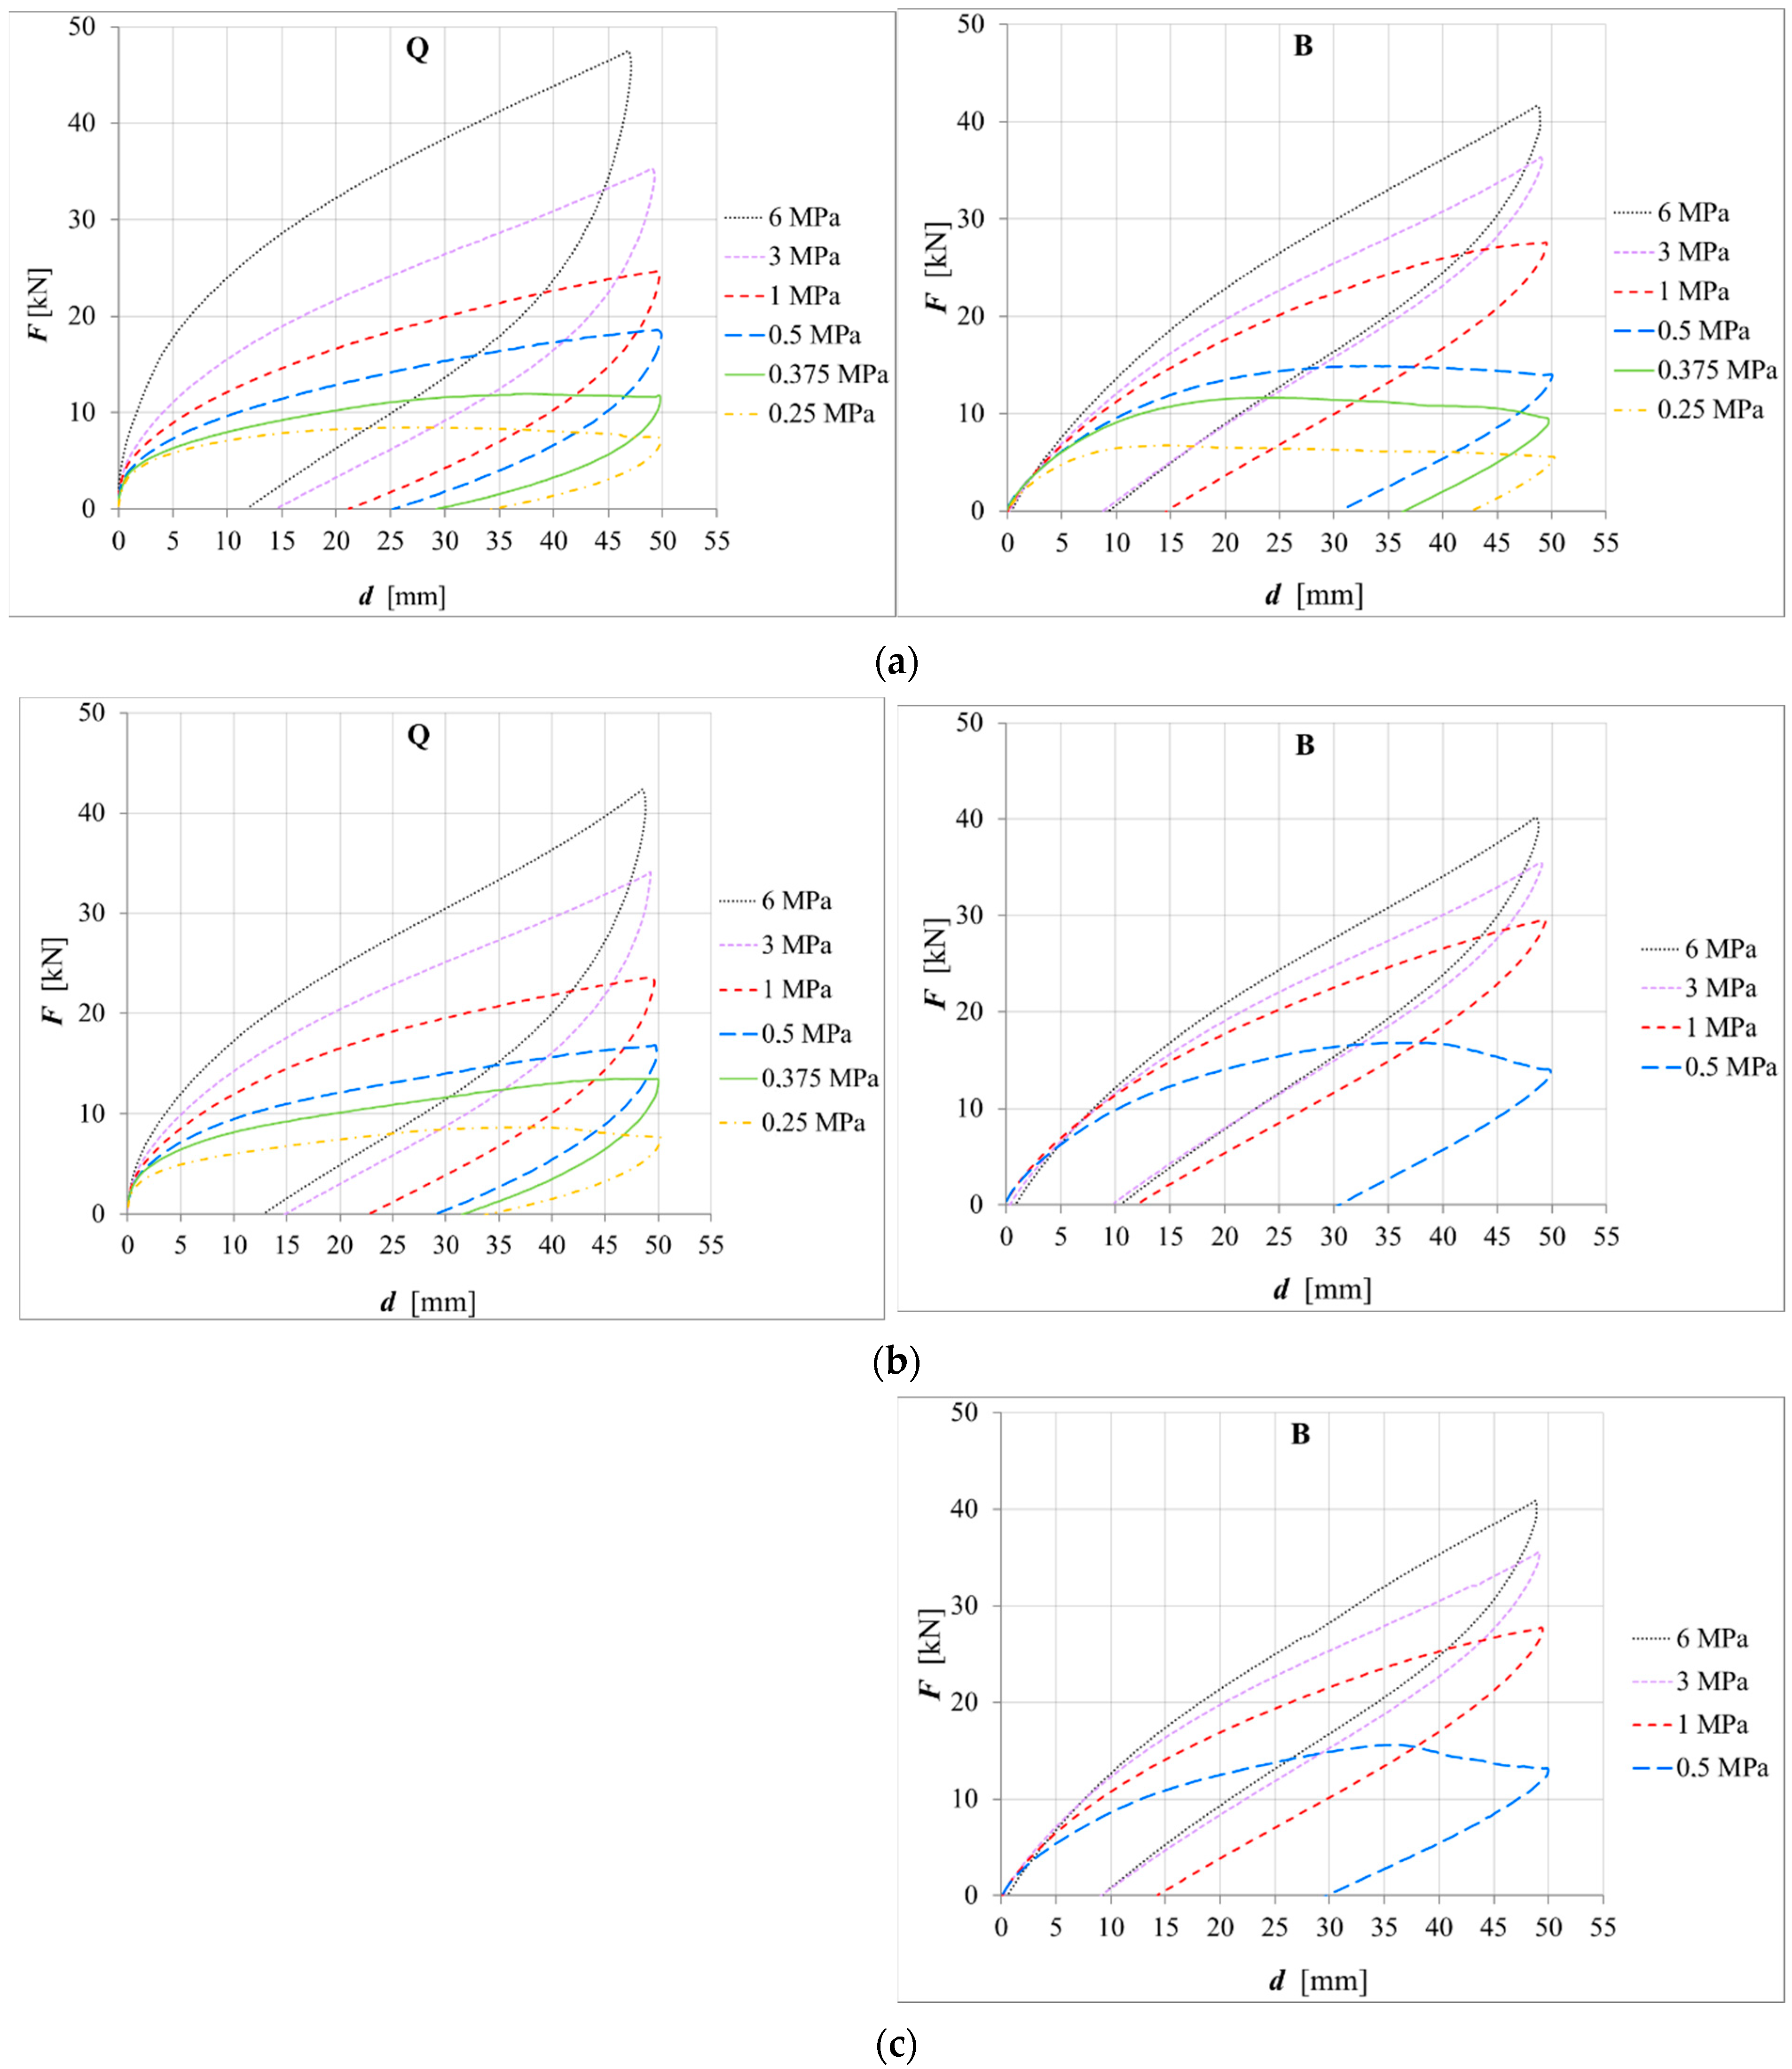
Figure 11 shows the load–displacement curves of all the performed bond tests. Each diagram reports the results relative to pairs of identical specimens according to the test setup (
Figure 7), where the force has been divided by two to represent the single isolator behavior. Hence, on the diagrams, the letter Q is reported for specimens Q1 and Q2, and the letter B for specimens B1 and B2. It is noted that the Q specimens were subjected only to tests without constraint and with constraint on one surface, because during the latter test, damages occurred in the elastomer and in the metal hooks. Although these damages also occurred in the B specimens during the test with one constraint, tests with two constraints were also carried out on these specimens. For the B specimens, the tests were performed until the compression stress of 0.5 MPa, at which point bond failure occurred.
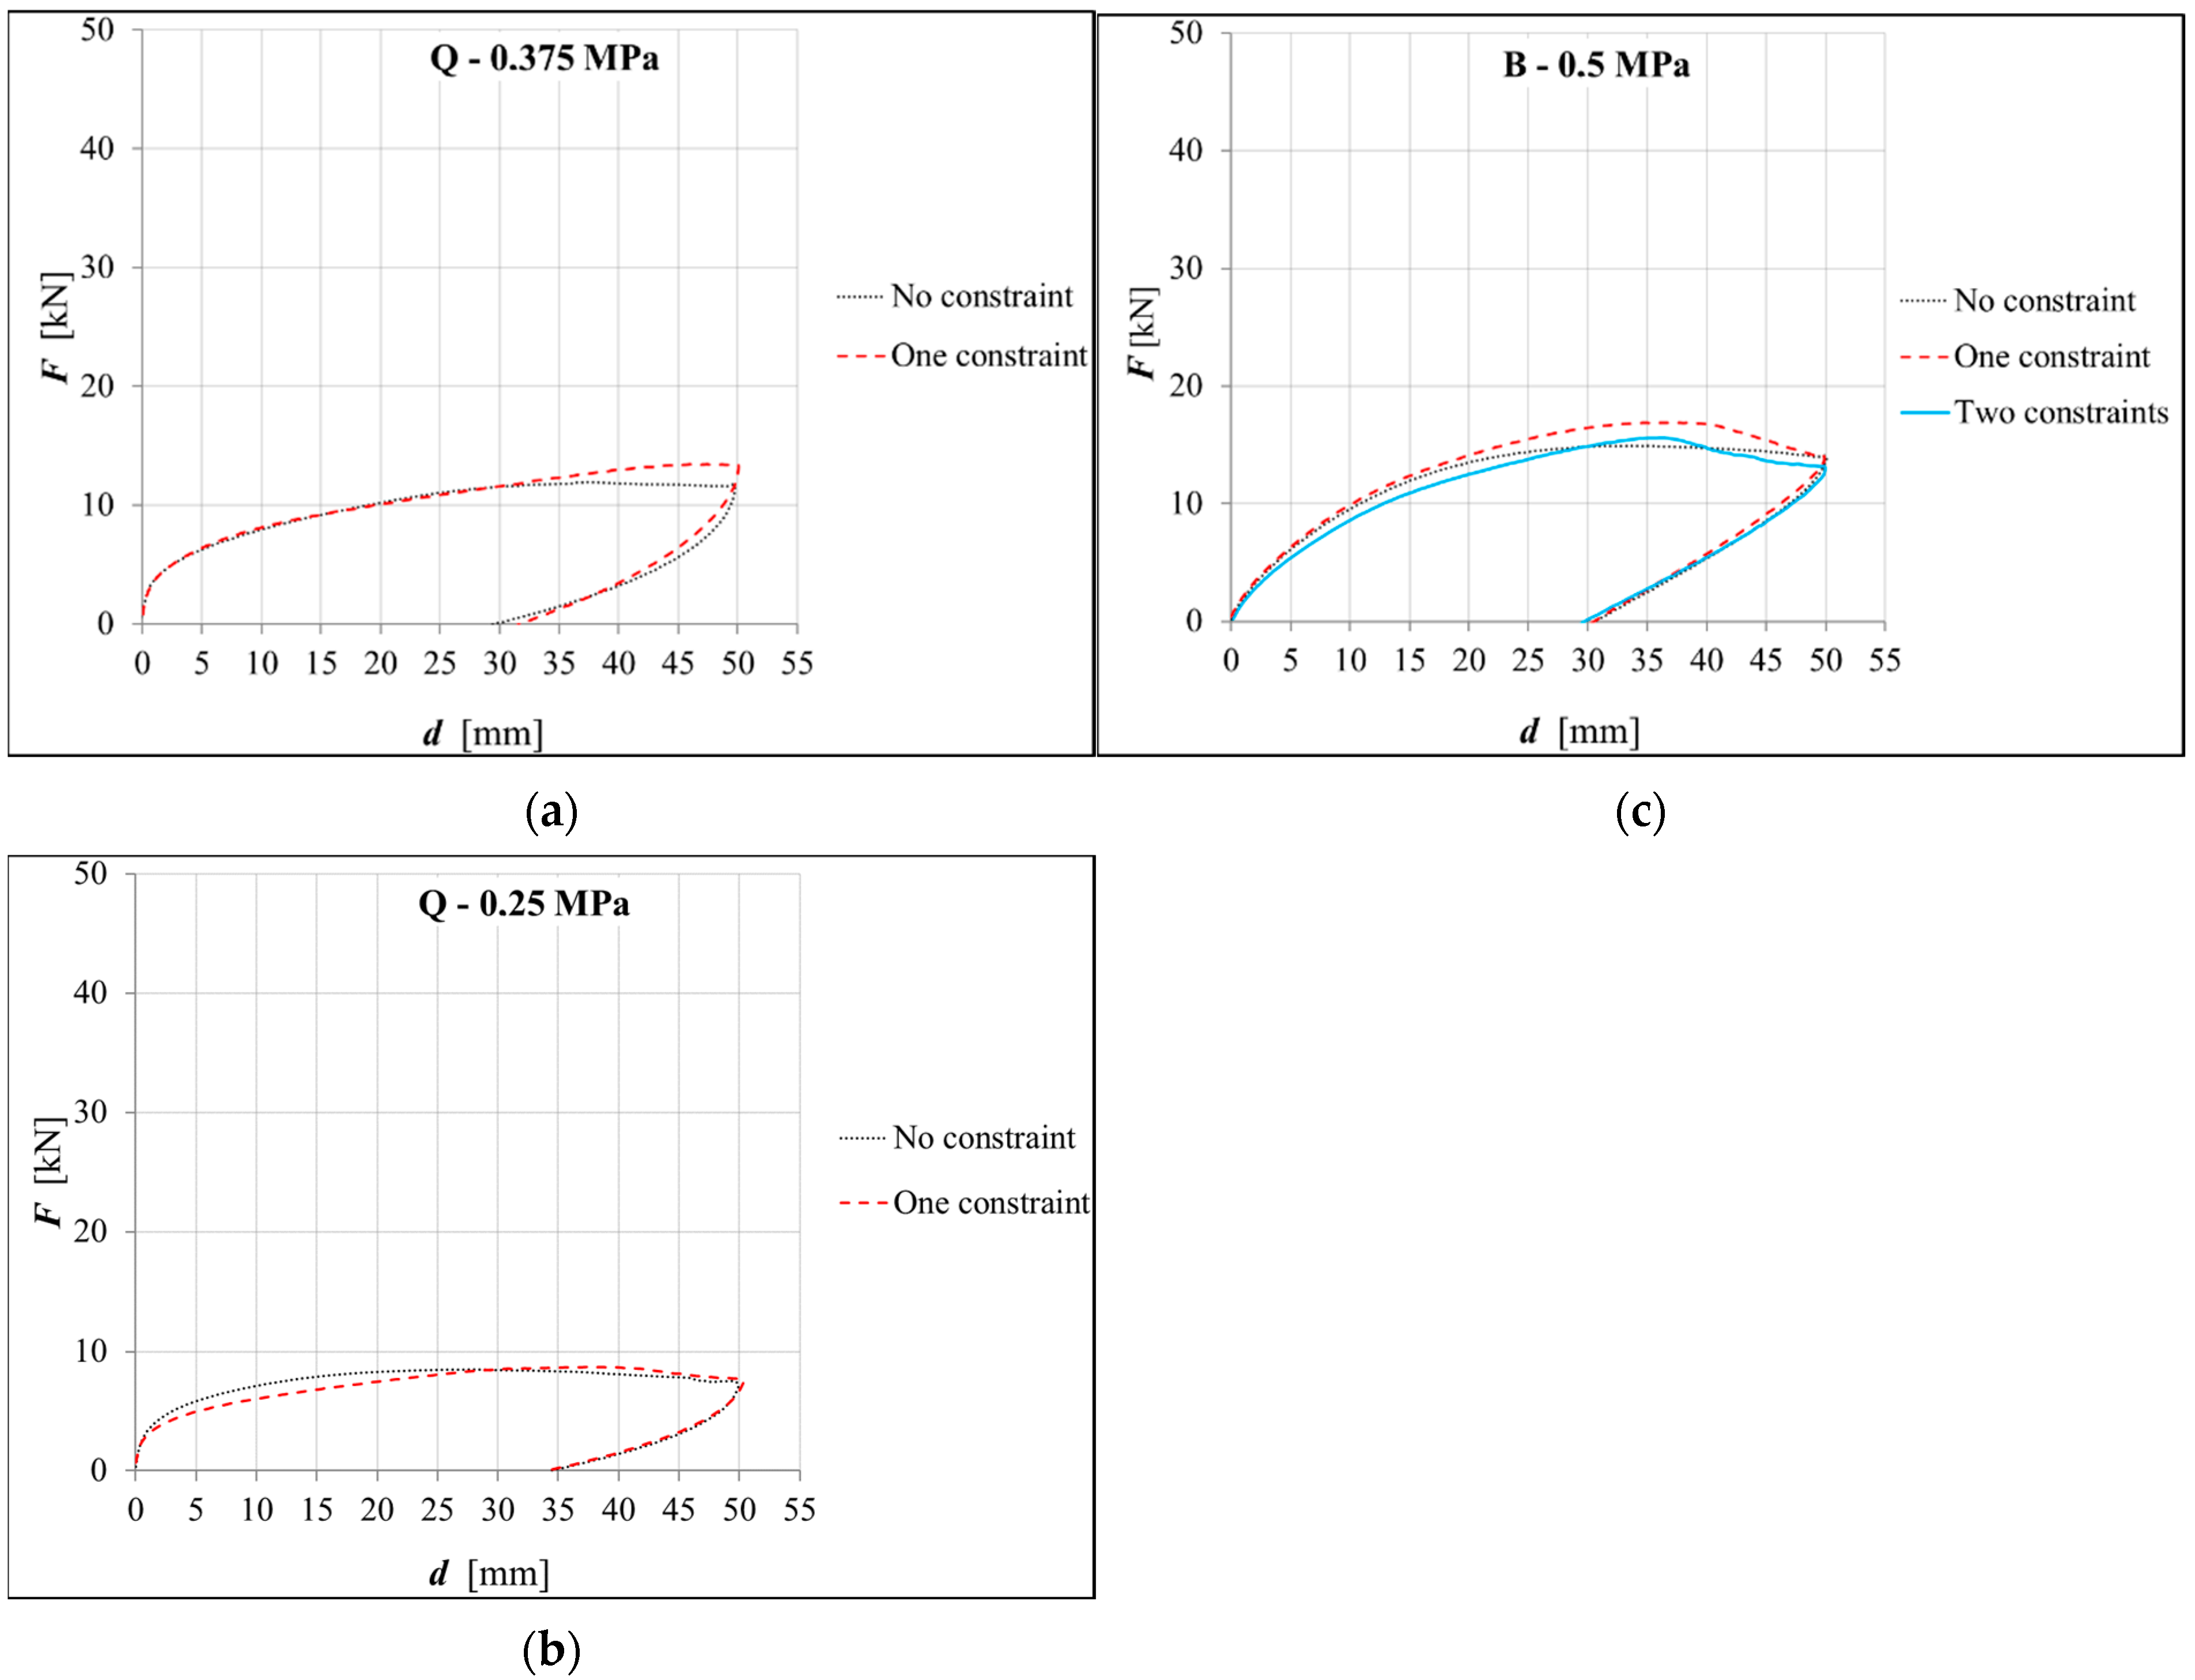
The isolator sliding instability due to bond failure occurs when the force–displacement curve reaches a maximum force and then shows a softening branch. For the Q specimens, in the case without constraints, this occurred at a compression stress of 0.375 MPa (
Figure 12a), while it occurred at 0.25 MPa in the case with one constraint (
Figure 12b). Therefore, it can be said that the presence of the constraint improved the isolator bond behavior, moving bond failure to lower compression stresses.
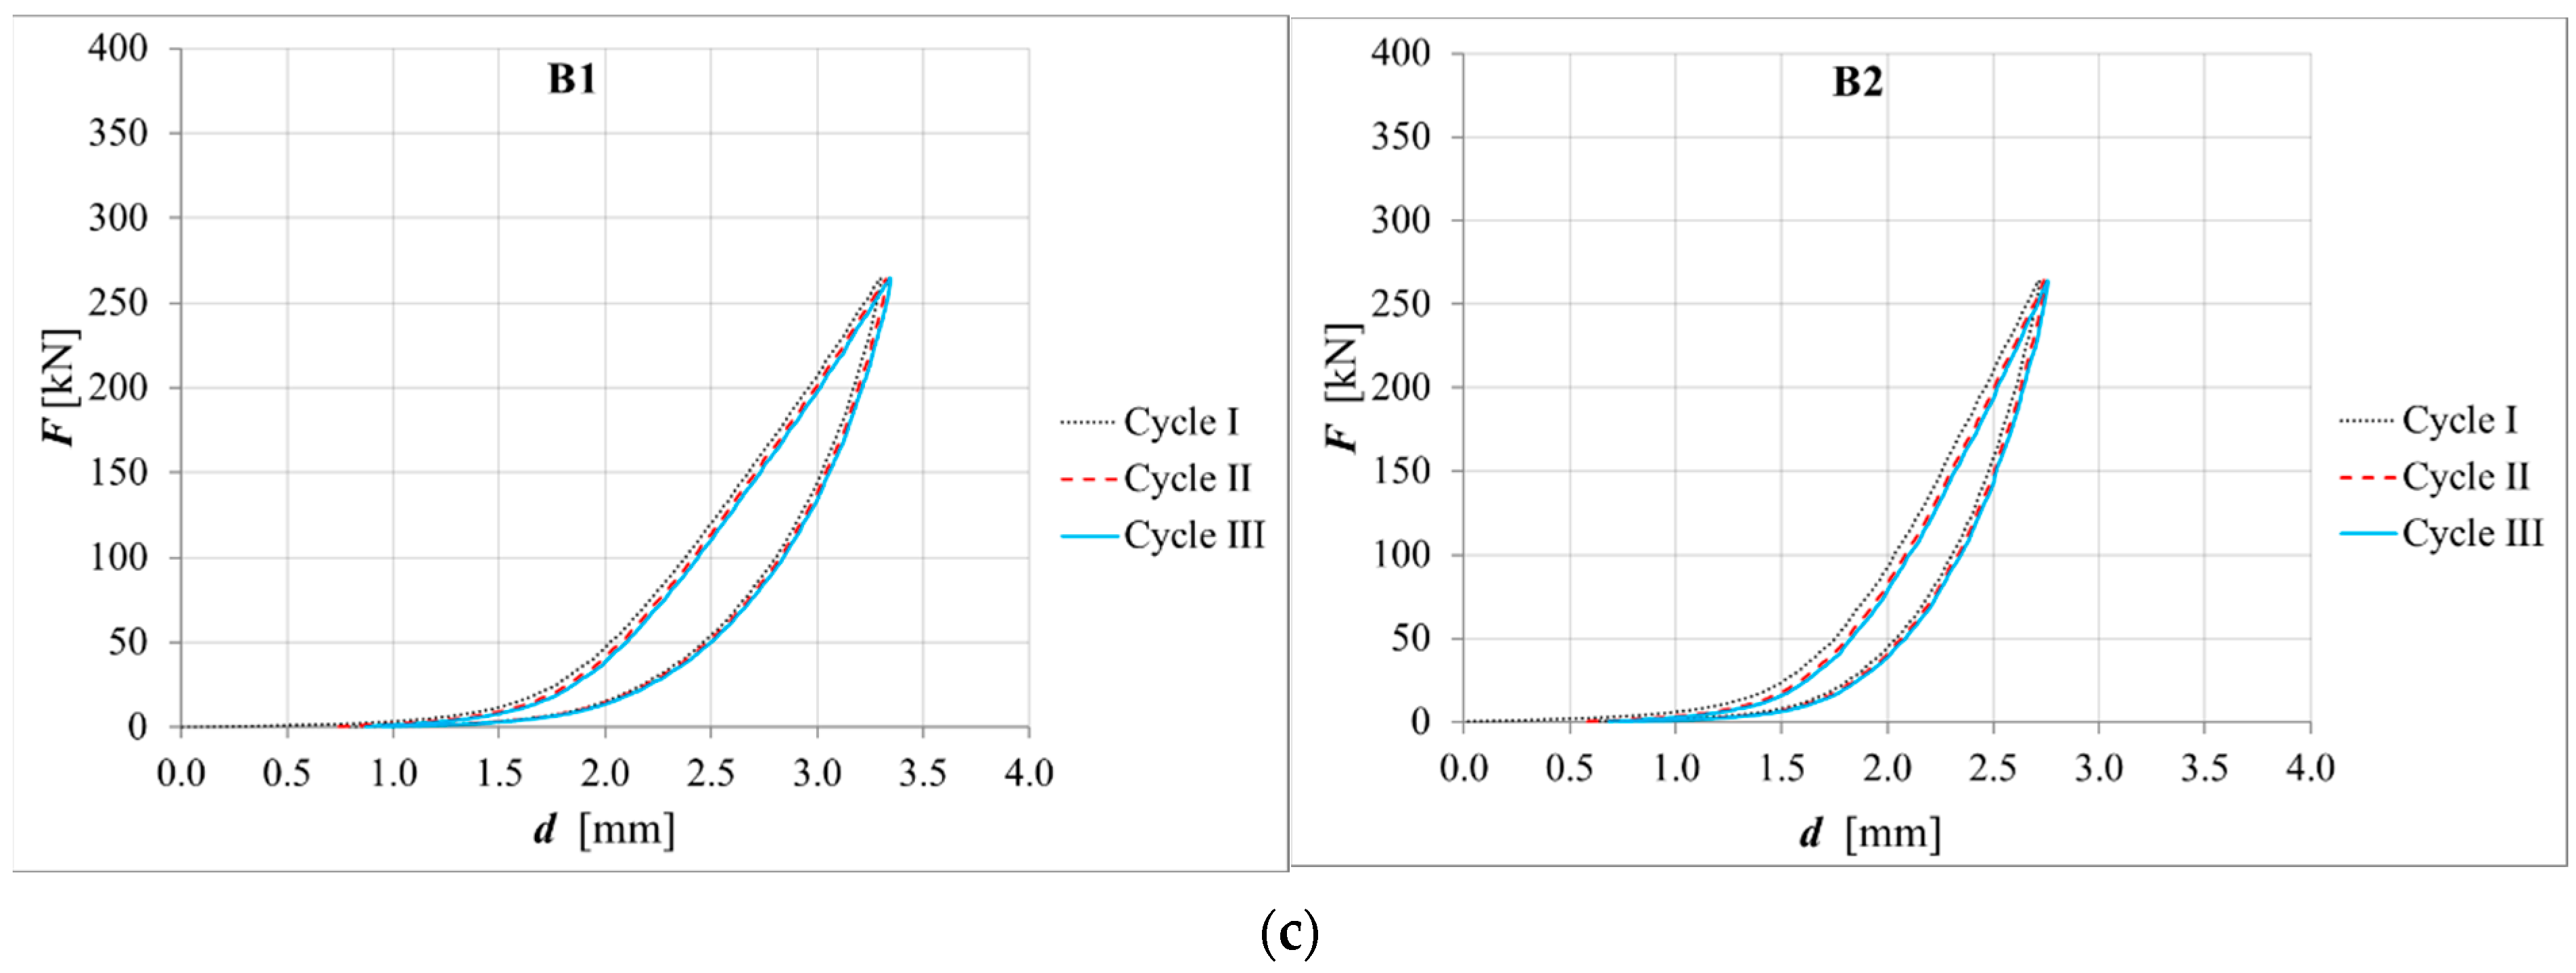
For the B specimens, bond failure occurred at the compression stress of 0.5 MPa in all cases (
Figure 12c). The best performance was given by the case with one constraint, for which increases of 13% of the maximum force and 15% of the corresponding displacement were observed. The improvement given by two constraints was a little lower, probably due to the damage that occurred during the test with one constraint.
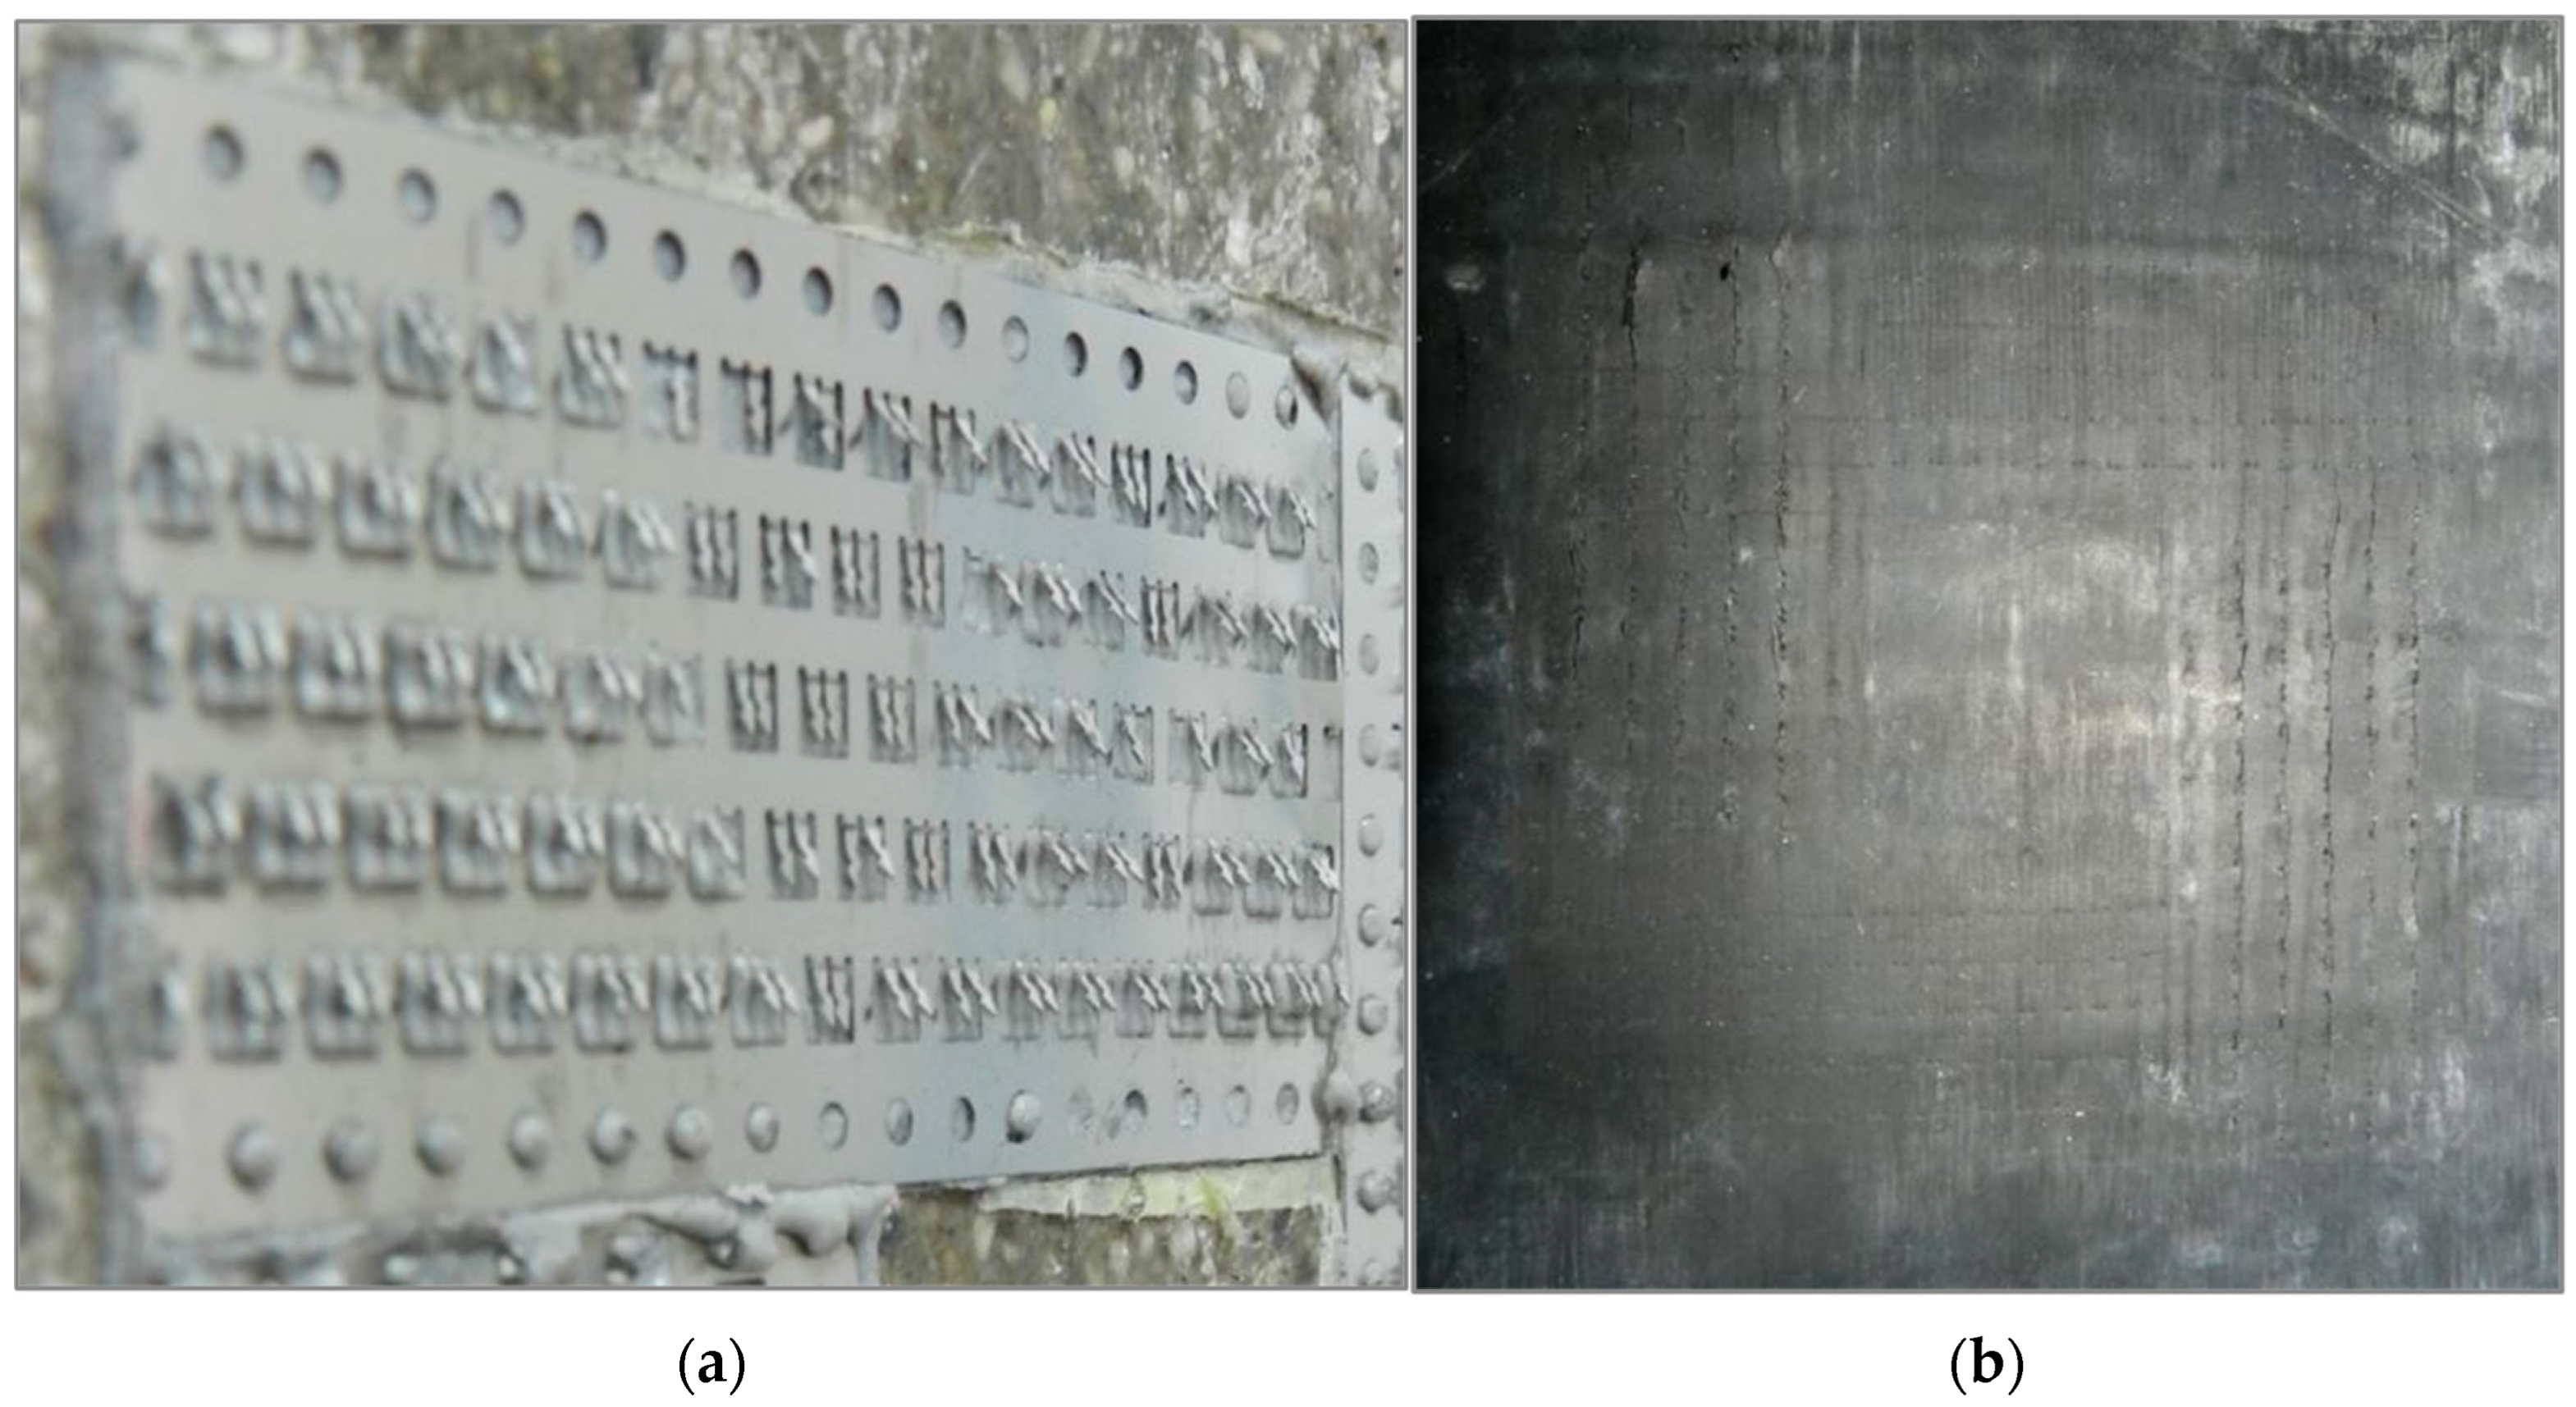
In the specimens subjected to sliding due to bond failure, it was observed that the hooks with less stiffness and flexural strength in the direction parallel to the load application bent and ceased to resist (
Figure 13a).
Consequently, the isolator began to slide, and its external elastomer layer in contact with the Metaklett strip suffered a superficial incision (
Figure 13b) exerted by the metal hooks orthogonal to the loading direction, which did not bend. This type of damage could be avoided if the hooks have the same stiffness and flexural strength in both directions. Regardless, for the B specimens, after having straightened the hooks bent during the test with one constraint (
Figure 11b), and having rotated the isolators 90 degrees with respect to the loading direction, the test with two constraints was performed (
Figure 11c). The observed behavior was similar to that obtained by the configuration with one constraint for compression stresses greater than 0.5 MPa. This means that the damage on the external elastomer layers did not greatly influence the isolator behavior under shear deformation.
8.2.2. Quasi-Static Shear Test
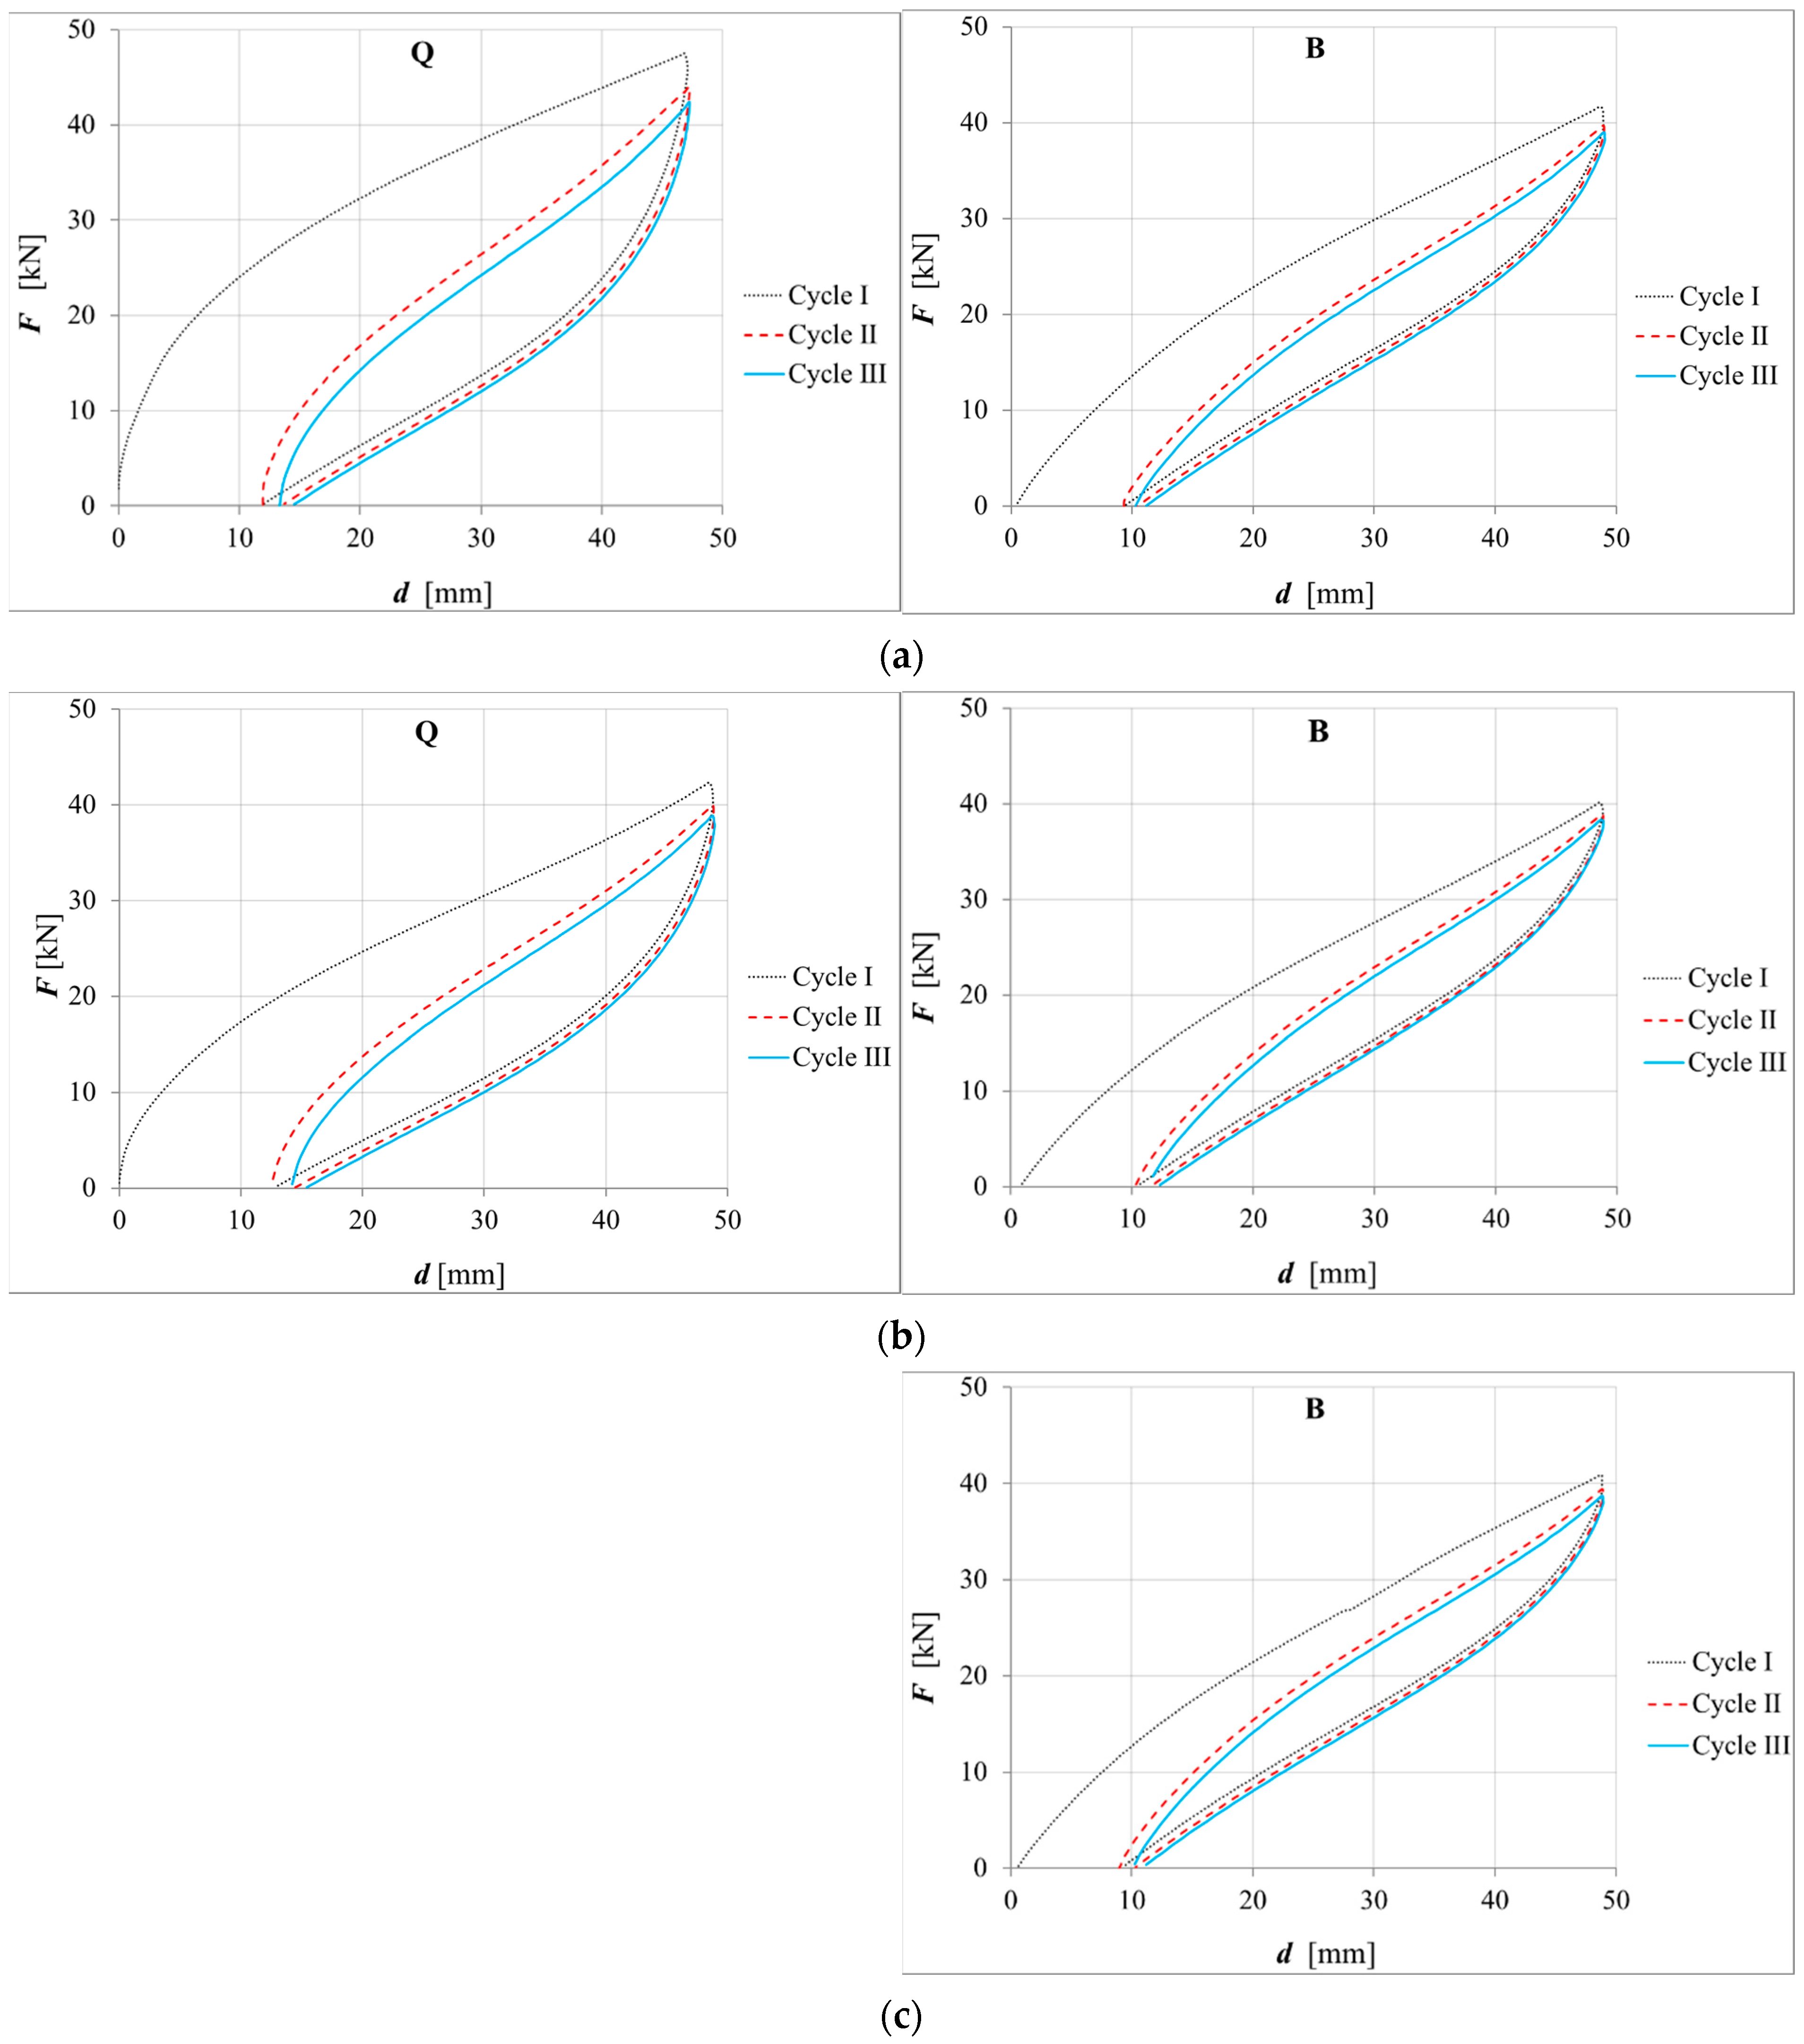
Figure 14 shows the load–displacement curves of all the performed static shear tests. As stated above, the Q specimens were subjected only to the tests without constraint and with one constraint, because during the previous bond test, one of the external elastomer layers was damaged by the metal hooks. Hence, for the quasi-static shear test, the Q specimens were constrained only on the surface that had not been damaged. Although these damages also occurred in the B specimens during the bond test, quasi-static shear tests with two constraints were also carried out on these specimens. In
Figure 14, it can be observed that, in all cases, the isolator behavior stabilized at the third cycle in terms of both the wideness of the cycle, i.e., dissipated energy, and maximum force, after having undergone the Mullins effect. A residual displacement is observed at the end of every cycle due to the viscous–elastic properties of the elastomer. No further damages were observed in the specimens after performing the quasi-static shear tests.
Considering the configuration without constraint (
Figure 14a), the Q specimens performed wider loading cycles than the B specimens, thus showing a greater capacity for dissipating energy. This is due to the different elastomer type used to make the specimens, which was high-damping natural rubber for the Q specimens and low-damping neoprene for the B specimens.
In the graphs, no horizontal strokes or instantaneous force decreases are observed, which suggests breakage phenomena, such as delamination of the internal layers, or sliding of the isolators with respect to the contact surfaces.
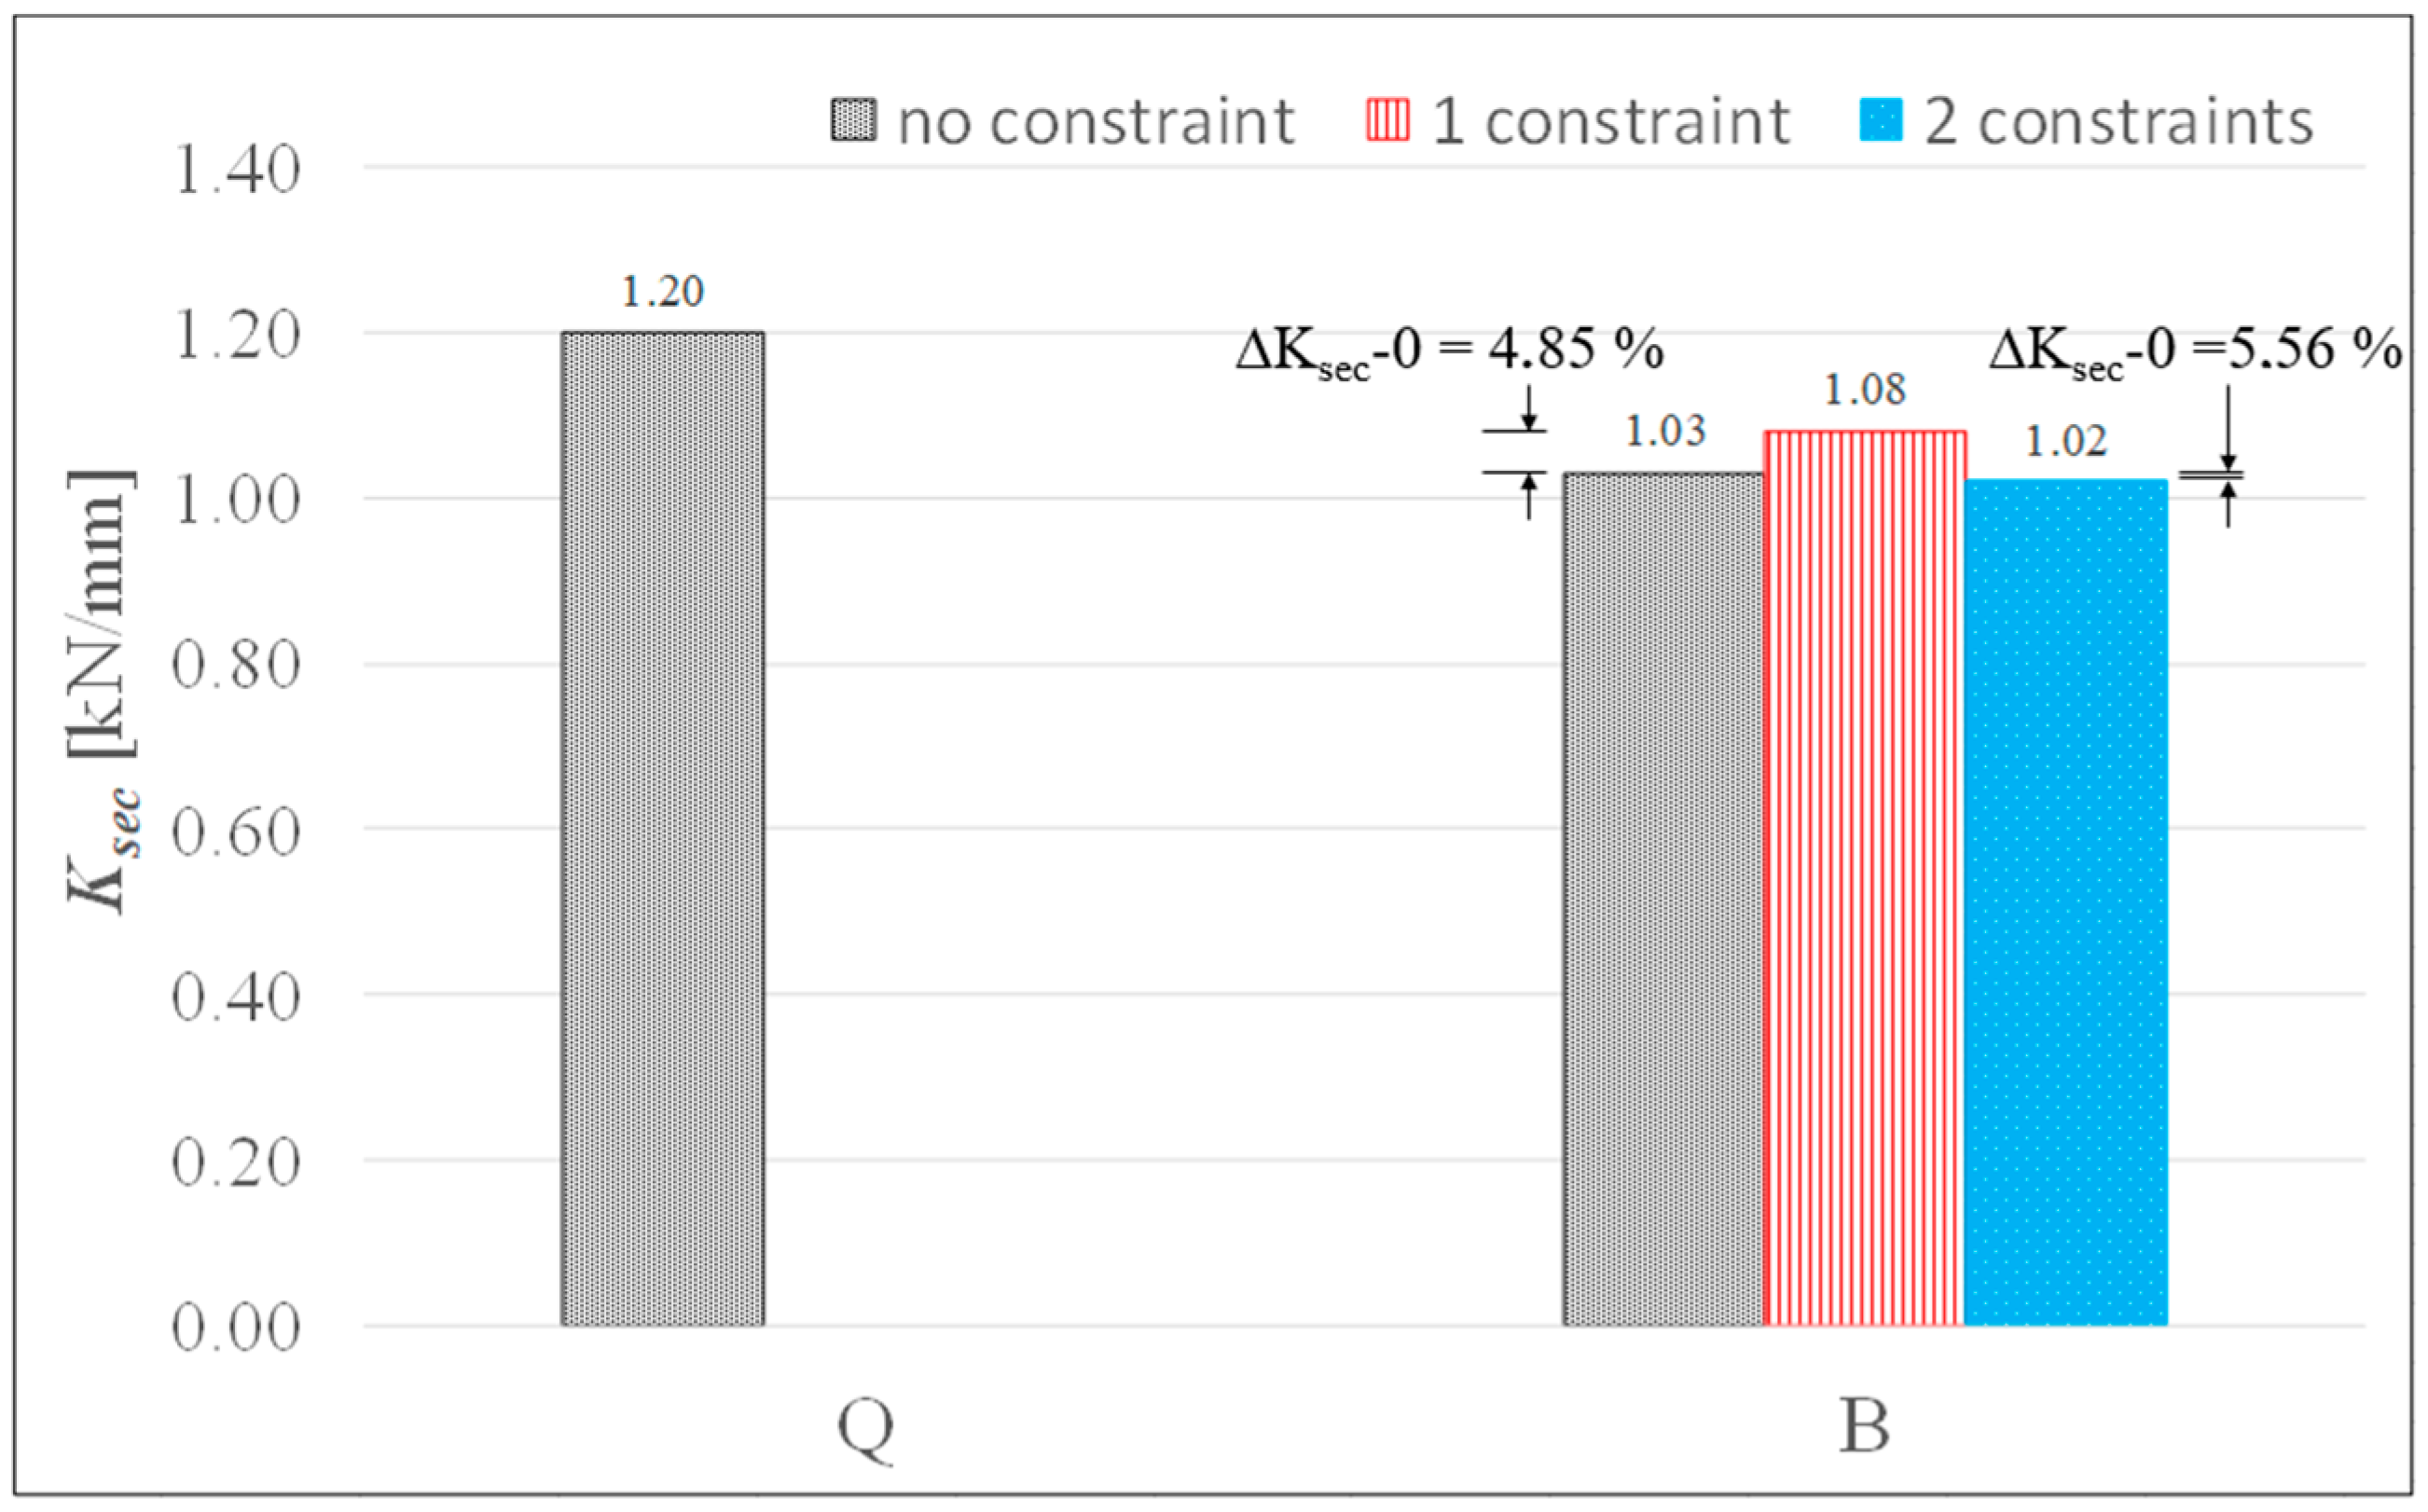
Table 4 reports the secant stiffness values,
Ksec, calculated in the third loading cycle according to Equation (3) for all the tested specimens and configurations, apart from Q-1specimens. For these specimens, it was not possible to determine the
value due to the residual displacement of the third cycle, which was greater than 0.27
te. For the B specimens,
Table 4 also reports the
Ksec variations between the test configuration with one constraint and configuration with no constraint (∆K
sec-0), and between two constraints and one constraint (∆K
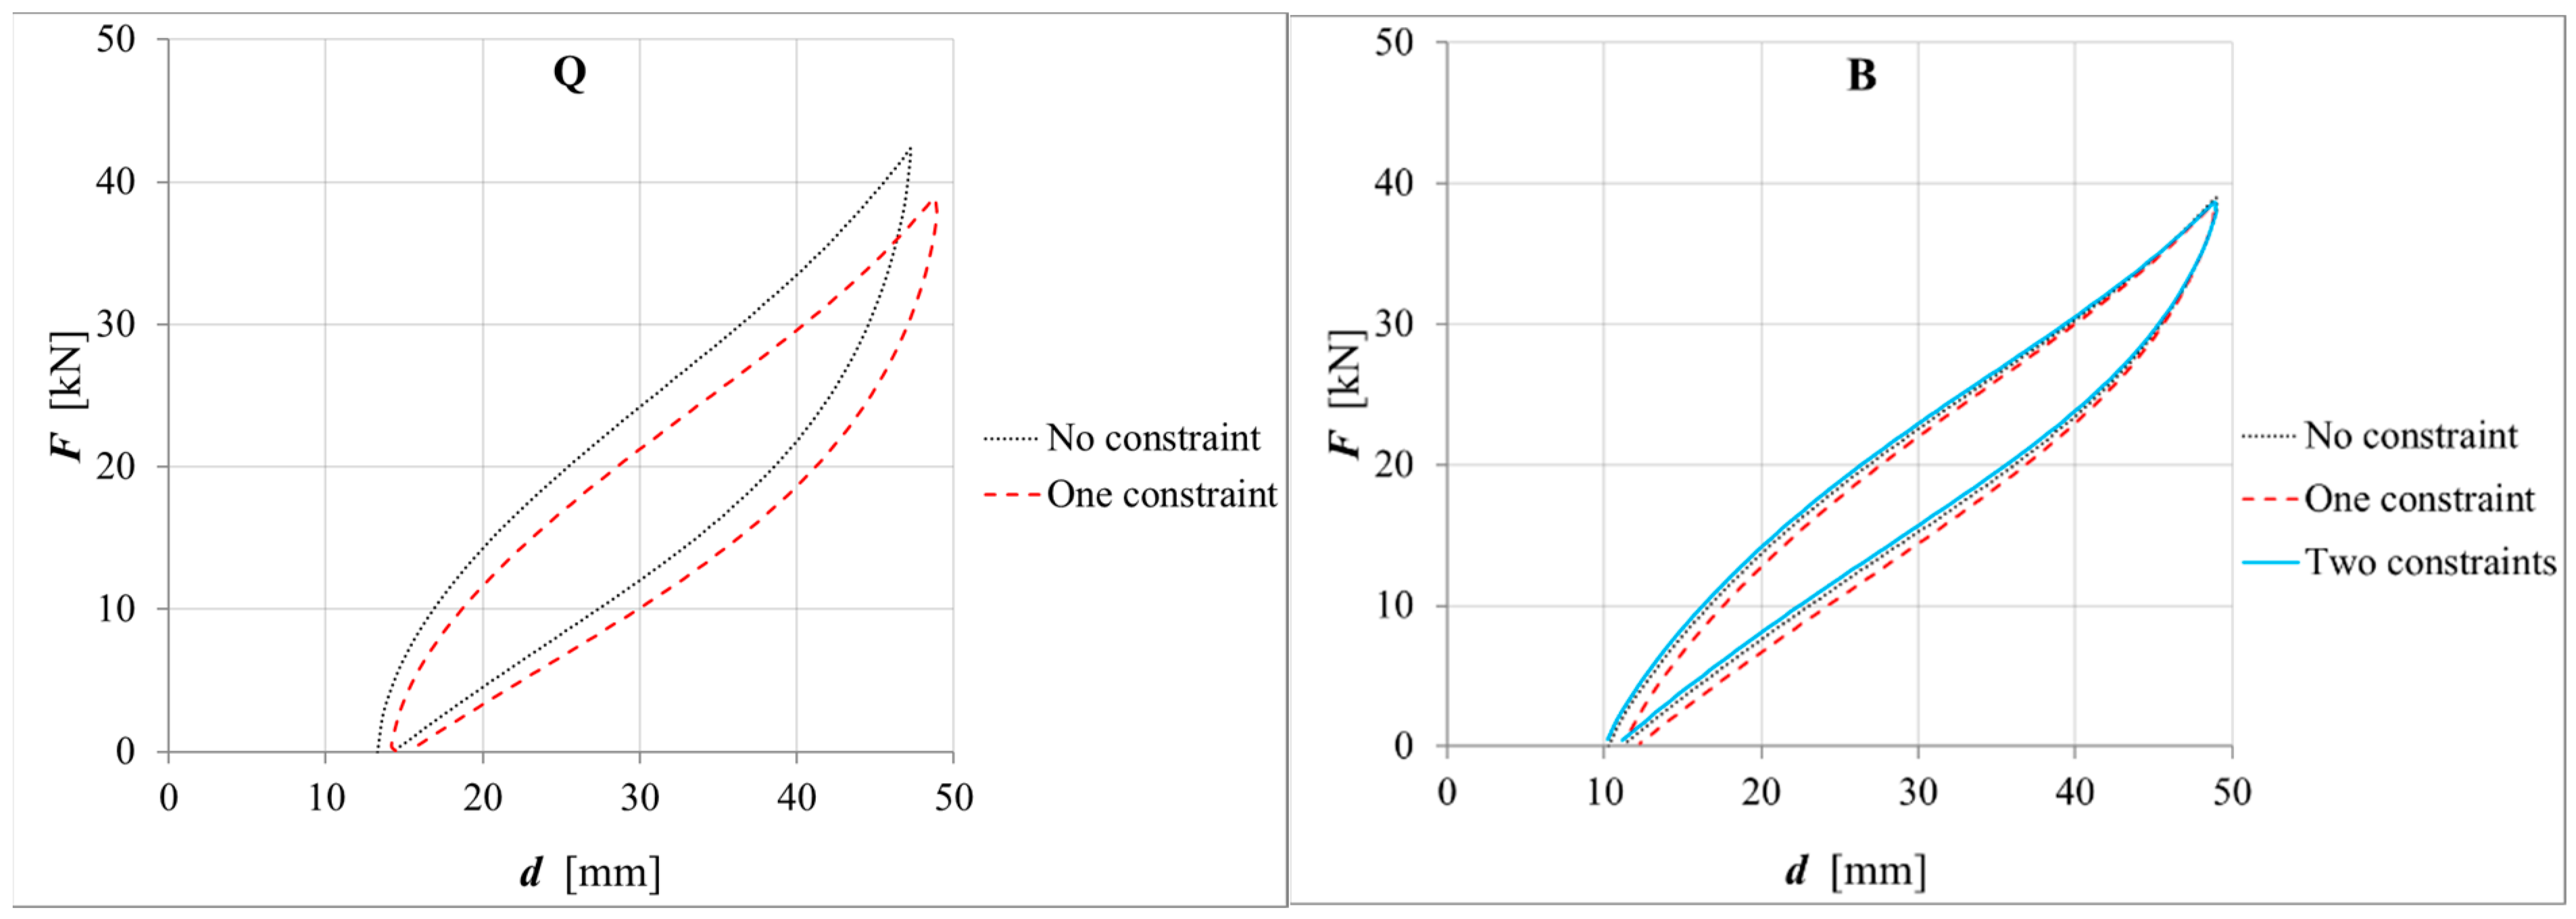
sec-1). From these variations, which were lower than 6%, it is observed that the introduction of the constraint system did not substantially affect the secant stiffness, neither for the one-surface configuration nor for that of the two surfaces (see also
Figure 15).
For the Q specimens, by simply calculating the secant stiffness between the point at zero force of the ascending branch and the point at maximum force (see
Figure 15), the values of 1.25 kN/mm and 1.13 kN/mm were determined for the specimens with no constraint and with one constraint, respectively. In this case, the difference was about 9%.
The data in
Table 4 are shown in graph form in
Figure 16. From this figure, it can also be stressed that Q-0 specimens are stiffer than B-0 specimens.
8.2.3. Dynamic Shear Test
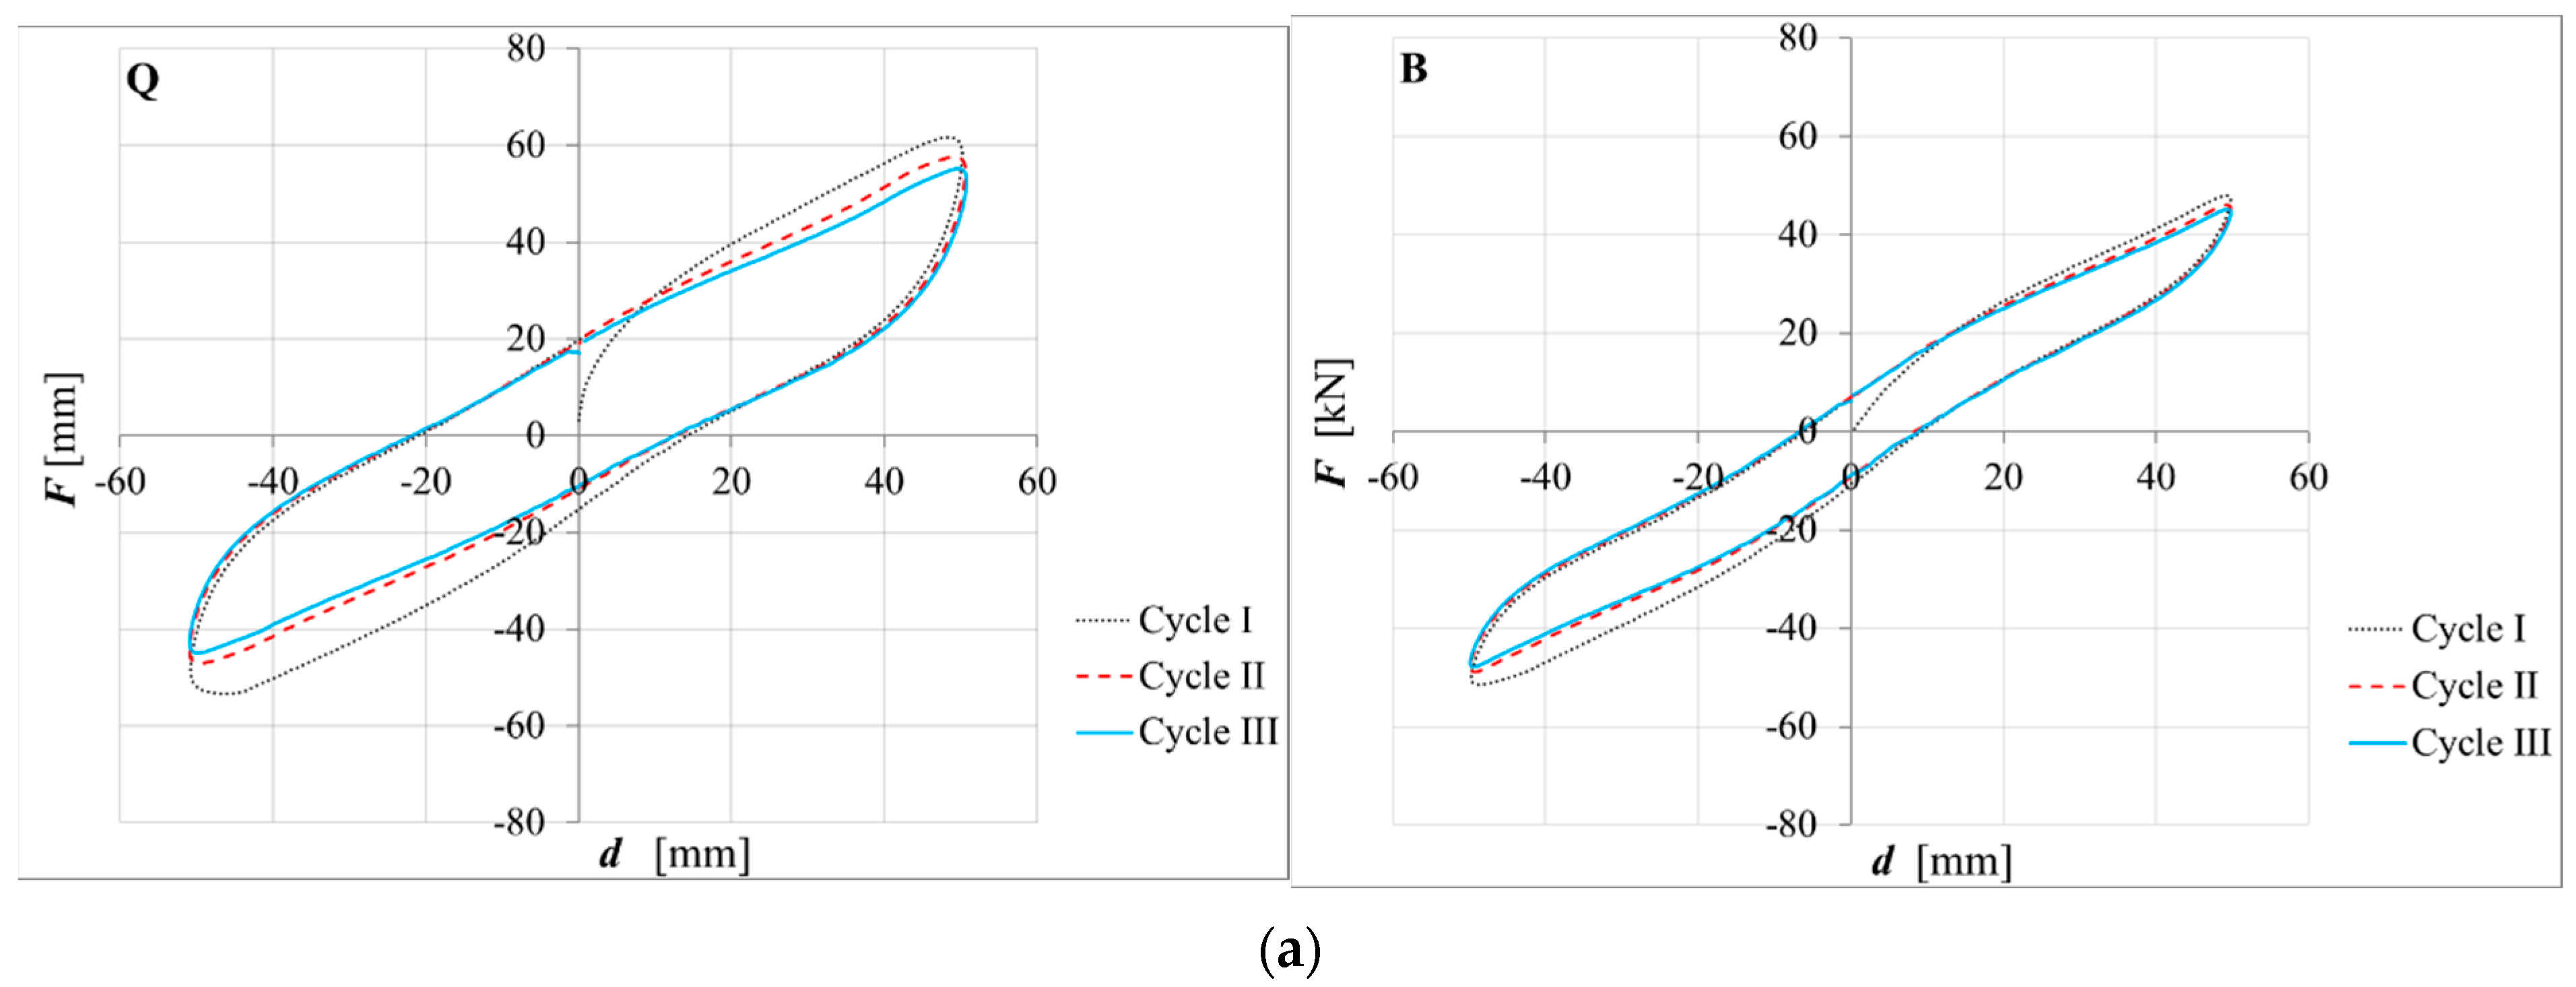
Figure 17 shows the load–displacement curves of all the performed dynamic shear tests. In this figure, it can be observed that, in all cases, the isolator behavior stabilized at the third cycle, a residual displacement is observed at the end of every cycle, and the Q specimens were more dissipative than the B specimens, as observed in the quasi-static shear test.
No further damages due to the dynamic shear tests were observed in the specimens.
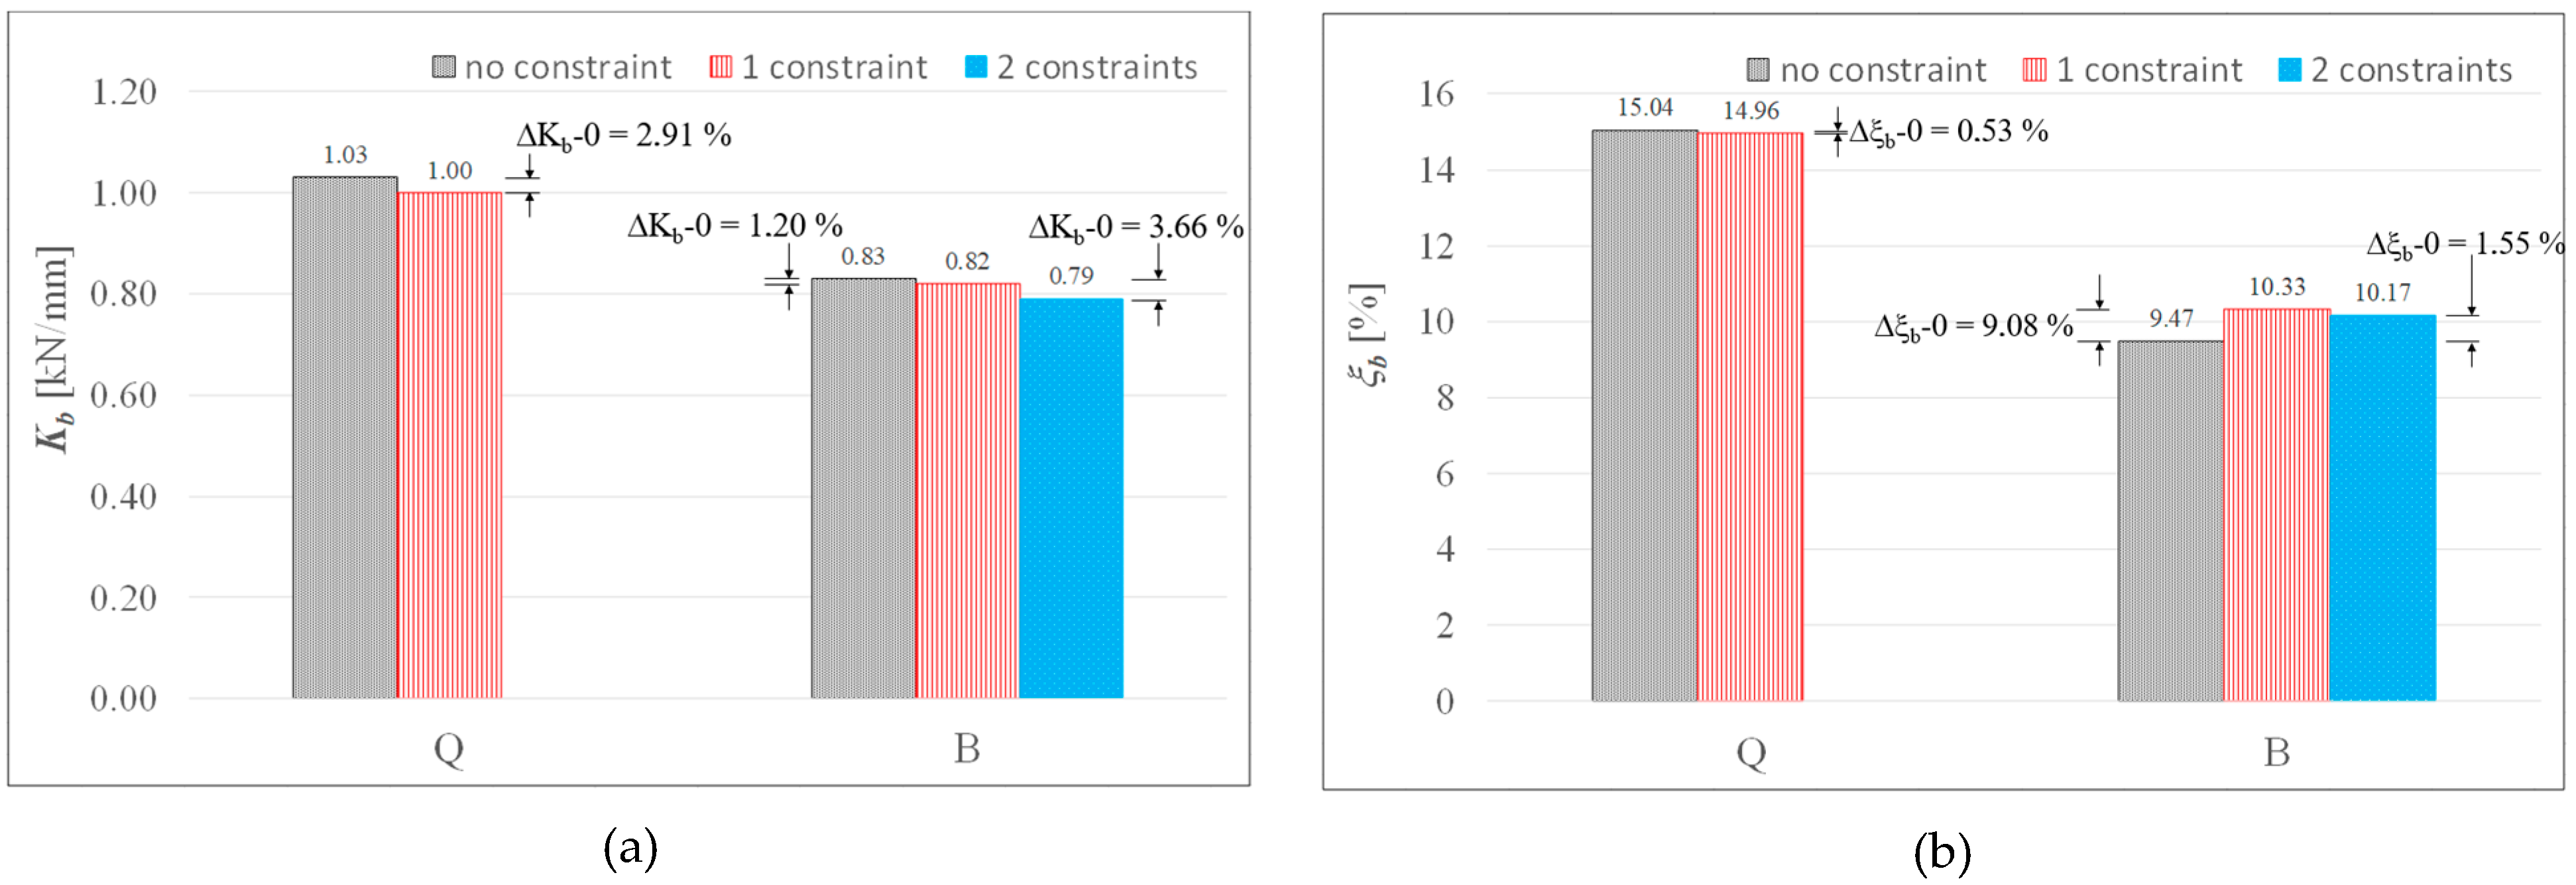
Table 5 reports the isolator stiffness,
Kb, and viscous damping ratio,
ξb, calculated in the third loading cycle according to Equations (4) and (5), respectively.
Table 5 also reports the
Kb and
ξb variations between the test configuration with one constraint and the configuration with no constraint (∆K
b-0, and ∆ξ
b-0, respectively) and between two constraints and one constraint (∆K
b-1, and ∆ξ
b-1, respectively). These results are shown also in graph form in
Figure 18.
Based on the values reported in
Table 5, the following observations can be drawn:
- -
For both the Q and B specimens, the introduction of one constraint produced no significant variations in the isolator horizontal stiffness; in fact, these variations were lower than 5%. The same applies to the B specimens, considering the variations between the two constraints and no constraint.
- -
Regarding the damping ratio, the variation in the presence of one constraint was negligible for the Q specimens, while an increase of 9% was observed for the B specimens. In the presence of two constraints, the increase in the damping ratio in comparison to the configuration without constraints was 7.4% for the B specimens.
9. Conclusions
In this research work, a possible FREI constraint system made out of metal strips with duck head hooks was investigated. The strips are bonded to the sub- and superstructures and the hooks penetrate the external elastomer layers of the isolator in such a way that it is constrained against the horizontal sliding. Experimental tests were performed, and the following conclusions can be drawn.
For both the specimens with quadri-directional fabrics (Q) and bi-directional ones (B), the presence of one constraint had a negligible influence on the vertical stiffness; indeed, the KV percentage variations were lower than 3%.
Regarding the ability of the proposed constraint system to prevent the isolator from sliding horizontally, the presence of one constraint improved the bond behavior of the Q isolator’s moving bond failure to lower compression stresses (from 0.375 MPa to 0.25 MPa). For isolator B, the compression stress at which bond failure occurs remained the same as that without constraint. However, an improvement was observed in the maximum horizontal force exerted by the isolator before bond failure, which increased by 13%, and in the corresponding displacement, which increased by15%. The improvement given by two constraints was a little lower, due to damages that occurred during the test with one constraint.
In the bond test under low compression stress, the hooks with less flexural strength in the direction parallel to the load application bent and the isolator slid. The hooks with greater flexural strength orthogonal to the loading direction did not bend; hence, the isolator that slid was superficially cut by these hooks. After this damage, for compression stresses greater than that producing bond failure, the B isolators’ behavior with two constraints under shear was similar to that obtained with one constraint.
For both specimens Q and B, the introduction of one constraint did not substantially affect the secant stiffness measured under the quasi-static cyclic tests. Indeed, the secant stiffness variations were lower than 5% for the B specimens and 9% for the Q specimens. For the B specimens, the introduction of two constraints produced variations in the stiffness lower than 6%.
In the case of the dynamic cyclic tests, for both specimens Q and B, the introduction of the constraint system did not substantially affect the horizontal stiffness, whose variations were lower than 5%.
Regarding the damping ratio measured under the dynamic cyclic tests, the variation in the presence of one constraint was negligible for the Q specimens, while it was lower than 10% in the presence of both one and two constraints for the B specimens.
In conclusion, the advantage of the proposed constraint system is the improvement in the bond behavior under low compression stresses, even if this improvement is limited by the shape of the hooks of the constraint device. Moreover, for undamaged isolators, the constraint system does not substantially modify the isolator’s behavior, neither under simple compression nor under combined compression and shear.
It is underlined that the use of a commercial product (Metaklett®), created with completely different purposes from those pursued herein, obviously shows limitations. The present study essentially investigated the feasibility of using a constraint device of the described type and, from this point of view, represents a valid basis for a specific and more advanced design of a device based on the same principle. The current shape of the hooks themselves, equipped with protrusions, has proven to be favorable in achieving the retention objective for which the constraint itself was created. However, it is suggested that the stiffness and flexural strength of the hooks should be the same in the two principal directions, not different, as in the presented case. Moreover, the use of hooks of different lengths is suggested. In fact, the penetration of the hooks at different levels would involve different layers of fibers and elastomer, thus obtaining better attachment to the device. In general, besides optimizing the hook design, it could be useful to explore also alternative materials or device typologies, as well as methodologies to connect them to the supports. Moreover, other experimental tests should be performed under a wider range of conditions, also to investigate the long-term performance and durability of the constraint device and its interaction with FREIs.
Author Contributions
Conceptualization, P.A.; methodology, M.P.; validation, G.F.; formal analysis, G.F.; investigation P.A. and M.P.; resources, P.A. and M.P.; data curation, G.F.; writing—original draft preparation, P.A., G.F. and M.P.; writing—review and editing, P.A. and M.P.; visualization, G.F.; supervision, P.A.; project administration, P.A. and M.P.; funding acquisition, M.P. All authors have read and agreed to the published version of the manuscript.
Funding
This research was partially funded by DIPARTIMENTO DELLA PROTEZIONE CIVILE, Presidenza del Consiglio dei Ministri, Italy, within the framework of Executive Project DPC-ReLUIS 2022–2024, project N° 60, 13/05/2022, whose support is greatly appreciated.
Institutional Review Board Statement
Not applicable.
Informed Consent Statement
Not applicable.
Data Availability Statement
The raw data supporting the conclusions of this article will be made available by the authors on request.
Acknowledgments
The authors want to acknowledge ILPEA Industries of Pordenone (Italy), which built and donated, in kind, the specimens; engineer Guido Tognan, who collaborated in the arrangement of the test setup; and engineer Marisa Covre, who collaborated in the execution of the tests.
Conflicts of Interest
The authors declare no conflicts of interest. The funder had no role in the design of the study; in the collection, analyses, or interpretation of data; in the writing of the manuscript; or in the decision to publish the results.
References
- Kelly, J.M. Earthquake-Resistant Design with Rubber; Springer: London, UK, 1997. [Google Scholar]
- Naeim, F.; Kelly, J.M. Design of Seismic Isolated Structures from Theory to Practice; John Wiley & Sons: New York, NY, USA, 1999. [Google Scholar]
- Skinner, R.I.; Robinson, W.H.; McVerry, G.H. An Introduction to Seismic Isolation; Wiley: Hoboken, NJ, USA, 1993. [Google Scholar]
- Christopoulos, C.; Filitrault, A. Principles of Passive Supplemental Damping and Seismic Isolation; IUSS: Pavia, Italy, 2006; pp. 277–299. [Google Scholar]
- Sorace, S.; Terenzi, G.; Melani, D.; Fuso, E. Multi-Storey Building Retrofit by ADAS-Equipped Braces. In Seismic Isolation, Energy Dissipation and Active Vibration Control of Structures: 17th World Conference on Seismic Isolation (17WCSI); Lecture Notes in Civil Engineering; Springer: Cham, Switzerland, 2023; Volume 309, pp. 532–545. [Google Scholar]
- Almeida, A.; Ferreira, R.; Proença, J.M.; Gago, A.S. Seismic retrofit of RC building structures with Buckling Restrained Braces. Eng. Struct. 2016, 130, 14–22. [Google Scholar] [CrossRef]
- Miani, M.; Di Marco, C.; Frappa, G.; Pauletta, M. Effects of dissipative systems on the seismic behavior of irregular buildings—Two case studies. Buildings 2020, 10, 202. [Google Scholar] [CrossRef]
- Mazzon, L.; Frappa, G.; Pauletta, M. Effectiveness of Tuned Mass Damper in Reducing Damage Caused by Strong Earthquake in a Medium-Rise Building. Appl. Sci. 2023, 13, 6815. [Google Scholar] [CrossRef]
- Frappa, G.; Pauletta, M. Seismic retrofitting of a reinforced concrete building with strongly different stiffness in the main directions. In Proceedings of the 14th fib PhD Symposium in Civil Engineering, Rome, Italy, 5–7 September 2022; pp. 499–508. [Google Scholar]
- Madotto, R.; Van Engelen, N.C.; Das, S.; Russo, G.; Pauletta, M. Shear and flexural strengthening of RC beams using BFRP fabrics. Eng. Struct. 2021, 229, 111606. [Google Scholar] [CrossRef]
- Van Engelen, N. Fiber-reinforced elastomeric isolators: A review. Soil Dyn. Earthq. Eng. 2019, 125, 105621. [Google Scholar] [CrossRef]
- Moon, B.Y.; Kang, G.J.; Kang, B.S.; Kelly, J.M. Design and manufacturing of fiber reinforced elastomeric isolator for seismic isolation. J. Mater. Process. Technol. 2002, 130, 145–150. [Google Scholar] [CrossRef]
- Pauletta, M. Method to design fiber-reinforced elastomeric isolators (U-FREIs) and Application. Eng. Struct. 2019, 197, 109366. [Google Scholar] [CrossRef]
- Kelly, J.M.; Takhirov, S.M. Analytical and Experimental Study of Fiber-Reinforced Strip Isolators; PEER Report 2002/11; University of California: Berkeley, CA, USA, 2002. [Google Scholar]
- Kelly, J.M. Seismic isolation systems for developing countries. Earthq. Spectra 2001, 18, 385–406. [Google Scholar] [CrossRef]
- Kelly, J.M.; Takhirov, S.M. Fiber-reinforced seismic bearings for low-cost seismic isolation system. In Proceedings of the 10th World Conference on Seismic Isolation, Energy Dissipation and Active Vibrations Control of Structures, Istanbul, Turkey, 28–31 May 2007. [Google Scholar]
- Kelly, J.M.; Konstantinidis, D. Low-cost seismic isolators for housing in highly seismic developing countries. In Proceedings of the 10th World Conference on Seismic Isolation, Energy Dissipation and Active Vibrations Control of Structures, Istanbul, Turkey, 28–31 May 2007. [Google Scholar]
- Kelly, J.M.; Takhirov, S.M. Analytical and Experimental Study of Fiber-Reinforced Elastomeric Isolators; PEER Report 2001/11; University of California: Berkeley, CA, USA, 2001. [Google Scholar]
- Toopchi-Nezhad, H.; Tait, M.J.; Drysdale, R.G. Testing and modeling of square carbon fiber-reinforced elastomeric seismic isolators. Struct. Control. Health Monit. 2007, 15, 876–900. [Google Scholar] [CrossRef]
- Dezfuli, F.H.; Alam, M.S. Performance of carbon fiber-reinforced elastomeric isolators manufactured in a simplified process: Experimental investigations. Struct. Control. Heal. Monit. 2014, 21, 1347–1359. [Google Scholar] [CrossRef]
- Van Engelen, N.C.; Kelly, J.M. Retest of Neoprene seismic isolation bearings after 30 years. Struct. Control. Health Monit. 2014, 22, 139–151. [Google Scholar] [CrossRef]
- Toopchi-Nezhad, H.; Tait, M.J.; Drysdale, R.G. Shake table study on an ordinary low-rise building seismically isolated with SU-FREIs (stable unbonded-fiber reinforced elastomeric isolators). Earthq. Eng. Struct. Dyn. 2009, 38, 1335–1357. [Google Scholar] [CrossRef]
- Das, A.; Deb, S.K.; Dutta, A. Shake table testing of un-reinforced brick masonry building test model isolated by U-FREI. Earthq. Eng. Struct. Dyn. 2015, 45, 253–272. [Google Scholar] [CrossRef]
- Kang, G.J.; Kang, B.S. Dynamic analysis of fiber-reinforced elastomeric isolation structures. J. Mech. Sci. Technol. 2009, 23, 1132–1141. [Google Scholar] [CrossRef]
- Toopchi-Nezhad, H.; Tait, M.J.; Drysdale, R.G. Parametric study on the response of stable unbonded-fiber reinforced elastomeric isolators (SU-FREIs). J. Compos. Mater. 2009, 43, 1182–1194. [Google Scholar] [CrossRef]
- Osgooei, P.M.; Tait, M.J.; Konstantinidis, D. Finite element analysis of unbonded square fiber-reinforced elastomeric isolators (FREIs) under lateral loading in different directions. Compos. Struct. 2014, 113, 164–173. [Google Scholar] [CrossRef]
- Angeli, P.; Russo, G.; Paschini, A. Carbon fiber-reinforced rectangular isolators with compressible elastomer: Analytical solution for compression and bending. Int. J. Solids Struct. 2013, 50, 3519–3527. [Google Scholar] [CrossRef]
- Das, A.; Deb, S.K.; Dutta, A. Comparison of Numerical and Experimental Seismic Responses of FREI-Supported Un-reinforced Brick Masonry Model Building. J. Earthq. Eng. 2016, 20, 1239–1262. [Google Scholar] [CrossRef]
- Habieb, A.B.; Milani, G.; Tavio, T. Two-step advanced numerical approach for the design of low-cost unbonded fiber reinforced elastomeric seismic isolation systems in new masonry buildings. Eng. Fail. Anal. 2018, 90, 380–396. [Google Scholar] [CrossRef]
- Nanghshineh, A.K.; Akyüz, U.; Caner, A. Comparison of fundamental properties of new types of ber-mesh-reinforced seismic isolators with conventional isolators. Earthq. Eng. Struct. Dyn. 2014, 43, 301–316. [Google Scholar] [CrossRef]
- Kelly, M.J.; Calabrese, A. Mechanics of Fiber Reinforced Bearings; PEER Report 2012/101; University of California: Berkeley, CA, USA, 2012. [Google Scholar]
- Pauletta, M.; Pinzano, F.; Frappa, G.; Russo, G. Tensile Tests for the Improvement of Adhesion between Rubber and Steel Layers in Elastomeric Isolators. Appl. Sci. 2020, 10, 8063. [Google Scholar] [CrossRef]
- EN 1337-3:2005; Structural Bearings—Part 3: Elastomeric Bearings. BSI: London, UK, 2005.
- EN 15129:2018; Anti-Seismic Devices. Available online: https://standards.iteh.ai/catalog/standards/cen/78c174c4-d9ec-422e-ae7c-88fab162c80e/en-15129-2018 (accessed on 14 April 2024).
- Pianese, G.; Van Engelen, N.; Toopchi-Nezhad, H.; Milani, G. High-damping fiber-reinforced elastomeric seismic isolator in different boundary conditions: An experimental insight. Eng. Struct. 2024, 300, 117199. [Google Scholar] [CrossRef]
- Toopchi-Nezhad, H.; Ghotb, M.; Al-Anany, Y.; Tait, M. Partially bonded fiber reinforced elastomeric bearings: Feasibility, effectiveness, aging effects, and low temperature response. Eng. Struct. 2018, 179, 120–128. [Google Scholar] [CrossRef]
- Van Engelen, N.C.; Tait, M.J.; Konstantinidis, D. Investigation of partially bonded fiber-reinforced elastomeric isolators (PB-FREIs) with nominal vertical tensile loads. Can. J. Civ. Eng. 2019, 46, 669–676. [Google Scholar] [CrossRef]
- Toopchi-Nezhad, H.; Tait, M.J.; Drysdale, R.G. Bonded versus unbonded strip fiber reinforced elastomeric isolators: Finite element analysis. Compos. Struct. 2011, 93, 850–859. [Google Scholar] [CrossRef]
- Van Engelen, N.C.; Osgooei, P.M.; Tait, M.J.; Konstantinidis, D. Partially bonded fiber-reinforced elastomeric isolators (PB-FREIs). Struct. Control. Health Monit. 2014, 22, 417–432. [Google Scholar] [CrossRef]
- Dezfuli, F.H.; Alam, M.S. Experiment-Based Sensitivity Analysis of Scaled Carbon-Fiber-Reinforced Elastomeric Isolators in Bonded Applications. Fibers 2016, 4, 4. [Google Scholar] [CrossRef]
- Taniwangsa, W.; Clark, P.W.; Kelly, J.M. UCB/EERC-95/12, Natural Rubber Isolation Systems for Earthquake Protection of Low-Cost Buildings; University of California: Berkeley, CA, USA, 1996. [Google Scholar]
- Maureira, N.; de la Llera, J.; Oyarzo, C.; Miranda, S. A nonlinear model for multilayered rubber isolators based on a co-rotational formulation. Eng. Struct. 2017, 131, 1–13. [Google Scholar] [CrossRef]
- Keda, Y.; Nagahashi, S. Earthquake response characteristics on uplift of multilayered elastomeric isolator of base isolated high-rise building with setback elevation: A study on the effects of simultaneous action input from horizontal and vertical ground motion on earth quake response characteristics of base isolated high-rise building, Part 2. J. Struct. Constr. Eng. 2010, 75, 913–922. [Google Scholar]
- Mitoulis, S.A. Uplift of elastomeric bearings in isolated bridges subjected to longitudinal seismic excitations. Struct. Infrastruct. Eng. 2015, 11, 1600–1615. [Google Scholar] [CrossRef]
- Bader, D.L.; Pearcy, M.J. Material properties of Velcro fastenings. Prosthet. Orthot. Int. 1982, 6, 93–96. [Google Scholar] [CrossRef] [PubMed]
- DIN EN 10088-3:2014; Stainless Steels—Part 3: Technical Delivery Conditions for Semi-Finished Products, Bars, Rods, Wire, Sections and Bright Products of Corrosion Resisting Steels for General Purposes. BSI: London, UK, 2014.
- De Tommasi, D.; Puglisi, G.; Saccomandi, G. A micromechanics based model for the mullins effect. J. Rheol. 2006, 50, 495–512. [Google Scholar] [CrossRef]
Figure 1.
Strains under compression load for (
a) SREIs and (
b) U-FREIs [
30].
Figure 1.
Strains under compression load for (
a) SREIs and (
b) U-FREIs [
30].
Figure 2.
Strains under horizontal load for (
a) SREIs and (
b) U-FREIs [
31].
Figure 2.
Strains under horizontal load for (
a) SREIs and (
b) U-FREIs [
31].
Figure 3.
Metaklett Entenkopf® images: (a) strip with the duck head hooks; (b) drawing of the hooks.
Figure 3.
Metaklett Entenkopf® images: (a) strip with the duck head hooks; (b) drawing of the hooks.
Figure 4.
Photo of the isolators. Note that the names of the specimens in this paper were shortened from QA1, QA2, BA1, and BA2 to Q1, Q2, B1, and B2, respectively, for brevity.
Figure 4.
Photo of the isolators. Note that the names of the specimens in this paper were shortened from QA1, QA2, BA1, and BA2 to Q1, Q2, B1, and B2, respectively, for brevity.
Figure 5.
Constraint system: (a) configuration; (b) view of the system bonded to the concrete through resin.
Figure 5.
Constraint system: (a) configuration; (b) view of the system bonded to the concrete through resin.
Figure 6.
Compression test set-up: (a) overview; (b) details.
Figure 6.
Compression test set-up: (a) overview; (b) details.
Figure 7.
Shear test setup: (a) overview; (b) details.
Figure 7.
Shear test setup: (a) overview; (b) details.
Figure 8.
Force–displacement curves of compression tests for specimens Q1 and Q2: (a) without constraint; (b) with constraint on one contact surface.
Figure 8.
Force–displacement curves of compression tests for specimens Q1 and Q2: (a) without constraint; (b) with constraint on one contact surface.
Figure 9.
Force–displacement curves of compression tests for specimens B1 and B2: (a) without constraint; (b) with constraint on one contact surface; (c) with constraint on both contact surfaces.
Figure 9.
Force–displacement curves of compression tests for specimens B1 and B2: (a) without constraint; (b) with constraint on one contact surface; (c) with constraint on both contact surfaces.
Figure 10.
Average Kv values at third cycle and Kv variations due to the presence of the constraints.
Figure 10.
Average Kv values at third cycle and Kv variations due to the presence of the constraints.
Figure 11.
Force–displacement curves of bond test: (a) without constraint; (b) with constraint on one contact surface; (c) with constraints on both contact surfaces.
Figure 11.
Force–displacement curves of bond test: (a) without constraint; (b) with constraint on one contact surface; (c) with constraints on both contact surfaces.
Figure 12.
Diagrams relevant to bond failure: (a) Q specimens under 0.375 MPa; (b) Q specimens under 0.25 MPa; (c) B specimens under 0.5 MPa.
Figure 12.
Diagrams relevant to bond failure: (a) Q specimens under 0.375 MPa; (b) Q specimens under 0.25 MPa; (c) B specimens under 0.5 MPa.
Figure 13.
Damage to the (a) hooks and (b) elastomer.
Figure 13.
Damage to the (a) hooks and (b) elastomer.
Figure 14.
Force–displacement curves of quasi-static shear test: (a) without constraint; (b) with constraint on one contact surface; (c) with constraint on both contact surfaces.
Figure 14.
Force–displacement curves of quasi-static shear test: (a) without constraint; (b) with constraint on one contact surface; (c) with constraint on both contact surfaces.
Figure 15.
Comparison of cycle III of the quasi-static shear test among different constraint configurations.
Figure 15.
Comparison of cycle III of the quasi-static shear test among different constraint configurations.
Figure 16.
Average Ksec values of cycle III and Ksec variations due to the presence of the constraints.
Figure 16.
Average Ksec values of cycle III and Ksec variations due to the presence of the constraints.
Figure 17.
Force–displacement curves of dynamic shear test: (a) without constraint; (b) with constraint on one contact surface; (c) with constraint on both contact surfaces.
Figure 17.
Force–displacement curves of dynamic shear test: (a) without constraint; (b) with constraint on one contact surface; (c) with constraint on both contact surfaces.
Figure 18.
(a) Average Kb values at cycle III and Kb variations due to the presence of the constraints; (b) average ξb values at cycle III and ξb variations due to the presence of the constraints.
Figure 18.
(a) Average Kb values at cycle III and Kb variations due to the presence of the constraints; (b) average ξb values at cycle III and ξb variations due to the presence of the constraints.
Table 1.
Characteristics of the specimens.
Table 1.
Characteristics of the specimens.
| Name | Elastomer | Fabric | l | t | n | te | H | S | A |
|---|
| | | | [mm] | [mm] | | [mm] | [mm] | | [mm2] |
|---|
| B1, B2 | ldn | bd | 210 | 2.5 | 20 | 50 | 52.02 | 21 | 44,100 |
| Q1, Q2 | hdnr | qd | 240 | 2.5 | 20 | 50 | 54.03 | 24 | 57,600 |
Table 2.
List of tests with their chronological order.
Table 2.
List of tests with their chronological order.
| Q1 and Q2 | B1 and B2 |
|---|
| I | CT-0 | II | CT-0 |
| III | ST-0 | IV | ST-0 |
| V | CT-1 | VI | CT-1 |
| VII | ST-1 | VIII | ST-1 |
| | - | IX | CT-2 |
| | - | X | ST-2 |
Table 3.
KV values for all the tested specimens and configurations and percentage variations in the presence of the constraints.
Table 3.
KV values for all the tested specimens and configurations and percentage variations in the presence of the constraints.
| (1) | (2) | (3) | (4) | (5) | (6) | (7) |
|---|
| | | KV (kN/mm) | | | | |
|---|
| | Cycle I | Cycle II | Cycle III | Cycle III Average | ∆KV-0 (%) | ∆KV-1 (%) |
|---|
| Q1-0 | 359.59 | 500.03 | 517.00 | 508.27 | | |
| Q2-0 | 438.01 | 483.10 | 499.54 | | |
| Q1-1 | 418.87 | 679.86 | 504.88 | 496.71 | −2.27 | |
| Q2-1 | 414.09 | 479.75 | 488.55 | |
| B1-0 | 262.11 | 293.73 | 295.62 | 313.38 | | |
| B2-0 | 283.22 | 358.31 | 331.14 | | |
| B1-1 | 266.16 | 284.92 | 295.58 | 311.52 | −0.59 | |
| B2-1 | 308.03 | 336.63 | 327.47 | |
| B1-2 | 175.72 | 177.54 | 177.00 | 211.19 | −32.61 | −32.21 |
| B2-2 | 239.17 | 243.99 | 245.39 |
Table 4.
Ksec values and percentage variations in the presence of constraints.
Table 4.
Ksec values and percentage variations in the presence of constraints.
| | Ksec (kN/mm) | ∆Ksec-0 (%) | ∆Ksec-1 (%) |
|---|
| Q-0 | 1.20 | | |
| Q-1 | - | | |
| B-0 | 1.03 | | |
| B-1 | 1.08 | 4.85 | |
| B-2 | 1.02 | −5.56 | −0.97 |
Table 5.
Kb and ξb values for all the tested specimens and configurations and percentage variations in the presence of the constraints.
Table 5.
Kb and ξb values for all the tested specimens and configurations and percentage variations in the presence of the constraints.
| | Kb (kN/mm) | ∆Kb-0 (%) | ∆Kb-1 (%) | ξb (%) | ∆ξb-0 (%) | ∆ξb-1 (%) |
|---|
| Q-0 | 1.03 | | | 15.04 | | |
| Q-1 | 1 | −2.91 | | 14.96 | −0.53 | |
| B-0 | 0.83 | | | 9.47 | | |
| B-1 | 0.82 | −1.20 | | 10.33 | 9.08 | |
| B-2 | 0.79 | −3.66 | −4.82 | 10.17 | −1.55 | 7.39 |
| Disclaimer/Publisher’s Note: The statements, opinions and data contained in all publications are solely those of the individual author(s) and contributor(s) and not of MDPI and/or the editor(s). MDPI and/or the editor(s) disclaim responsibility for any injury to people or property resulting from any ideas, methods, instructions or products referred to in the content. |
© 2024 by the authors. Licensee MDPI, Basel, Switzerland. This article is an open access article distributed under the terms and conditions of the Creative Commons Attribution (CC BY) license (https://creativecommons.org/licenses/by/4.0/).


