Article

Fat-to-Muscle Ratio: Exploring Associations with Motor Competence and Physical Fitness in 7-Year-Old Children †

1
Research Group of Culture and Education, Institute of Educational Research, University of Girona, 17007 Girona, Spain
2
Chair of Sport and Physical Education-Center of Olympic Studies, University of Girona, 17820 Banyoles, Spain
3
University School of Health and Sport (EUSES), University of Girona, 17190 Girona, Spain
4
Research Group of Clinical Anatomy, Embryology and Neuroscience (NEOMA), Department of Medical Sciences, University of Girona, 17003 Girona, Spain
5
Research Group Health and Health Care, Nursing Department, University of Girona, 17003 Girona, Spain
*
Author to whom correspondence should be addressed.
This paper is an extended version of the paper published in the international conference: European Congress of Sport Science, Sevilla, Spain, 1 September 2022.
Appl. Sci. 2025, 15(3), 1665; https://doi.org/10.3390/app15031665
Submission received: 24 December 2024 / Revised: 1 February 2025 / Accepted: 3 February 2025 / Published: 6 February 2025
(This article belongs to the Special Issue Exercise, Fitness, Human Performance and Health: 2nd Edition)

Abstract

:

Featured Application

This study demonstrates that compartmental bioimpedance analysis, through the fat-to-muscle ratio, provides a simple and non-invasive method for identifying individuals at risk of exercise deficit disorder related to motor competence and physical fitness, as well as subsequent health risks. Consequently, it could be used to individualize physical exercise programs or physical education classes focusing on MC mastery and PF improvements based on muscle coordination and strength.

Abstract

This study aimed (1) to explore the association between body composition [fat-to-muscle ratio (FMR), waist circumference (WC), and body mass index (BMI)] with motor competence (MC) and physical fitness (PFI) in 7-year-old children; (2) to ascertain whether FMR modifies the associations between MC and PF. A total of 164 children (7 yr) were included. Anthropometric (fat and muscle mass were calculated with TANITA), motor competence (CAMSA test) and physical fitness (1/2 mile run, handgrip strength, 10 × 5, standing long jump, and sit and reach tests) variables were collected. FMR, WC and BMI correlated negatively with MC (all between r ≤ −0.333 and −0.183 and p < 0.05) and PFI (all between r ≤ −0.410 and −0.246 and p < 0.05) in all children. However, the associations were stronger for FMR. In linear regressions analyses, only FMR was independently and negatively associated with MC and PFI, explaining 12.6% and 20.9% of its variance, respectively. Positive correlations between PFI and MC existed. Also, the association was not modified by FMR levels, since in both groups (above and below FMR median), the associations were maintained (p < 0.0001). However, the t-test showed that children with higher FMRs have lower levels of MC (p = 0.005) and PFI (p < 0.0001). FMR may be the best body composition parameter related to MC and PFI. Furthermore, the association between MC and PFI is not modulated by FMR but children with higher FMRs show lower levels of MC and PFI.

1. Introduction

The fat-to-muscle ratio (FMR) has been defined as the ratio of fat mass to muscle mass, and has recently emerged as a simple and useful ratio to assess cardiovascular diseases [1] and metabolic syndrome [2] in adults as well as in children [3]. FMR considers not only the accumulation of fat mass but also skeletal muscle mass. In children, the negative effects of an excessive accumulation of fat mass on physical fitness (PF) and motor competence (MC) parameters are well known thanks to studies on BMI, the sum of skin-folds, and waist circumference [4,5,6]. However, less attention has been paid to the positive role of muscle mass related to fat mass in MC and PF [7].
PF is used as a set of measurable health- and skill-related attributes which refer to good health or physical condition as a result of physical exercise [8]. Motor competence can be defined as the collection of skills, abilities, and areas of knowledge that enable individuals to tackle movement challenges across their lifespan [9], and involves the capacity to adjust actions to different surroundings [10].
It is currently accepted that a correlation exists between PF (especially cardiorespiratory fitness and strength), and health [11,12,13] in childhood and adolescence; strong evidence of there being a positive association between PF and MC [5,10,14] and PF and MC with fat mass accumulation also exists [4,5,6]. Improvements in both PF and MC were observed to substantially influence weight trajectories over time, although the direction of these relationships is not clear [14]. On the other hand, little data exist regarding the role of the fat-to-muscle ratio in body composition, MC and PF in children. The primary objectives of this study were (1) to examine the relationship between body composition (FMR, WC, and BMI) and MC and PF in 7-year-old children and (2) to determine if FMR influences the relationship between MC and PF.

2. Methods

2.1. Participants

A total of 281 children were eligible for the PEHC (Physical Education Health and Children) study [15]; 77 participants were excluded for different reasons, 40 were removed from analysis because of missing data, and finally, 164 children were included in the final analysis (81 boys and 83 girls; age 7.41 ± 0.32 yr) between 2017 and 2018 (Figure 1). Participants were recruited from schools in Cassà de la Selva and Salt, both in northern Spain.
The inclusion criteria at baseline were children between 7 and 8 years old in primary school. The exclusion criteria were (1) evidence of chronic illness or chronic medication use; (2) musculoskeletal or neurological disease.
This study was conducted in accordance with the Declaration of Helsinki and approved by the Institutional Review Board of Dr. Josep Trueta Hospital (approved 17 July 2016). Informed consent and assent were obtained from participants and their parents.

2.2. Study Measures and Procedure

2.2.1. Anthropometrics

All anthropometric measurements were taken in the morning in a warm classroom, with the children under fasting conditions, with an empty bladder, and wearing light clothing. Additionally, the children had not exercised beforehand. Weight was measured using a calibrated scale (Portable TANITA 240MA, Amsterdam, The Netherlands), and height was measured with a Harpenden stadiometer (SECA SE206, Hamburg, Germany). Body mass index (BMI) was calculated as weight in kilograms divided by the square of height in meters. Waist circumference (WC) was measured at the umbilical level (the midpoint between the lowest rib and the iliac crest) while the child was standing [16]. Body composition (fat and muscle mass) was assessed using bioelectrical impedance (Portable TANITA; 240MA, Amsterdam, The Netherlands). The fat-to-muscle ratio (FMR) was calculated as the fat mass divided by the muscle mass [1].

2.2.2. Motor Competence

The Canadian Agility and Movement Skill Assessment (CAMSA) test was used to examine motor competence (MC). The CAMSA test measures fundamental, combined, and complex movement skills in a dynamic environment, taking into account the time spent to perform each task [17]. Children who were able to accurately combine the speed and the quality execution of skill components of the assessment obtained the highest MC score. The same researcher analyzed the test recorded to video throughout to minimize interobserver variability. The intra-subject coefficient of variation for measurements was found to be less than 6%.

2.2.3. Physical Fitness

The physical fitness index (PFI) was used, and included the following: cardiorespiratory fitness, upper body muscular strength, lower body muscular strength, and speed-agility [11].
Cardiorespiratory fitness (CRF) was assessed by means of a ½-mile run test [18]. The aim of this test was to complete the 800 m course, around 2 cones placed 40m apart, in the quickest possible time. The total time taken to run ½ mile was recorded. Lower times indicate better fitness.
Upper-body muscular strength (UBMS) was evaluated using a handgrip strength test [19]. Children gradually squeezed an analog dynamometer (TKK 5001, Grip-A, Takei, Tokyo, Japan) for at least 5 s. The grip span was set at 5.0 cm. Each hand was tested twice, with the highest value for each hand recorded. The sum of these two values was then used to determine upper-body muscular strength.
Lower-body muscular strength (LBMS) was measured using the standing long jump test [20]. The children performed two jumps, aiming to jump as far as possible with their feet together while maintaining an upright position. Then, the distance jumped from the jump point to the heels was measured, and the best trial of two attempts was evaluated.
Speed-Agility (SP) was assessed using the 10 × 5 m shuttle test [20]. In this assessment, children were required to sprint as quickly as possible between two lines spaced 5 m apart, covering a total distance of 50 m. Lower times corresponded to better performance. The test was conducted twice, with a 3 min rest between trials, and the fastest time was used for analysis.
The physical fitness index (PFI) included the following: cardiorespiratory fitness, upper-body muscular strength, lower-body muscular strength, and speed-agility [11]. It was calculated as the sum of each item score for the four physical fitness tasks. Standardized scores (z-scores) were calculated based on the mean of the entire sample within the same age group. To ensure that higher scores consistently represented better performance, the z-scores were adjusted accordingly. Each participant’s total test score was determined as the average z-score across all test items they successfully completed [21].

2.3. Data Analysis

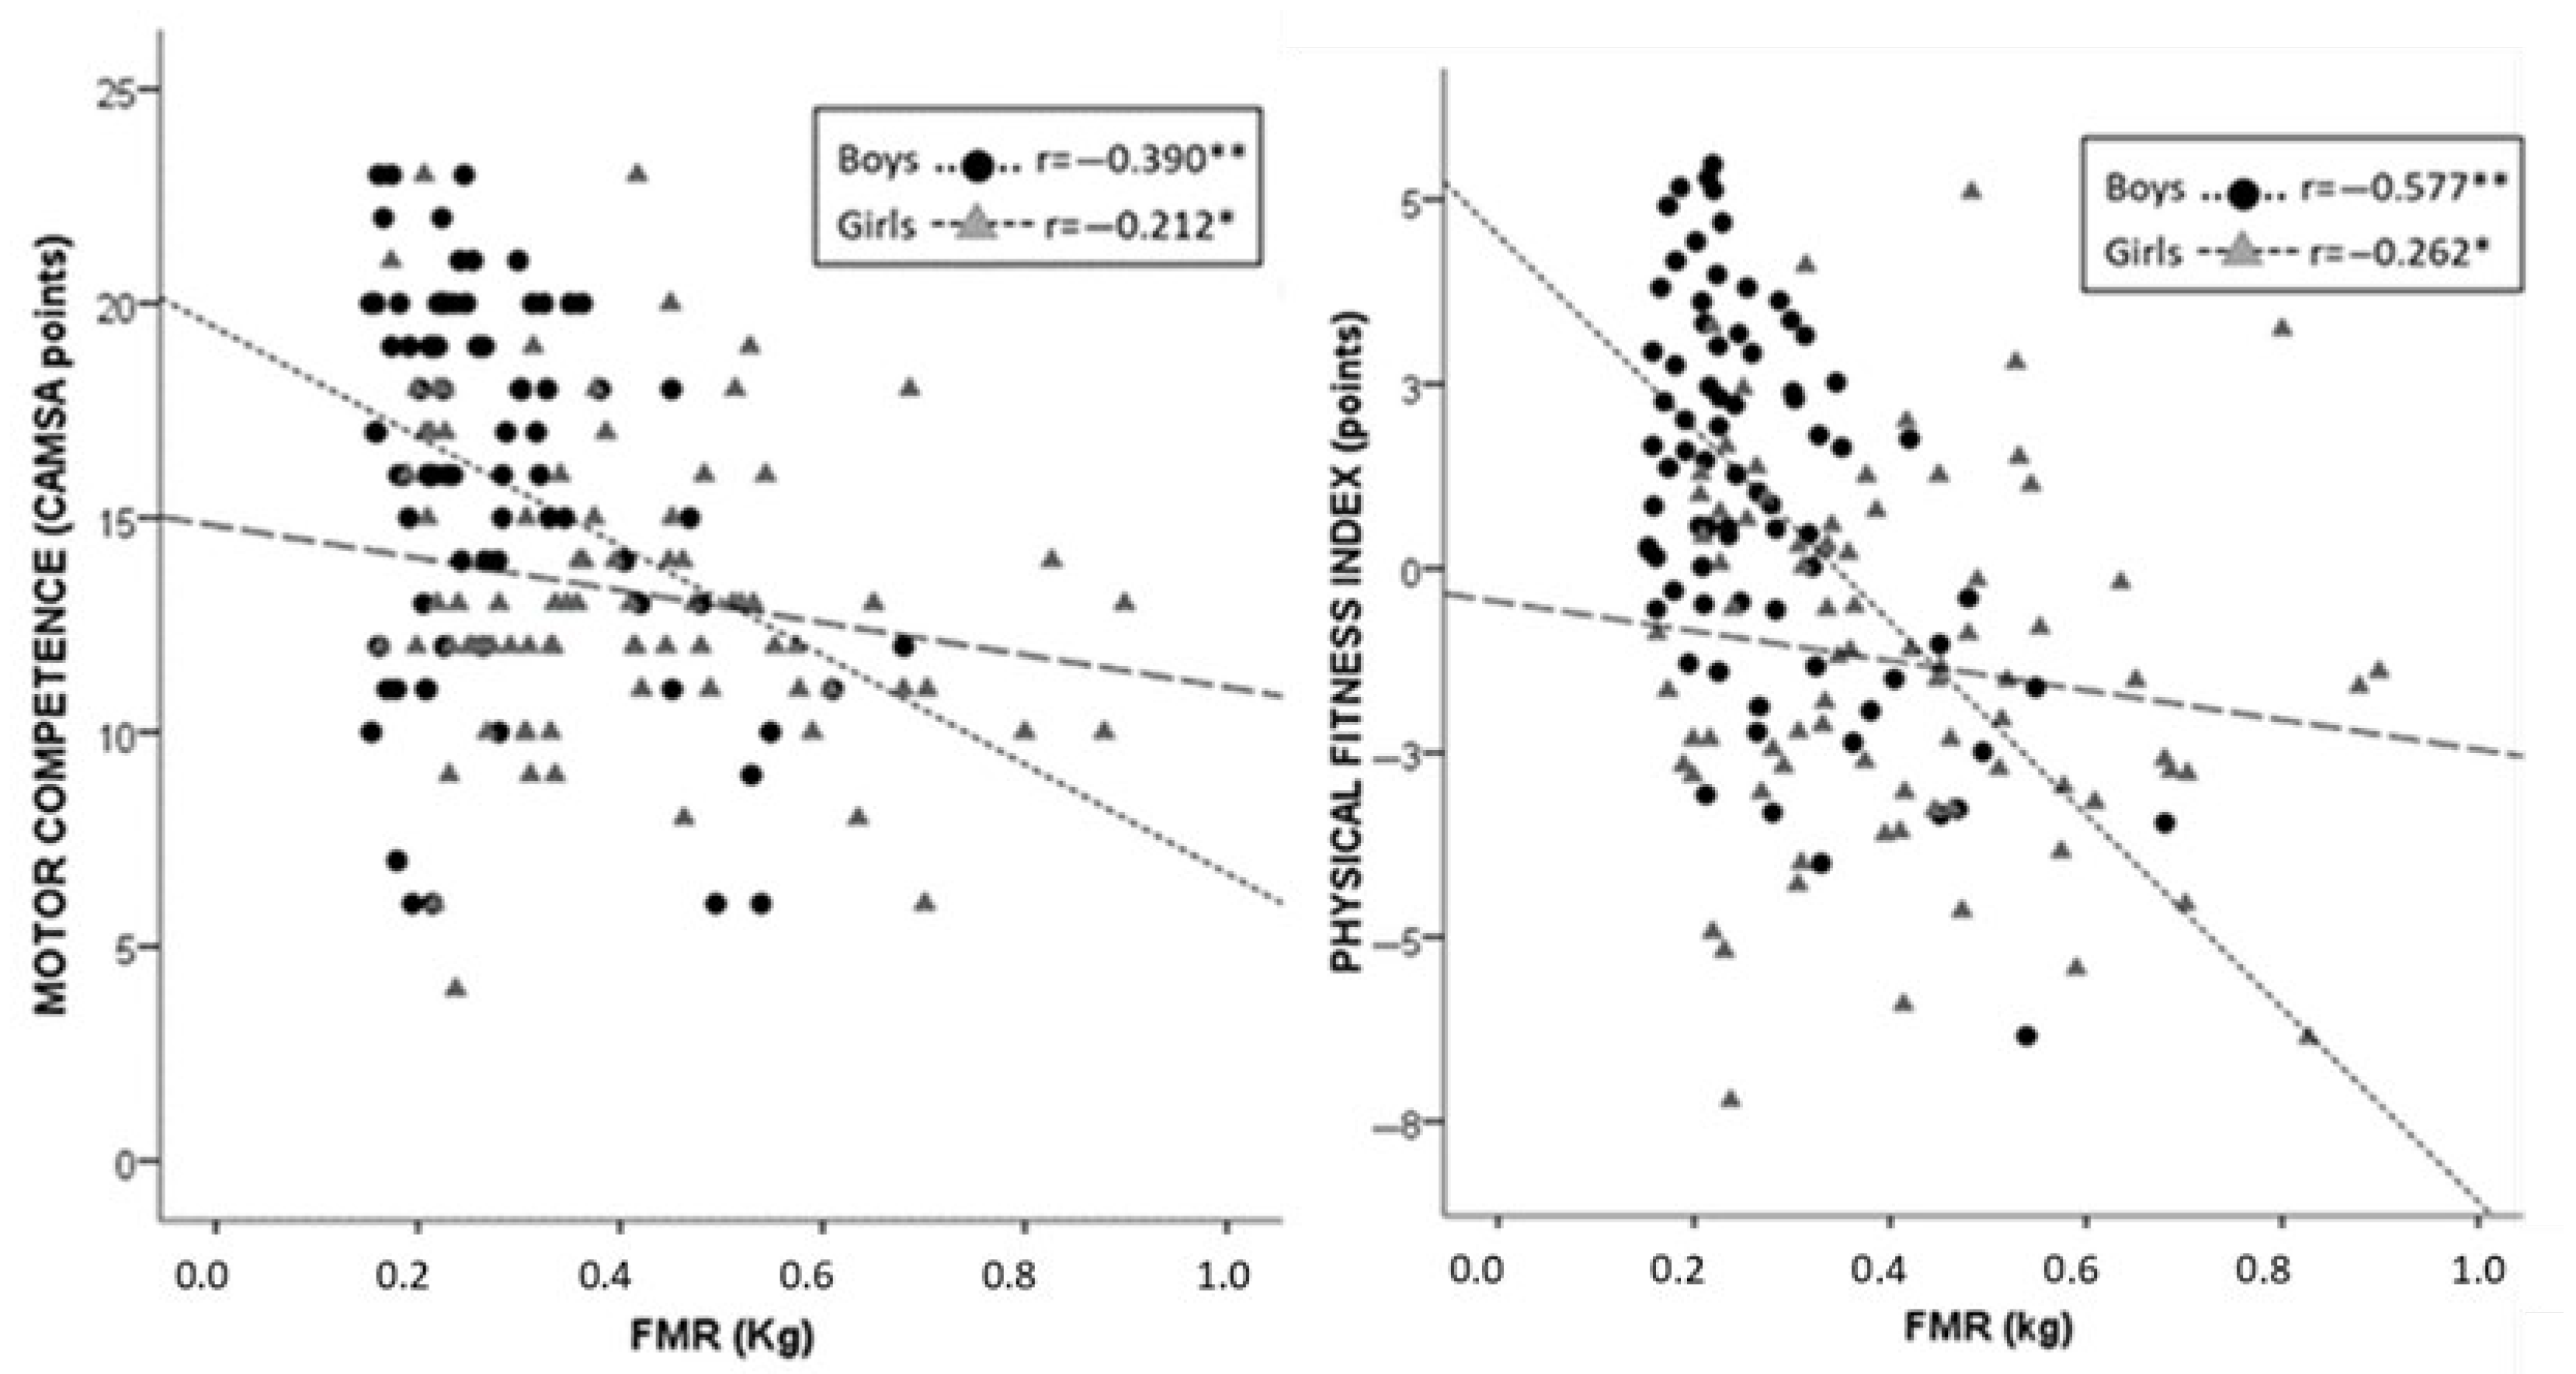
For the descriptive analysis, we computed the measures of central tendency and statistical dispersion for quantitative variables. Additionally, we assessed Cohen’s d to measure the standardized difference between two means (d in the results section). FMR level differences were analyzed by the t-test. In order to further explore the results according to FMR levels, the sample was split into two groups using the median value. To analyze the correlations in all children between body composition (FMR, WC, and BMI), MC and PFI, Pearson’s correlation was used. A linear regression analysis was performed to adjust for known body composition parameters (FMR, WC, BMI) as independent variables according to sex, PFI and MC. Scatter plots are presented to show the association between PFI and MC, as well as that between MC and FMR among the sexes. Finally, the histogram shows the motor competence and physical fitness index frequencies among the FMR levels. The significance level was set at p < 0.05. Statistical analyses were performed using SPSS version 29 (SPSS Inc., Chicago, IL, USA).

3. Results

3.1. Sample Participants

Table 1 shows anthropometric data as well as MC and PF results for the 164 children included in the study (81 boys and, 83 girls). Girls had a higher fat mass (p = 0.04, d = 1.92) and FMR (p < 0.01, d = 0.90) but lower muscle mass (p < 0.01, d = 2.32) and MC (p < 0.01, d = 0.65) when compared with boys. Girls had worse physical conditions, showing lower cardiorespiratory fitness (p < 0.01; d = 0.64), lower body muscle strength (p < 0.01; d = 0.61), lower speeds (p < 0.01; d = 0.80) and lower PFI compared to boys (p < 0.01; d = 0.94).

3.2. Associations Between Body Composition, Motor Competence and Physical Fitness Index

Table 2 shows that the FMR, WC and BMI correlate negatively with MC (all between r ≤ −0.333 and −0.183 and p < 0.05) and PFI (all between r ≤ −0.410 and −0.246 and p < 0.05) in all children. However, the associations are stronger for FMR, which, unlike WC and BMI, takes muscle mass into consideration.
Furthermore, Figure 2 shows that FMR is more strongly correlated with MC (r = −0.390, p < 0.01) and PFI (r = −0.577, p < 0.01) in boys than in girls. Therefore, the correlation between FMR and MC and PF is modulated by sex.
According to the regression analyses, after adjusting for sex and age, FMR is independently associated with MC and PFI, explaining 15,8% (p = 0.01) and 26,5% (p < 0.01) of its variability, respectively (Table 3A). In the same way, WC is independently associated with MC and PFI, explaining 15.0% (p = 0.01) and 25.6% (p < 0.01) of its variability, respectively (Table 3B). Finally, BMI is independently associated with MC and PFI, explaining 13.9% (p = 0.03) and 28.4% (p < 0.01) of its variability, respectively (Table 3C). Furthermore, in three models, sex is an independent variable for MC (p < 0.05) and PFI (p < 0.01). Interestingly, only FMR is independently and negatively associated with MC and PFI, explaining 12.6% (p < 0.01) and 20.9% (p < 0.01) of its variance, respectively (Table 3D).

3.3. FMR Does Not Modify the Associations Between MC and PFI

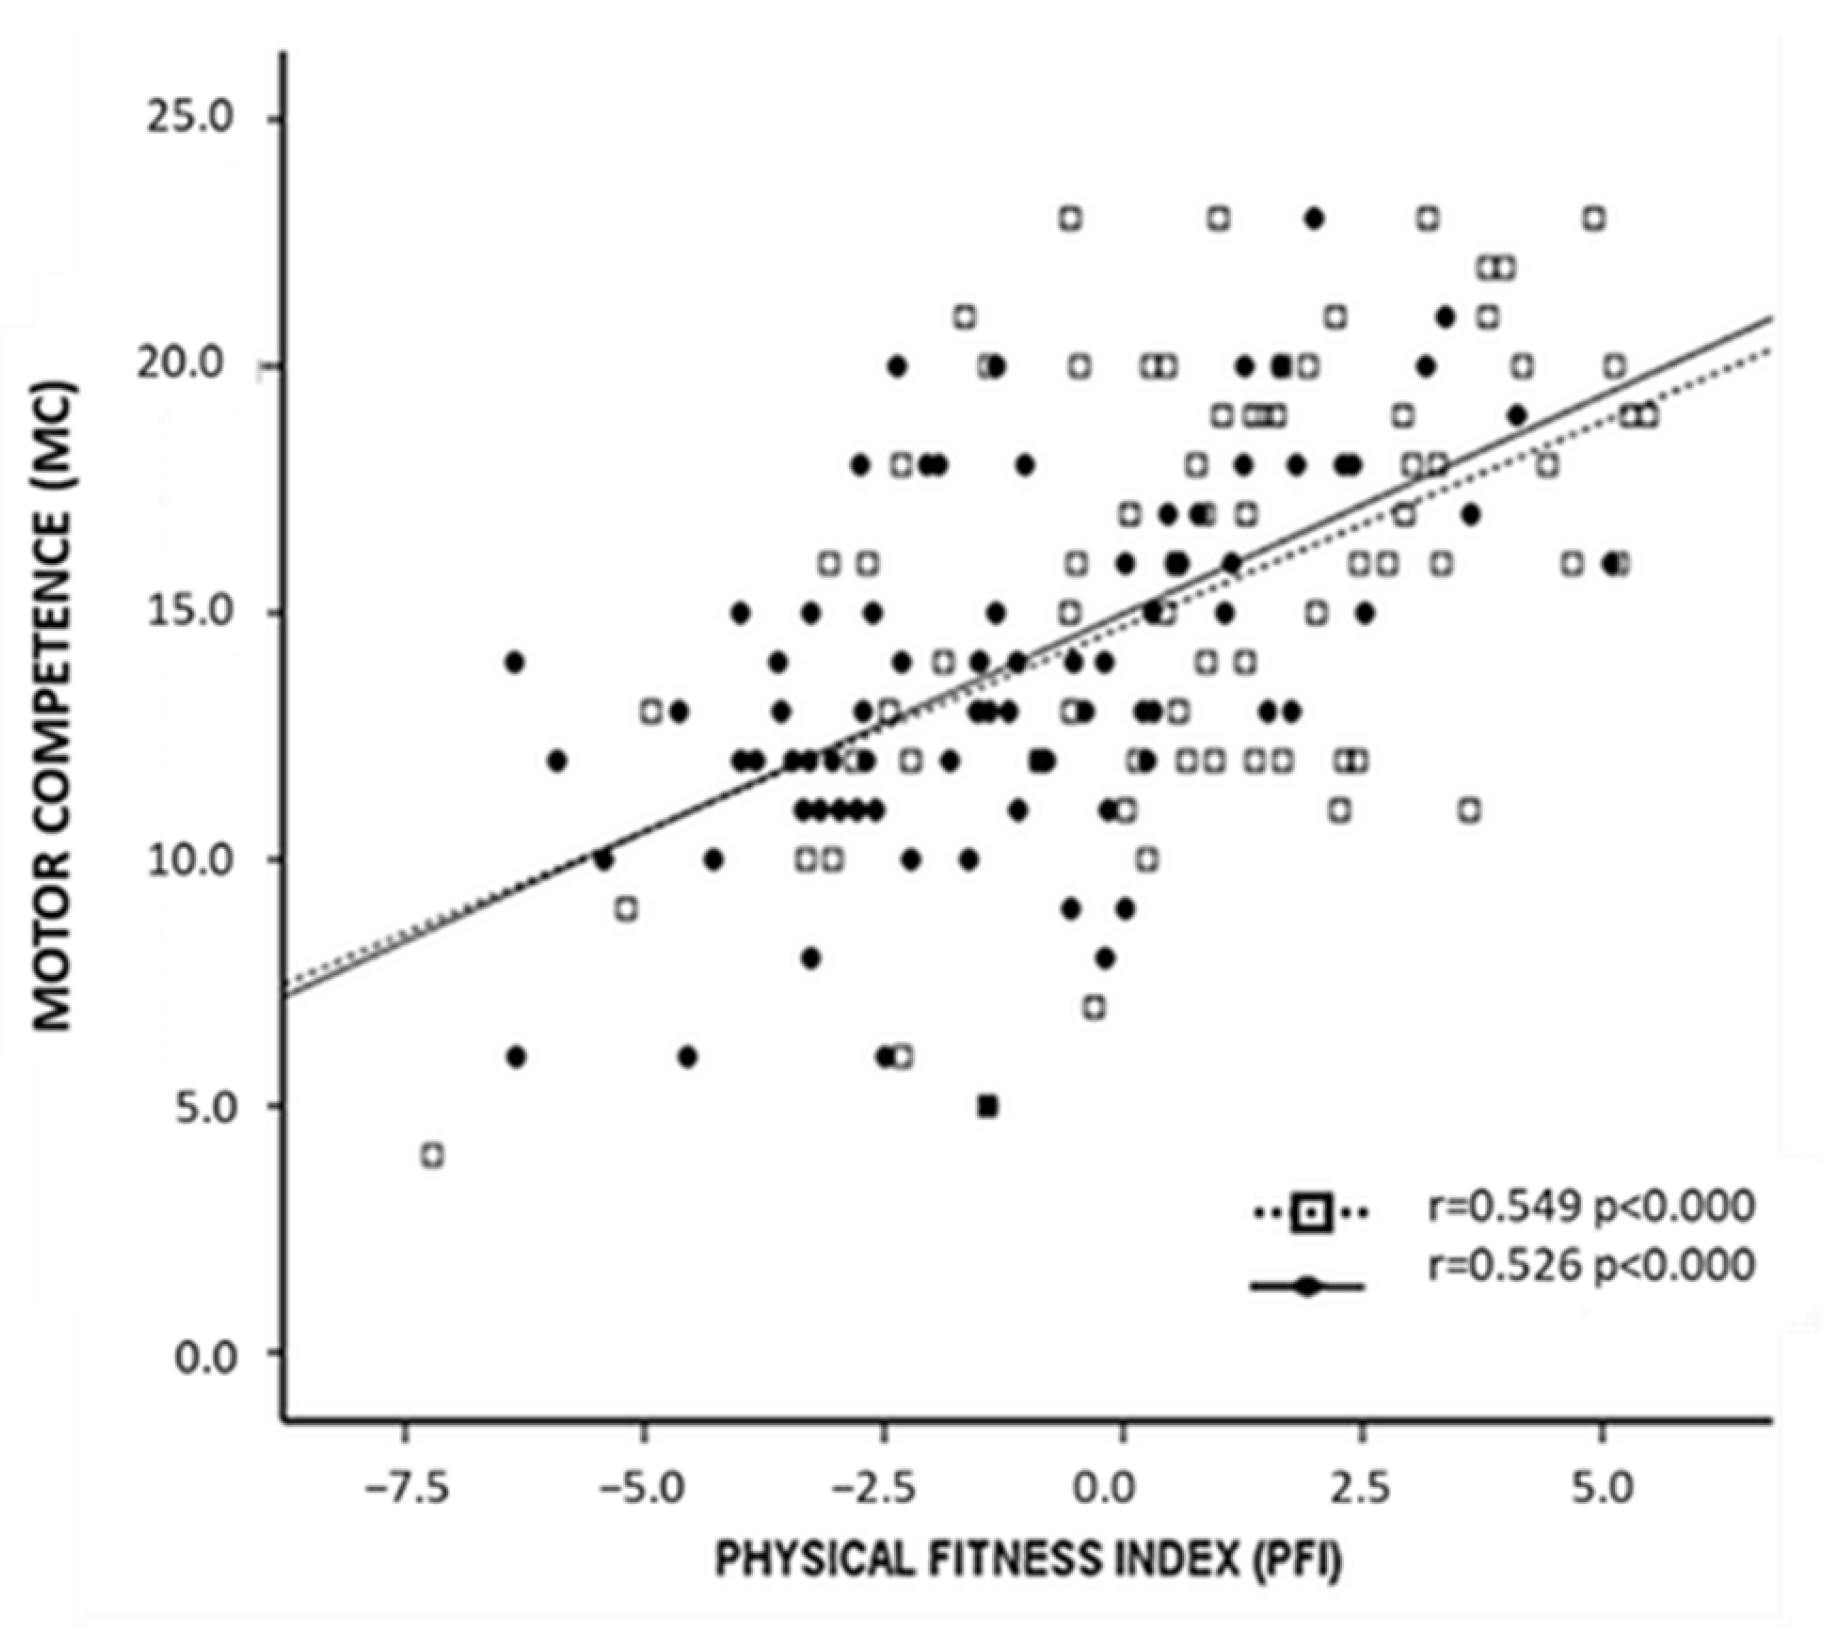
Figure 3 depicts the association between PFI and MC. As can be seen, the association is not modified by FMR levels, since in both groups, the association is statistically significant in children with high FMRs (r = 0.526; p < 0.01) and in the children with low FMRs (r = 0.549; p < 0.01).
However, the t-test (Table 4) and histogram (Figure 4) showed that children with higher FMRs have lower MC (p = 0.01) and PFI (p < 0.01). With regard to, the diminished PFI in children with higher FMRs was only maintained in boys (p = 0.01).

4. Discussion

The main findings of the present study were that FMR, compared to WC and BMI, showed the strongest association with MC and PFI in all children. The association between MC and PFI was positive despite the FMR. However, children with higher FMRs showed lower MC and PFI.

4.1. Relations Between Body Composition, Motor Competence and Physical Fitness Index

Our results showed that FMR is more strongly and negatively related to MC and PFI than WC and BMI. Traditional anthropometric indicators, such as BMI and WC, measure body fat. However, the differences in BMI in overweight/obese young people are mainly explained by the fat mass [6]; on the other hand, in thinner children, the differences in BMI may be largely due to lean mass [22], including body water, smooth and skeletal muscle mass, and bones [23]. WC assesses central body fatness. Both, even if they are the most commonly used in relation to health, only consider the effect of fat on metabolism, ignoring other tissues, such as skeletal muscle [24].
Fat mass is known to provide important information about body fat gain and is associated with an increased risk of diseases such as obesity, cardiovascular disease, type 2 diabetes, and hypertension, among others [25]. Likewise, skeletal muscle provides information about physical performance [26], posture maintenance, and body movement in adults, children, and adolescents [27]. In addition, fat-free mass with a high amount of muscle mass has been shown to reduce the negative results of fat mass [24].
Skeletal muscle constitutes approximately 40% of total body mass and plays a pivotal role in metabolic health, not only by regulating lipid and glucose metabolism [28] but also by producing myokines, which are partly dependent on skeletal muscle contraction [29]. As a contractile tissue, muscles facilitate neuromuscular activities such as motor skills, which are crucial for motor competence and physical fitness. Moreover, muscle function is understood not in isolation but within the framework of the bone–muscle–fat crosstalk, where the metabolic interactions among these tissues are interdependent, and mediated by autocrine, paracrine, and endocrine mechanisms [24]. Excess fat mass is known to affect bone metabolism both positively and negatively. On a positive note, adipose tissue acts as an endocrine regulator, secreting hormones and cytokines that can influence bone metabolism, particularly during early childhood. However, over time, this relationship weakens and reverses, with excess fat mass—especially when accompanied by adverse metabolic changes—contributing to negative effects on skeletal structure and strength, in addition to increasing the mechanical load on bones [30].
Multiple factors influence PFI, but one of the strongest is skeletal muscle function, not just because of the increased energy consumption, but also due to the amount of muscle mass that generates intensive crosstalk between organs and tissues, partly through the secretion of myokines. Some examples are (a) muscle–muscle crosstalk, explained by Musclin, LIF, IL-4, IL-6, IL-7, and IL-15 promoting muscle hypertrophy, and Myostatin which inhibits muscle hypertrophy; (b) muscle–brain crosstalk induced by Cathepsin B and Irisin, which cross the blood–brain barrier and stimulate BDNF production, leading to hippocampal neurogenesis, involved in the voluntary movement, and IL-6, stimulating appetite, therefore promoting energy gain; (c) muscle–adipose crosstalk, for lipolysis and for achieving decreased visceral fat mass through IL-6, with Irisin, meteorin-like, and IL-6 also having a role in the “browning” of white adipose tissue; (d) muscle–bone crosstalk, which is closely related with Decorin, IL-6, IGF-1, and FGF-2, which positively regulate bone formation; and finally, (e) muscle–gut crosstalk, involving Angiogenin, osteoprotegerin, and IL-6 possess pancreatic β-cell protective actions, and IL-6, which increases insulin secretion from the intestine [31]. We herein show that FMR could be the most valid body composition predictor, in relation to MC and PFI, because it includes both, fat and skeletal muscle tissue.
Despite the substantial influence of both motor competence (MC) and physical fitness (PFI) on weight trajectories over time, the direction and magnitude of these relationships remain unclear [14]. Our results indicate that the fat mass ratio (FMR) explains greater variability in MC and PFI compared to waist circumference (WC) and body mass index (BMI). Since seven-year-old children are in the prepubertal stage, sex differences in fat and muscle mass accumulation due to hormonal influence are not yet present [32]. However, sexual dimorphism in fat distribution and adiposity can be observed at as early as 7 years of age, with girls generally having higher fat mass and boys exhibiting greater lean body mass [33]. These differences may influence motor competence and physical fitness, as boys’ higher lean mass could enhance performance in dynamic motor tasks, while the greater fat mass in girls may present challenges in similar activities. In the same way, our findings show that FMR is lower in boys than in girls, while both PFI and MC being higher in boys.
A systematic review by Bolger et al. [34] concludes that, although biological factors contribute to MC development, gender differences in physical fitness and skill acquisition are significantly influenced by environmental and behavioral factors. Telford et al. [35] highlight that physical activity and sports experiences differ between boys and girls, with boys engaging in more frequent and vigorous activities. Additionally, boys are more involved in activities that emphasize object control, such as ball games and throwing exercises, while girls tend to participate more in activities focused on balance and coordination in locomotion skills [36]. Interestingly, the components of motor competence that best predict health-related fitness, including body weight trajectories, also vary by gender. For girls, locomotor skills are the most consistent predictors of overall physical fitness, while boys show strong associations between both locomotor and manipulative skills [37].

4.2. The Associations Between MC and PFI in Acordance with FMR

Studies assessing body weight status with MC and PFI show that parameters based on fat accumulation—BMI and WC values—are negatively correlated with PFI and MC [4,6,38]. Our results align with previous findings, and add to the research by showing that the association between MC and PFI is positive despite the FMR.
There is strong evidence for a positive association between MC and PF, specifically musculoskeletal fitness (strength) and cardiorespiratory fitness (endurance) [39]. This is because mastery of MC in a vigorous physical activity context (eg. sport) requires a high level of PF, including endurance (CRF), strength (UBMS, LBMS), and speed–agility [40]. The relative importance of these physical qualities depends on the skills (locomotion and control skills) involved in each particular action. Considering that MC is a complex parameter, defined as the sum of skills required to adapt to an environment, Barnett et al. [41] showed that healthy weight status is related to only certain MC skills. Children with a higher fat mass than muscle mass could face more difficulties with this functional movement. For example, excessive fat mass might be a morphological constraint hindering efficient locomotor performance because it makes it difficult to transport the body through space. On the other hand, object manipulation performance might not be significantly predicted through body composition when it is not performed simultaneously with locomotion skills. Cattuzzo et al. [4] state that the development of motor competence is linked directly to neuromuscular function and physiological adaptations, and is indirectly conditioned via physical activity participation and other factors.
In this way, children with mastery in MC could have more muscle mass and better muscular function (biomechanics and metabolic), which may support their skeletal structures and regulate the intensive crosstalk between muscle, bone and fat metabolism through myokines, osteokines and adipokines [24], implying increases in PFI and metabolic health parameters. This is consistent with our evidence, which shows that MC is positively associated with PFI independently of the FMR level, and that children with higher FMRs show lower levels of MC and PFI.
The abovementioned results may suggest another paradigm based on the FMR. In our proposal, the role of skeletal muscle contraction is a determining factor regarding increasing physical fitness and health, because of the production of myokines [29]. Skeletal muscle is recognized as a highly energy-demanding tissue, significantly contributing to the basal metabolic rate. Enhancing muscular fitness may indicate increases in skeletal muscle mass, improvements in muscle metabolic efficiency (such as enhanced lipid oxidation and glucose transport capacity), or a combination of both, leading to higher total daily energy expenditure [42].
These results suggest that improving motor competence could be a regulator of body composition. The underlying explanations could be related to (a) the improvement in the skeletal muscle’s efficiency (metabolic) and efficacy (neuromuscular), and (b) the mastery of motor skills, which will provide an individual the opportunity to participate in moderate and vigorous physical activity contexts that are highly metabolically demanding.

4.3. Featured Applications

Therefore, educational programs should design interventions aimed at improving motor competence, with a focus on muscular coordination and strength. Integrated neuromuscular training, centered on fundamental motor skills, could be an effective strategy for regulating body composition in 7-year-old children. Additionally, gender and contextual sports opportunities should be considered to tailor physical exercise programs to individual needs.

4.4. Limitations

The results of this study should be interpreted in light of two main limitations. First, the sample is relatively homogeneous, as all children live in Salt and Cassà de la Selva and are of the same age, which limits the generalizability of the findings to other populations. Second, this study used two-frequency bioimpedance devices—offering more detailed measurements than single-frequency devices—and accounted for factors influencing the results (such as body temperature, hydration status, and physical activity). However, other body composition methods should be used to complement the measurements of fat and muscle mass.

5. Conclusions

In conclusion, although BMI and waist circumference are usually used to measure weight status, FMR may be the best body composition parameter related to MC and PFI. Despite the association between MC and PFI not being modulated by FMR, children with higher FMRs show lower levels of MC and PFI. Further studies are needed to consider the interrelation between fat and muscle mass with regard to improvements in MC, PF, and body composition in 7-year-old children.

Author Contributions

Conceptualization, R.F.-L. and A.P.-P.; methodology, R.F.-L. and A.P.-P.; formal analysis, R.F.-L., V.L.-R., G.S., F.V., A.J.-P., J.H. and A.P.-P.; data curation, A.P.-P.; writing—original draft preparation, R.F.-L., V.L.-R., G.S., F.V., A.J.-P., J.H. and A.P.-P.; writing—review and editing, R.F.-L. and A.P.-P.; supervision, R.F.-L. and A.P.-P.; project administration, A.P.-P. All authors have read and agreed to the published version of the manuscript.

Funding

This research received no external funding. No financial or material support of any kind was received for the work described in this article.

Institutional Review Board Statement

This study was conducted according to the guidelines of the Declaration of Helsinki, and approved by the Institutional Review Board of Dr. Josep Trueta Hospital (Cód. Competencia motricitat, approved July 2016. Final approval FIP V5:13/10/17).

Informed Consent Statement

Informed consent was obtained from participants and their parents involved in the study. Written informed consent was obtained from the patient(s) to publish this paper.

Data Availability Statement

The original contributions presented in this study are included in the article. Further inquiries can be directed to the corresponding author.

Acknowledgments

This study was undertaken in the University School of Health and Sport (EUSES). The authors thank the following for their assistance and contribution to the development and achievement of this research: Heads and Physical Education teachers of schools, children and their families, and all volunteers who participated in this study.

Conflicts of Interest

The authors declare that they have no known competing financial interests or personal relationships that could have appeared to influence the work reported in this paper.

References

  1. Chen, Y.Y.; Fang, W.H.; Wang, C.C.; Kao, T.-W.; Yang, H.-F.; Wu, C.-J.; Sun, Y.-S.; Wang, Y.-C.; Chen, W.-L. Fat-to-muscle ratio is a useful index for cardiometabolic risks: A population-based observational study. PLoS ONE 2019, 14, e0214994. [Google Scholar] [CrossRef] [PubMed]
  2. Park, J.; Kim, S. Validity of muscle-to-fat ratio as a predictor of adult metabolic syndrome. J. Phys. Ther. Sci. 2016, 28, 1036–1045. [Google Scholar] [CrossRef] [PubMed]
  3. McCarthy, H.D.; Samani-Radia, D.; Jebb, S.A.; Prentice, A.M. Skeletal muscle mass reference curves for children and adolescents. Pediatr. Obes. 2014, 9, 249–259. [Google Scholar] [CrossRef] [PubMed]
  4. Cattuzzo, M.T.; Dos Santos Henrique, R.; Ré, A.H.; de Oliveira, I.S.; Melo, B.M.; Moura, M.D.S.; de Araújo, R.C.; Stodden, D. Motor competence and health related physical fitness in youth: A systematic review. J. Sci. Med. Sport 2016, 19, 123–129. [Google Scholar] [CrossRef] [PubMed]
  5. Lubans, D.R.; Morgan, P.J.; Cliff, D.P.; Barnett, L.M.; Okely, A.D. Fundamental movement skills in children and adolescents: Review of associated health benefits. Sports Med. 2010, 40, 1019–1035. [Google Scholar] [CrossRef]
  6. Okely, A.D.; Booth, M.L.; Chey, T. Relationships between body composition and fundamental movement skills among children and adolescents. Res. Q. Exerc. Sport 2004, 75, 238–247. [Google Scholar] [CrossRef]
  7. Smith, J.J.; Eather, N.; Morgan, P.J.; Plotnikoff, R.C.; Faigenbaum, A.D.; Lubans, D.R. The health benefits of muscular fitness for children and adolescents: A systematic review and meta-analysis. Sports Med. 2014, 44, 1209–1223. [Google Scholar] [CrossRef]
  8. American College Sports Medicine. ACSM’s Health-Related Physical Fitness Assessment Manual, Lippincott Williams & Wilkins: Philadelphia, PA, USA, 2010.
  9. Connolly, K.; Bruner, J.S. The Growth of Competence; Academic Press: London, UK, 1973. [Google Scholar]
  10. Robinson, L.E.; Stodden, D.F.; Barnett, L.M.; Lopes, V.P.; Logan, S.W.; Rodrigues, L.P.; D’Hondt, E. Motor Competence and its Effect on Positive Developmental Trajectories of Health. Sports Med. 2015, 45, 1273–1284. [Google Scholar] [CrossRef]
  11. Ortega, F.B.; Ruiz, J.R.; Castillo, M.J.; Sjöström, M. Physical fitness in childhood and adolescence: A powerful marker of health. Int. J. Obes. 2008, 32, 1–11. [Google Scholar] [CrossRef]
  12. Riso, E.M.; Toplaan, L.; Viira, P.; Vaiksaar, S.; Jürimäe, J. Physical fitness and physical activity of 6-7-year-old children according to weight status and sports participation. PLoS ONE 2019, 14, e0218901. [Google Scholar] [CrossRef]
  13. Ruiz, J.R.; Castro-Piñero, J.; Artero, E.G.; Ortega, F.B.; Sjöström, M.; Suni, J.; Castillo, M.J. Predictive validity of health-related fitness in youth: A systematic review. Br. J. Sports Med. 2009, 43, 909–923. [Google Scholar] [CrossRef] [PubMed]
  14. Stodden, D.F.; Gao, Z.; Goodway, J.D.; Langendorfer, S.J. Dynamic relationships between motor skill competence and health-related fitness in youth. Pediatr. Exerc. Sci. 2014, 26, 231–241. [Google Scholar] [CrossRef] [PubMed]
  15. Font-Lladó, R.; López-Ros, V.; Montalvo, A.M.; Sinclair, G.; Prats-Puig, A.; Fort-Vanmeerhaeghe, A. A Pedagogical Approach to Integrative Neuromuscular Training to Improve Motor Competence in Children: A Randomized Controlled Trail. J. Strength Cond. Res. 2020, 34, 3078–3085. [Google Scholar] [CrossRef] [PubMed]
  16. Agarwal, S.K.; Misra, A.; Aggarwal, P.; Bardia, A.; Goel, R.; Vikram, N.K.; Wasir, J.S.; Hussain, N.; Ramachandran, K.; Pandey, R.M. Waist circumference measurement by site, posture, respiratory phase, and meal time: Implications for methodology. Obesity 2009, 17, 1056–1061. [Google Scholar] [CrossRef]
  17. Longmuir, P.E.; Boyer, C.; Lloyd, M.; Borghese, M.M.; Knight, E.; Saunders, T.J.; Boiarskaia, E.; Zhu, W.; Tremblay, M.S. Canadian Agility and Movement Skill Assessment (CAMSA): Validity, objectivity, and reliability evidence for children 8–12 years of age. J. Sport Health Sci. 2017, 6, 231–240. [Google Scholar] [CrossRef]
  18. Castro-Piñero, J.; Ortega, F.B.; Mora, J.; Sjöström, M.; Ruiz, J.R. Criterion related validity of 1/2 mile run-walk test for estimating VO2peak in children aged 6-17 years. Int. J. Sports Med. 2009, 30, 366–371. [Google Scholar] [CrossRef]
  19. Gulías-González, R.; Sánchez-López, M.; Olivas-Bravo, Á.; Solera-Martínez, M.; Martínez-Vizcaíno, V. Physical fitness in Spanish schoolchildren aged 6–12 years: Reference values of the battery EUROFIT and associated cardiovascular risk. J. Sch. Health 2014, 84, 625–635. [Google Scholar] [CrossRef] [PubMed]
  20. Eurofit. Eurofit Tests of Physical Fitness, 2nd ed.; Eurofit: Strasbourg, France, 1993. [Google Scholar]
  21. Henriksson, P.; Leppänen, M.H.; Henriksson, H.; Nyström, C.D.; Cadenas-Sanchez, C.; Ek, A.; Ruiz, J.R.; Ortega, F.B.; Löf, M. Physical fitness in relation to later body composition in pre-school children. J. Sci. Med. Sport 2019, 22, 574–579. [Google Scholar] [CrossRef]
  22. Freedman, D.S.; Wang, J.; Maynard, L.M.; Thornton, J.C.; Mei, Z.; Pierson, R.N.; Dietz, W.H.; Horlick, M. Relation of BMI to fat and fat-free mass among children and adolescents. Int. J. Obes. 2005, 29, 1–8. [Google Scholar] [CrossRef] [PubMed]
  23. Xiao, J.; Purcell, S.A.; Prado, C.M.; Gonzalez, M.C. Fat mass to fat-free mass ratio reference values from NHANES III using bioelectrical impedance analysis. Clin. Nutr. 2018, 37 Pt A, 2284–2287. [Google Scholar] [CrossRef]
  24. Kirk, B.; Feehan, J.; Lombardi, G.; Duque, G. Muscle, Bone, and Fat Crosstalk: The Biological Role of Myokines, Osteokines, and Adipokines. Curr. Osteoporos. Rep. 2020, 18, 388–400. [Google Scholar] [CrossRef] [PubMed]
  25. Wijayatunga, N.N.; Dhurandhar, E.J. Normal weight obesity and unaddressed cardiometabolic health risk-a narrative review. Int. J. Obes. 2021, 45, 2511. [Google Scholar] [CrossRef] [PubMed]
  26. Poortmans, J.R.; Boisseau, N.; Moraine, J.J.; Moreno-Reyes, R.; Goldman, S. Estimation of total-body skeletal muscle mass in children and adolescents. Med. Sci. Sports Exerc. 2005, 37, 316–322. [Google Scholar] [CrossRef]
  27. Sayer, A.A.; Syddall, H.; Martin, H.; Patel, H.; Baylis, D.; Cooper, C. The developmental origins of sarcopenia. J. Nutr. Health Aging 2008, 12, 427–432. [Google Scholar] [CrossRef]
  28. Brüning, J.C.; Michael, M.D.; Winnay, J.N.; Hayashi, T.; Hörsch, D.; Accili, D.; Goodyear, L.J.; Kahn, C. A muscle-specific insulin receptor knockout exhibits features of the metabolic syndrome of NIDDM without altering glucose tolerance. Mol. Cell 1998, 2, 559–569. [Google Scholar] [CrossRef]
  29. Reid, K.F.; Fielding, R.A. Skeletal muscle power: A critical determinant of physical functioning in older adults. Exerc. Sport Sci. Rev. 2012, 40, 4–12. [Google Scholar] [CrossRef]
  30. Dimitri, P. Fat and bone in children—Where are we now? Ann. Pediatr. Endocrinol. Metab. 2018, 23, 62–69. [Google Scholar] [CrossRef]
  31. Severinsen, M.C.K.; Pedersen, B.K. Muscle-Organ Crosstalk: The Emerging Roles of Myokines. Endocr. Rev. 2021, 42, 97–99. [Google Scholar] [CrossRef]
  32. Malina, R.M.; Rogol, A.D.; Cumming, S.P.; Coelho e Silva, M.J.; Figueiredo, A.J. Biological maturation of youth athletes: Assessment and implications. Br. J. Sports Med. 2015, 49, 852–859. [Google Scholar] [CrossRef]
  33. Żegleń, M.; Kryst, Ł.; Kowal, M.; Woronkowicz, A. Sexual dimorphism of adiposity and fat distribution among children and adolescents (8–18 year olds) from Poland. Am. J. Hum. Biol. 2024, 36, e24046. [Google Scholar] [CrossRef]
  34. Bolger, L.E.; Bolger, L.A.; O’Neill, C.; Coughlan, E.; O’Brien, W.; Lacey, S.; Burns, C.; Bardid, F. Global levels of fundamental motor skills in children: A systematic review. J. Sports Sci. 2021, 39, 717–753. [Google Scholar] [CrossRef] [PubMed]
  35. Telford, R.M.; Telford, R.D.; Olive, L.S.; Cochrane, T.; Davey, R. Why Are Girls Less Physically Active than Boys? Findings from the LOOK Longitudinal Study. PLoS ONE 2016, 11, e0150041. [Google Scholar] [CrossRef] [PubMed]
  36. Zheng, Y.; Ye, W.; Korivi, M.; Liu, Y.; Hong, F. Gender Differences in Fundamental Motor Skills Proficiency in Children Aged 3–6 Years: A Systematic Review and Meta-Analysis. Int. J. Environ. Res. Public Health 2022, 19, 8318. [Google Scholar] [CrossRef] [PubMed]
  37. Luz, C.; Rodrigues, L.P.; Meester, A.; Cordovil, R. The relationship between motor competence and health-related fitness in children and adolescents. PLoS ONE 2017, 12, e0179993. [Google Scholar] [CrossRef] [PubMed]
  38. Haga, M. Physical fitness in children with high motor competence is different from that in children with low motor competence. Phys. Ther. 2009, 89, 1089–1097. [Google Scholar] [CrossRef]
  39. King-Dowling, S.; Proudfoot, N.A.; Cairney, J.; Timmons, B.W. Motor Competence, Physical Activity, and Fitness across Early Childhood. Med. Sci. Sports Exerc. 2020, 52, 2342–2348. [Google Scholar] [CrossRef]
  40. Wu, S.Y.; Jensen, J.L. Association Between Motor Competence and Percentage of Body Fat in Late Childhood: Comparing Proficiency in Fundamental Motor Skills and Advanced Movement Skills. Child. Obes. 2023, 19, 452–460. [Google Scholar] [CrossRef]
  41. Barnett, L.; Hinkley, T.; Okely, A.D.; Salmon, J. Child, family and environmental correlates of children’s motor skill proficiency. J. Sci. Med. Sport. 2013, 16, 332–336. [Google Scholar] [CrossRef]
  42. Jaakkola, T.; Yli-Piipari, S.; Huhtiniemi, M.; Salin, K.; Seppälä, S.; Hakonen, H.; Gråstén, A. Longitudinal associations among cardiorespiratory and muscular fitness, motor competence and objectively measured physical activity. J. Sci. Med. Sport. 2019, 22, 1243–1248. [Google Scholar] [CrossRef] [PubMed]
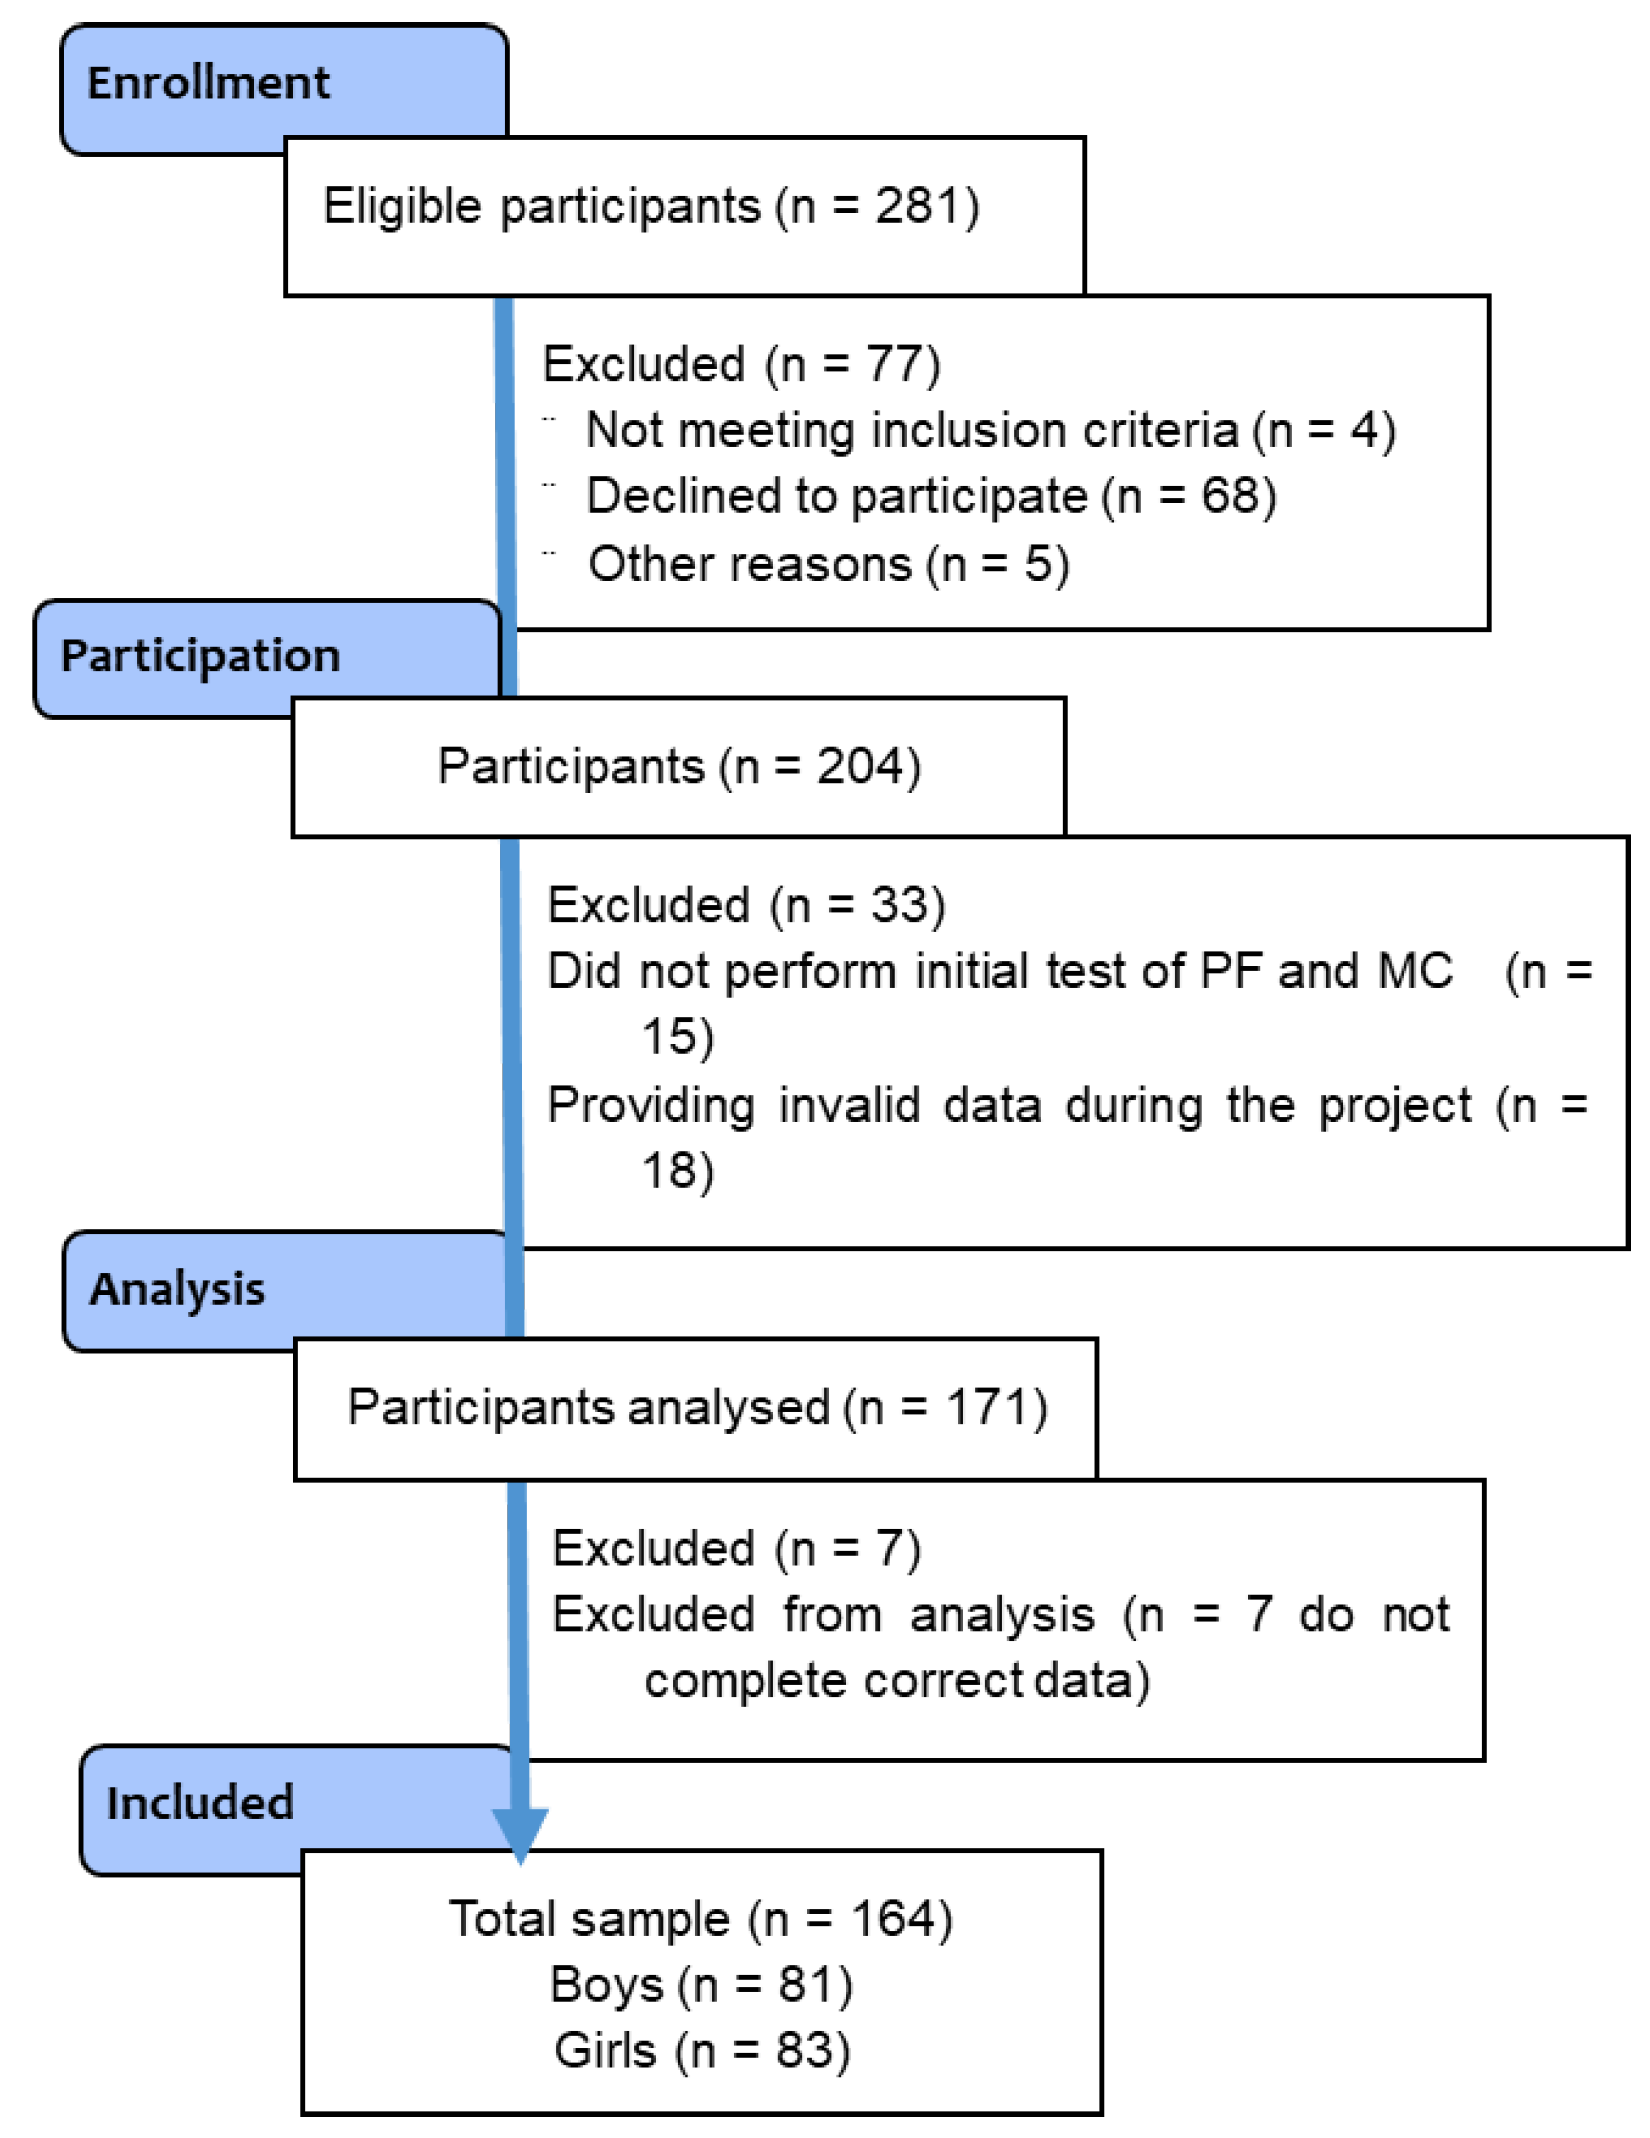
Figure 1. Flowchart diagram.
Applsci 15 01665 g001
Figure 2. Scatter plots for MC and FMR between sexes. p-values are from Pearson’s correlation. The significance level is set at ** p < 0.01 and * p < 0.05.
Applsci 15 01665 g002
Figure 3. Scatter plots for MC and PFI. Dotted and dashed lines depict children with high FMRs (above p50) while squares and straight lines depict children with low FMRs (below p50). p values are from Pearson’s correlation.
Applsci 15 01665 g003
Figure 4. Histogram for (A) motor competence among FMRs for all children; (B) physical fitness among to FMRs for all children; (C) physical fitness among FMRs in boys. p values are from the t-test.
Applsci 15 01665 g004
Table 1. Subjects’ characteristics.
Total (n = 164)Boys (n = 81)Girls (n = 83)p-Value
Age (years)7.41 ± 0.327.41 ± 0.327.41 ± 0.330.95
ANTHROPOMETRICS
Fat mass (Kg)5.63 ± 2.705.19 ± 2.276.07 ± 3.010.04
Muscle mass (kg)16.71 ± 2.5718.67 ± 1.6314.78 ± 1.72<0.01
FMR (Kg)0.34 ± 0.160.27 ± 0.110.40 ± 0.17<0.01
WC (cm)58.84 ± 6.1258.82 ± 6.058.86 ± 6.240.97
BMI_SDS (Kg/m2)−0.21 ± 0.84−0.23 ± 0.8−0.18 ± 0.880.06
MOTOR COMPETENCE
MC (CAMSA points)14.58 ± 4.1815.91 ± 4.3513.29 ± 3.59<0.01
PHYSICAL FITNESS
CRF (min)5.23 ± 0.764.98 ± 0.735.44 ± 0.70<0.01
UBMS (Kg)20.09 ± 4.3420.66 ± 3.8219.53 ± 4.670.09
LBMS (m)95.53 ± 16.60100.48 ± 17.4690.72 ± 14.23<0.01
SP (min)25.17 ± 2.5824.27 ± 2.3926.03 ± 2.47<0.01
PFI (points)−0.17 ± 2.740.97 ± 2.25−1.26 ± 2.46<0.01
Data are represented as mean ± SD. Differences between sex were examined by Student’s t-test. The significance level (p-value) is set at 0.05, and significant values are marked in bold. Abbreviations: FMR = fat-to-muscle ratio; WC = waist circumference; BMI_SDS: body mass index standardized; MC = motor competence; CRF = cardiorespiratory fitness; UBMS = upper-body muscular strength; LBMS= lower-body muscular strength; SP = speed; PFI = physical fitness index.
Table 2. Pearson’s correlation between body composition (FMR, WC and BMI), motor competence and physical fitness index in all children.
FMRWCBMI
Motor competence (CAMSA points)−0.333 **−0.192 *−0.183 *
Physical fitness index (points)−0.410 **−0.246 *−0.322 **
Pearson’s correlation was used. The significance level is set at ** p < 0.01, * p < 0.05, and significant values are marked in bold. Abbreviations: FMR = fat-to-muscle ratio; WC = waist circumference; BMI = body mass index.
Table 3. Linear regression analyses for PFI and MC as dependent variables (n = 164). (A) FMR as an independent variable; (B) WC as an independent variable; (C) BMI as an independent variable. (D) FMR, WC and BMI as independent variables.
(A)MCPFI
βpβp
Sex−0.2290.05−0.285<0.01
Age0.0830.260.1720.01
FMR−0.237<0.01−0.294<0.01
Total R20.1580.265
(B)MCPFI
βpβp
Sex−0.327<0.01−0.400<0.01
Age0.0790.290.1870.01
WC−0.1950.01−0.254<0.01
Total R20.1500.256
(C)MCPFI
βpβp
Sex−0.311<0.01−0.392<0.01
Age0.0920.230.1610.02
BMI−0.1650.03−0.292<0.01
Total R20.1390.284
(D)MCPFI
βpβp
FMR−0.571<0.01−0.621<0.01
WC0.0330.850.0880.59
BMI0.2680.170.1300.48
Total R20.1260.209
Linear regression analysis was used. p-values are from the linear regression analysis using the stepwise method. The significance level is set at 0.05, and significant values are marked in bold. Abbreviations: FMR = fat-to-muscle ratio; WC = waist circumference; BMI = body mass index; PFI = physical fitness index; MC = motor competence.
Table 4. t-test for motor competence and physical fitness index according to FMR level and sex.
Low FMR
n = 74
High FMR
n = 82
p
All childrenMC15.55 ± 4.5213.71 ± 3.660.01
PFI0.82 ± 2.64−1.08 ± 2.51<0.01
BoysMC16.10 ± 4.6015.73 ± 4.180.71
PFI2.04 ± 2.17−0.40 ± 2.500.01
GirlsMC13.29 ± 3.7813.30 ± 3.420.99
PFI−0.92 ± 2.35−1.61 ± 2.540.21
Differences between FMR groups were examined by Student’s t-test. The significance level (p-values) is set at 0.05, and significant values are marked in bold. Abbreviations: FMR = fat to muscle ratio; MC = motor competence; PFI = physical fitness index.
Disclaimer/Publisher’s Note: The statements, opinions and data contained in all publications are solely those of the individual author(s) and contributor(s) and not of MDPI and/or the editor(s). MDPI and/or the editor(s) disclaim responsibility for any injury to people or property resulting from any ideas, methods, instructions or products referred to in the content.