Abstract
The northwestern region of China is characterized by loess soil and seasonal permafrost. Due to the combined effects of its unique climate and precipitation patterns, local roads frequently suffer from issues such as foundation settlement, erosion, and collapse, which pose significant risks to both road construction and safe operation. This study examines a typical high subgrade in Northwest China, where a scaled laboratory model experiment was conducted. The research investigates the impact of water infiltration at the slope foot, under the dual influences of extreme cold and precipitation, on changes in the internal moisture field and settlement deformation characteristics of both the foundation and subgrade. The results indicate that the variation in moisture content across the section follows an arc-shaped diffusion pattern. Settlement is influenced by both the amount of infiltrated water and cold air, with a noticeable lag effect. A settlement of 0.1 cm is considered the threshold for significant impact, with the minimum observed lag period approaching 4 days. The settlement is concentrated in the slope region, exhibiting a bending failure pattern. Numerical simulations reveal that the cross-sectional settlement distribution forms an inverted “S” shape, and the cumulative moisture content at each monitoring point exhibits a quadratic relationship with the cumulative settlement. The findings of this study provide scientific guidance and technical references for road construction and safe operation in the seasonal permafrost regions of Northwest China.
Keywords:
loess; permafrost; precipitation; subgrade; foundation; moisture field; settlement deformation 1. Introduction
The condition of loess subgrade is primarily influenced by both human and natural factors. Among the natural factors, infiltration caused by atmospheric precipitation, slope collapse, pavement cracking, and similar issues are key contributors [1,2,3,4]. Subgrades, particularly under the combined influence of external factors such as load, rainfall, and temperature, are prone to various forms of damage, including pits, arches, joint steps, and settlement at the bridge head or culvert ends [5,6,7]. These issues significantly impair the normal functioning of highways, leading to substantial economic losses and even casualties. Infiltration due to external precipitation is one of the most severe factors, particularly at the foot and side slopes [8,9].
Loess, a common material used for subgrade filling, undergoes significant structural changes and strength reduction after flooding, which poses substantial safety risks to road construction and operation [10,11,12,13]. As a result, scholars have conducted extensive research on the characteristics of loess subgrade following water seepage. Jiang et al. [14] investigated the water stability and permeability of loess at varying compaction levels. The results indicate that increasing the compaction degree significantly enhances the loess subgrade’s resistance to water infiltration. Liu et al. [15] proposed a theoretical framework for loess vibration permeability and elucidated the mechanism by which vibration acceleration affects loess subgrade permeability. Zhang et al. [16] developed a custom soil–water characteristic curve (SWCC) measurement system and an enhanced permeability testing device and conducted tests on silty clay compacted samples. The effects of overlying stress and dry–wet cycles on the hydraulic characteristics of the subgrade, particularly the SWCC and saturation permeability coefficient, were analyzed, and a corresponding fitting model was established. Finally, the subgrade water transfer characteristics, considering the influences of dry–wet cycles and overlying stress, were analyzed using the finite element method. Yue et al. [17] investigated the effects of an amide polymer (AP) on the permeability, mechanical properties, and crack resistance of loess through an orthogonal test. The basic properties of the AP, along with the permeability, mechanical properties, and dry–wet variation characteristics of polymer-modified loess, were tested, and scale model verification and simulation analysis were performed. Sim et al. [18] examined the influence of groundwater level and rainfall infiltration on the stability of the test subgrade and noted that future research should explore the consolidation process following a decrease in the groundwater level. Liu et al. [19] conducted long-term monitoring of the humidity within a subgrade constructed from recycled construction waste on the Xi’an-Xianyang expressway in China. The dynamics of the road axis, lane, soil shoulder, hard shoulder, and the under-slope of the roadblock and arc protection slope were analyzed in detail.
In seasonal frozen soil areas, where rainfall and groundwater influence the environment, excessively wet road surfaces are more likely to induce subgrade frost heave and settlement deformation. The northwestern region is a typical loess area and also a seasonal frozen soil zone. Due to extreme climate conditions, snow tends to accumulate on the slope and foot of the subgrade in the winter. As temperatures rise, rain and snow melt, infiltrating the subgrade and causing localized wetting and softening, which pose significant risks to slope stability and road safety [20,21,22]. Zhao et al. [23] examined the effect of soil texture on the infiltration of snowmelt into frozen soil. The mechanical properties of infiltration processes in clay, silty clay loam, and sandy loam were studied using a physics-based numerical simulation of the frozen soil phase transition and heat transfer. Stuurop et al. [24] simulated snowmelt infiltration into frozen soil using a numerical model to investigate the theoretical controls on frozen soil infiltration across several soil types. Wen et al. [25] systematically studied the effects of water immersion, freeze–thaw cycles, and water and salt transport on the road characteristics of mine overburden with varying coarse-grain contents and proposed a cumulative damage model for mine overburden.
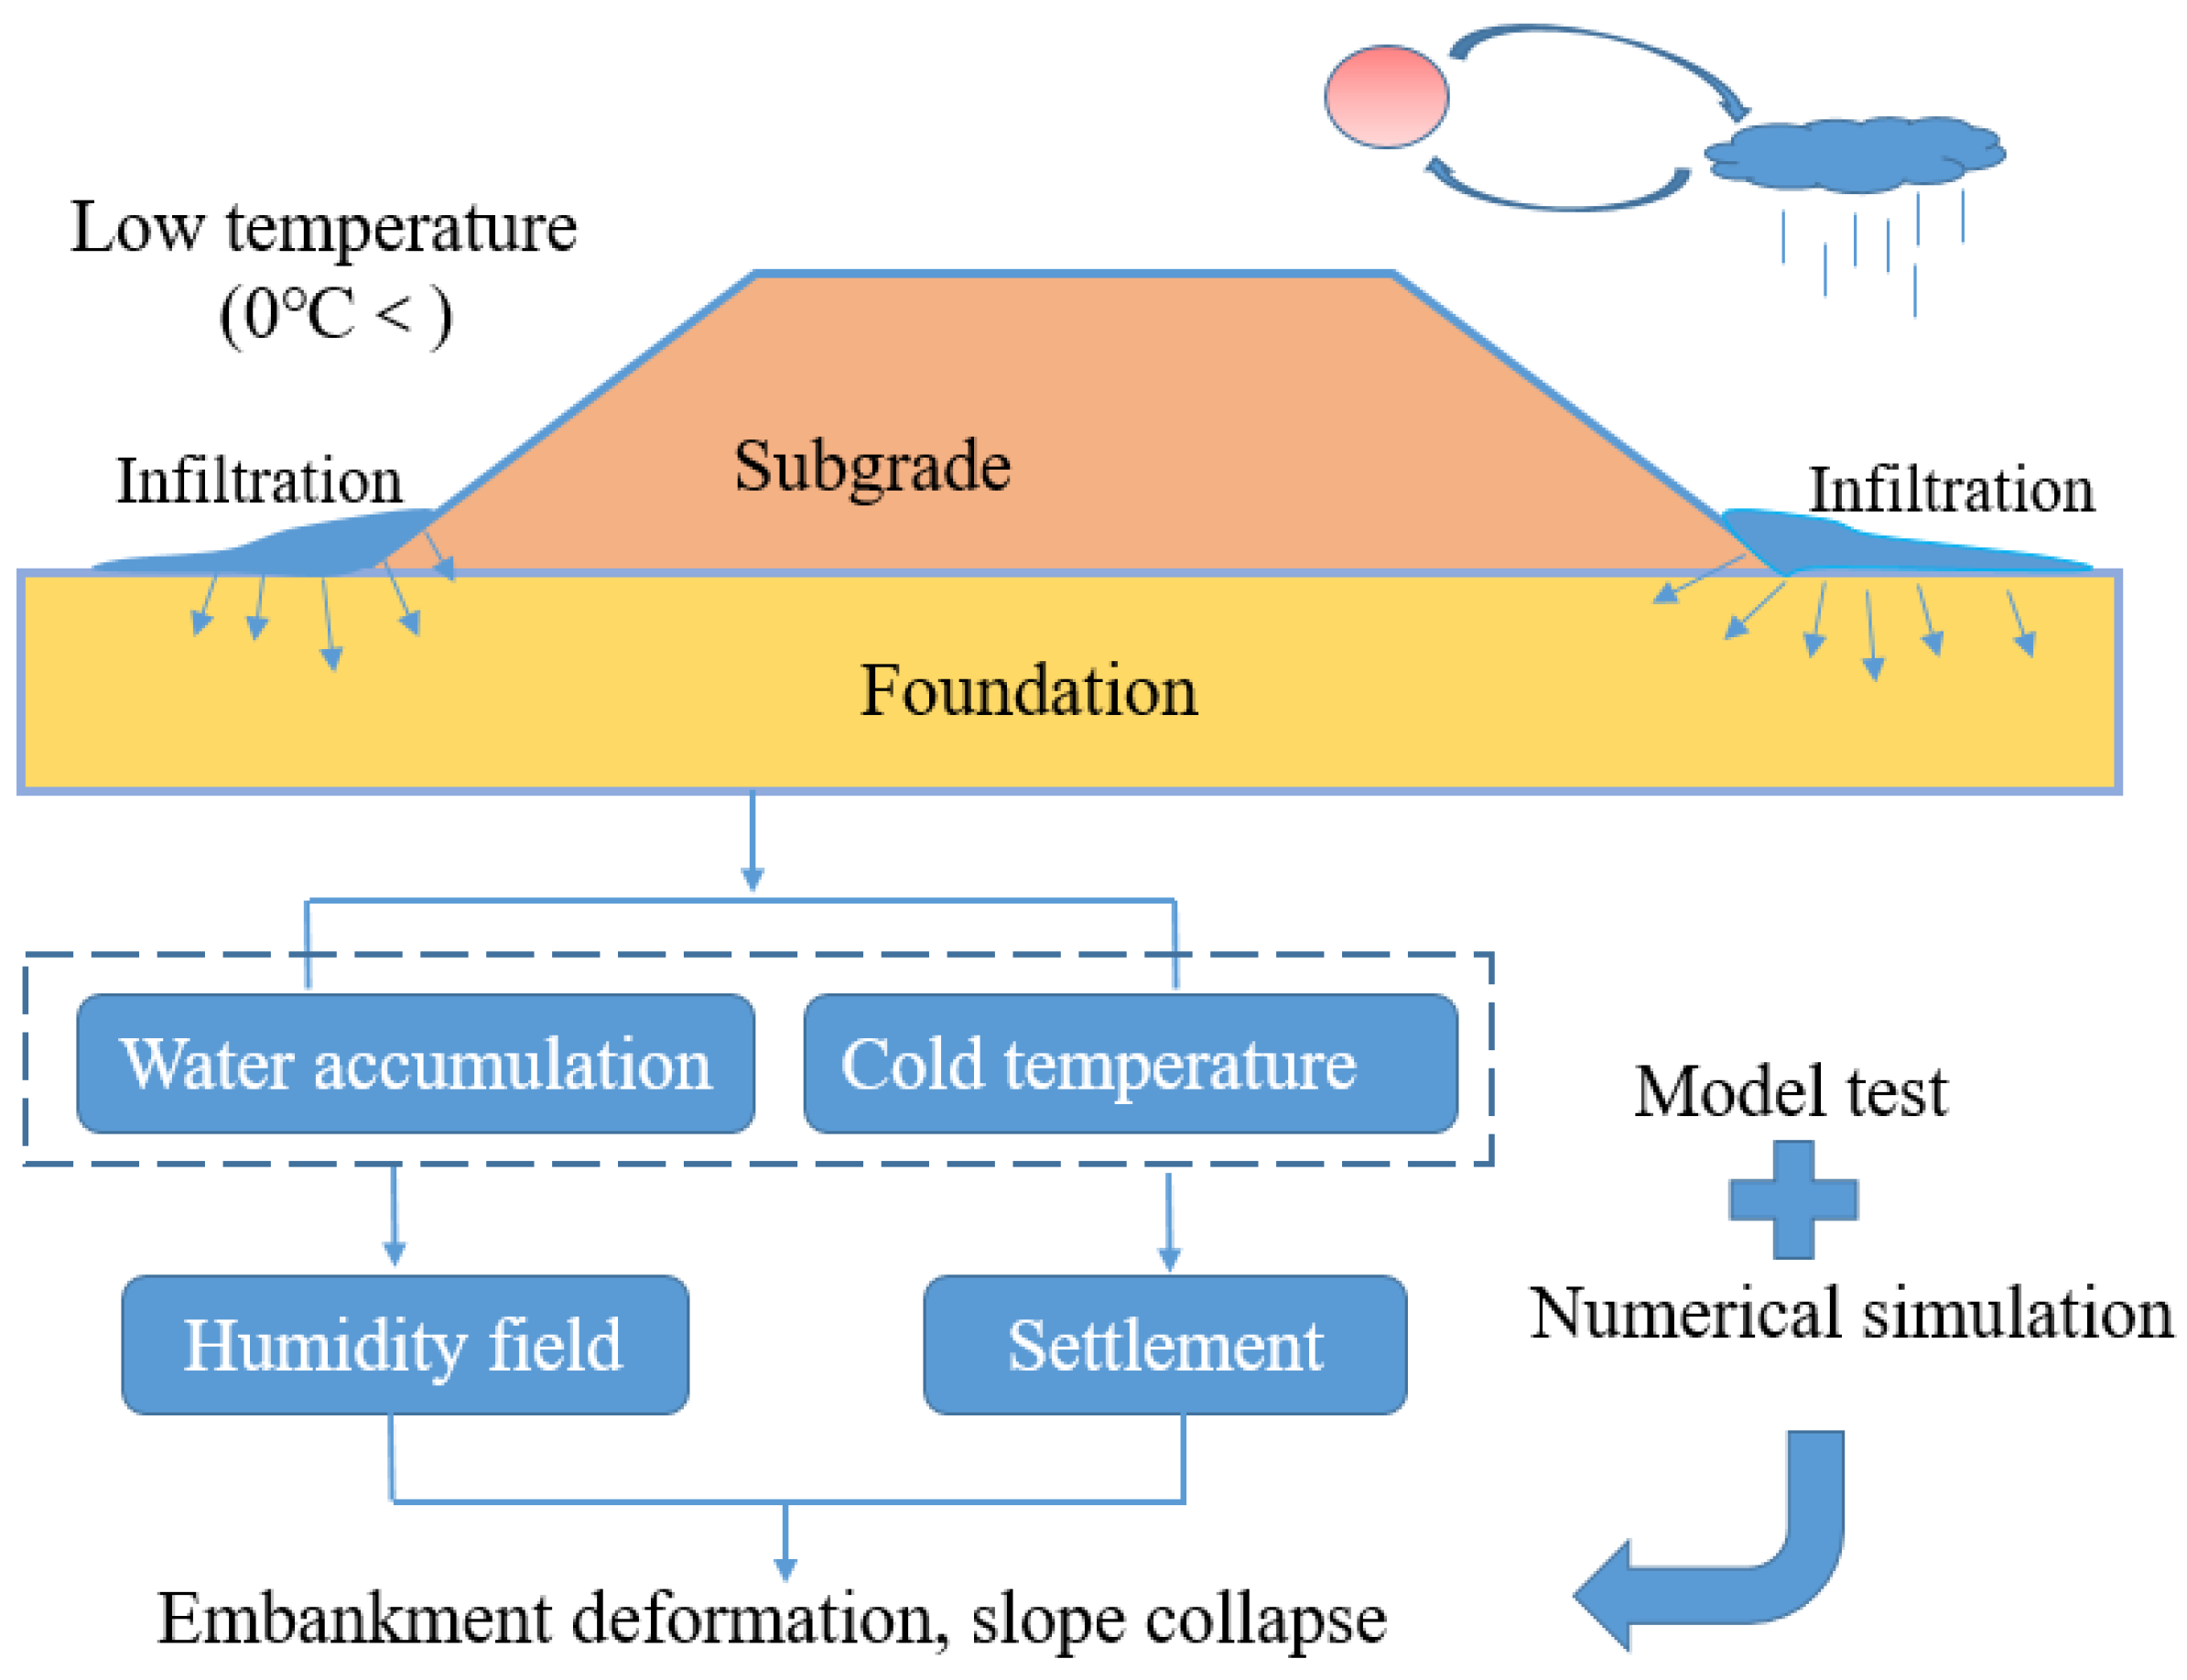
Previous studies have primarily focused on the permeability behavior of subgrade slopes, with research largely limited to the analysis of the subgrade’s moisture field and settlement deformation. However, water accumulation at the foot of high-fill subgrades is a critical factor contributing to slope instability and foundation degradation. Therefore, conducting water seepage tests in ditches at the foot of the subgrade and simulating the coupling relationship between the moisture field and settlement deformation within the subgrade and foundation is of significant importance. This article examines a representative high-fill loess subgrade in Northwest China through scaled model testing, investigating how localized water seepage in slope foot ditches affects the subgrade’s internal moisture distribution and settlement deformation characteristics. The research also explores the impact of snowmelt on the loess subgrade in the northwestern seasonal freezing zone. The findings aim to provide a scientific basis and academic reference for road construction and operation in this region. The overall methodology and idea are shown in Figure 1.

Figure 1.
The overall methodology and idea.
2. Test Design and Scheme
2.1. Supporting Conditions
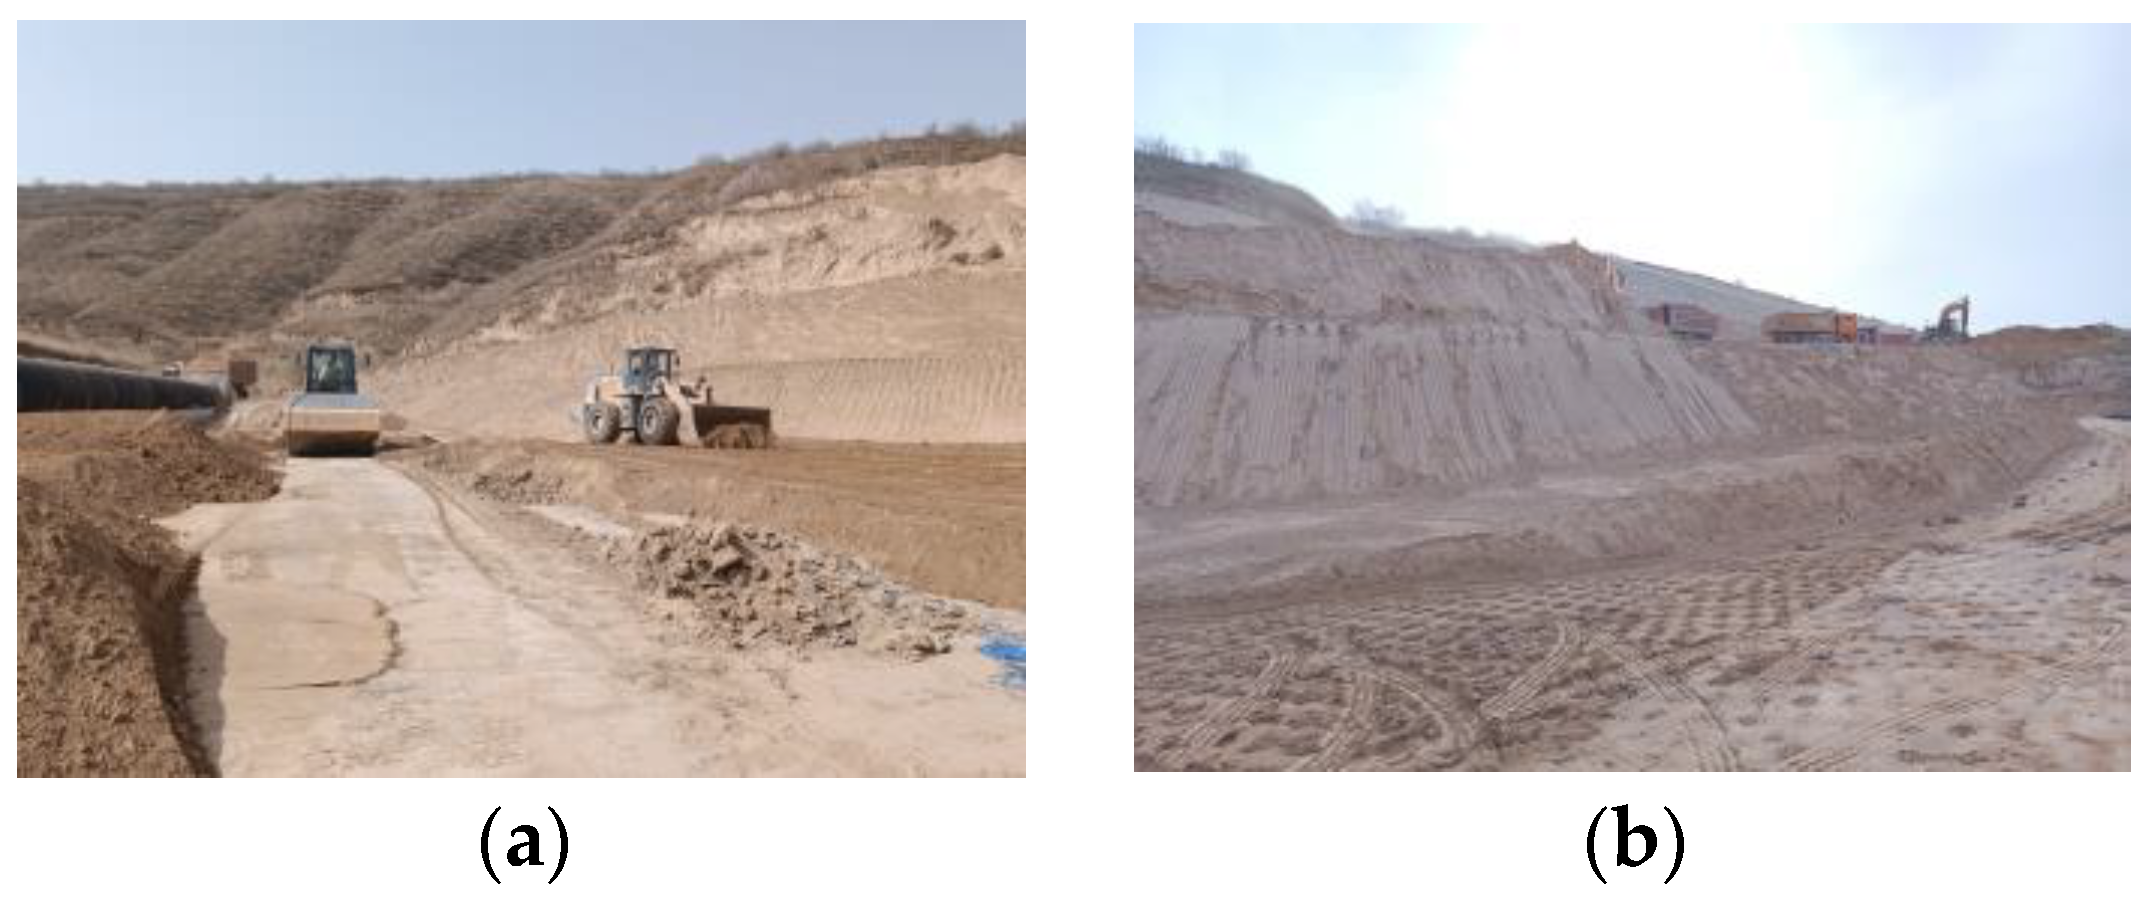
The project area is located in the loess plateau, a region characterized by a complex landform with numerous gullies; here, the average annual rainfall is 300–500 mm, the average annual temperature is 5 °C, and the average winter temperature is −6.9 °C. Under the influence of flowing water, the loess is typically eroded, forming features such as loess beams and loess hills. The area between Liang and Mao is primarily composed of narrow, deeply cut loess gullies, with bedrock often exposed. In addition to these narrow gullies, erosive valley landforms are also present, which are relatively flat and wide; field compaction of the subgrade and the landform characteristics are shown in Figure 2. The site consists of self-weight collapsible loess with a medium collapsibility degree [26]. The standard depth of the frozen soil is 820 mm (average depth), and the compaction degree of the foundation is 90%, while the lower subgrade has a compaction degree of 93%, and the upper subgrade has a compaction degree of 95%.
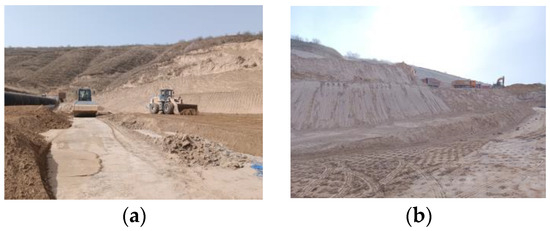
Figure 2.
On-site subgrade construction. (a) Subgrade compaction; (b) terrain.
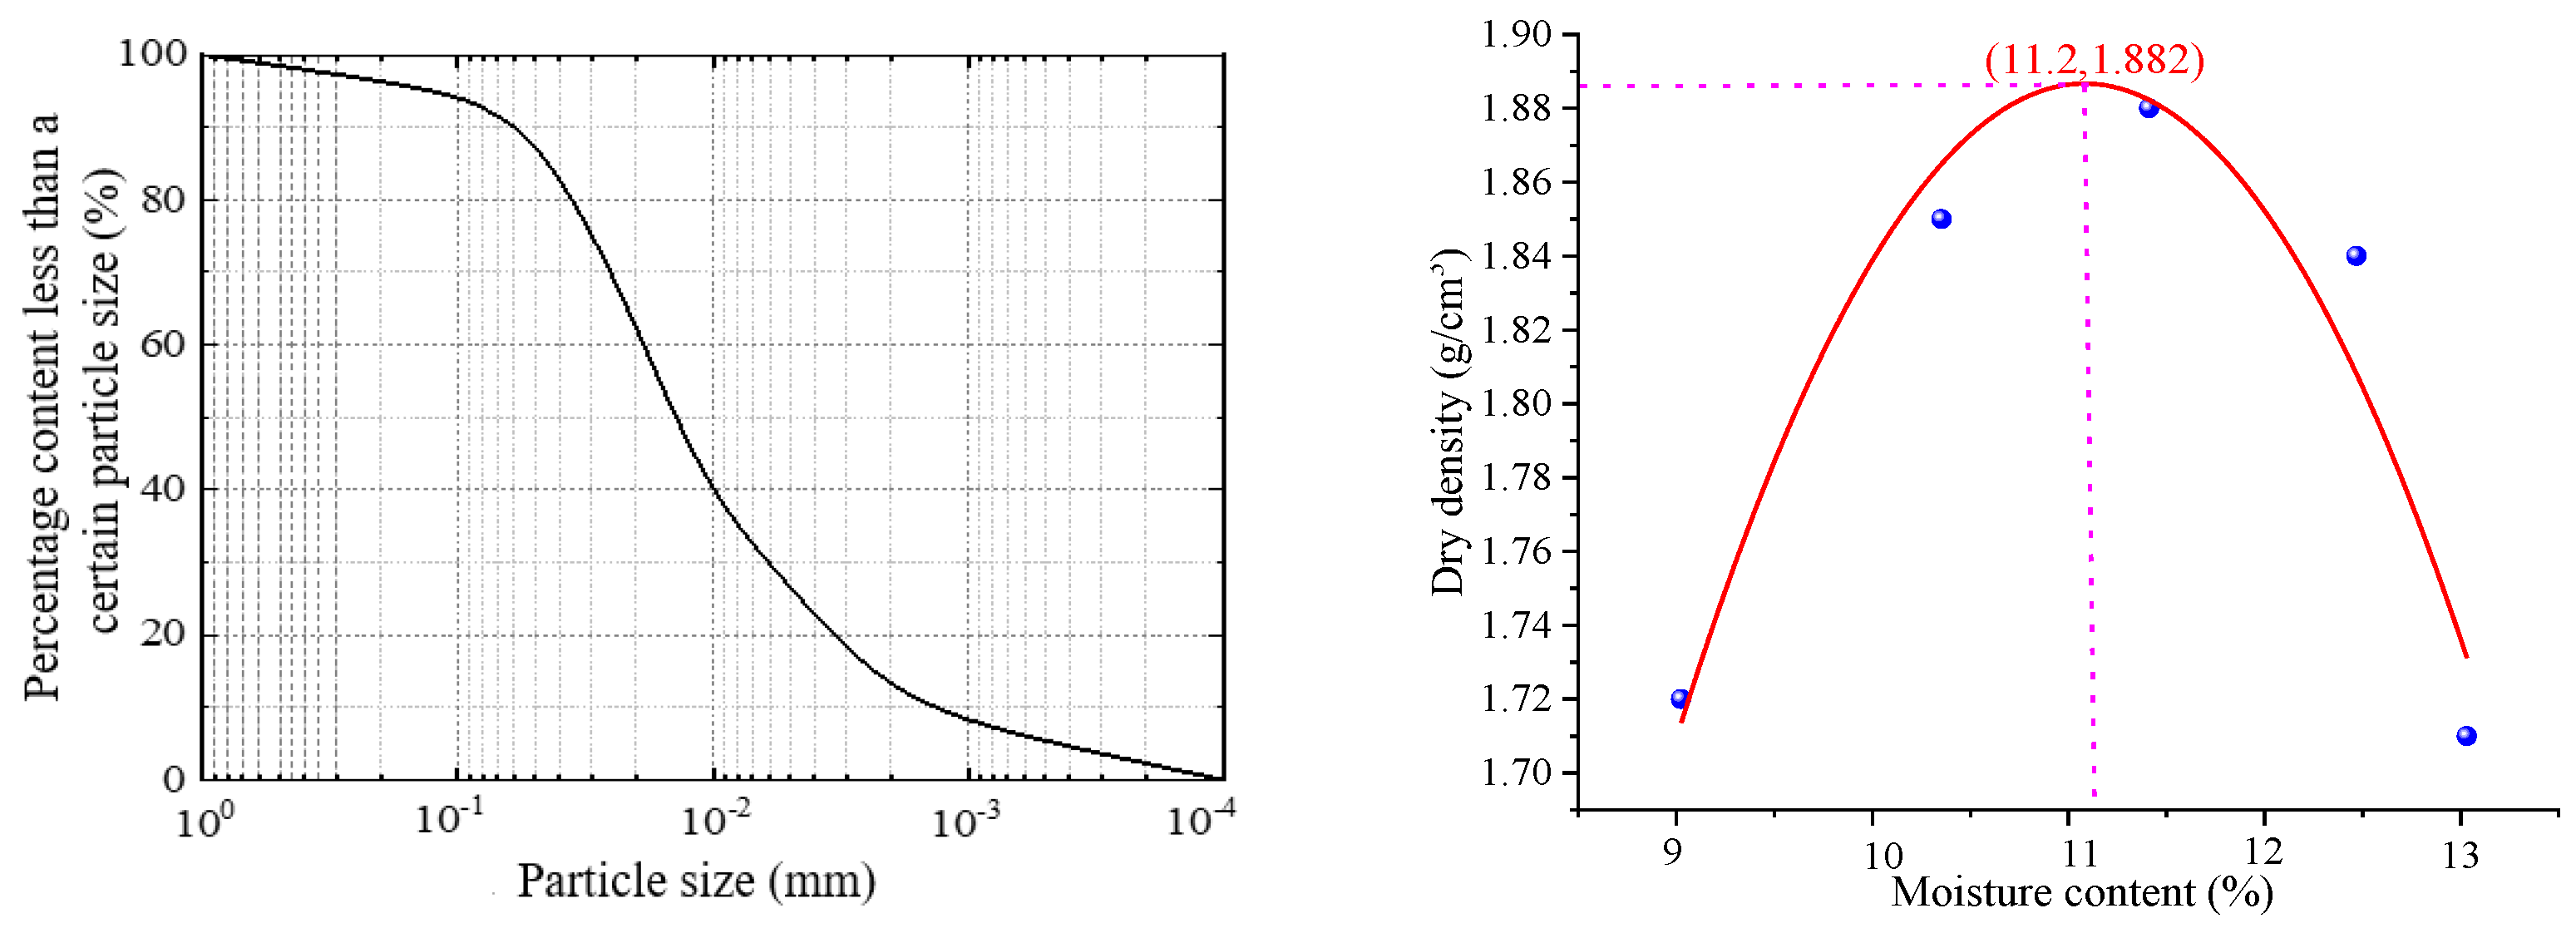
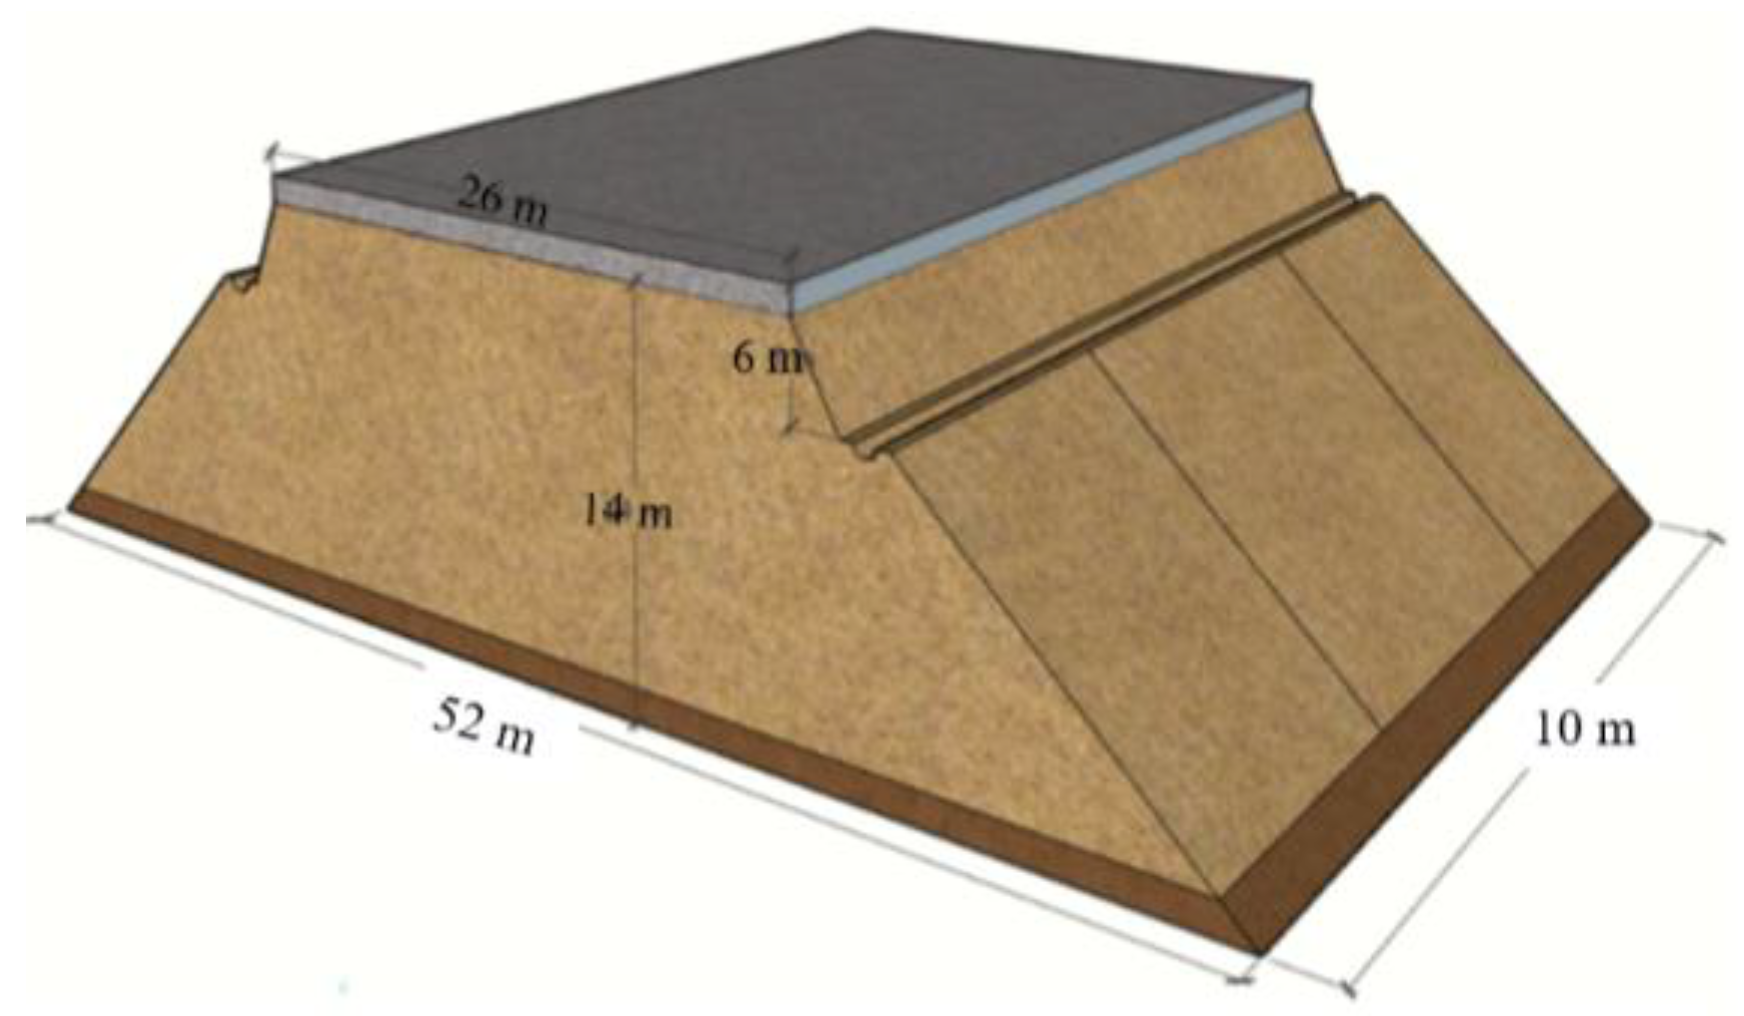
The model test was conducted based on the high-fill subgrade of an engineering test section, using field-disturbed loess as the filler. The specific physical and mechanical properties are provided in Table 1, and the particle size distribution curve and compaction curve of the fill material are shown in Figure 3. The dimensions of the site subgrade and its schematic diagram are presented in Figure 4. The slope ratio of the upper and lower sections is approximately 1:1.5.

Table 1.
Physical and mechanical indicators of disturbed loess at study site.

Figure 3.
The particle size distribution curve and compaction curve of the fill material.

Figure 4.
Three-dimensional schematic diagram of on-site subgrade.
2.2. Similarity Ratio
To improve the accuracy of the experiment, the model similarity ratio was maximized. Additionally, considering the influence of the test site and the model boundary effect, the similarity ratio was set at 1:20.
Note: —length similarity ratio (unit: 1); —volume similarity ratio (unit: 1);
—prototype size (unit: m); —model size (unit: cm);
—prototype volume (unit: m3); —model volume (unit: cm3).
Gravity similarity ratio and strength similarity ratio: According to the experiences of previous studies [27], the weights of similar materials can be controlled in a large range. For the convenience of calculation, the similarity ratio of a heavy weight, temperature, and time between the prototype and the model is set to 1.
According to the similarity criterion, the similarity constant of the strength index (including the elastic modulus, cohesion, and compressive strength) is equal to the product of the geometric similarity constant and the heavy similarity constant ; that is, .
2.3. Test Equipment and Model Building
2.3.1. Test Equipment
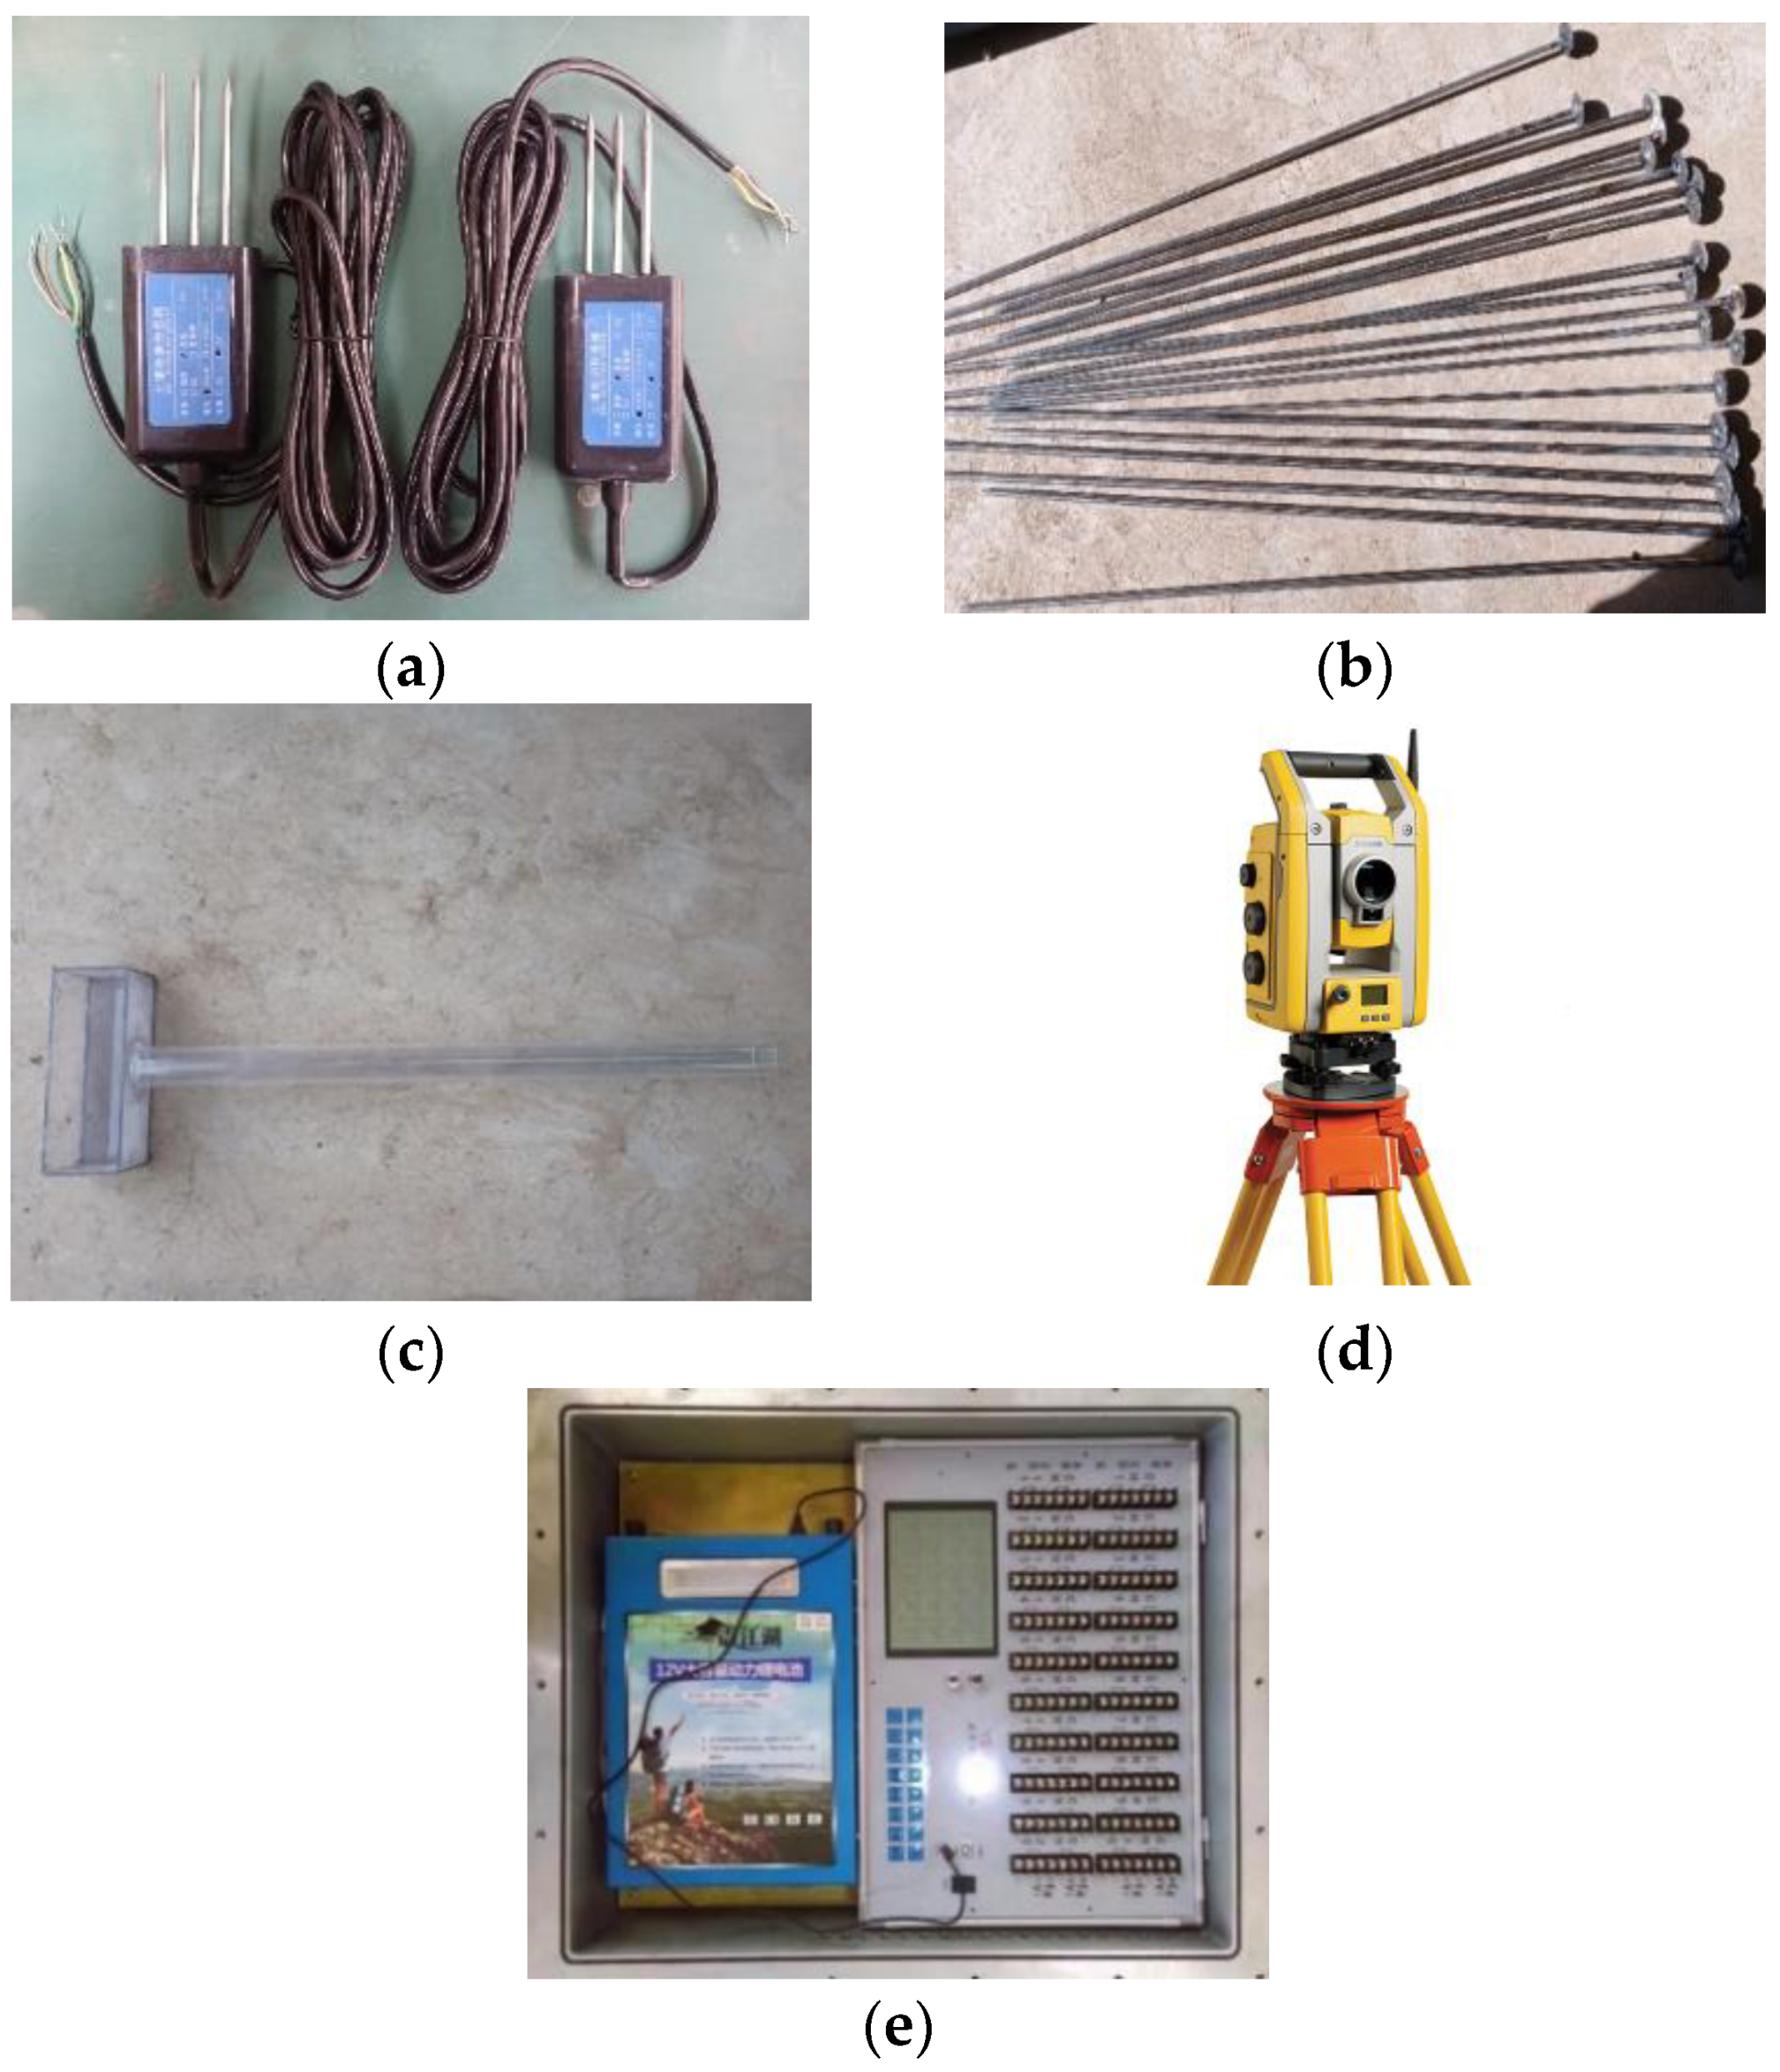
The test equipment includes a soil moisture sensor, a custom settlement measuring rod, a seepage channel, a total station, and an acquisition instrument.
The soil moisture sensor model is RS485. The settlement measuring rod and seepage pipe were custom-made. The settlement measuring rod consists of a steel rod with a diameter of 0.8 cm and a 2 cm diameter disc welded at the bottom. The lengths of the rods were 100 cm (4 rods), 80 cm (4 rods), and 60 cm (4 rods), which were buried at the corresponding positions of each layer sensor. A reflection patch was attached to the top of the settlement measuring rod. The total station was used to monitor the settlement changes at each point during the experiment in real time. Figure 5 shows the schematic of the custom-made settlement measuring rod, seepage pipe, and total station. The pore water pressure data acquisition instrument used in the model test is JC-YBY-2001, produced by the Tokyo Institute of Measurement, Japan.
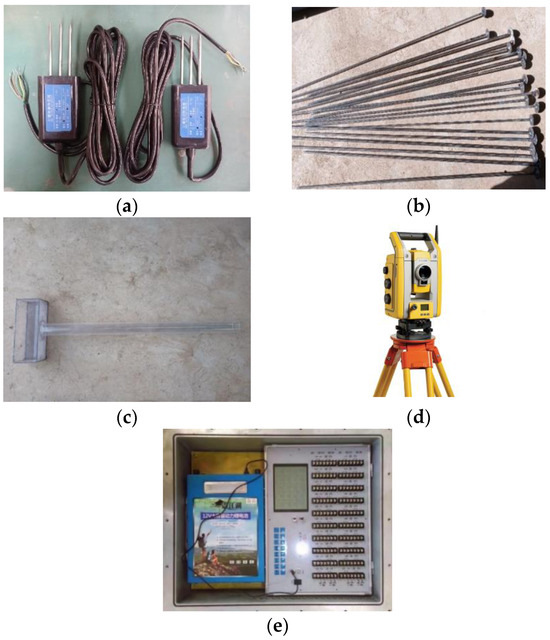
Figure 5.
Test equipment. (a) Moisture sensor; (b) settlement measuring rod; (c) seepage pipe; (d) total station; (e) acquisition instrument.
Table 2 and Table 3 show the technical indicators of the soil moisture sensor and JC-YBY-2001 data acquisition instrument, respectively.
Table 2.
Technical indicators of soil moisture sensor.
Table 3.
JC-YBY-2001 data acquisition parameters.
2.3.2. Model Construction and Sensor Layout
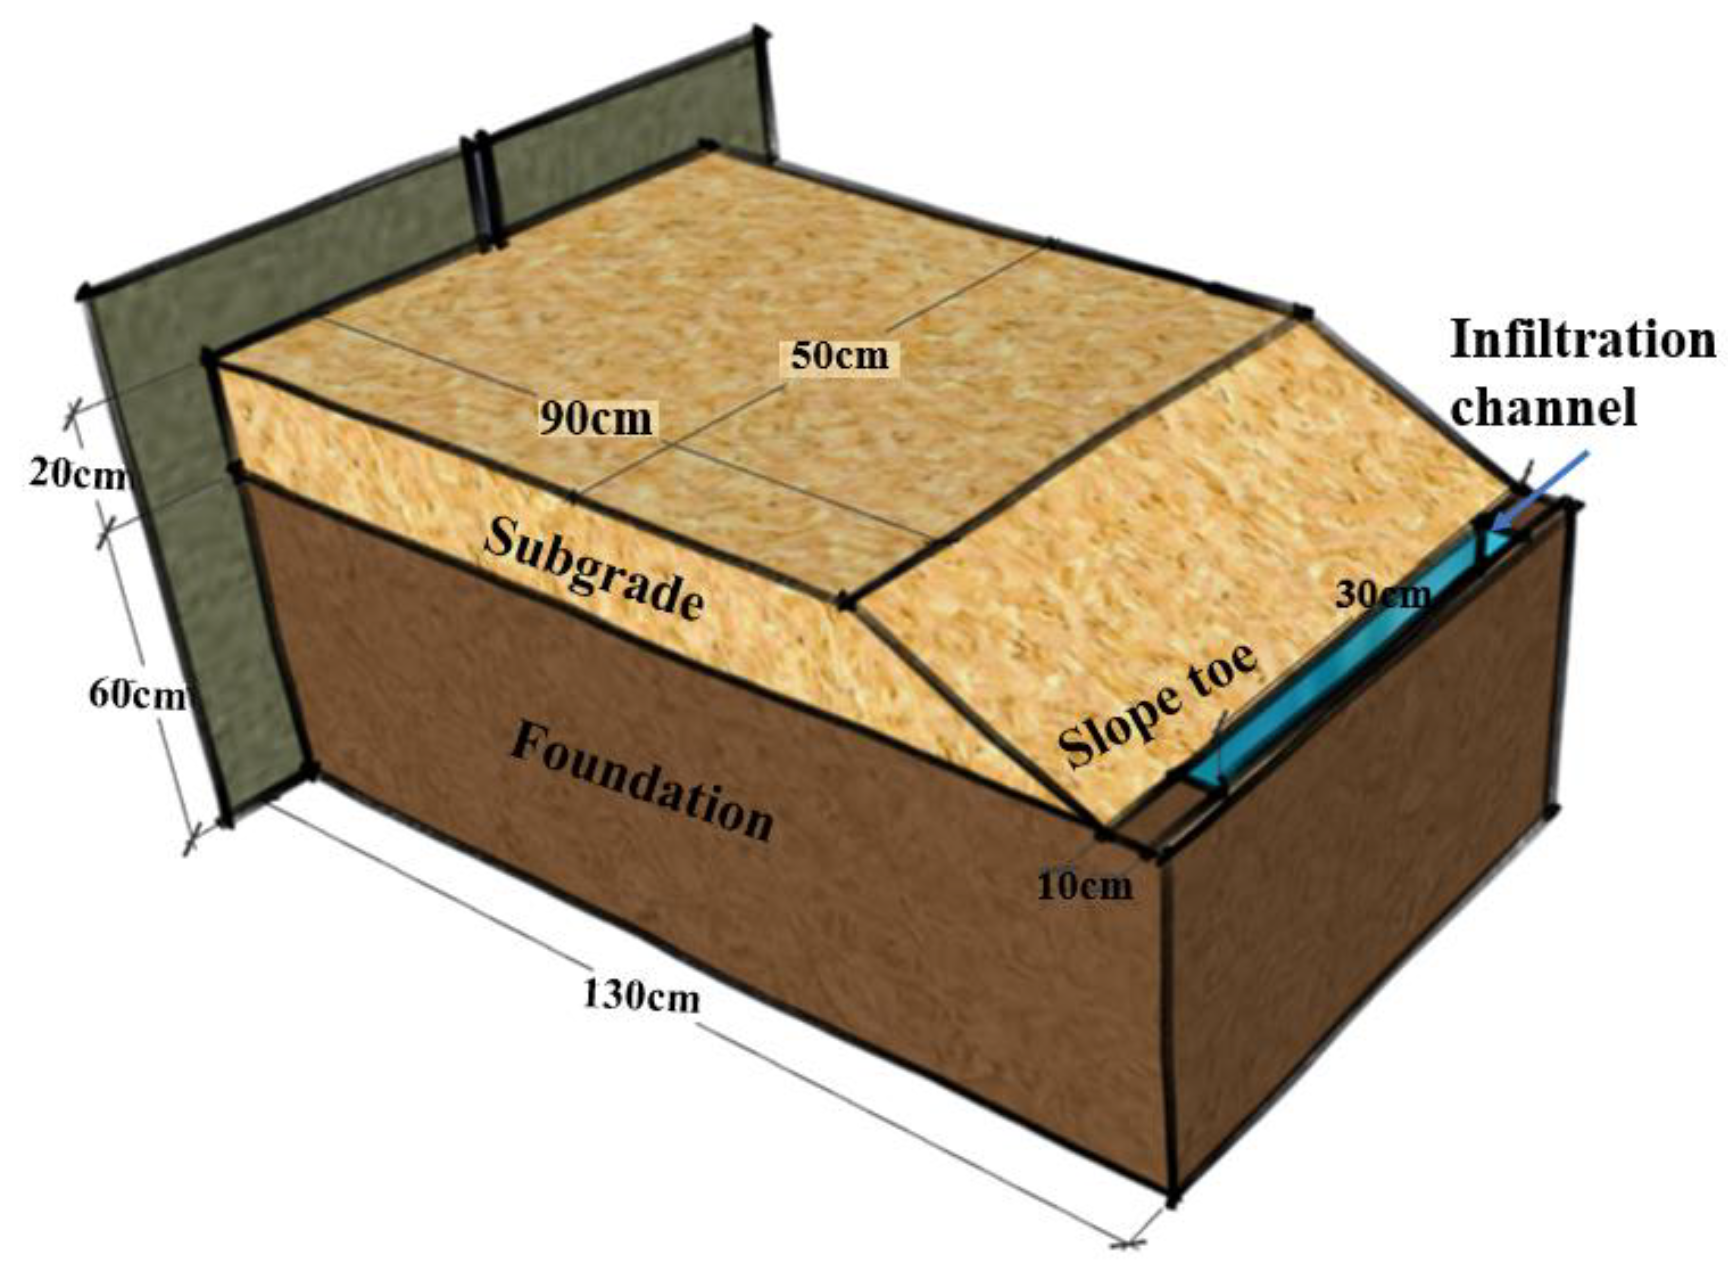
Soil samples from the site were collected, transported, and dispersed before being air-dried to prepare the models, following compaction standards that varied according to the positions of the subgrade and foundation. Due to limitations in the available test soil and site conditions, the road was treated symmetrically along the centerline. Additionally, considering the infinite extension of the foundation and a similarity ratio of 20, the foundation had a height of 0.6 m, a width of 0.5 m, and a length of 1.3 m. Considering that the infiltration from the side ditch primarily humidified the lower subgrade, the height of the far subgrade was controlled at 4 m. After this control, the model subgrade had a height of 0.2 m, with a length of 1.2 m and a width of 0.5 m. A 0.1 m slope foot was reserved, and the subgrade side slope was approximately 1:1.5. The model diagram is shown in Figure 6.

Figure 6.
Schematic diagram of the model.
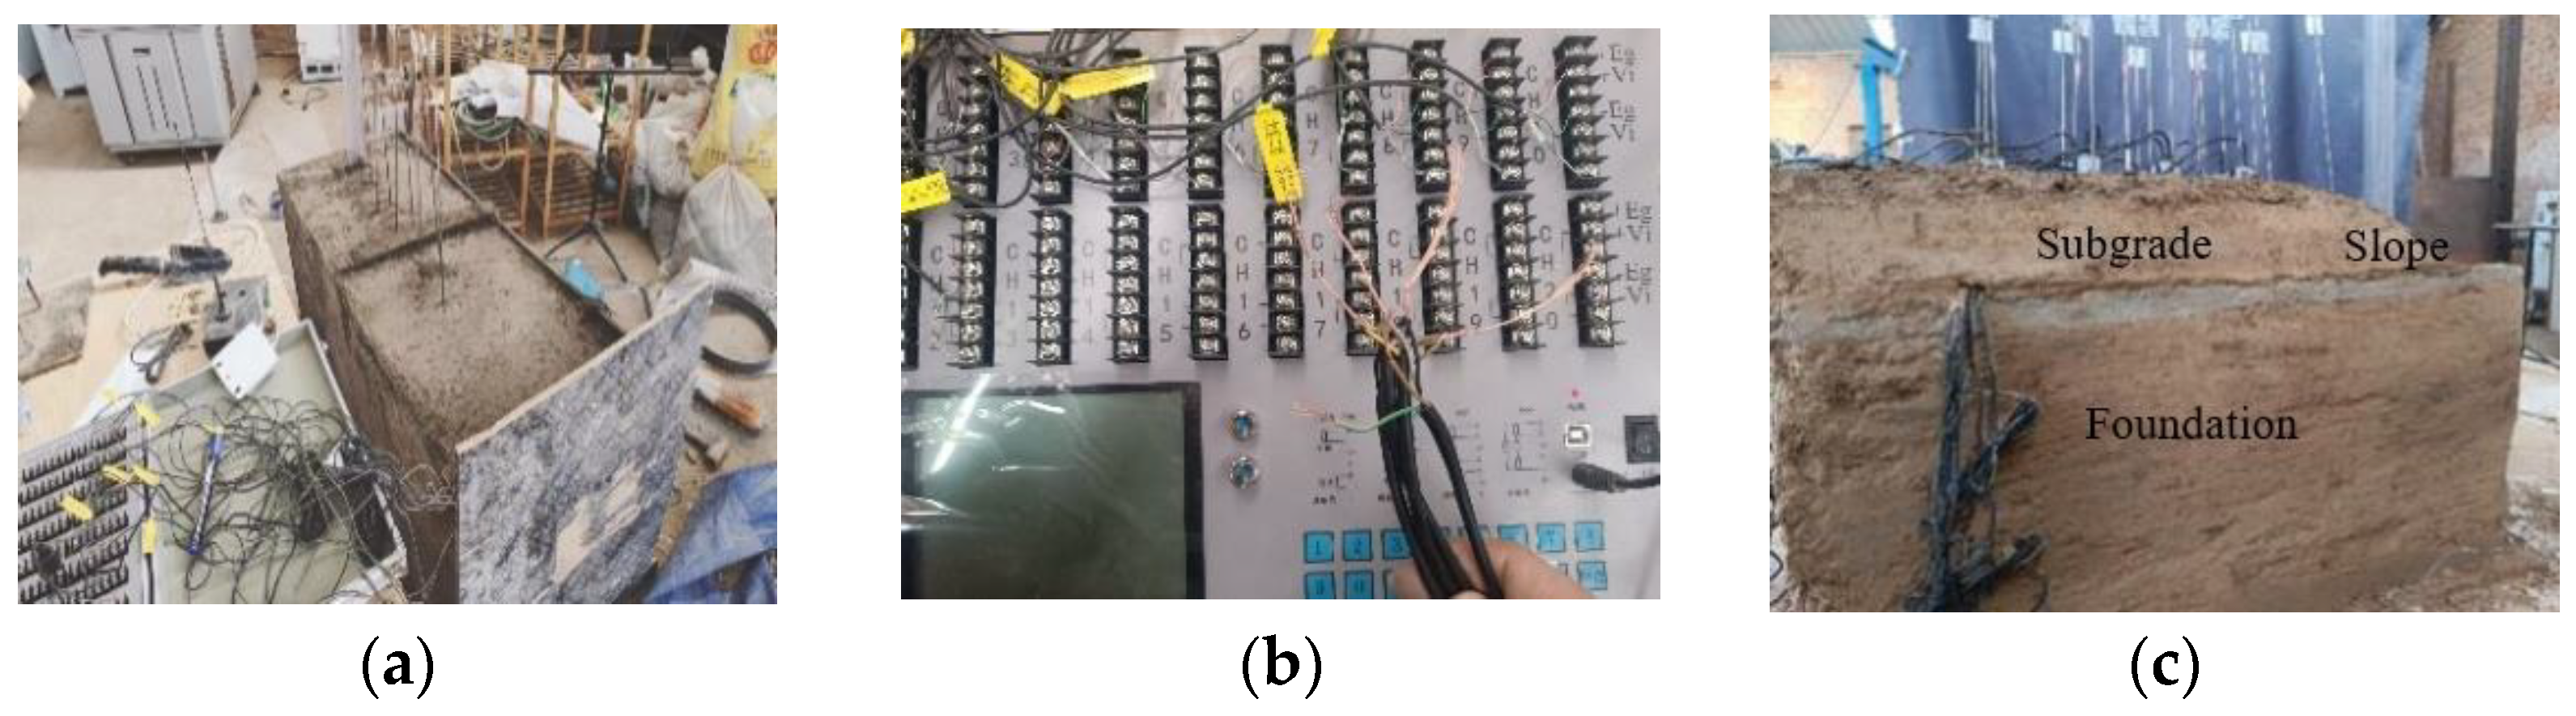
To facilitate a more effective comparison of field construction technologies, a 5 cm cement cushion layer is placed at the interface between the model foundation and subgrade. Each layer is controlled to a height of 3 cm, and a rubber hammer is used as the rolling tool. During the rolling process, water is sprayed onto the surface of each layer. Simultaneously, after each layer is rolled, ring knife samples are collected to measure the moisture content and dry density, ensuring that the physical parameters of the produced model closely match those of the prototype compacted soil. The dry density error must not exceed 0.3 g/cm3, and the moisture content error must not exceed 1%. The specific rolling indicators are presented in Table 4. Based on the road engineering standards and the similarity ratio discussed in this paper, the self-weight of the upper subgrade of the external load model, set at 92.7 N at the top of the model, is determined. The model construction is illustrated in Figure 7.
Table 4.
Model-making metrics.
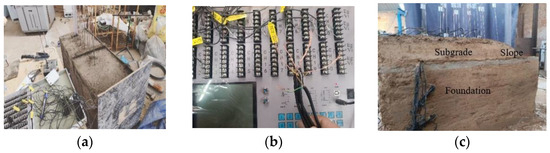
Figure 7.
Model-making process. (a) Sensor embedding; (b) marking; (c) model.
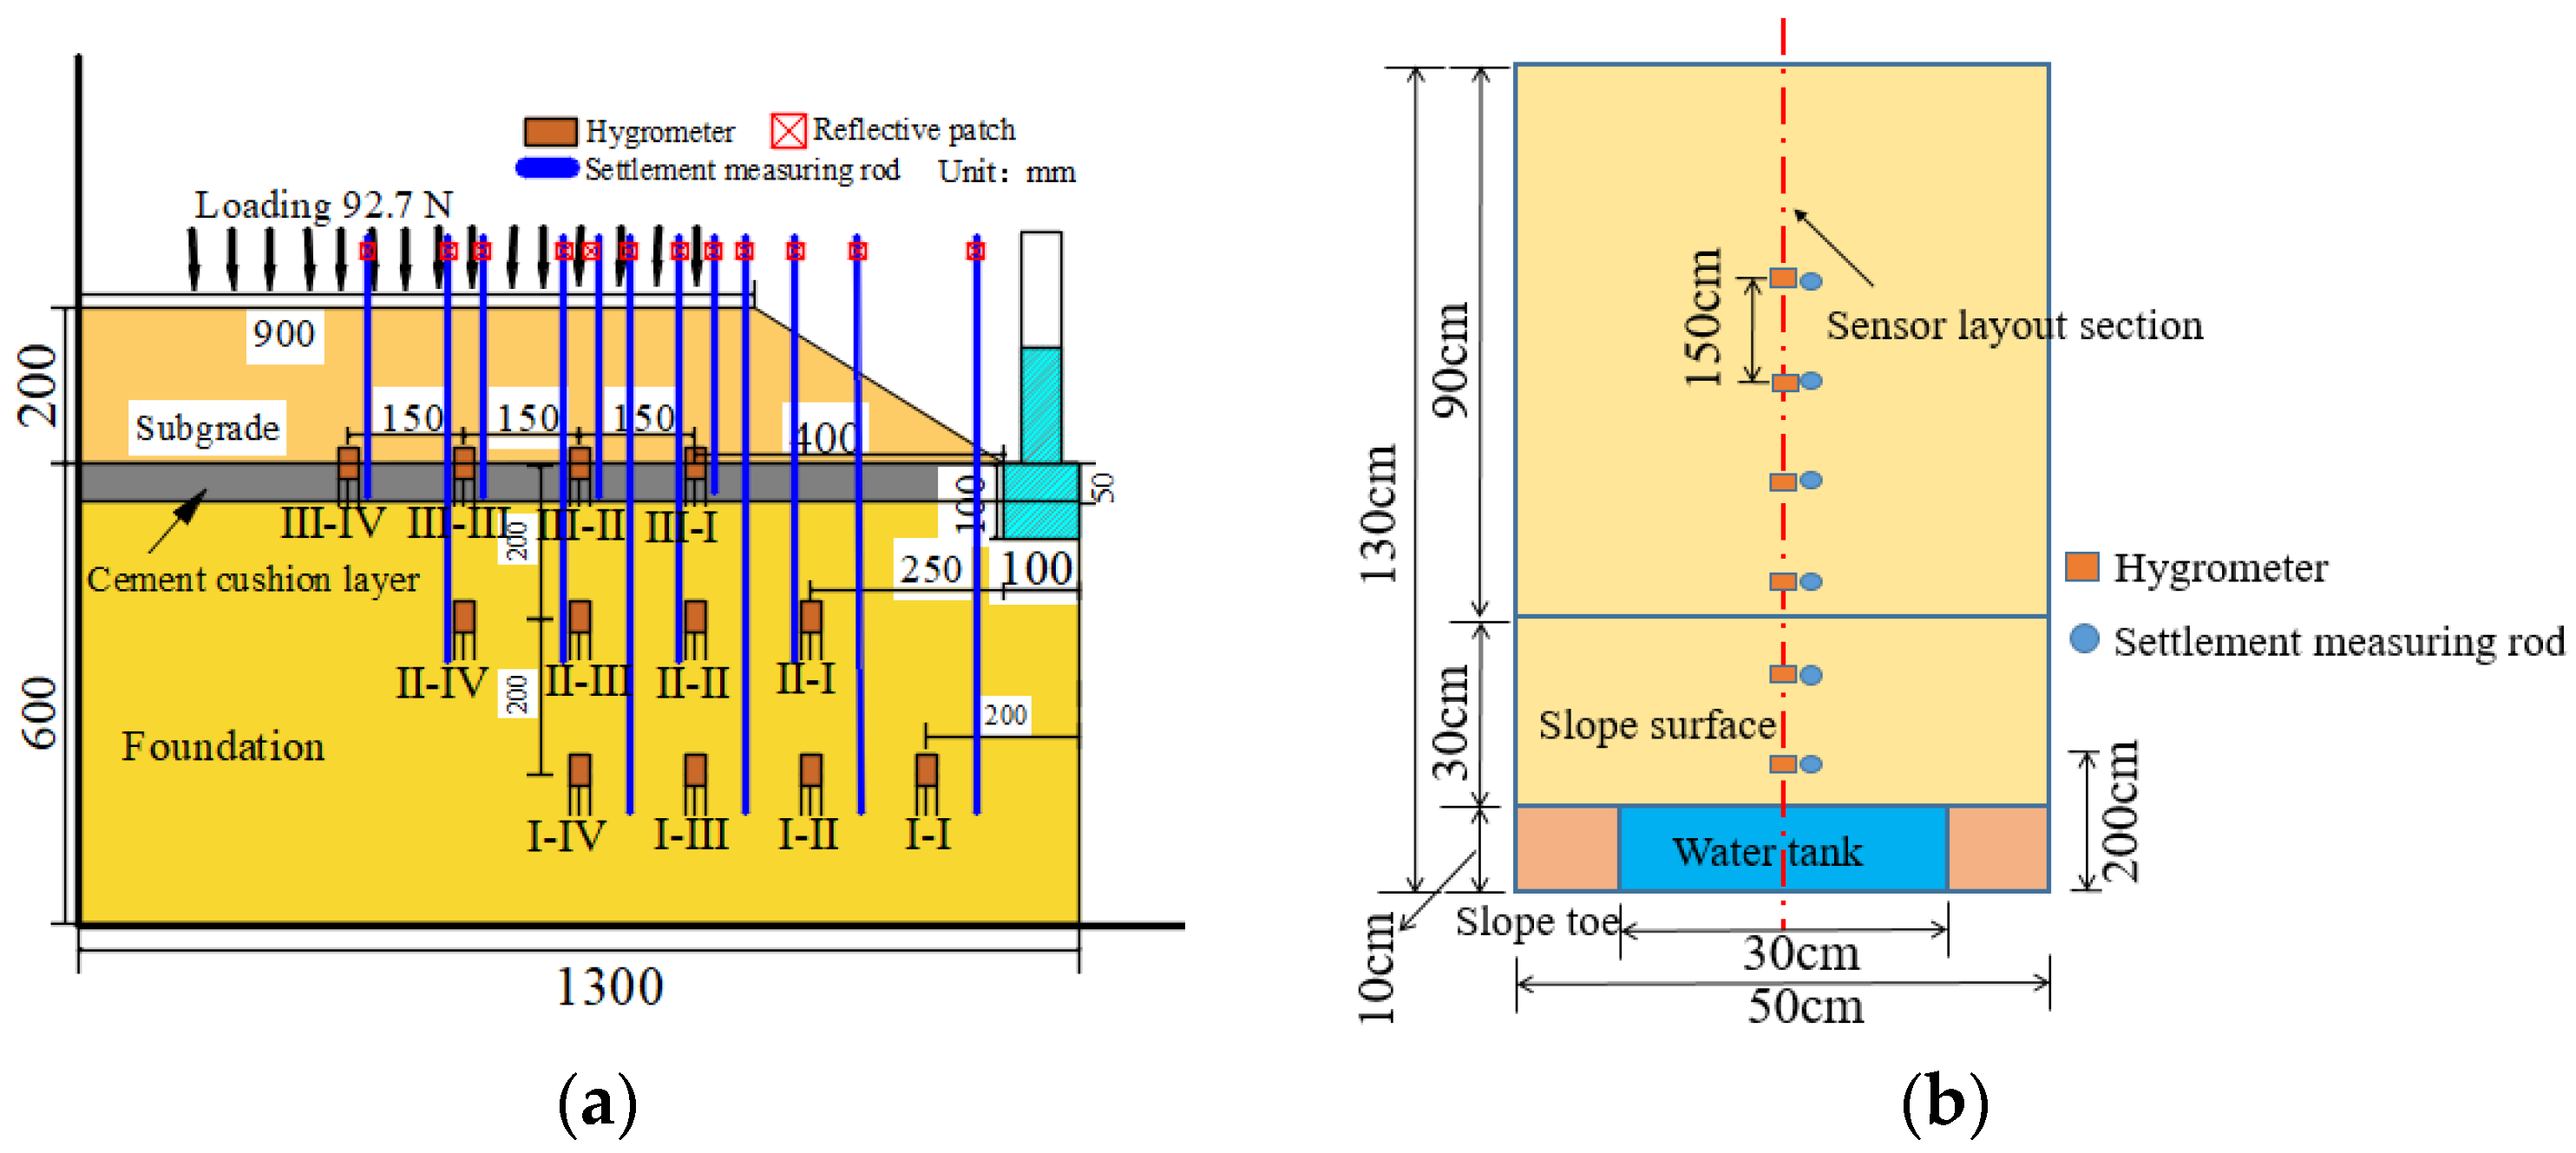
A total of three sensor layers are embedded into the model. A soil hygrometer and settlement measuring rod are, respectively, placed at the foundation heights of 20 cm and 40 cm, as well as at the interface between the subgrade and the foundation. A schematic diagram of sensor embedding is shown in Figure 8. The water channel measures 40 cm in length, 10 cm in width, and 10 cm in height. A water injection pipe is installed in the channel to regularly fill it, simulating the humidity and settlement deformation characteristics of the foundation and subgrade during the infiltration of side ditch water in the cold season. The test dates were 13 December 2023–22 December 2023, the water injection time was 8:00 a.m. every day, and the water injection volume was 2 L. To prevent freezing before infiltration, warm water at 30 °C is used for injection.

Figure 8.
Schematic diagram of sensor layout. (a) Cross-section; (b) plan.
3. Results and Analysis
The moisture field and settlement deformation characteristics of the foundation and lower subgrade in the loess subgrade of seasonal freezing areas, influenced by water infiltration from the slope foot ditch under atmospheric precipitation, were studied by regularly injecting water into the model’s side ditch. Figure 9 illustrates the changes in atmospheric and indoor temperatures.
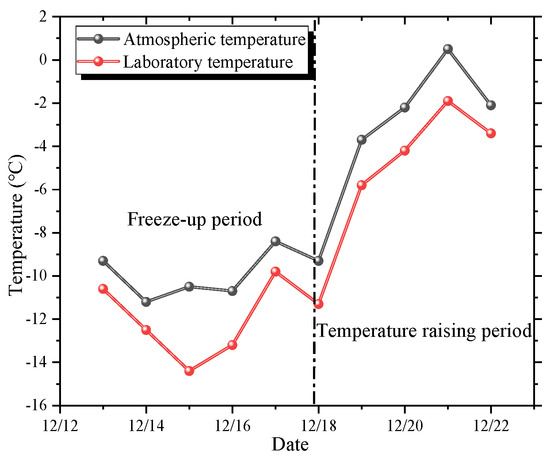
Figure 9.
Temperature curve.
As shown in the figure, the indoor temperature closely mirrors the atmospheric temperature, with a significant rise occurring since 15 December. Throughout the monitoring period, the temperatures remain within the freezing range, and the minimum indoor temperature reaches −14.9 °C.
3.1. Analysis of the Influence of Water Injection on Settlement and Moisture Content
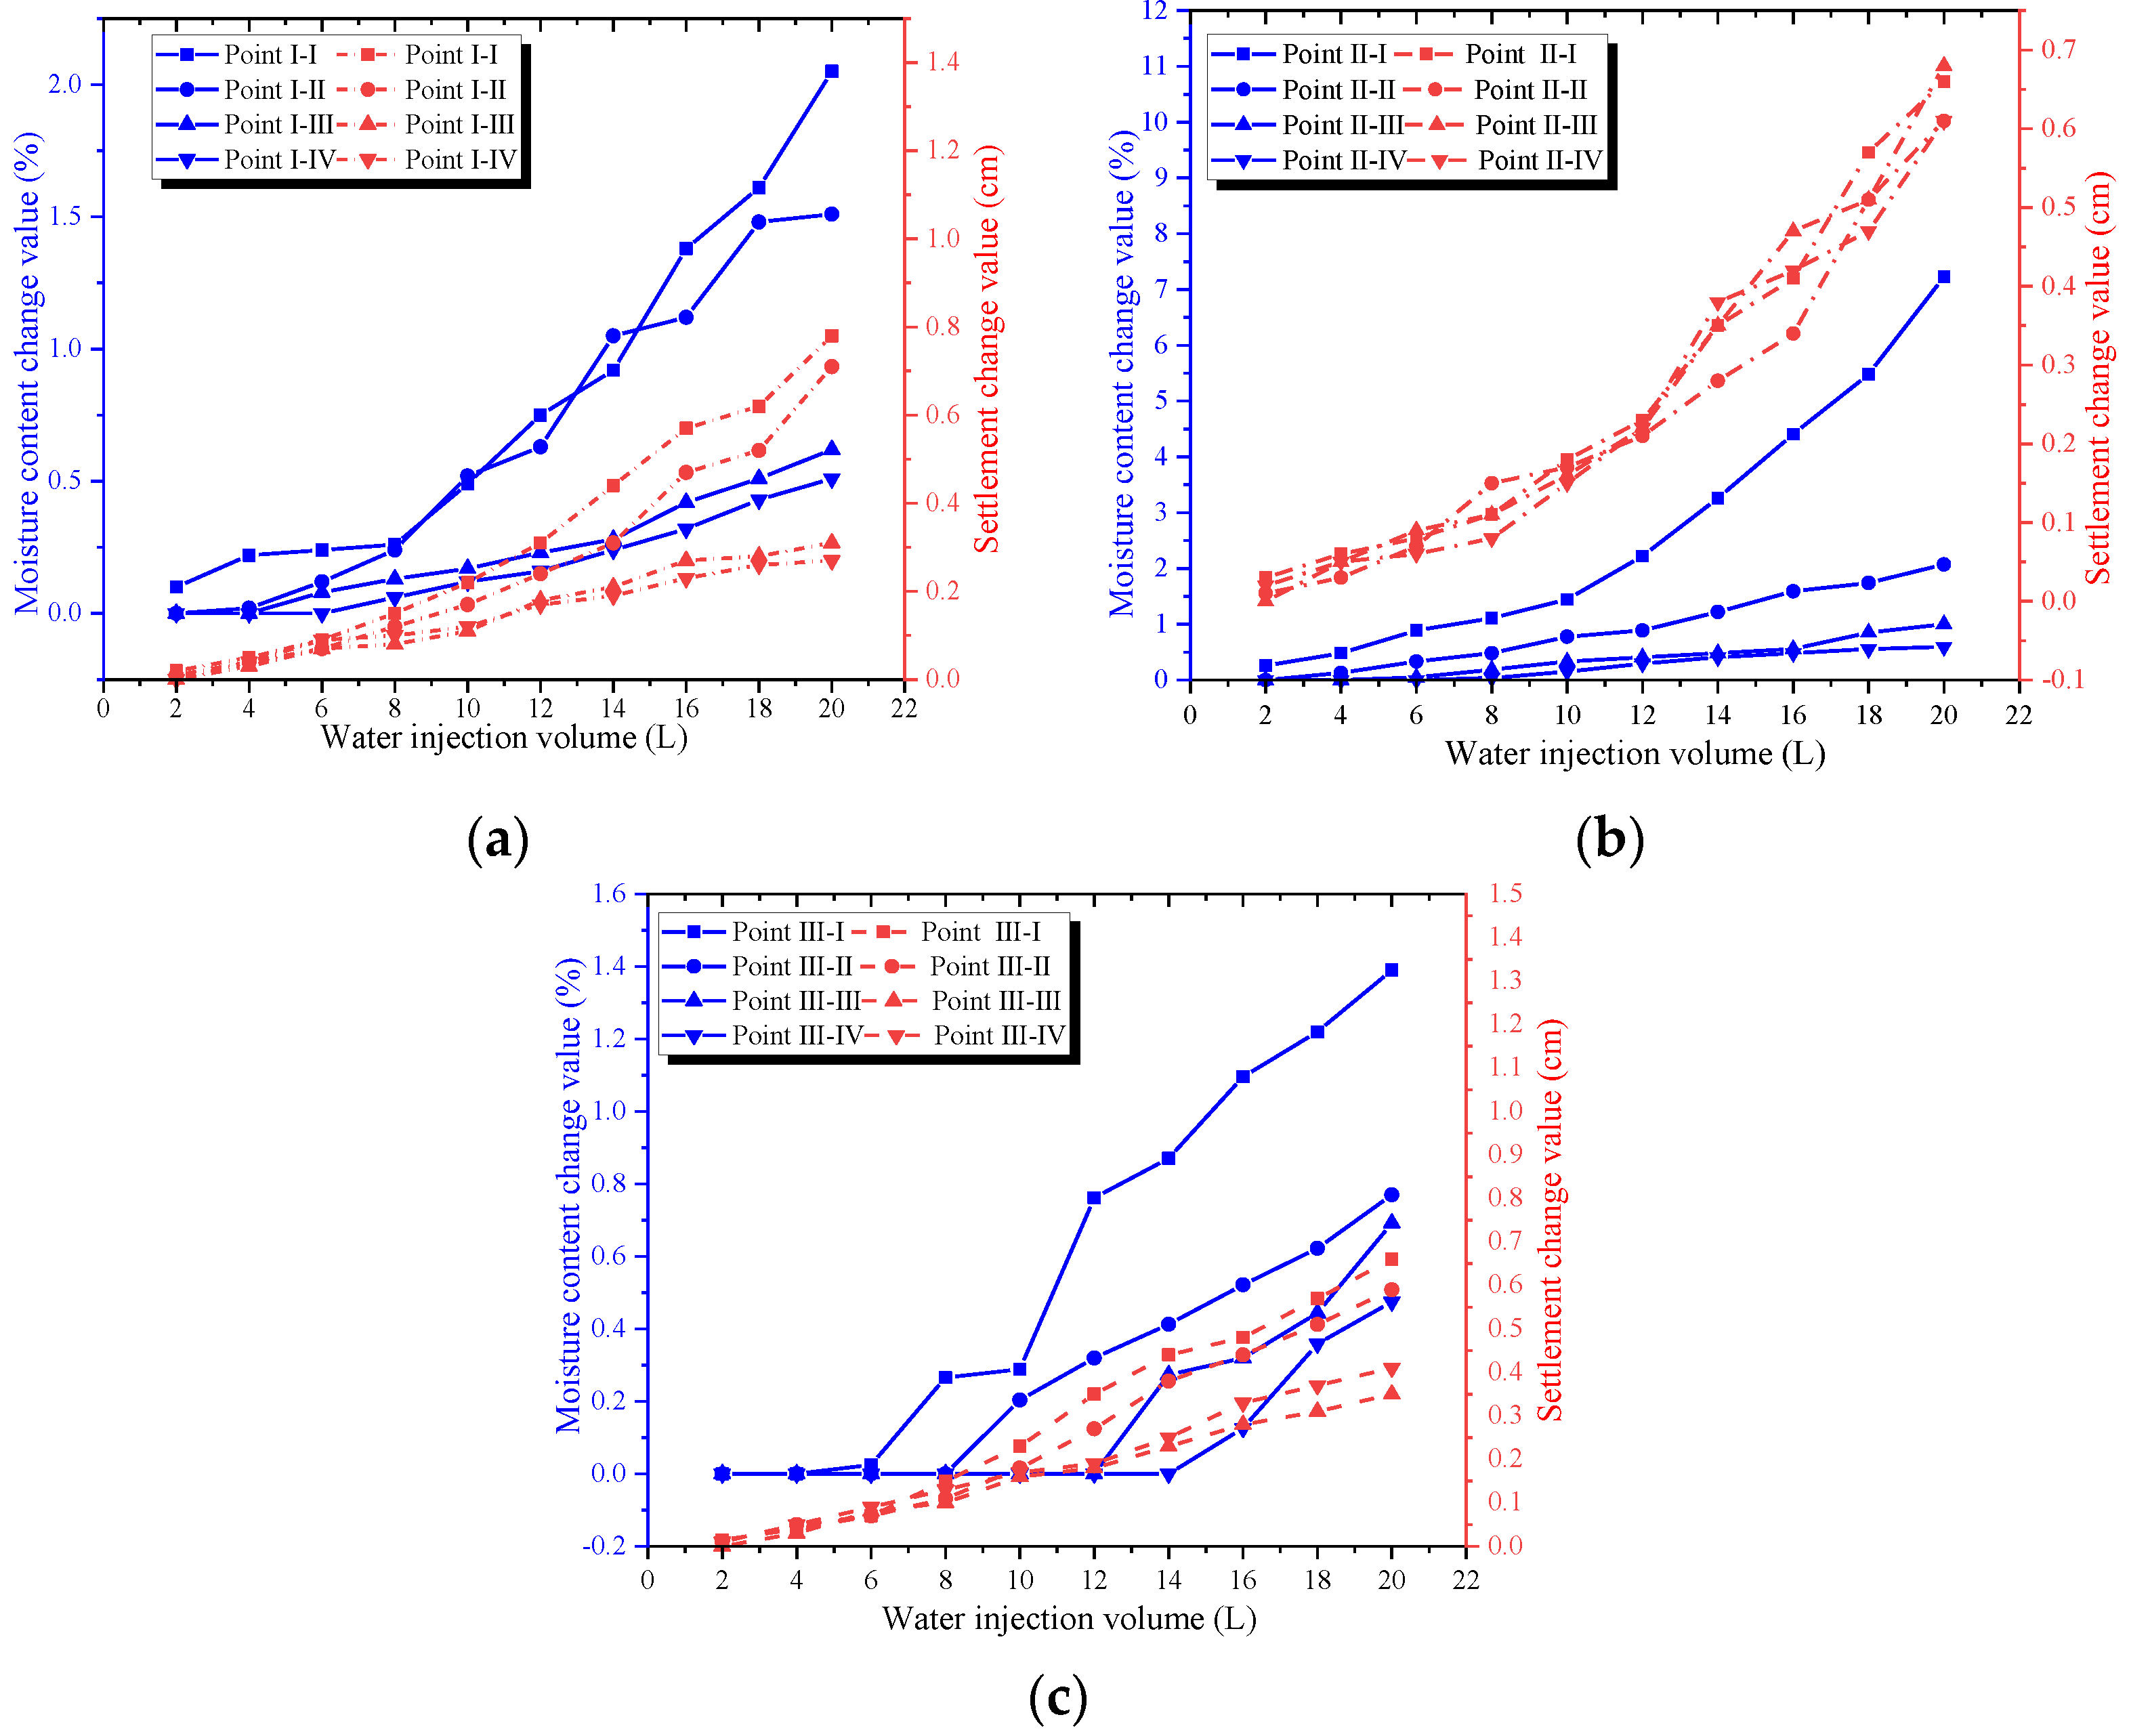
Figure 10 illustrates the relationship between moisture content, settlement, and the amount of water injected at different monitoring locations of the model.
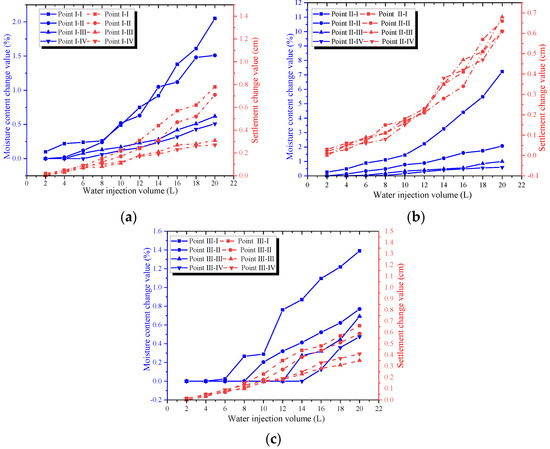
Figure 10.
Sedimentation and moisture content with water injection. (a) At a depth of 40 cm in the foundation; (b) at a depth of 20 cm in the foundation; (c) interface between the subgrade and foundation.
As shown in Figure 10, both the moisture content and settlement deformation increase with increasing water injection. The most significant change in moisture content occurs at a depth of 20 cm, where the change between points II-I is the greatest, reaching 7.3%. This is because the monitoring point is closest to the side ditch and is most affected by water flow infiltration. At a depth of 40 cm and at the interface between the subgrade and foundation, changes in the moisture content are less affected by water injection due to the soil compaction, which reduces the pore ratio and inhibits water flow spread. Furthermore, the primary direction of seepage is vertically downward due to gravity. Settlement deformation at each layer shows that the closer the horizontal distance to the side ditch, the more pronounced the settlement. The settlement at 40 cm ranges from 0.23 to 0.81 cm, at 20 cm from 0.62 to 0.69 cm, and at the interface between the subgrade and the foundation from 0.32 to 0.68 cm. The settlement at a depth of 20 cm is most strongly influenced by water injection.
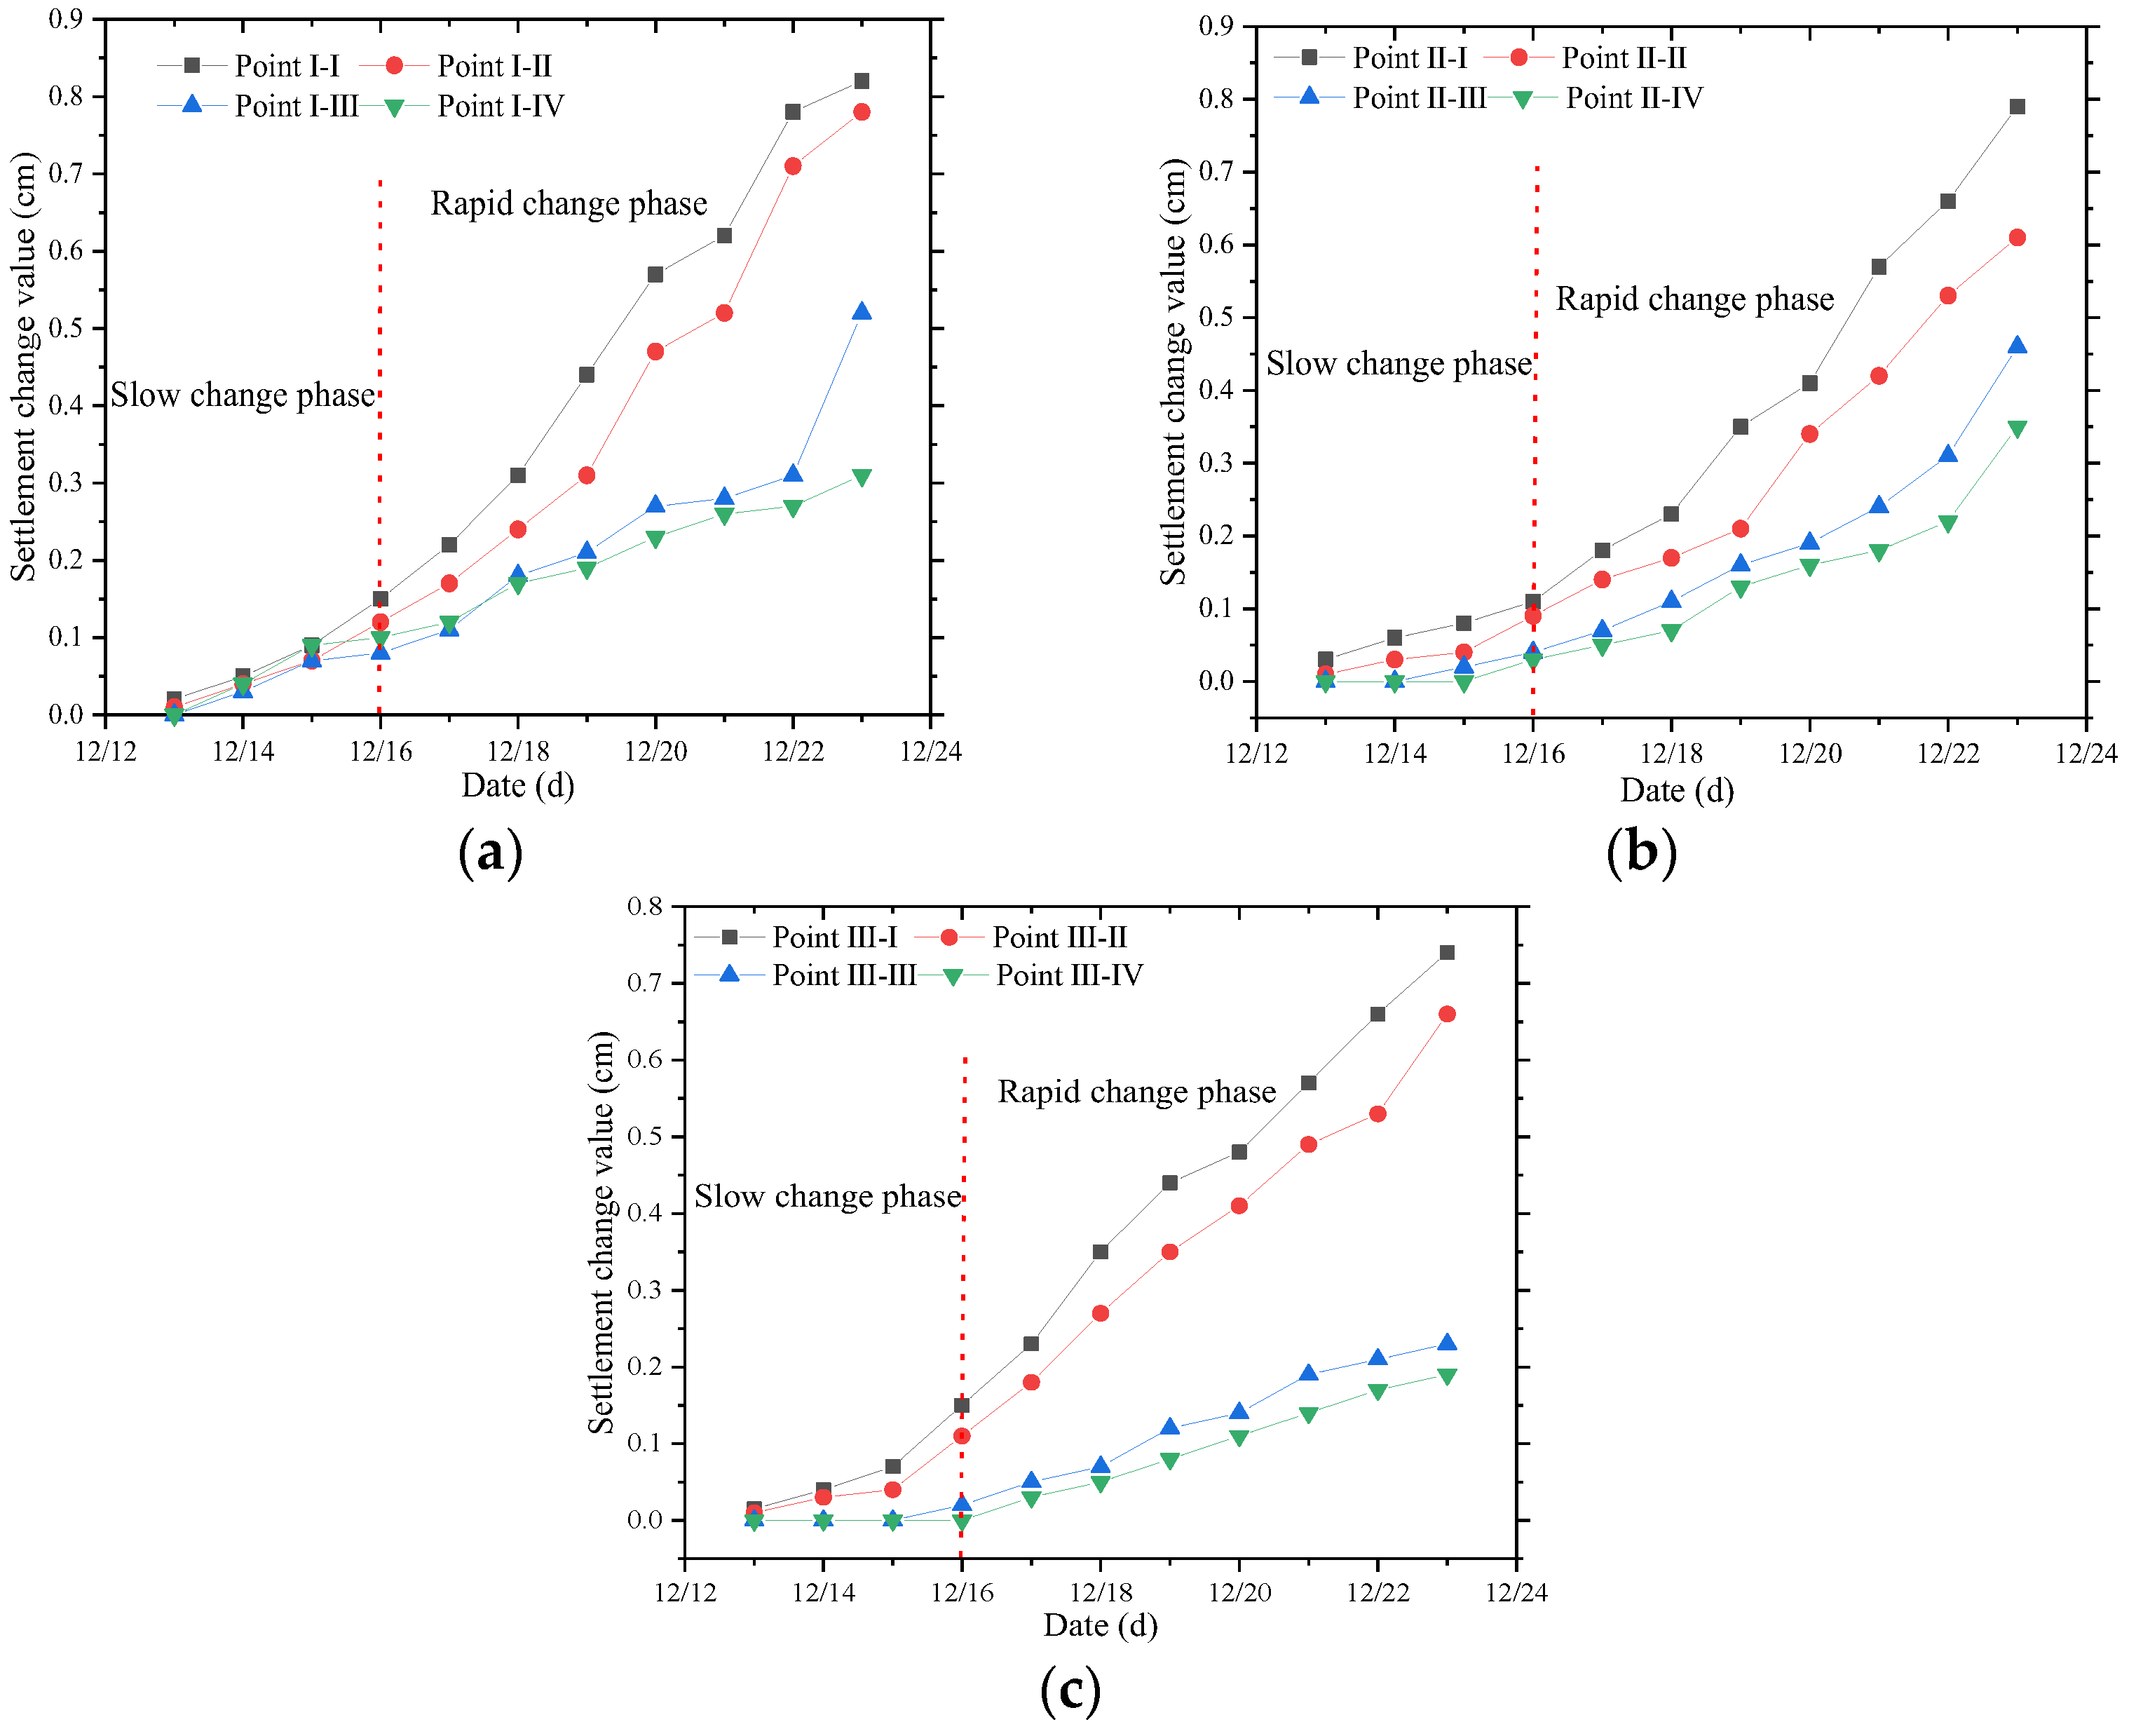
3.2. Settlement Changes with Time
As shown in Figure 11, the most significant settlement deformation occurs at depths of 40 cm and 20 cm, with a more pronounced settlement observed at points closer to the ditch at the foot of the slope. The maximum settlement, 0.81 cm, occurs at point I-I. The settlement behavior of each layer exhibited slow deformation from December 13 to December 16, followed by an increase in deformation from December 16 to December 23. This trend can be attributed to the fact that during the initial stage of water seepage, the external temperature was at its lowest for the entire test period, causing the water infiltrating into the soil to freeze. Additionally, the infiltration process took time, resulting in small settlement deformations in the early stages of the test. A settlement of more than 0.1 cm is considered the threshold for the effective affected area. The settlement lag time at a depth of 40 cm is approximately 4 days, while at 20 cm, the lag time at points I and II is about 5 days, and at points III and IV, it is approximately 7 days. The lag times for the interface points I and II are around 4 days, while for points III and IV, they are approximately 8 days.
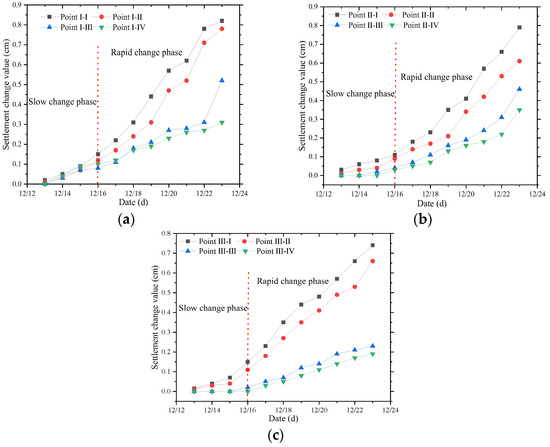
Figure 11.
Settlement with time at different locations. (a) At a depth of 40 cm in the foundation; (b) at a depth of 20 cm in the foundation; (c) interface between the subgrade and foundation.
By comparing Figure 11a–c, it is evident that the settlement at points I and II of each layer is most pronounced, with settlement exceeding 0.5 cm by the end of the test. In contrast, the settlement deformation at points III and IV, located at the interface between the subgrade and foundation, is minimal. This is attributed to the distance of the monitoring area from the water injection point, which limits the spread of water flow. The results indicate that the wetting and softening damage caused by infiltration from the side ditch of the fill subgrade primarily affects the foundation. Overall, the model exhibits a “bending dump” failure due to water seepage.
3.3. Finite Element Settlement Simulation Based on Plaxis
In this section, the settlement of the model was simulated using Plaxis (2024) finite element software. The HS-Small model was employed for calculations during the model creation. The soil layers were classified based on their properties and mechanical parameters, as outlined in the survey report, with similar properties grouped together to simplify the calculation. The permeability of the unsaturated subgrade soil is treated as a transient saturation–unsaturated soil seepage problem. Assuming that the soil skeleton does not deform and that water is an incompressible fluid, the governing equation for the two-dimensional plane problem is expressed as follows:
Note: —water density; , —permeability coefficient of unsaturated soil in the x and y directions; H—total head; —volumetric water content of unsaturated soil; —coefficient of volume change (); g—gravitational acceleration; —pore air pressure; —pore water pressure.
The governing equation is discretized using the finite element method, and time integration is performed using the central difference method. Since infiltration does not affect the model’s periphery, it is assumed that the horizontal displacement at the model boundary is zero, while deformation is permitted in the numerical direction. Additionally, deformation in any direction at the lower boundary is constrained to zero. The physical and mechanical parameters of each soil layer are provided in Table 5. Settlement deformations at the mid-point of seepage (December 18) and at the end of seepage (December 23) were simulated to verify the accuracy of the test.
Table 5.
Physical and mechanical parameters of this model.
The model grid is divided into 11,660 units as shown in Figure 12.
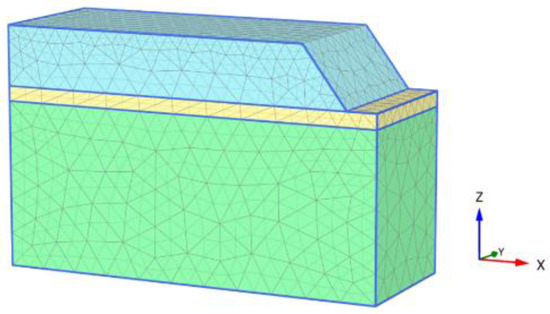
Figure 12.
Model meshing.
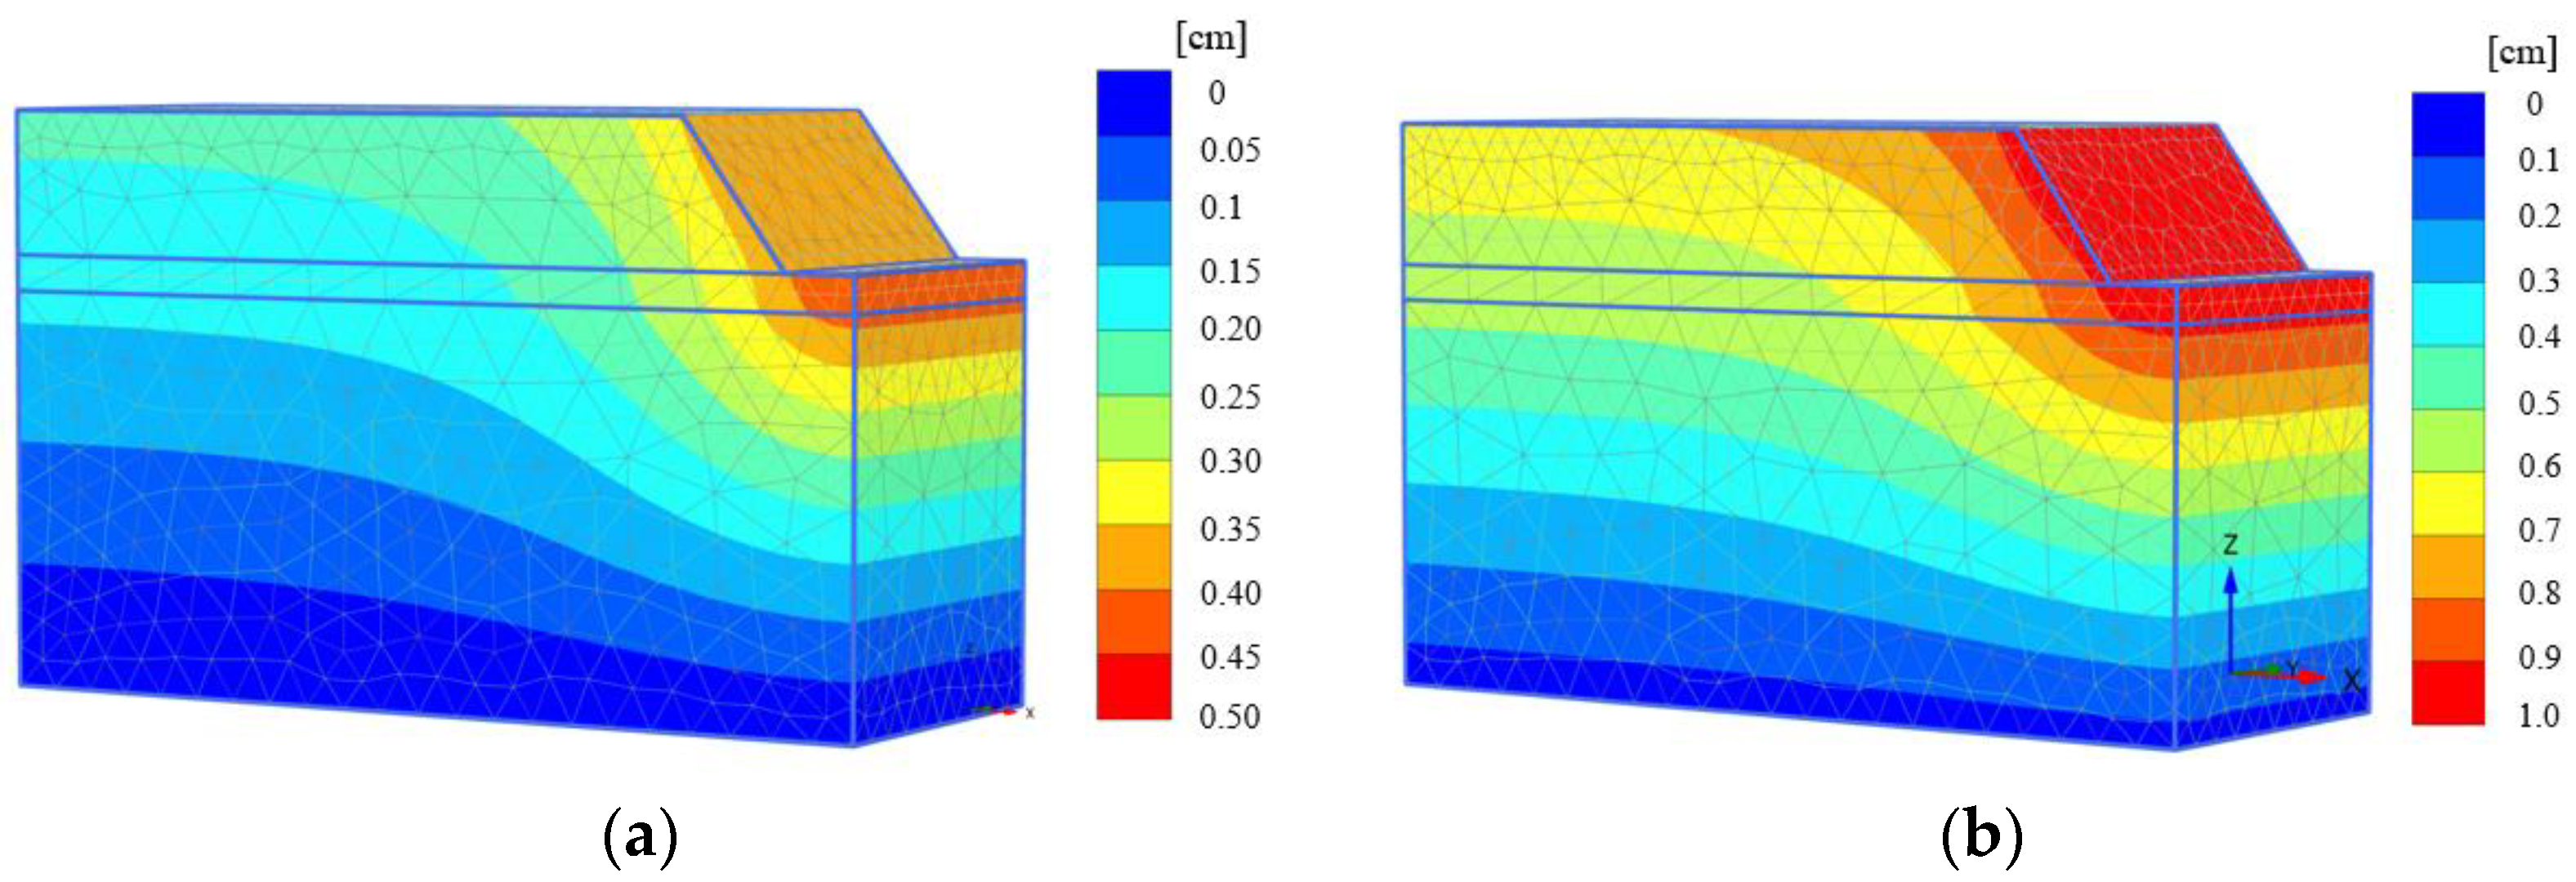
Finite element simulations reveal that settlement primarily occurs in the middle and late stages of water seepage, with an inverted “S” contour distribution. Settlement deformation is more pronounced the closer the location is to the side ditch. This is due to the significant increase in soil moisture content in this area as a result of water seepage, causing the soil mass to collapse under its own weight. During the middle stage of seepage, settlement deformation is relatively small, with the maximum value reaching 0.50 cm near the foot of the slope. By the end of seepage, most of the model’s settlement exceeds 0.40 cm, with the maximum value reaching 1.0 cm, primarily at the side slope and slope foot. A comparison of Figure 13a,b shows that the settlement is predominantly concentrated at the slope foot and in the slope area. This is due to the generation of high pore water pressure and dynamic water pressure at the slope foot, which, combined with water seepage, causes the soil to gradually transition to a wet and soft state. As a result, the slope progressively collapses under its own gravity. The results indicate that water infiltration at the foot of the slope causes significant damage to the foundation and subgrade, leading to considerable settlement deformation. In practical engineering, strengthening slope support and drainage at the foot of the slope is essential.

Figure 13.
Model settlement contour diagram. (a) Mid-phase seepage; (b) later-phase seepage.
Based on the measured data from the model test, the settlement at each monitoring point at a depth of 40 cm ranges from 0.27 to 0.82 cm, while at a depth of 20 cm, the settlement ranges from 0.35 to 0.80 cm. The settlement at the interface between the foundation and the subgrade varies between 0.15 and 0.75 cm.
3.4. Change of Section Moisture Content
In this section, Surfer (15) software is used to analyze the humidity of the embedded sensor section in the model, and the change trend of the moisture content of the section in the middle period of seepage (18 December) and at the end of seepage (23 December) is studied, respectively.
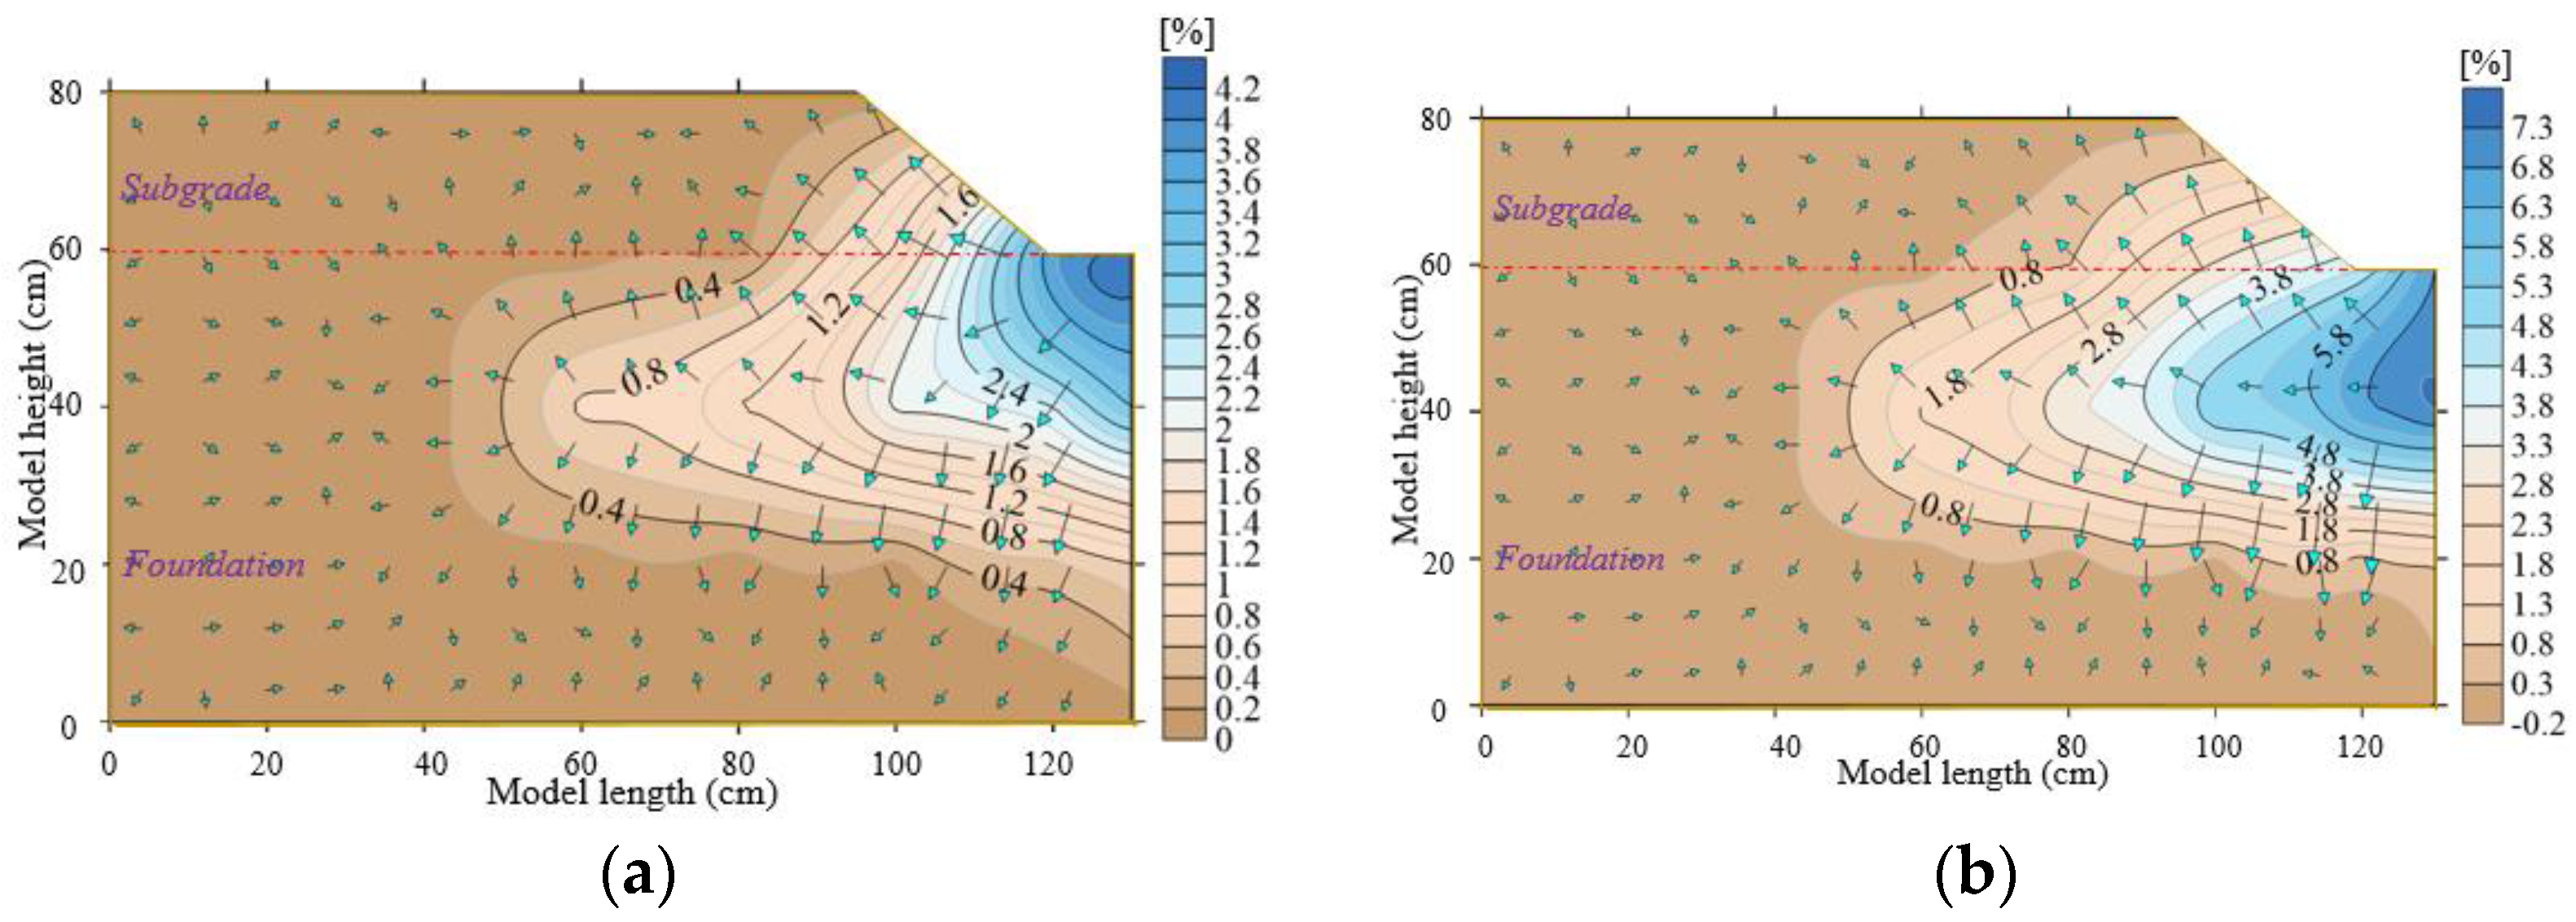
As can be seen from Figure 14a, at the initial stage of seepage, the water flow mainly diffuses horizontally. If a change of 1% in the moisture content is the effective influence area, the influence area is mainly in the circular arc area with the slope foot as the center, where the radius is 40 cm, and the maximum change value reaches 4.2%. As can be seen from Figure 14b, with continuous water injection, the direction of water flow gradually diffuses to all sides, and the influence range approximately presents an arc area with the slope foot as the center of the circle and a radius of 60 cm, with the maximum change value reaching 7.3%. At the end of the test, the bulk moisture content of most regions of the foundation fluctuates, and the bulk moisture content of some of the subgrade fluctuates slightly, which indicates that the water in the ditch at the foot of slope in actual engineering mainly affects the wetting of the foundation and the interface between the subgrade and the foundation and then induces the collapse of the subgrade slope.
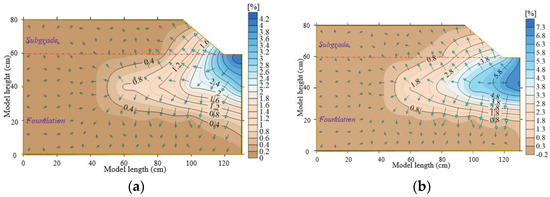
Figure 14.
Contour of the moisture content of this model. (a) Mid-phase seepage; (b) later-phase seepage.
By comparison with Figure 14a,b, it can be seen that seepage diffuses in the form of waves, gradually increases with time and temperature, and the diffusion trend is significant. Changes in the moisture content caused by infiltration are mainly concentrated at the foundation, while the subgrade hardly changes.
3.5. Relationship Between Moisture Content and Settlement Deformation
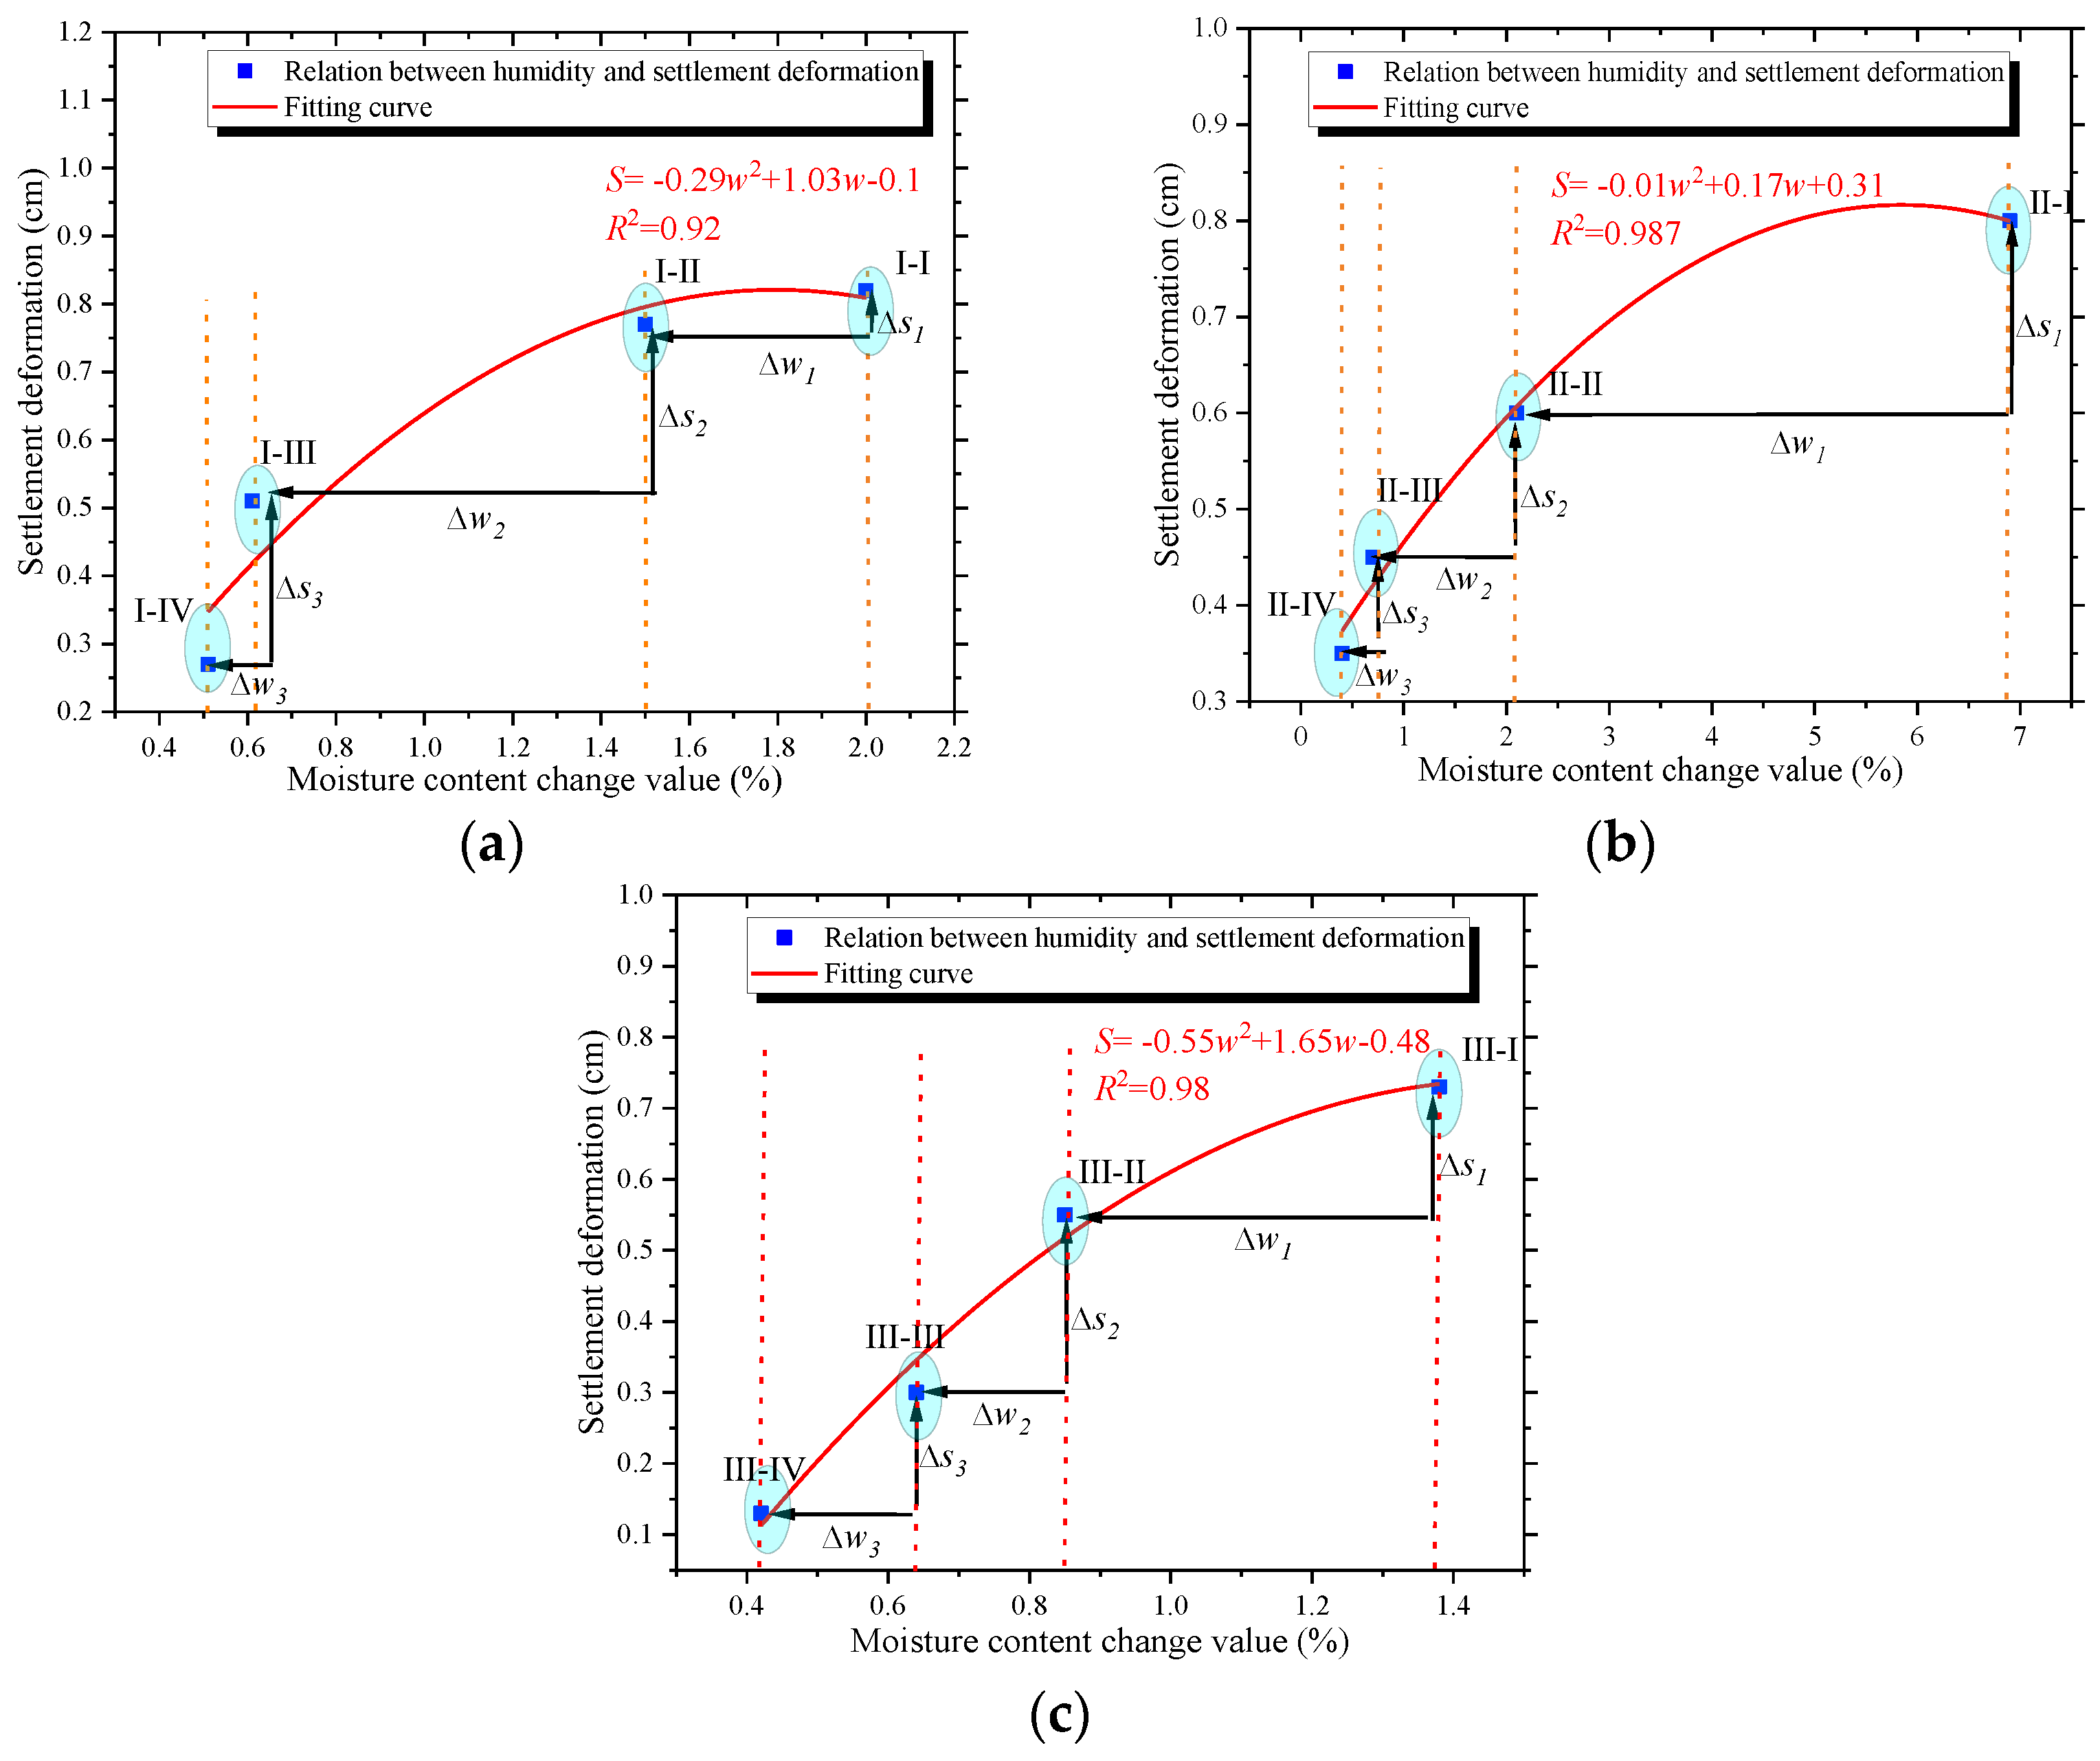
In this section, Surfer software is used to analyze the humidity of the embedded sensor section in the model, and the trend in moisture content at two stages of seepage, the mid-point (18 December) and the end (23 December), is examined. Figure 15 illustrates the changes in moisture content during these two periods. Table 6 shows the settlement fitting equation.
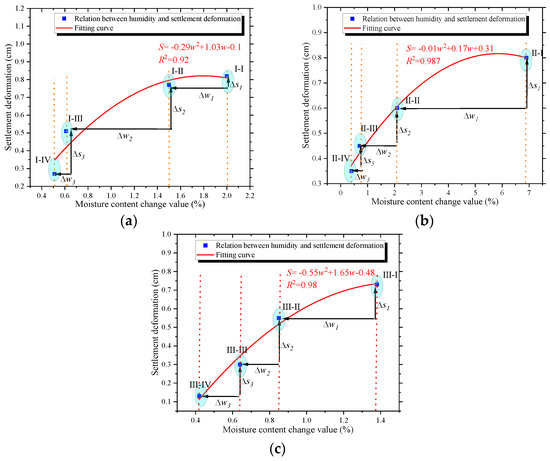
Figure 15.
Moisture content and settlement deformation. (a) At a depth of 40 cm in the foundation; (b) at a depth of 20 cm in the foundation; (c) interface between the subgrade and foundation.
Table 6.
Settlement fitting equations.
As shown in Figure 15a, during the initial stage of seepage, the water flow primarily diffuses horizontally. Defining a 1% change in moisture content as the effective influence area, the impact is mainly concentrated in a circular arc centered at the slope foot with a radius of 40 cm, where the maximum change is 4.2%. As shown in Figure 15b, with continuous water injection, the water flow gradually diffuses in all directions. The influence area expands to an arc with a radius of 60 cm, centered at the slope foot, with the maximum change reaching 7.3%. By the end of the test, the moisture content of most regions of the foundation fluctuates, while some areas of the subgrade show minimal changes. This indicates that in practical engineering, the water in the ditch at the foot of the slope mainly affects the wetting of the foundation and the interface between the subgrade and the foundation, eventually contributing to the collapse of the subgrade slope.
Comparing Figure 15a,b, it is evident that the seepage diffuses in a wave-like pattern, gradually intensifying with time and temperature. The diffusion trend is significant, with changes in the moisture content primarily concentrated at the foundation, while the subgrade remains largely unaffected.
The relationship of accumulated settlement and deformation at each measuring point is shown in Formula (4).
where S—cumulative settlement value;
w—cumulative moisture content value;
a, b, and c—undetermined coefficients.
4. Conclusions
This study investigates moisture infiltration induced by atmospheric precipitation in high-fill loess subgrades during cold periods in Northwest China. Through scaled model testing, we analyze the coupled evolution of the subgrade’s humidity field and settlement deformation. The main conclusions are as follows:
- (1)
- The greatest changes in moisture content and settlement occur at a depth of 20 cm. Within the same layer, the settlement and moisture content increase as the distance to the slope foot decreases. Due to the combined effects of water seepage and cold air, the settlement exhibits a clear lag. A settlement greater than 0.1 cm is considered effective. The settlement lag time near the slope foot is approximately 4 days (with a permeability of 8 L).
- (2)
- The settlement of the subgrade is primarily concentrated in the slope area due to the increased wetness at the foot of the slope, resulting in a “bending tipping failure”. Finite element simulations using Plaxis show that the settlement profile follows an inverted “S” shape.
- (3)
- A quadratic relationship exists between cumulative settlement deformation and the cumulative moisture content change at each monitoring point. The maximum settlement at each layer is approximately 0.8 cm, occurring near the slope foot.
- (4)
- The addition of a temperature sensor can be used to study the freezing depth of soil under cold conditions, as well as the relationship between temperature, moisture, and settlement and deformation.
- (5)
- The incorporation of a slope spraying device can be used to simulate the effects of atmospheric precipitation-induced slope infiltration.
Author Contributions
Conceptualization, W.W. and W.L.; methodology, W.L. and P.Z.; software, W.W. and P.Z.; investigation, P.Z.; resources, P.Z. and L.L.; data curation, W.L.; writing—W.W. and L.L.; original draft preparation, L.L.; writing—review and editing, W.W. and W.L. All authors have read and agreed to the published version of the manuscript.
Funding
This study was funded by the National Natural Science Foundation of China (42302320). Recipient: L.L.
Institutional Review Board Statement
Not applicable.
Informed Consent Statement
Informed consent was obtained from all subjects involved in the study.
Data Availability Statement
All data, models, and codes generated or used during the study appear in the submitted article.
Acknowledgments
None.
Conflicts of Interest
Author W.W., W.L. and P.Z. were employed by the company Jinan Huanghe Road and Bridge Construction Group Co., Ltd. The remaining authors declare that the research was conducted in the absence of any commercial or financial relationships that could be construed as a potential conflict of interest.
References
- Zhao, M.; Chen, L.; Wu, H.; Guo, W.; Ye, C. Computer microscopic test study on the suitability of modified polyimide grease used to improve collapsible loess railway subgrade. Concurr. Comput. Pract. Exp. 2018, 30, e4900. [Google Scholar]
- Asadi, M.; Mallick, R.; Nazarian, S. Numerical modeling of post-flood water flow in pavement structures. Transp. Geotech. 2021, 27, 100468. [Google Scholar]
- Zhong, X.; Liang, Y.; Wang, Q.; Ma, J.; Liang, S.; Wang, Y.; Xu, X. Evaluation and analysis of the effect of lignin amelioration on loess collapsibility. J. Renew. Mater. 2022, 10, 3405. [Google Scholar]
- Showkat, R.; Mohammadi, H.; Babu, G.S. Effect of rainfall infiltration on the stability of compacted subgrades. Int. J. Geomech. 2022, 22, 04022104. [Google Scholar] [CrossRef]
- Remišová, E.; Decký, M.; Podolka, L.; Kováč, M.; Vondráčková, T.; Bartuška, L. Frost index from aspect of design of pavement construction in Slovakia. Procedia Earth Planet. Sci. 2015, 15, 3–10. [Google Scholar]
- Remišová, E.; Briliak, D. Investigation of the environmental degradation of asphalt pavement mixtures. In Proceedings of the 8th International Conference on Road and Rail Infrastructure, Cavtat, Croatia, 15–17 May 2024. [Google Scholar]
- Yao, Y.; Fan, J.; Li, J. A Review of Advanced Soil Moisture Monitoring Techniques for Slope Stability Assessment. Water 2025, 17, 390. [Google Scholar] [CrossRef]
- Tu, G.; Huang, R. Infiltration in two types of subgrades and the effects of rainfall time on the stability of slopes. Q. J. Eng. Geol. Hydrogeol. 2016, 49, 286–297. [Google Scholar]
- Zhou, X.; Zhang, Y.; Li, L.; Zhao, G.; Xu, S. Adhesive performance and impermeability mechanism of loess subgrade using caster oil based polyurethane reinforce. Constr. Build. Mater. 2023, 364, 130006. [Google Scholar]
- Zhao, X.; Zhao, L.; Yang, Q.; Wang, Z.; Cheng, A.; Mo, L.; Yan, J. Permeability and disintegration characteristics of composite improved phyllite soil by red clay and cement. Minerals 2022, 13, 32. [Google Scholar] [CrossRef]
- Ma, B.C.; Tian, W.P.; Li, J.C. Study on Causes and Preventive Measures for Flood Damage of Highway Subgrade along Rivers. Appl. Mech. Mater. 2012, 212, 748–751. [Google Scholar]
- Qiao, Y.; Zhang, S.; Wang, Y.; Dawson, A.; Wake, C.; Ma, T. Simulating floodwater movement in pavements for developing post-flooding time-depth-damage functions. Constr. Build. Mater. 2023, 396, 132408. [Google Scholar]
- Elshaer, M.; Ghayoomi, M.; Daniel, J.S. Impact of subsurface water on structural performance of inundated flexible pavements. Int. J. Pavement Eng. 2019, 20, 947–957. [Google Scholar] [CrossRef]
- Jiang, Y.; Yi, Y.; Tian, T.; Sha, H.; Fan, J.; Ji, X.; Xue, J. Water Infiltration and Water Stability of Compacted Loess Subgrades Based on Vibration Compaction. Arab. J. Sci. Eng. 2022, 47, 4987–5001. [Google Scholar]
- Liu, K.; Ye, W.; Sun, X.; Dang, F.; He, M.; Duan, Z.; Wang, Q. Revealing the mechanisms of water permeability enhancement of urban loess subgrades due to vibration application. Transp. Geotech. 2024, 48, 101346. [Google Scholar]
- Zhang, J.; Hu, H.; Peng, J.; Zhang, Y.; Zhang, A. Enhanced understanding of subgrade soil hydraulic characteristics: Effects of wetting–drying cycles and stress states on subgrade water migration. J. Hydrol. 2024, 635, 131165. [Google Scholar]
- Yue, J.; Zhang, H.; Zhang, Y.; Xu, S. Experimental investigation of influence of amide polymer on loess for subgrade. Sci. Rep. 2024, 14, 12229. [Google Scholar]
- Sim, M.L.; Ling, F.N.L.; Zaihasra, A.T. Analytical study on effect of groundwater table and rainfall infiltration on the stability and performance of Muar Trial Subgrade by using PLAXIS 2D. In Proceedings of the IOP Conference Series: Earth and Environmental Science, Bangkok, Thailand, 22–24 May 2019; IOP Publishing: Bristol, UK, 2024; Volume 1347, p. 012061. [Google Scholar]
- Liu, L.; Li, Z.; Cai, G.; Liu, X.; Yan, S. Humidity field characteristics in road subgrade constructed with recycled construction wastes. J. Clean. Prod. 2020, 259, 120977. [Google Scholar] [CrossRef]
- Liu, W.; Yu, W.; Fortier, R.; Chen, L.; Lu, Y.; Zhang, M.; Hu, D. Thermal effect of rainwater infiltration into a replicated road subgrade in a cold environmental chamber. Cold Reg. Sci. Technol. 2019, 159, 47–57. [Google Scholar]
- Tai, B.; Yue, Z.; Qi, S.; Wang, P. Experimental and numerical investigation on thermal-moisture-mechanical behaviors on a new anti-frost cutting bed of high-speed railway in deep seasonally frozen ground regions under extreme climate. Comput. Geotech. 2021, 136, 104251. [Google Scholar]
- Chen, S.L.; Dong, K.H.; Shi, J.J.; Yu, T.; Huang, J. Infiltration Time Effects of Compressibility of Cement Soil. Appl. Mech. Mater. 2013, 405, 10–14. [Google Scholar]
- Zhao, L.; Gray, D.M.; Toth, B. Influence of soil texture on snowmelt infiltration into frozen soils. Can. J. Soil. Sci. 2002, 82, 75–83. [Google Scholar] [CrossRef]
- Stuurop, J.C.; van der Zee, S.E.; French, H.K. The influence of soil texture and environmental conditions on frozen soil infiltration: A numerical investigation. Cold Reg. Sci. Technol. 2022, 194, 103456. [Google Scholar]
- Wen, P.; Wang, C.; Gao, X.; Chen, M.; Chai, Z. Effect of environmental factors on mechanical properties and damage characteristics of mine overburden used in subgrade. Int. J. Pavement Eng. 2023, 24, 2032698. [Google Scholar]
- Li, W.; Yu, L.; Tan, Y.; Wu, L.; Qian, J. Mechanical properties and impact behavior of frozen clay: Insights from static mechanical tests, fly-plate tests, and split-Hopkinson pressure bar analysis. Phys. Fluids 2024, 36, 057138. [Google Scholar]
- Peng, Y.; Yu, L.; Qian, J.; Li, W.; Zhang, T.; Zhou, L. Dynamic tensile behavior and crack propagation in coral aggregate seawater shotcrete: Experimental investigation and numerical simulation. Cem. Concr. Compos. 2025, 159, 106010. [Google Scholar]


Disclaimer/Publisher’s Note: The statements, opinions and data contained in all publications are solely those of the individual author(s) and contributor(s) and not of MDPI and/or the editor(s). MDPI and/or the editor(s) disclaim responsibility for any injury to people or property resulting from any ideas, methods, instructions or products referred to in the content. |
© 2025 by the authors. Licensee MDPI, Basel, Switzerland. This article is an open access article distributed under the terms and conditions of the Creative Commons Attribution (CC BY) license (https://creativecommons.org/licenses/by/4.0/).