Article

Revolutionizing Open-Pit Mining Fleet Management: Integrating Computer Vision and Multi-Objective Optimization for Real-Time Truck Dispatching

by
Kürşat Hasözdemir
,
Mert Meral
and
Muhammet Mustafa Kahraman
*
Mining Engineering Department, Istanbul Technical University, Istanbul 34475, Turkey
*
Author to whom correspondence should be addressed.
Appl. Sci. 2025, 15(9), 4603; https://doi.org/10.3390/app15094603
Submission received: 17 February 2025 / Revised: 7 April 2025 / Accepted: 9 April 2025 / Published: 22 April 2025

Abstract

:
The implementation of fleet management software in mining operations poses challenges, including high initial costs and the need for skilled personnel. Additionally, integrating new software with existing systems can be complex, requiring significant time and resources. This study aims to mitigate these challenges by leveraging advanced technologies to reduce initial costs and minimize reliance on highly trained employees. Through the integration of computer vision and multi-objective optimization, it seeks to enhance operational efficiency and optimize fleet management in open-pit mining. The objective is to optimize truck-to-excavator assignments, thereby reducing excavator idle time and deviations from production targets. A YOLO v8 model, trained on six hours of mine video footage, identifies vehicles at excavators and dump sites for real-time monitoring. Extracted data—including truck assignments and excavator ready times—is incorporated into a multi-objective binary integer programming model that aims to minimize excavator waiting times and discrepancies in target truck assignments. The epsilon-constraint method generates a Pareto frontier, illustrating trade-offs between these objectives. Integrating real-time image analysis with optimization significantly improves operational efficiency, enabling adaptive truck-excavator allocation. This study highlights the potential of advanced computer vision and optimization techniques to enhance fleet management in mining, leading to more cost-effective and data-driven decision-making.

1. Introduction

While technologies for collecting data are becoming better thanks to sensor technologies, higher processing power, and storage capacities, mining and other industries have found a lot of creative ways to use them. Digital camera systems are now a practical and effective instrument for monitoring mining activities since their cost has reduced drastically in recent decades. Although security and surveillance are their primary applications, cameras have many more potential uses other than observation. Computer vision algorithms looking at images taken by cameras positioned over the mining site may extract basic knowledge about equipment movement, operational conditions, traffic patterns, and infrastructure state. Cameras on equipment paths may gather data for tracking vehicle position, speed, and activity. This research allows one to assess speed rule adherence, traffic density, and road conditions. This information can offer important operational insights and help to increase the success of decision-making processes. With the declining cost of CCTV camera technology, these cameras have increasingly been utilized in mines as a safety measure. Although CCTV cameras provide a lot of information, past studies on how this information can be utilized for mine management have been limited. This study is a bid to fill a gap via an exploration of the contribution of computer vision, especially through the construction of a YOLO model, in providing input parameters for truck dispatching algorithms in real time in the context of an operational mine. This application illustrates, via the optimization of material flow and operational performance enhancement, the application of computer vision technology in a mining environment.

Applications of Computer Vision Technology

Bulk material piles in aerial imagery were suggested to be segmented using computer vision (CV) in [1], thereby automating inventory control in industries such as mining and construction. Reliance on assumptions about heap shapes or material types is avoided by the method, with color, texture, and surface topography being utilized as input factors. Manmade heaps can be distinguished from natural features, nearby heaps of the same material can be identified, and irregularly shaped heaps can be divided. The method’s potential is demonstrated by F1 scores of 0.90 for pixelwise segmentation and 0.70 for object recognition.
The potential utilization of FinTech solutions driven by deep learning for sustainable mineral extraction and use was investigated in [2]. A quantized variation in the efficient deep learning model was proposed for mineral identification, resulting in reduced model size and complexity while performance was maintained. An 8-bit symmetric quantization technique was applied to a specific mineral dataset, yielding improved results. A precision of 0.97, a recall of 0.89, and an accuracy of 99.5% were achieved by the quantized model, surpassing the performance of the floating-point model.
By forecasting mineral concentrate grades using image processing and deep learning techniques, Refs. [3,4] address the challenge of controlling the froth flotation process in the mining industry. For Zn, Pb, Fe, and Cu concentration grades in real-world industrial evaluations, image processing was utilized to extract important froth properties, including texture, bubble size, velocity, and color distribution, and obtained high accuracy (up to 0.94) and presented precision errors below 4.53%. These results highlight the potential of the method as an AI-driven online analyzer for improving the performance and real-time control of complex polymetallic flotation circuits.
The importance of appropriately monitoring spoil pile heights in the dragline overburden (OB) removal operation was addressed in [5]. This is a practice required for in-pit space optimization and, concurrently, safety and productivity in mining operations. This operation entails real-time monitoring of dump pile heights to confirm that they are in compliance with dragline balancing diagrams for the offering of stable dump profiles. The proposed method estimates dump pile heights in real-time with an 84.6% F1-confidence score and a 99.49% mean average precision (mAP) using the YOLO technique. Using 2D computer vision on simulated video data, the method provides a quick, cheap, real-time dump profile recognition and pile height estimate system. This invention guarantees that stable and safe dump heights with the given design criteria are maintained, therefore increasing the production of dragline mining.
Using 2042 training photos and 284 new images across 68 types, Ref. [6] used a tech based on how computers see to sort gems by type on their own. They checked these photos in just 0.0165 s using a top model that mixed Random Forest with RGB color data and local binary patterns and obtained a 69.4% hit rate. This result was the same as that of human gem experts, who took 42 to 175 min to sort the same photos but obtained scores ranging from 42.6% to 66.9%. Even though the human experts were slower, the computer tech was a bit more on target, showing how useful this tool could be in studying gems and similar fields.
Examining how an anti-collision system with computer sight sees persons traveling in deep mines, major safety concerns like poor sight and concealed places that might cause major incidents and deaths are addressed in [7]. Following PRISMA guidelines, a complete review sorts past systems based on the kind of sensor (i.e., cameras or lidar) and evaluates their performance in deep, dark environments.
The integration of machine learning and computer vision in tunneling and underground construction was explored in [8], along with their unique applications and challenges compared to above-ground construction, and an overview of emerging technologies in the architecture, engineering, and construction industry was provided. Specific applications, such as real-time monitoring, geological prediction, and automated equipment control, are enabled by these technologies, while challenges like limited visibility, complex subsurface conditions, and data scarcity are faced, distinguishing them from above-ground contexts. Emerging technologies, including Building Information Modelling (BIM), digital twins, and advanced robotics, are highlighted as transformative tools, with their potential to enhance efficiency, safety, and sustainability across the industry being emphasized.
The role of computer vision (CV) in enhancing e-waste management by automating and streamlining waste processing was examined in [9]. Computer vision is expected to reduce human intervention, processing time, and cost, thus increasing the efficiency and sustainability of e-waste management. In India, where e-waste management is a major environmental and social challenge, CV is a must. In intelligent transportation systems (ITS), CV is utilized to boost efficiency, intelligence, and safety [10]. Hand gesture recognition techniques using CV are reviewed for applications in communication for the deaf-mute, robot control, human–computer interaction, home automation, and medical fields [11]. Automated fruit and vegetable sorting and grading with CV are assessed, highlighting improved consistency, productivity, and economic growth by evaluating appearance for market value and quality [12]. Civil infrastructure condition assessment employs CV with remote cameras and UAVs for non-contact monitoring, addressing automation challenges, and ongoing research [13]. In agriculture, CV’s potential and challenges in monitoring pig behavior for animal welfare in commercial production systems are described, noting dataset creation issues [14]. Offsite construction benefits from CV, with its applications, algorithms, and performance evaluated in a scoping review [15]. Safety in construction is improved through CV and deep learning frameworks, focusing on identifying unsafe conditions and behaviors despite implementation challenges [16]. Lastly, crime detection, prevention, and resolution are enhanced by CV and machine learning, with examples demonstrating effectiveness and statistical improvements in law enforcement [17]. Across these sectors, CV drives innovation while facing unique technical and practical challenges.

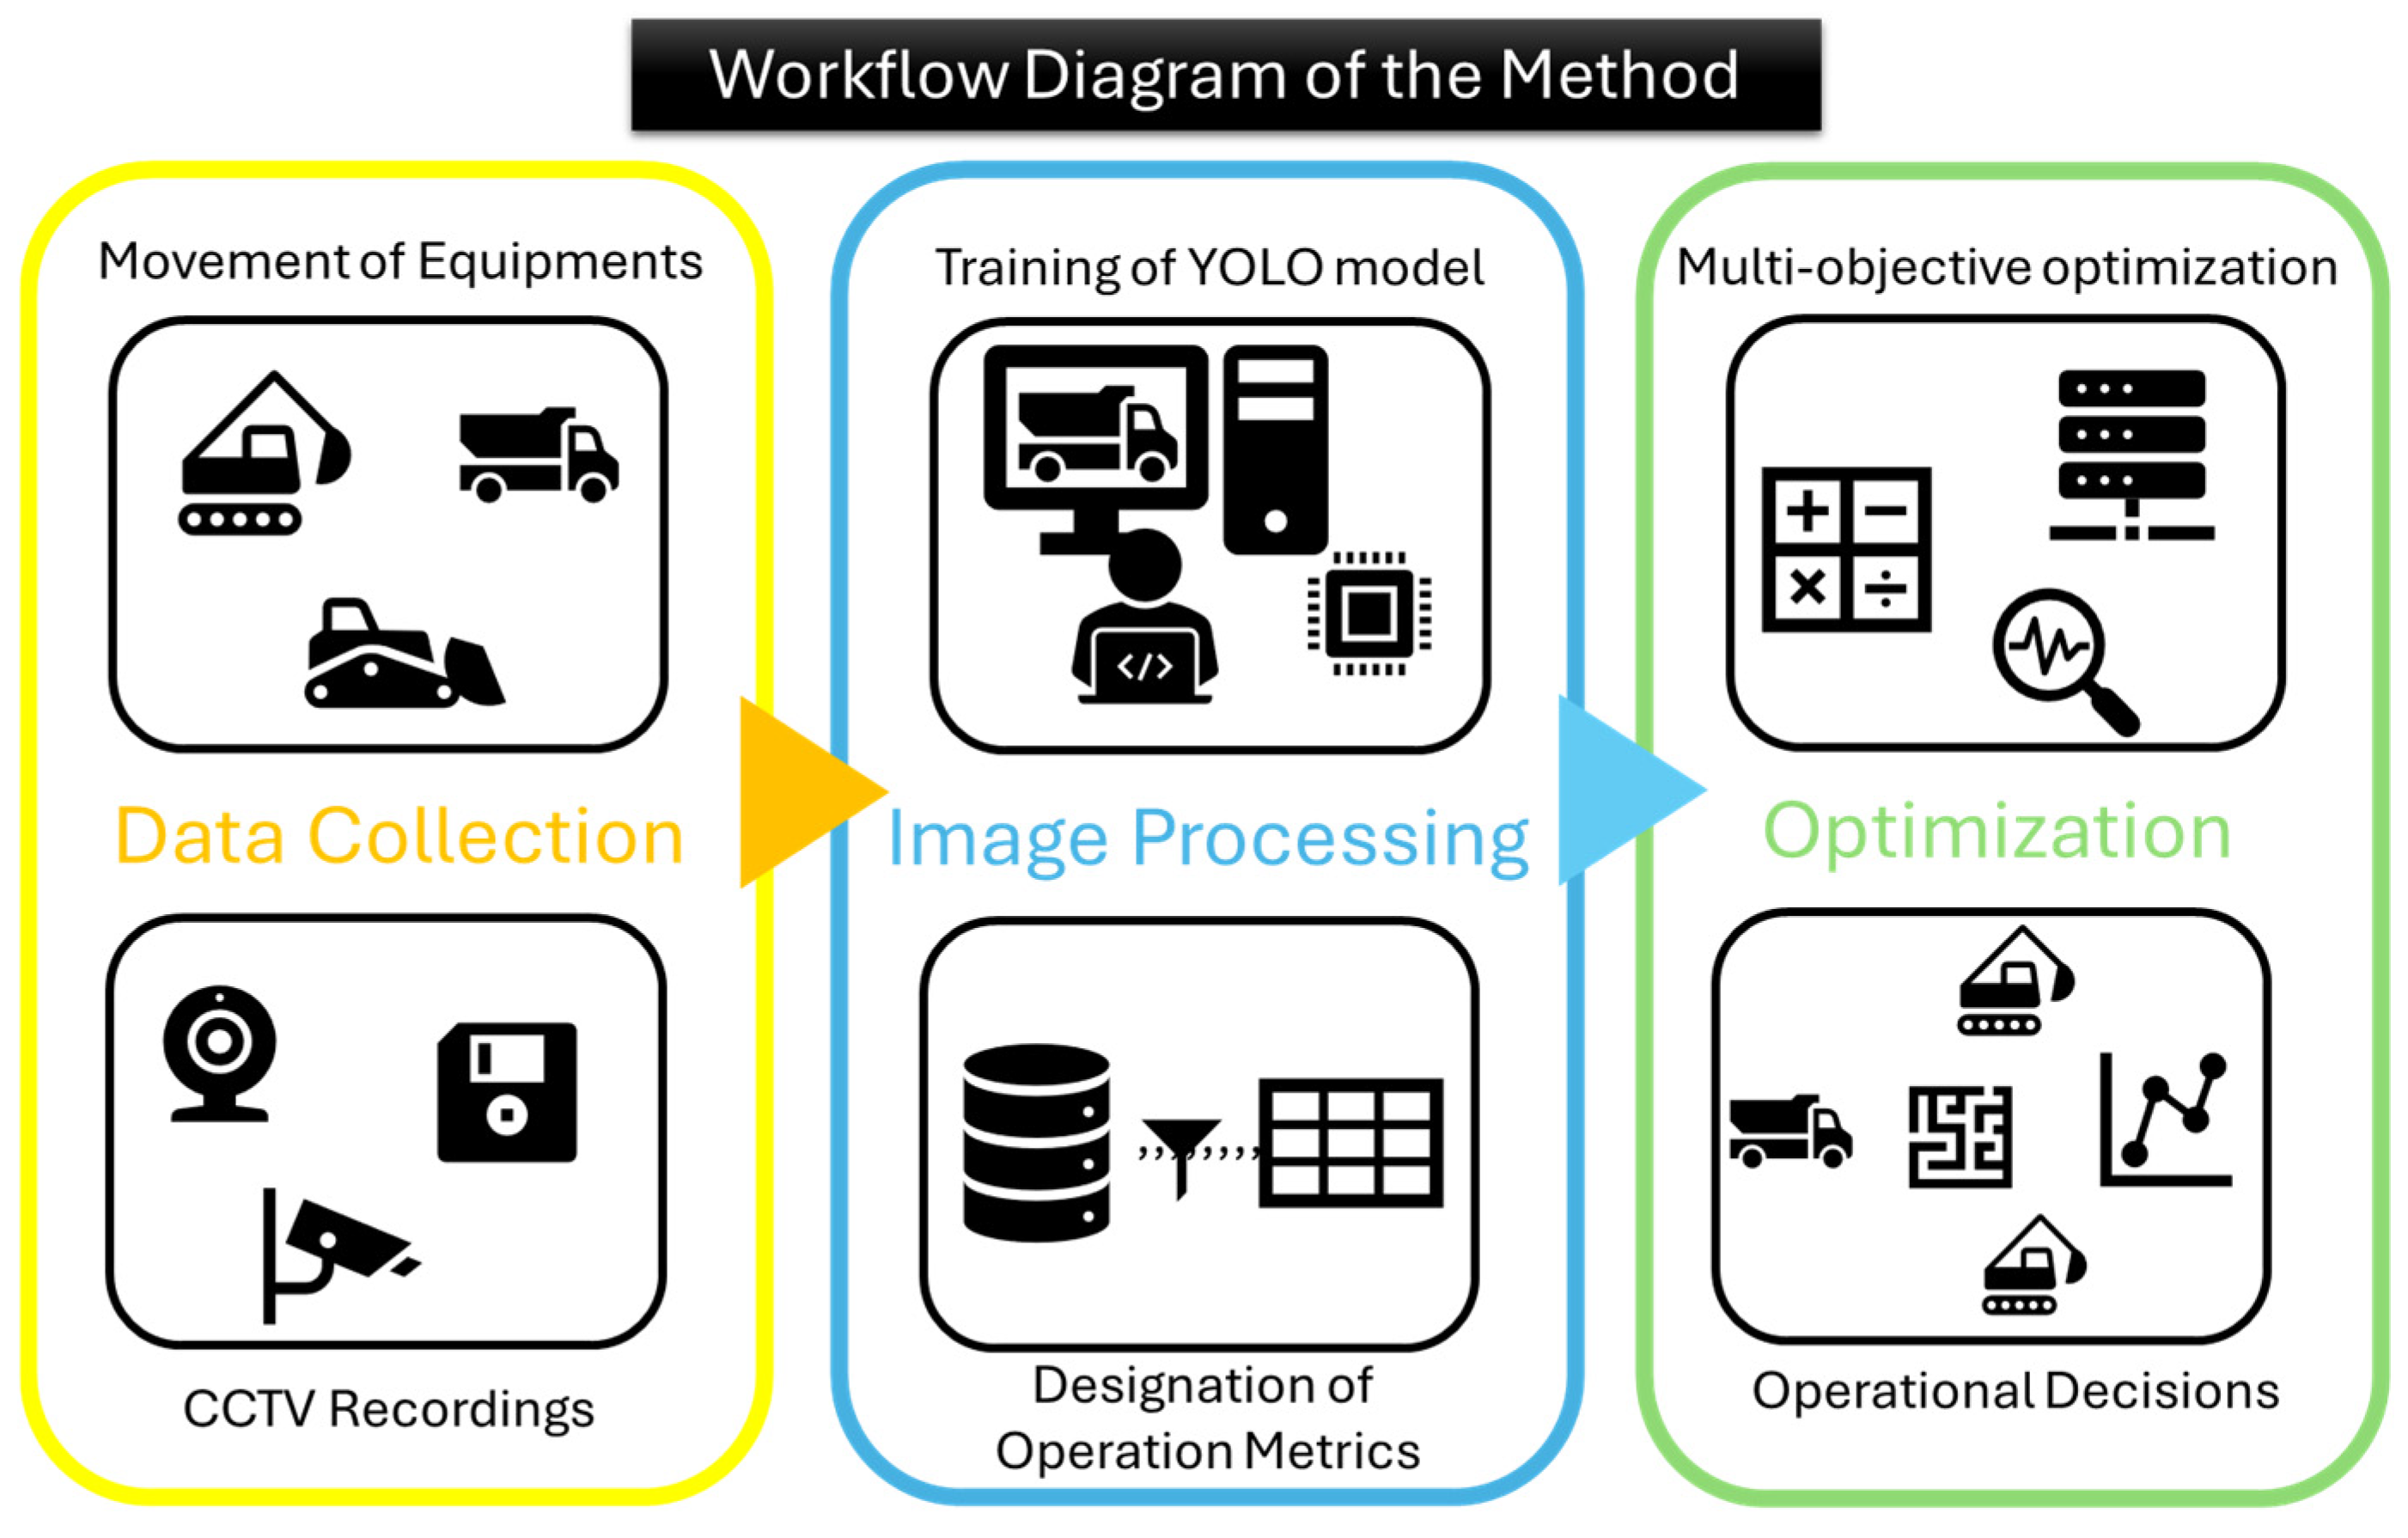
2. Materials and Methods

Traditionally, fleet management in mining has relied on fixed routes and manual dispatching, which, while the cheapest to start, become costly over time due to their inefficiencies. In contrast, real-time fleet management systems offer unparalleled optimization but come with high costs and slow implementation, best suited for large mines with significant capital. A computer vision-based approach emerges as a compelling alternative—relatively inexpensive and faster to deploy, delivering actionable real-time insights for small-to-medium fleets. Compared to the CV approach as a baseline, real-time fleet management systems can range from 6 to 30 times more expensive per unit, reflecting their comprehensive hardware, software, and integration demands. For mining operations aiming to balance cost and efficiency without the complexity of enterprise solutions, CV provides a practical, scalable starting point. For real-time fleet management by CV, it is critical to collect and use data from video recordings of operations. This study uses CCTV recordings for object detection to identify trucks and excavators, spatial-temporal analysis for equipment locations and interactions, and activity classification to classify activities like loading, hauling, or queuing. The YOLO model, a state-of-the-art object detection algorithm, is employed to analyze visual data from an operating open-pit mine.
The steps of the method appear in Figure 1. The proposed system operates within a local CCTV network, ensuring continuous functionality without reliance on external internet connectivity. All video feeds from the CCTV cameras are transmitted to a Network Video Recorder (NVR) located in the system center. The NVR subsequently forwards the recorded footage to the central system computer, where the object detection algorithm processes the video data locally. The method focuses on setting the start times of excavators and trucks at dump places to help pick the best truck-to-excavator match-ups. This picking process is formulated as a two-goal math task: to cut down on the wait time of excavators and to lower the deviation from daily targets. To check the trade-offs between these goals, the epsilon limit method is used, making the Pareto line clear. This way shows the possible swaps and aids in making choices to keep work speed good while achieving work targets.

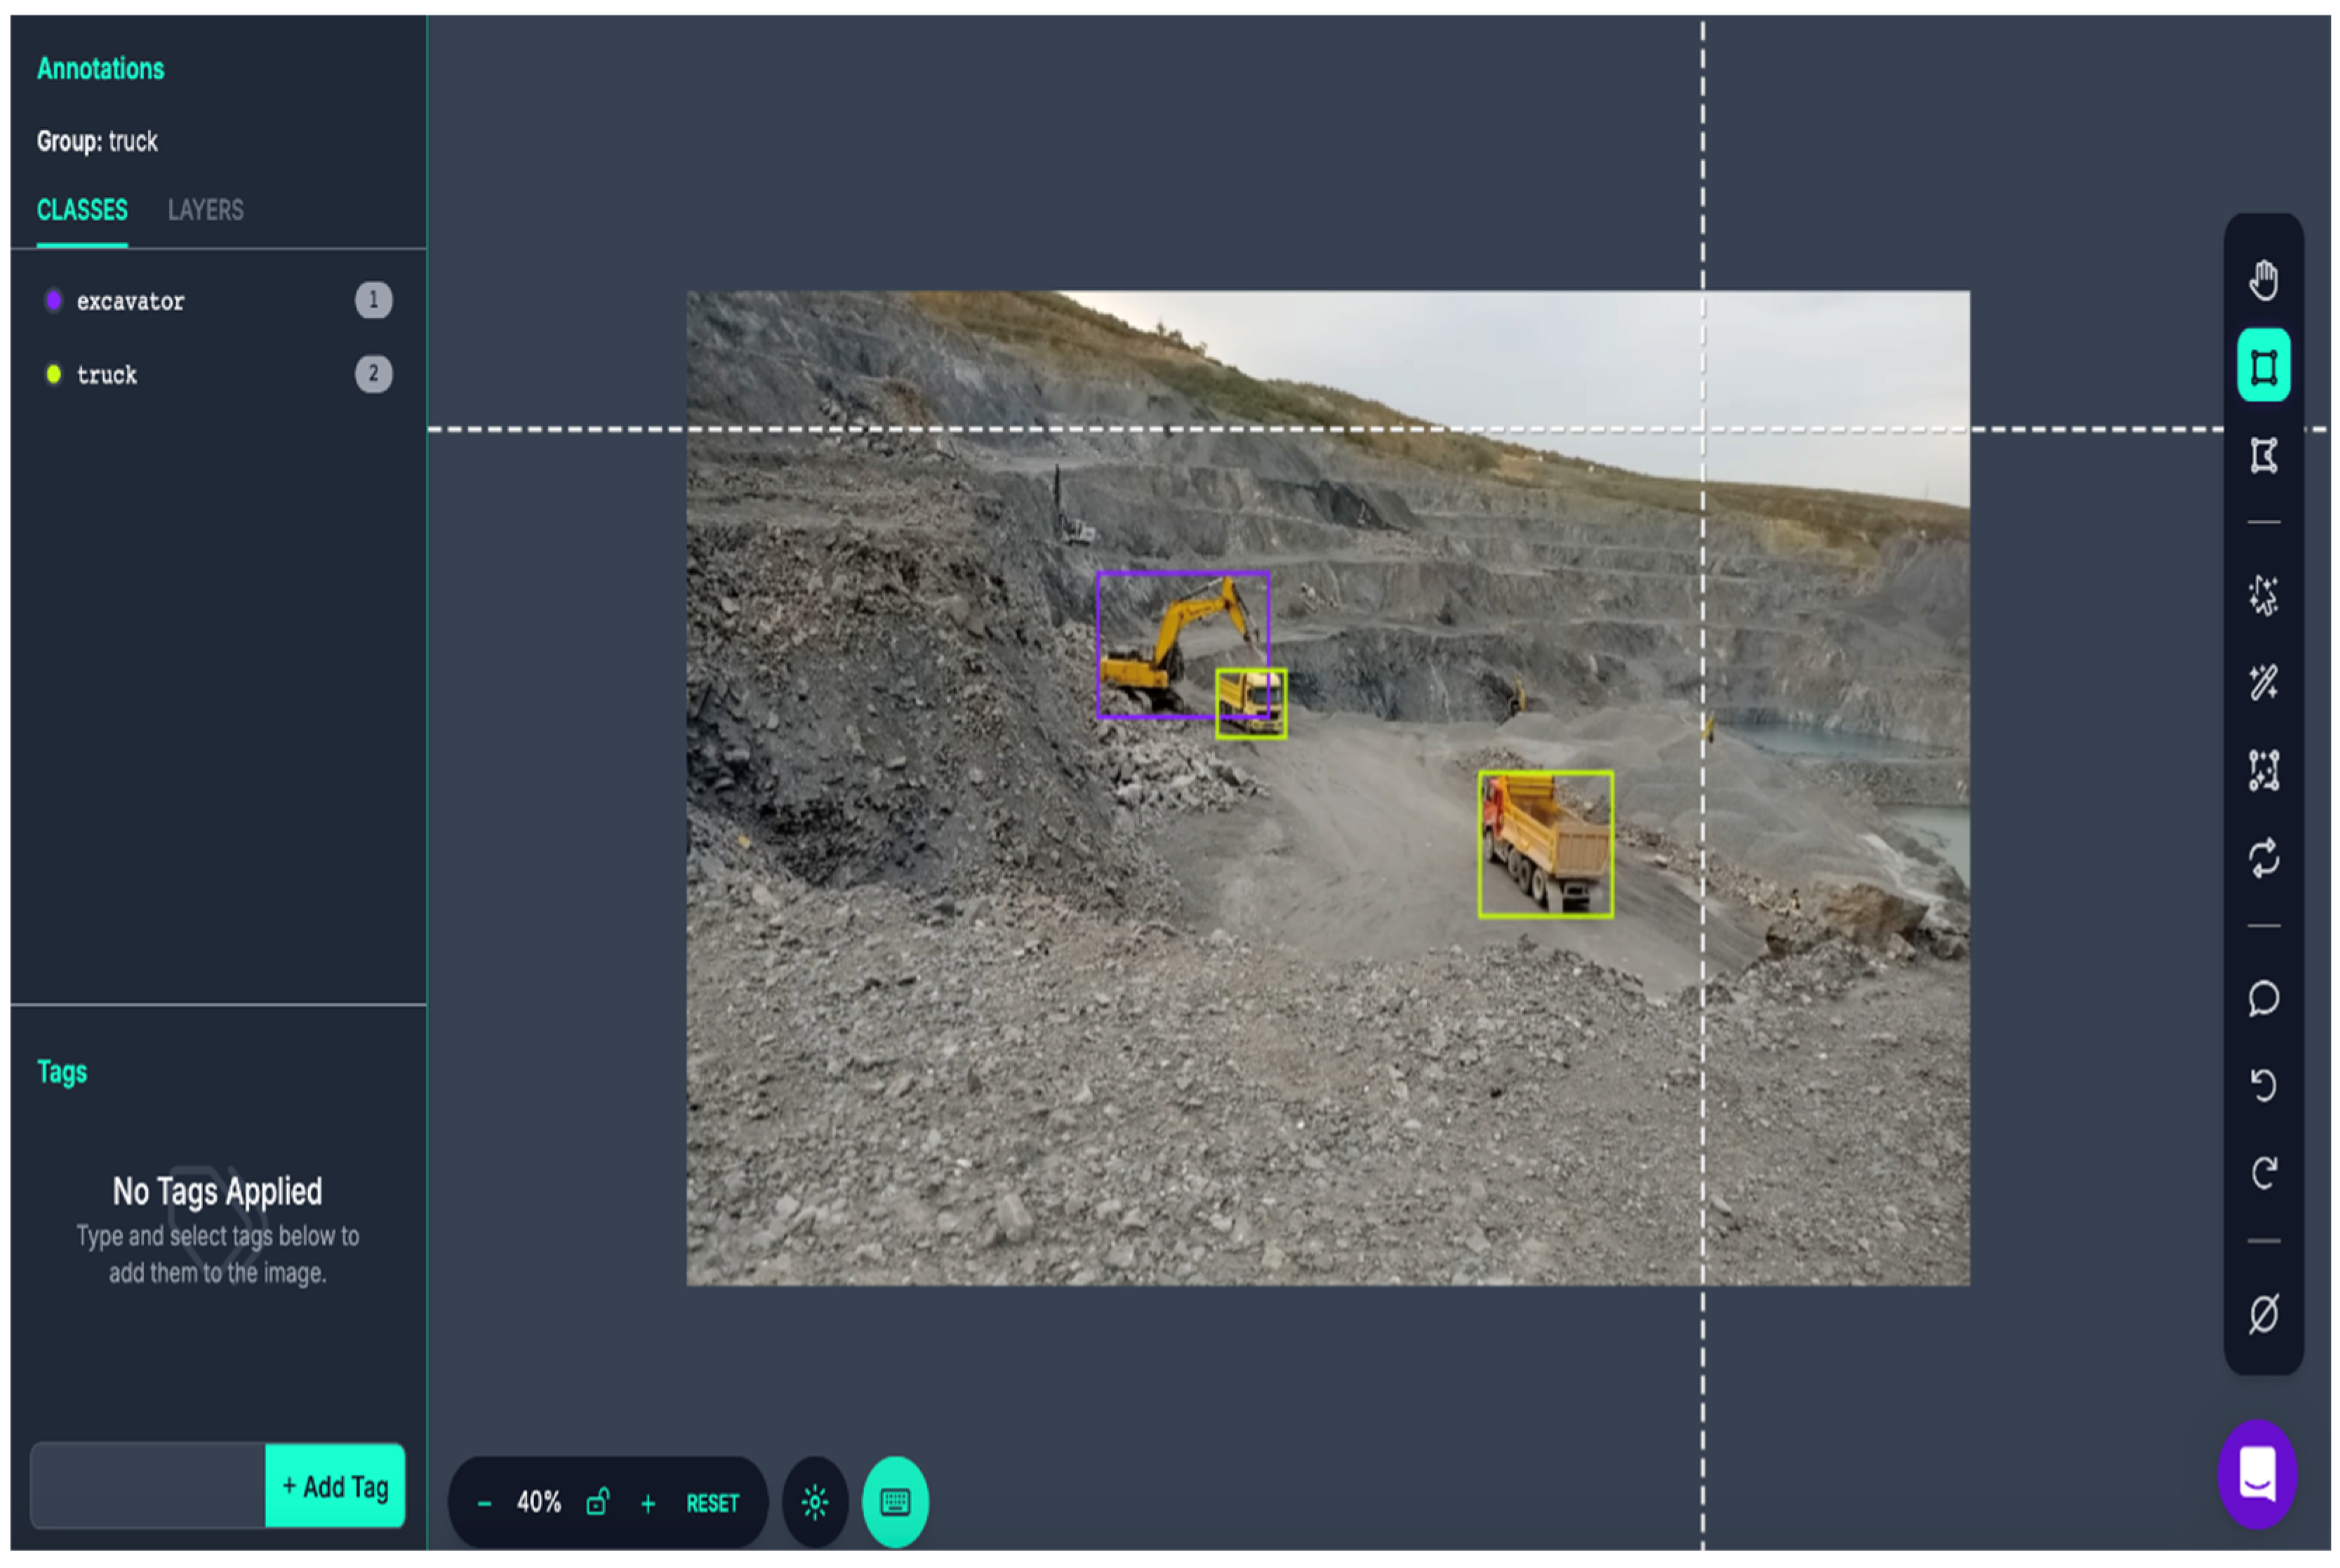
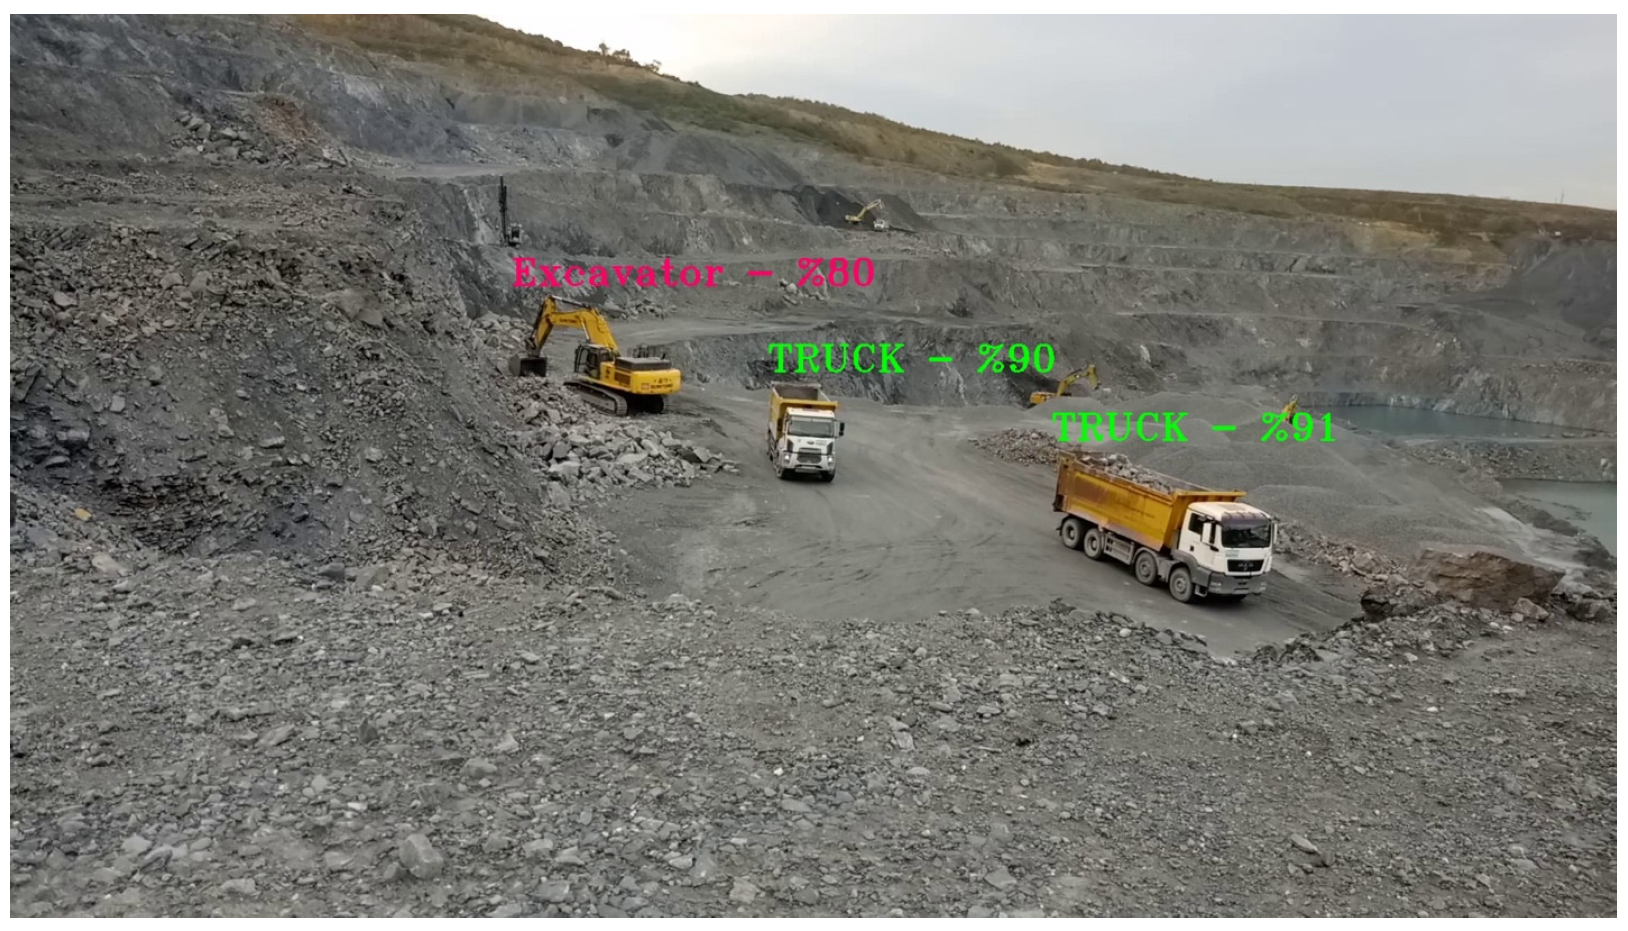
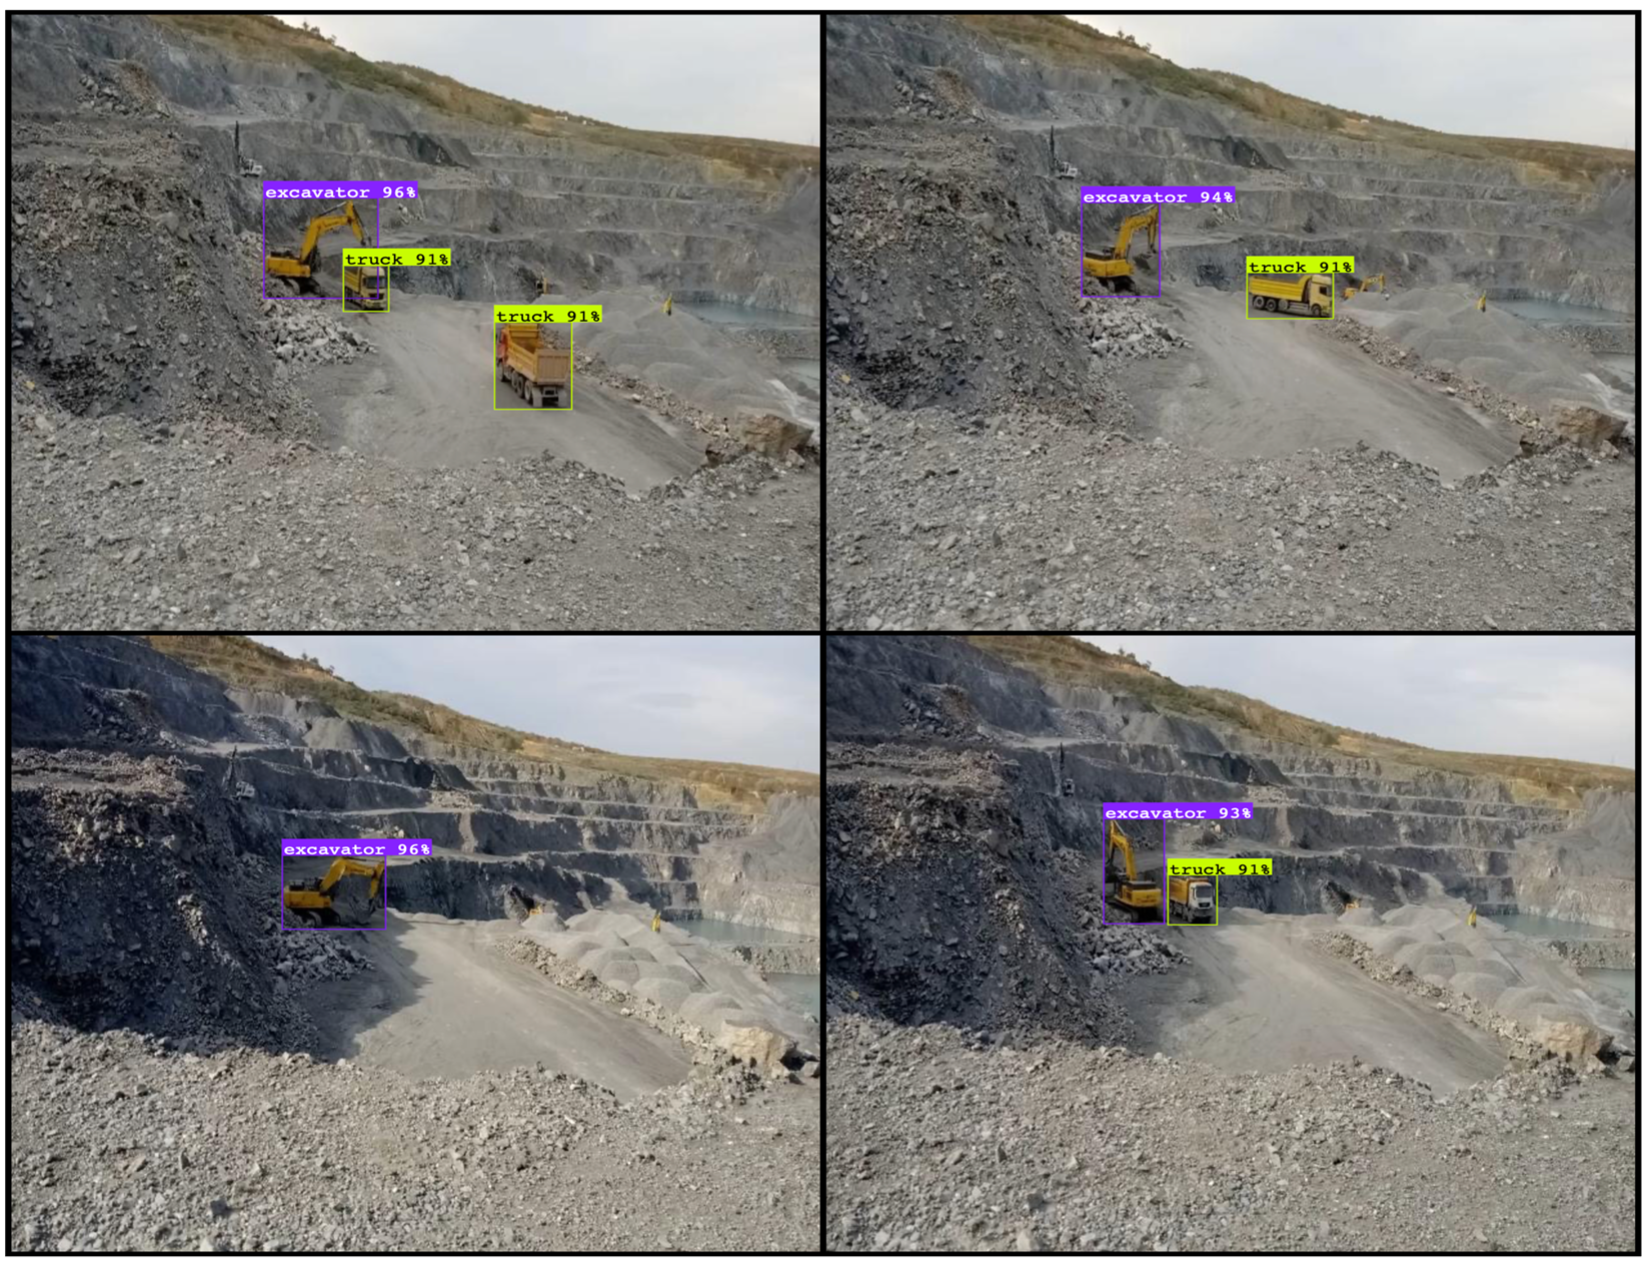
2.1. Image Detection with YOLO Model

The YOLO (You Only Look Once) model is a unique deep learning framework for real-time object detection, known for its accuracy and efficiency. This technique uses a single forward pass of a convolutional neural network (CNN) to enable concurrent object localization and classification in pictures, therefore removing the need for complex multi-stage pipelines usually used in object identification. With each iteration—YOLOv2, YOLOv3, and YOLOv4—the YOLO framework has seen notable improvements in detection accuracy, processing efficiency, and the capacity to recognize small objects under complex situations. Recent iterations, including YOLOv5 and YOLOv7, have provided architectural designs with fresh concepts, including better feature extraction methods and training methodologies. The most recent installment, YOLOv8, clearly advances the YOLO family [18]. Released by Ultralytics, YOLOv8 presents contemporary deep learning advances, including a more efficient backbone and head architecture, hence improving feature extraction and recognition of tiny and overlapping objects. Furthermore, YOLOv8 gives usability first importance as it guarantees its operation as a versatile and efficient tool for object detection throughout numerous uses by means of smooth interaction with modern machine learning systems and approaches [19]. Figure 2 demonstrates the exact improvements in YOLO models.
The modern object identification method YOLO v8 is used to examine visual data from a working open-pit mine. Image tagging and segmentation are performed on the Roboflow platform in preparation for training the YOLO v8 model. By allowing exact annotation of object classes—that is, idle, loading, truck at dump, and truck at queue—this platform simplifies the dataset preparation. Roboflow was shown frames taken from video footage. A total of 1480 video frames were all tagged, and 1880 excavator items and 1901 truck objects were among them. One may observe a tagged video frame in Figure 3. Pre-processing methods are applied to the dataset to guarantee the best performance of the YOLO v8 model. These methods comprise image resizing to fit the input size requirements of the model, pixel value normalization to enable faster and more stable model training, and augmentation via transformations including rotation, flipping, and brightness modification to improve the variation in the dataset. These preparation techniques greatly raise the dataset’s quality as well as the trained YOLO model’s accuracy. Three subsets—70% for training, 20% for validation, and 10% for testing—were formed from the dataset created from the video frames to guarantee appropriate model assessment and avoid overfitting.
The object detection model was trained using six hours of video footage captured from the mining operation. Hyperparameters of the trained model are given in Table 1. The video data were acquired using a Dahua DH-IPC-HFW2431S-S-S2 camera manufactured by Dahua Technology Co., Ltd, Hangzhou, China, which provided the necessary visual input for detecting and tracking trucks within the mine. The image processing tasks were conducted on a PC equipped with the INTEL UHD Graphics 770 GPU.
The model checks for trucks waiting at each excavator every 20 s. This gives a good and sharp check of when tools can be used. Figure 4 shows a green space tied to the excavator of interest. The green geofence delineates the excavator’s operational area, ensuring clear visibility of truck entry and exit, maneuvering within the loading zone, the loading process, and trucks queuing for service. A distinct geofence must be established for each loading location. Similarly, the red geofence in the dumping area is designed to comprehensively capture truck entry, maneuvering, and queueing before dumping. A truck is considered present in the loading area upon entry; however, if its duration within the geofence is less than 15 s—indicating a mere passage or similar occurrence—it is not recorded as being in the area. Readiness of the excavator is set by looking at three clear cases. These cases think about whether trucks are there and how many are in that space:
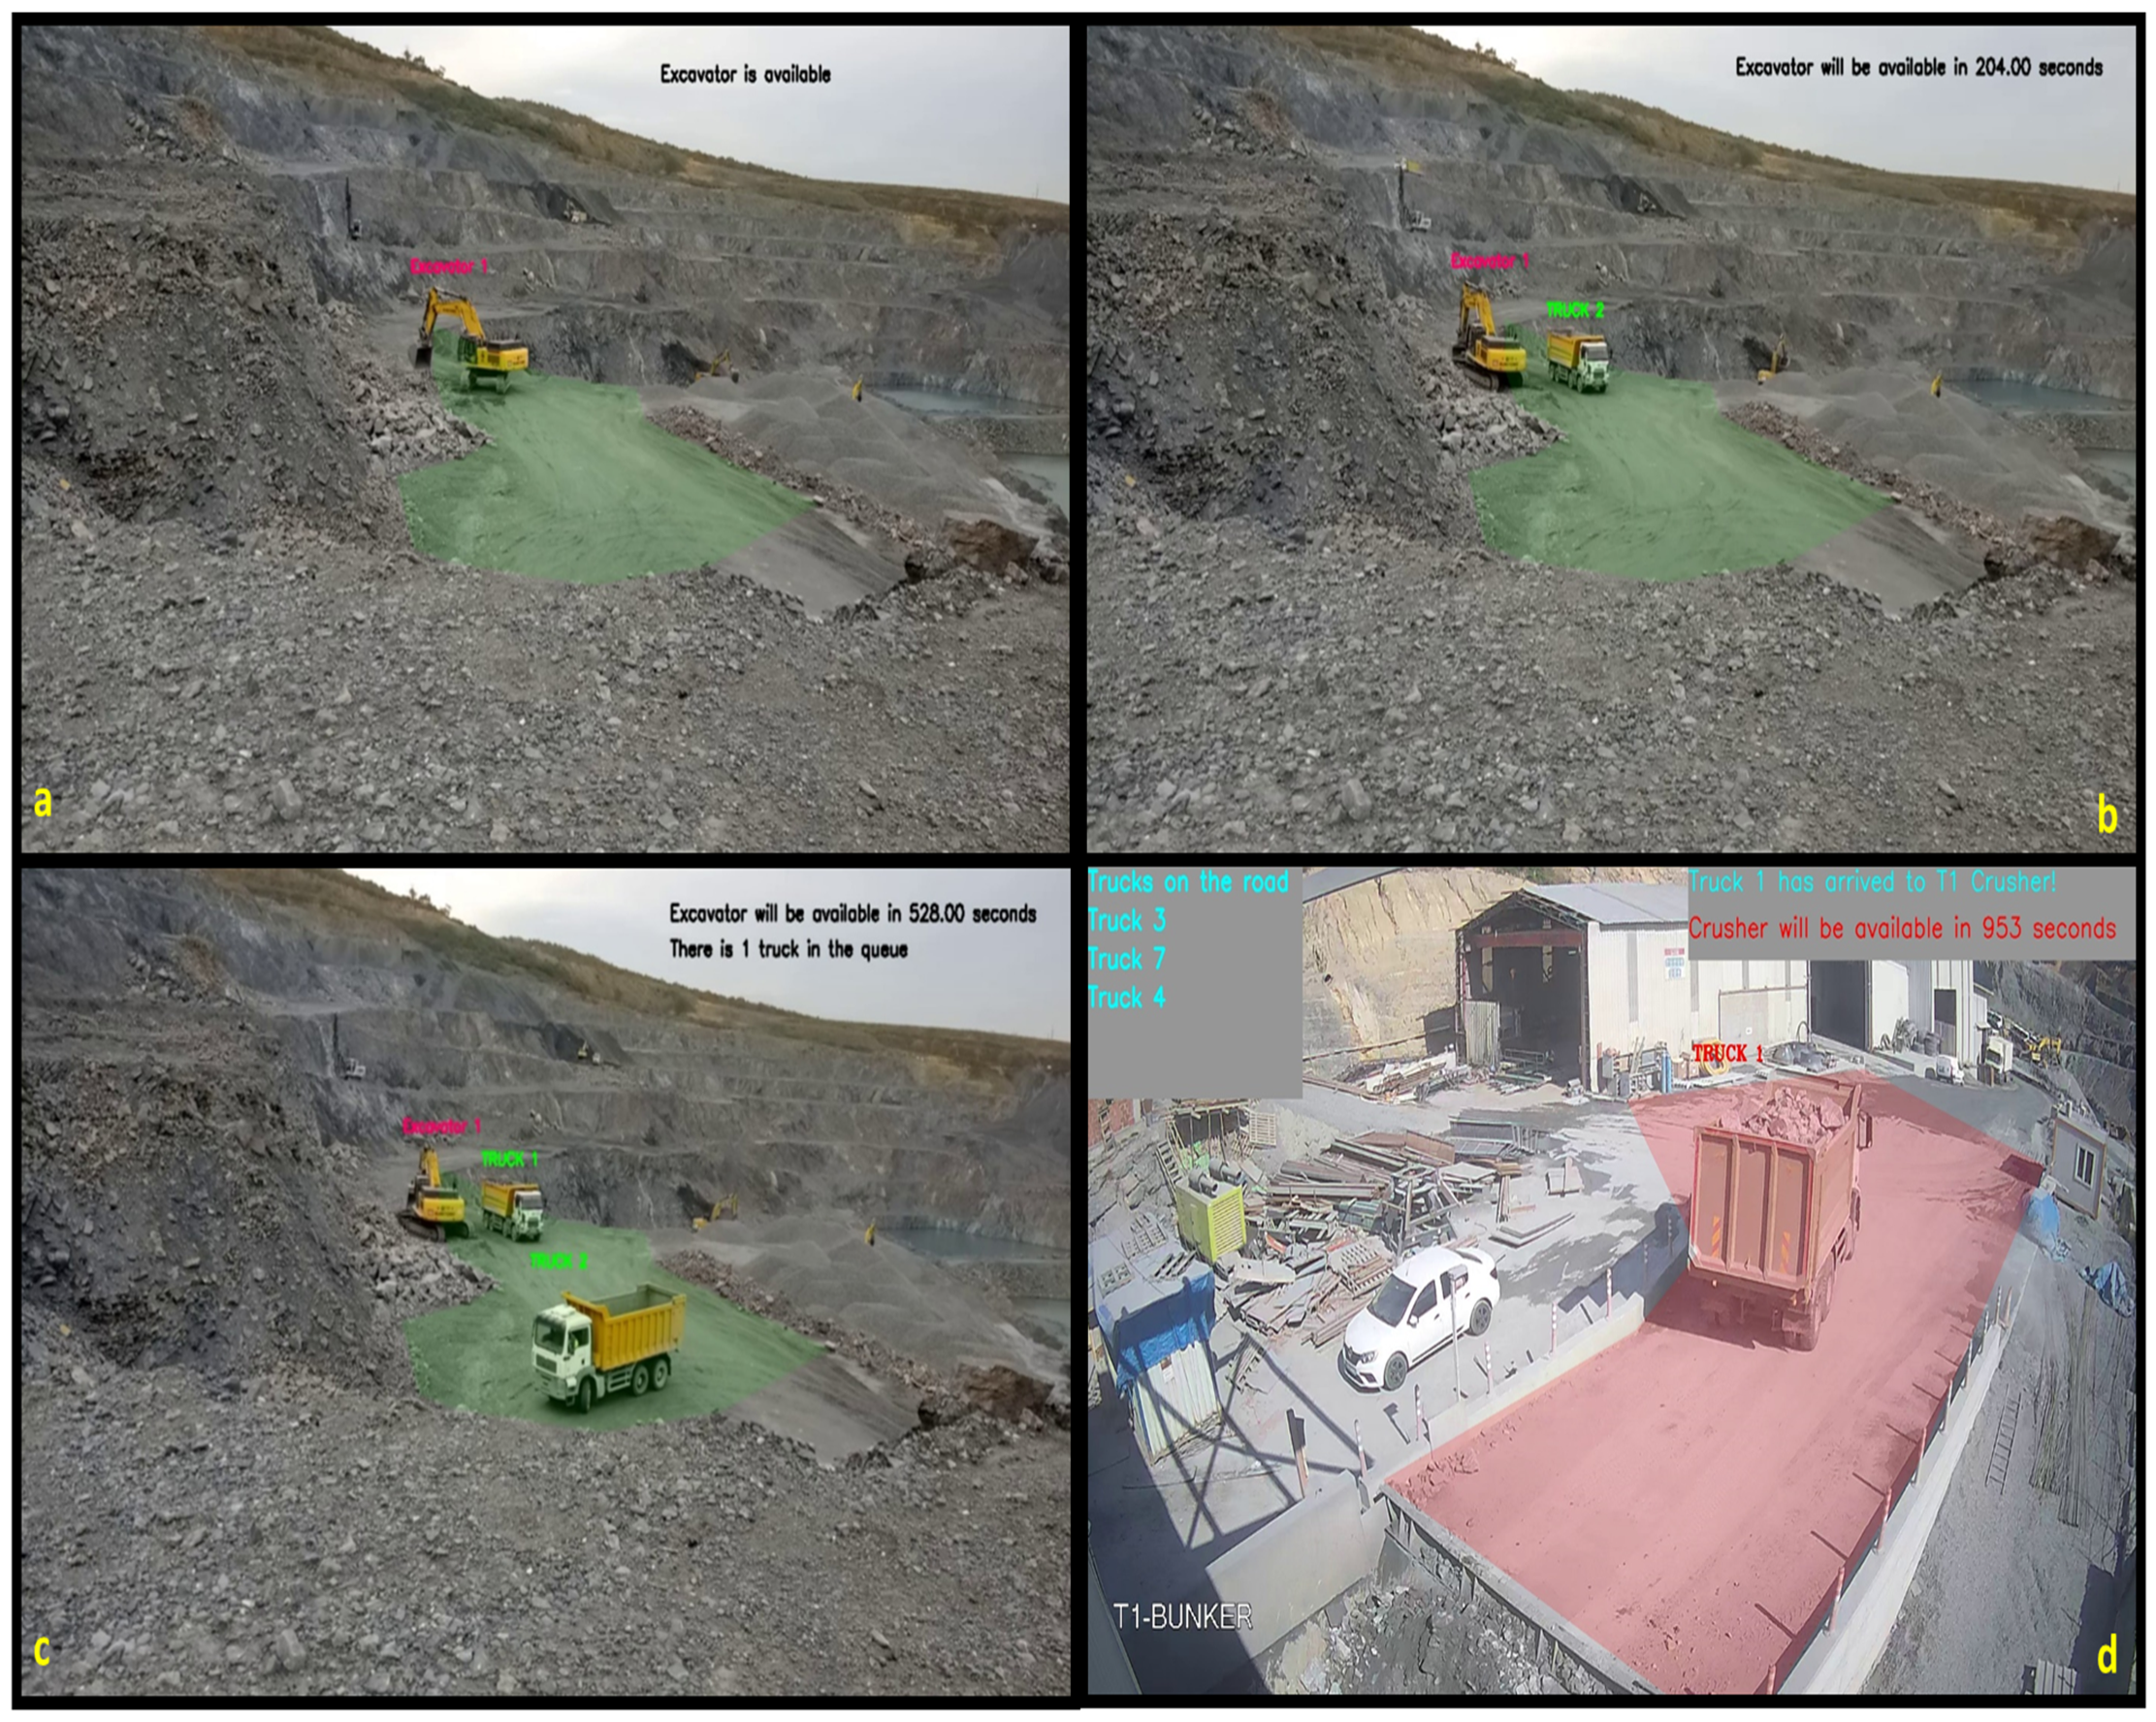
  • No trucks in the green area: If the green area is devoid of trucks, the excavator is deemed ready for operation. In this scenario, the ready time is assigned a value of zero seconds, indicating immediate availability for new assignments.
  • One truck in the green area: When a single truck is present within the green area, the excavator’s ready time corresponds to the loading time of the truck. For the case study, this loading time is standardized to 300 s.
  • Multiple trucks in the green area: If more than one truck occupies the green area, the additional trucks are classified as being “in queue”. In this case, the ready time of the excavator is incrementally extended by the sum of the maneuvering and loading times for each queued truck. This approach accounts for the additional delays caused by processing the queued trucks sequentially.
This classification method helps calculate when an excavator will be ready. It looks at how excavators and trucks move and work together, showing real mining operations. At the same time, the model spots trucks at dumps to check which ones need new tasks. This fast-detect skill lets us add computer vision checks into the setup, making the truck team run smoothly and fast. Figure 4 illustrates four distinct scenarios of a mining operation, providing a comprehensive depiction of excavator availability and operational dynamics within the system. In Figure 4a, the excavator is idle, with no trucks present in the designated waiting area (green spot). Figure 4b depicts an active loading operation, where a truck occupies the green spot while the excavator is engaged in loading. Figure 4c highlights a queuing scenario, where a truck is waiting due to congestion in the green spot, demonstrating the impact of multiple trucks occupying the area. Figure 4d presents a truck at a dump site, requiring immediate dispatch to an available excavator. Together, these images offer a clear visualization of how excavator utilization fluctuates based on truck movements. Additionally, Figure 5 showcases a processed image with confidence levels assigned to detected trucks and excavators, further illustrating the effectiveness of the detection system. Additionally, Figure 5 showcases a processed image with confidence levels assigned to detected trucks and excavators, further illustrating the effectiveness of the detection system. In open-pit mining, the processed images provide a comprehensive dataset tracking important details. This covers production rates of the excavators, the number of empty trucks at dump sites, and the length of time their availability for new assignments. After that, this dataset is applied in a particular model meant to maximize the assignment of empty trucks to excavators. The model seeks to lower queue times and increase the general effectiveness of mining operations by considering elements including when excavators are ready, where trucks are parked, and how much work the excavators are performing.

2.2. Multi-Objective Optimization

Multi-objective optimization is the solution of problems having two or more competing objectives that have to be optimized collectively. While single-objective optimization seeks the best solution, multi-objective optimization seeks to disclose a collection of optimum trade-offs—often referred to as the Pareto frontier [20]. A solution is considered Pareto optimal if there exists no other solution that improves one objective without negatively affecting at least one other. This method is applied extensively in fields like engineering, economics, and decision-making, where goals like cost, efficiency, and environmental impact have to be optimized against each other. Various techniques, including weighted-sum, epsilon-constraint, and evolutionary methods like NSGA-II, are used to address these problems. The outputs of multi-objective optimization serve to assist decision-makers in assessing and choosing between solutions based on their priorities or restrictions.

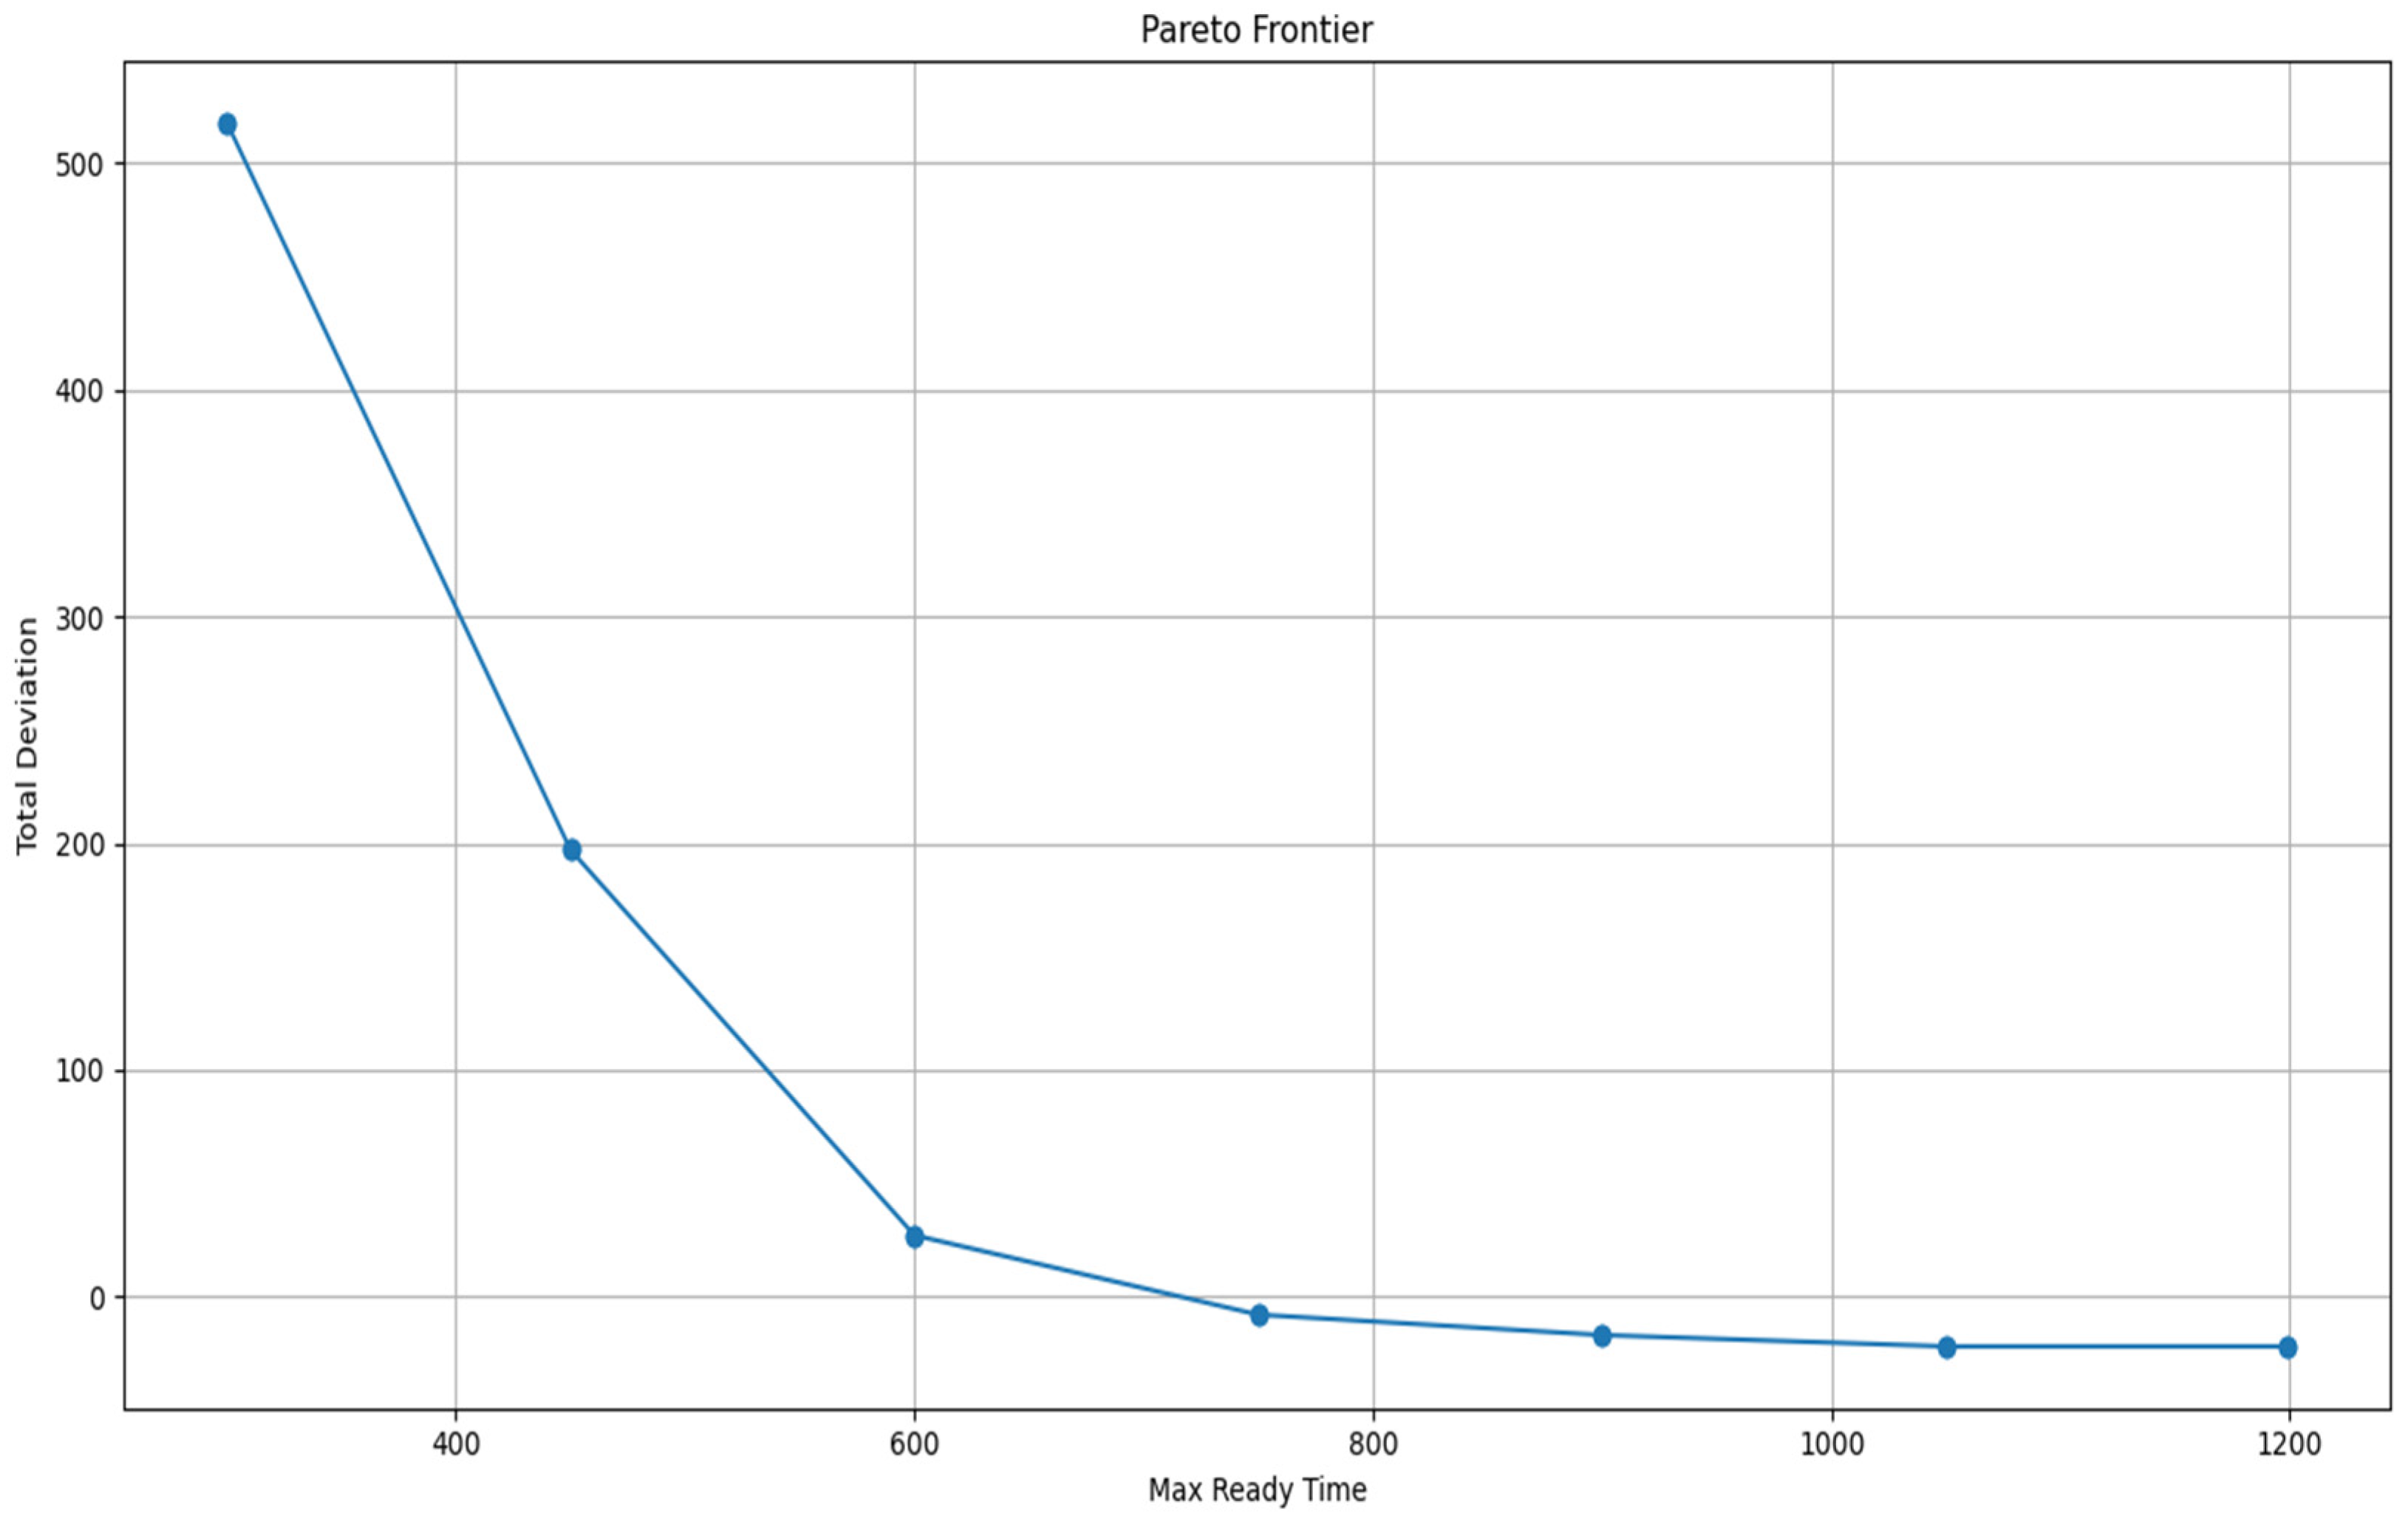
2.2.1. Pareto Frontier Analysis with ε-Constraint Approach

Pareto frontier analysis is a key concept in multi-objective optimization that involves simultaneously optimizing numerous competing objectives. Solutions on the Pareto front show different trade-offs and help to understand the degree and priority of every goal. All Pareto optimum solutions make up the Pareto front. The Pareto front usually shows up as a curve or surface within the goal space in a situation with two objectives. In higher-dimensional objective spaces, it shows up as a hypersurface. Common in multi-objective optimization, the epsilon-constraint approach transforms a multi-objective issue into several single-objective problems by maximizing one goal while considering the others as constraints determined by certain epsilon values [21]. One goal function is converted into a constraint with an upper bound of ε, which is subsequently modified repeatedly to investigate the trade-off between the two objectives in order to construct the Pareto frontier.
This method is applied to an operational open-pit mine during a 10 h shift. The primary objective of the optimization model is to minimize the deviation from the required assignment numbers for the excavators, ensuring that production targets are met. A secondary objective is to minimize the total ready time of the excavators, promoting the decreased queue time of the trucks. To prioritize the objectives, the latter is treated as a constraint within the model rather than a standalone objective. This approach allows the model to focus primarily on achieving the required assignments while incorporating the minimization of ready time as a conditional factor. The epsilon constraint method is employed to systematically vary this constraint, enabling the exploration of potential trade-offs between the two objectives. This process generates a Pareto frontier providing insights into the balance between meeting assignment targets and maximizing truck utilization. The processed images help make a full dataset that shows key work metrics in the mine area. These things list when excavators are set to take on more work, which shows if they are free for more jobs; how many trucks have no load at dump spots, showing how well trucks are used and how fast they work; and how much diggers do, giving a look into how they work and add to mine work. This dataset is used in a plan to better place empty trucks with free diggers. This plan, talked about next, uses info like digger-ready times, truck open spots, and work numbers. It aims to make better choices on which truck goes to which digger.

2.2.2. Binary Integer Programming Model and Definition of Parameters

In this section, we present the suggested multi-objective optimization model, detailing its parameters, objective functions, constraints, and decision variables along with their respective definitions.
  • Parameters;
    P e : Production target for excavator e.
    This represents the desired amount of material (e.g., tons of ore or soil) that excavator e should process or load onto trucks within a given time period. It is a goal the model aims to meet as closely as possible.
    R T e : Ready time for excavator e at a given timestamp.
    This is the time at which excavator e is available to start working (e.g., after maintenance or previous tasks). It affects scheduling and assignment decisions.
    T T d e : Travel time from dump d to excavator e.
    This measures the time it takes for a truck to travel from a specific dump site d to excavator e. It is critical for calculating total time in the system and ensuring efficient assignments.
  • Decision Variables:
    x t d e   { 0 ,   1 } : Binary decision variable
    x t d e =   1   ,   i f   t r u c k   t   o n   d u m p   d   i s   a s s i g n e d   t o   e x c a v a t o r   e   0 ,         o t h e r w i s e .
    This variable indicates whether truck t at dump d is assigned to excavator e (1 = yes, 0 = no). It is binary because each truck can only be assigned or not assigned, with no partial assignments allowed.
    e : Deviation from the production target for excavator e.
    This variable captures how much the actual production (based on truck assignments) deviates from the target P e for excavator e. It is split into positive e +   and negative e components in the model to measure over- or under-achievement.
  • Objective Functions:
    Minimization of total deviation from production targets. This objective aims to ensure that the production achieved by each excavator is as close as possible to its target P e . The positive deviation ( e + , exceeding the target) and negative deviation ( e ,   falling short) are summed across all excavators e.
      M i n i m i z e :   Z 1 = e     E e + + e
    Minimization of the total ready time of excavators. This objective seeks to reduce the combined ready time and travel time associated with truck assignments, making the operation more efficient.
      M i n i m i z e : Z 2 = e E t T d D x t d e · ( R T e + T T d e )
  • Constraints:
    Each truck can only be assigned to one excavator. This ensures that a truck t is assigned to exactly one combination of dump d and excavator e, preventing double-booking or unassigned trucks.
    e E d D x t d e = 1                                               t T
    Each dump site can have one truck requiring an excavator assignment at the same time. This limits each dump site d to having at most one truck assigned to it at any given time, reflecting capacity or operational constraints at the dump.
    e E t T x t d e 1                                               d D
    Decision variables of the trucks on the road are set to zero at the given time. This constraint forces x t d e to be 0 for trucks that are currently on the road (unavailable), ensuring that only available trucks are assigned.
    x t d e = 0                                                                                             t T . d D , e E
    Deviation constraints: These define the positive and negative deviations from the production target for each excavator. The positive deviation e + measures how much production exceeds P e , while the negative deviation e measures how much it falls short. These are calculated based on the number of trucks assigned.
    e + P t T d D x t d e                             e E   P o s i t i v e   d e v i a t i o n
    e t T d D x t d e P                                     e E   N e g a t i v e   D e v i a t i o n
    Binary variable constraint:
    x t d e 0 , 1                                                                                     t T , e E , d D .
    Epsilon constraint: This limits the total ready time and travel time Z 2 to a threshold ε, often used in multi-objective optimization to prioritize one objective (e.g., Z 1 ) while constraining the other Z 2
    e E t T d D x t d e ( R T e + T T d e ) ε

2.3. Application of Method in an Open-Pit Mine

In order to demonstrate its usefulness in a real-world situation, this approach is used on an active open-pit mining project. There are 25 trucks in total in the operation, each with a handling capability of 40 tons; five excavators and seven dump sites total. Dividing the overall output objective by the truck handling capacity helps one to obtain the necessary assignment numbers for every excavator, as shown in Table 2. This method guarantees that the production needs determine the assignment numbers in proportion. Key input values for the optimization model, these figures direct the truck distribution to excavators so effectively reaching the target production levels. When multiple trucks need to be assigned within a single timestamp, the travel time data from Table 3 is used to update the excavator ready times, providing a more accurate representation of excavator availability by accounting for delays arising from sequential truck assignments.
Examples of truck locations and excavator ready times at specific timestamps are presented in Table 4 and Table 5, respectively. Full tables are omitted for brevity due to their limited relevance to the discussion. Table 4 presents a thorough picture of the operational situation throughout the shift under review. Every column shows a particular second within the shift, enabling time-resolved study. Rows line up with the trucks working during the shift. If the vehicle needs an assignment at that specific second, the relevant cell for each truck contains its ID number. On the other hand, should a vehicle not need an assignment, its cell is empty with a value of 0. Table 4’s last five rows provide the projected ready times for the excavators, therefore indicating the time left before any excavator may be used to service another truck. This structure enables exact decision-making inside the binary integer programming model by clearly synchronizing the depiction of truck requests and excavator availability.
Table 5 details the location of trucks at specific seconds during the shift under consideration. Each cell corresponding to a truck is populated with the ID of the dump site where the truck is located at that moment. Trucks that are on the road are marked with the number 99 for coding purposes. This distinction ensures clarity in identifying trucks in transit, as the number 0 is reserved to represent the index of the first dump site. This coding scheme enables a clear and unambiguous representation of truck locations, whether they are stationary at a dump site or actively traveling, which is critical for accurately updating excavator-ready times when multiple trucks require assignment within a single timestamp. By incorporating the spatial distribution of trucks, this methodology ensures that excavator availability is accurately represented, reflecting the dynamic nature of truck movements and assignments in the open-pit mining operation.

3. Results

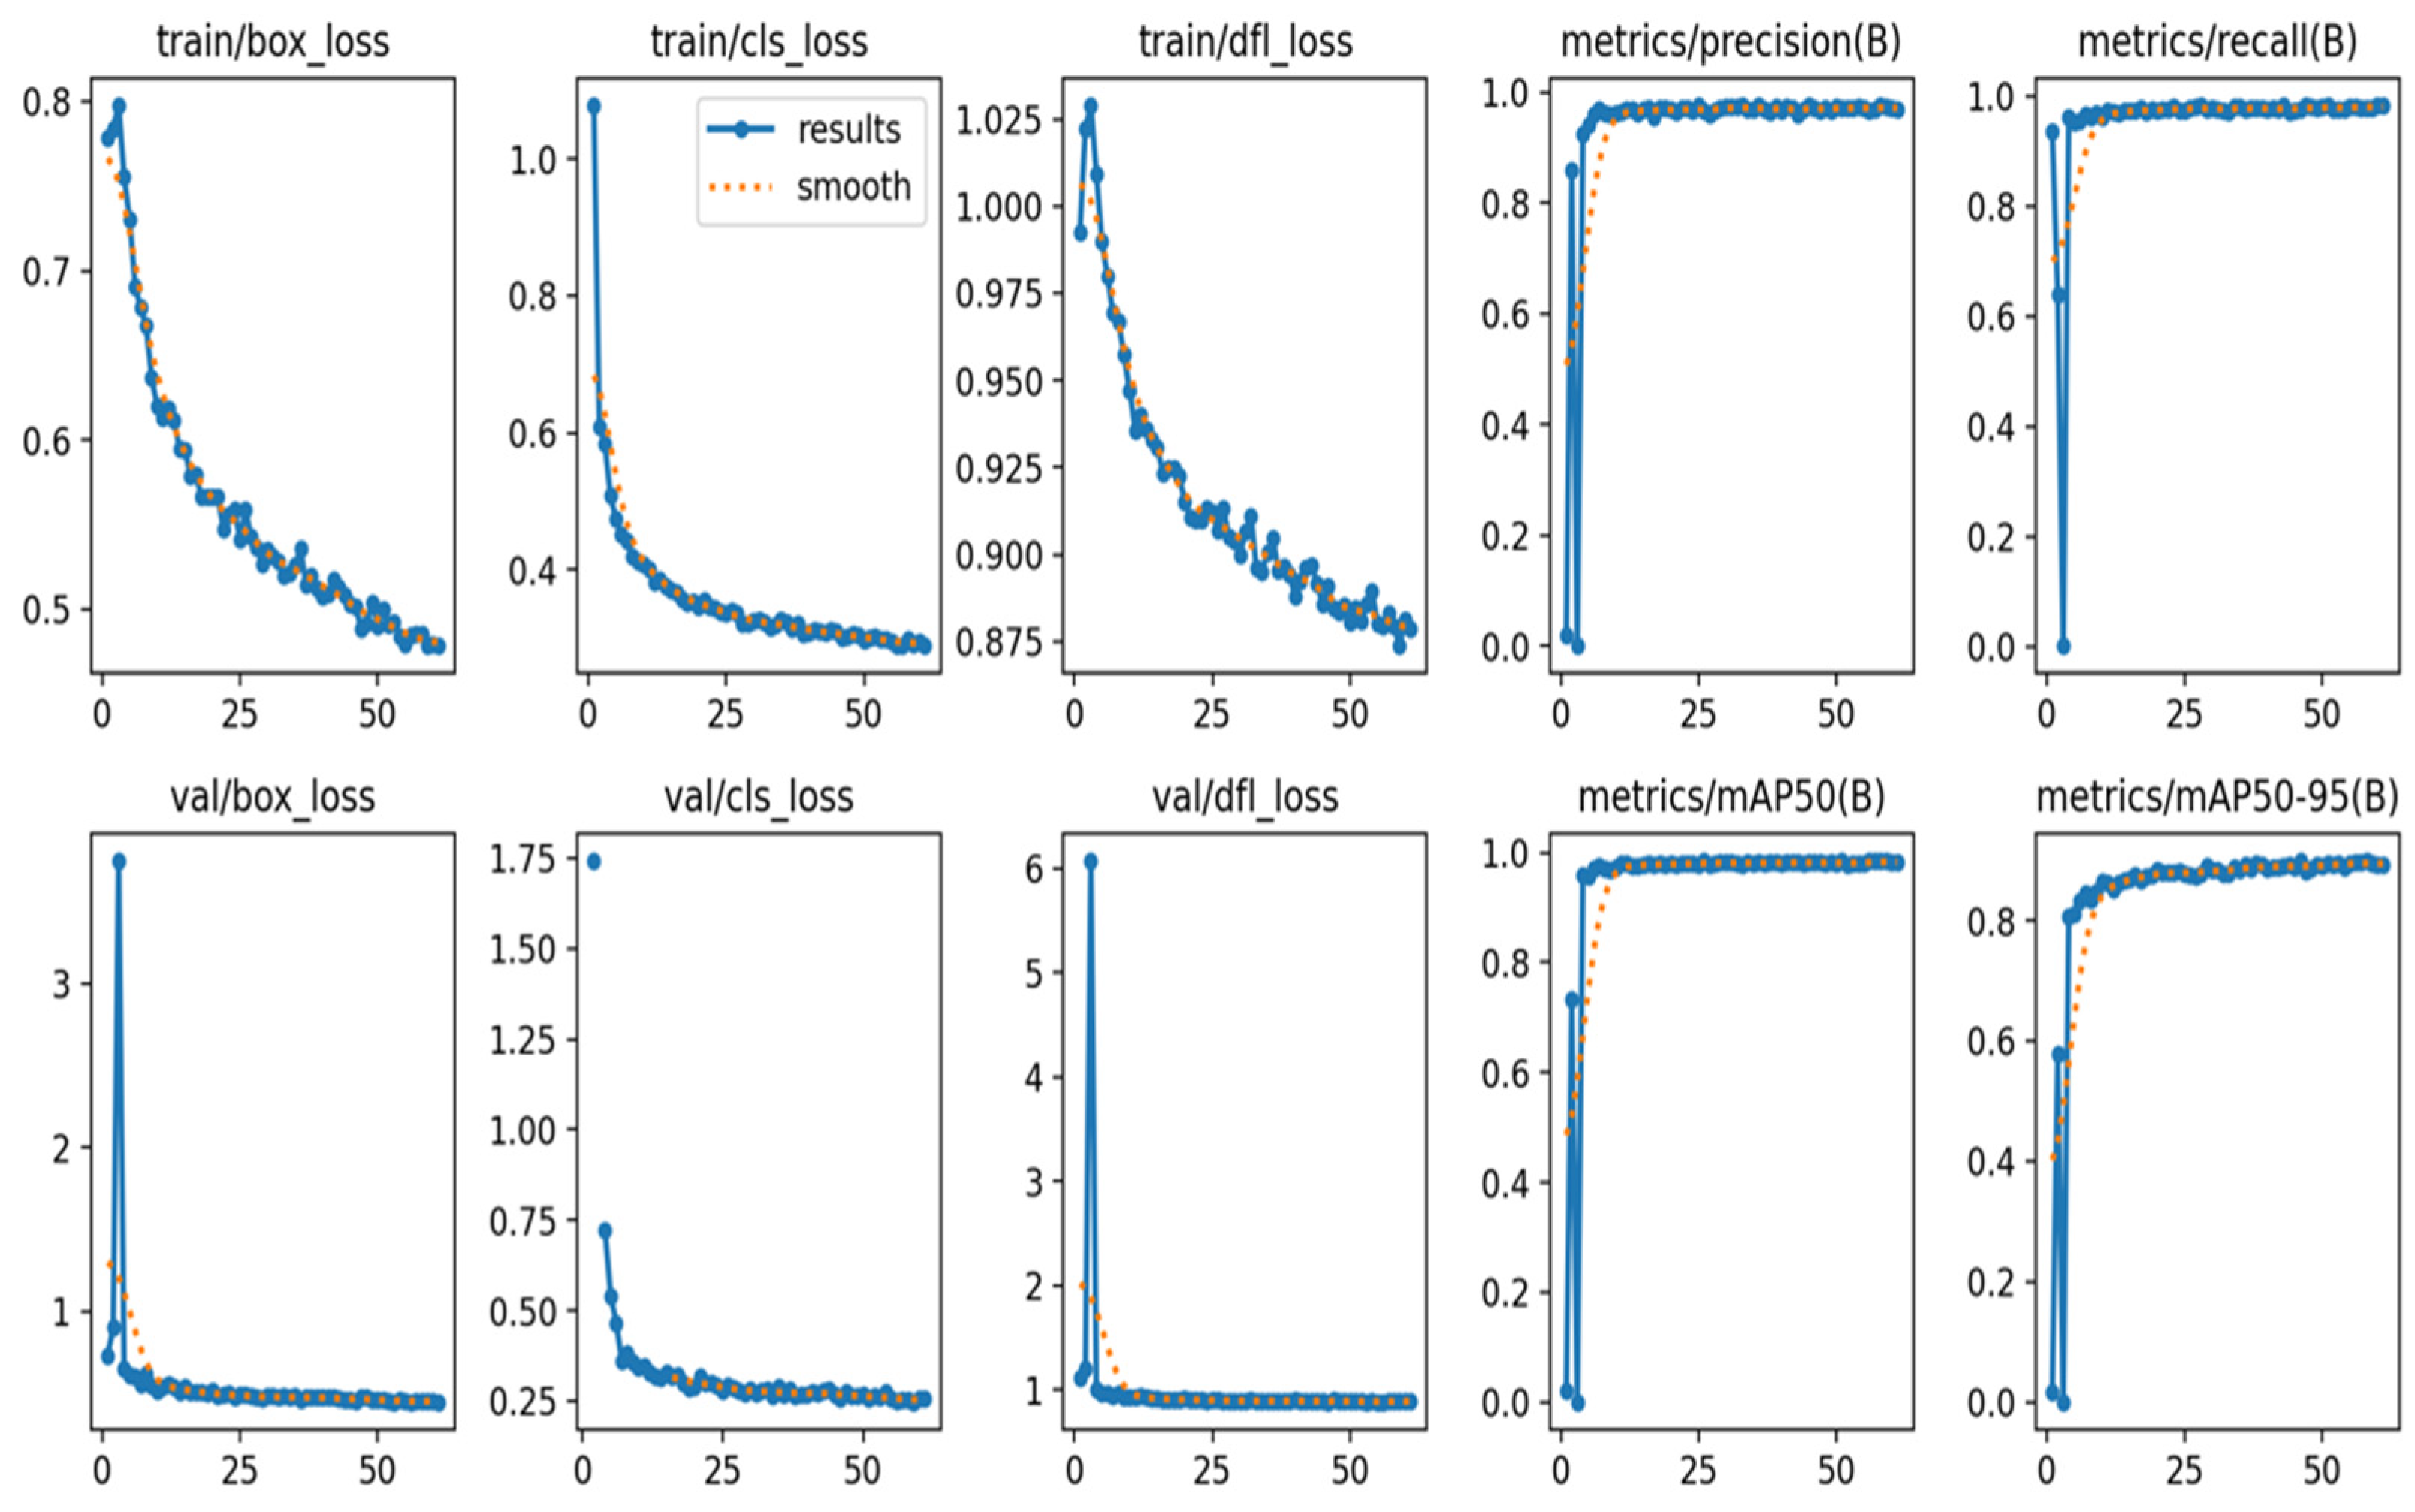
3.1. Performance Analysis of the Trained Model

After going through 60 runs, the model was evaluated to see how it performed. Main test scores like precision, recall, and mean average precision (mAP), were calculated to see how well the model detects “truck” and “excavator”. Both check and test datasets were used to make sure the model’s guesses were strong with new data.
Figure 6 shows the model performance improvements during training and validation. The graphs for Train/box_loss, Train/cls_loss, and Train/dfl_loss show that the box fits, hits the right class, and edge details performed better over time. Similarly, validation graphs Val/box_loss, Val/cls_loss, and Val/dfl_loss demonstrate consistent reductions in errors, confirming generalization to unseen data. The Metrics/precision(B) and Metrics/recall graphs show that the model’s predictions became more stable and sharper. Also, the Metrics/mAP50(B) graph shows mean average precision close to 95%, while the Metrics/mAP50–95(B) graph shows strong scores across different test levels. All these points prove the model works well and can be trusted.
Table 6 delineates the evaluation metrics for a test set comprising 124 images and 289 instances, demonstrating the model’s efficacy with an overall precision of 0.966, recall of 0.978, mAP50 of 0.99, and mAP50–95 of 0.911 for the aggregated “all” class, while also providing detailed outcomes for the “excavator” and “truck” categories. The results underscore the model’s robust performance, with the “truck” category exhibiting the highest precision (0.982) and mAP50 (0.993), and the “excavator” category maintaining a commendable precision (0.95) and recall (0.975). Representative instances from this test set are depicted in Figure 7.
By using these tests, the overall reliability and effectiveness of the trained model can be evaluated in real-world applications. The confusion matrix in Figure 8 shows that the model performs well in classifying excavators and trucks, with 260 and 294 correct predictions, respectively. However, some misclassifications occur, particularly between equipment and background (13 excavators and 20 trucks), suggesting an overlap in visual features. Additionally, a few background pixels are misclassified as machinery (seven as excavators and five as trucks), though the model generally distinguishes the background well. To improve performance, data augmentation with varied conditions, enhanced feature extraction, and fine-tuning classification thresholds could help reduce errors.

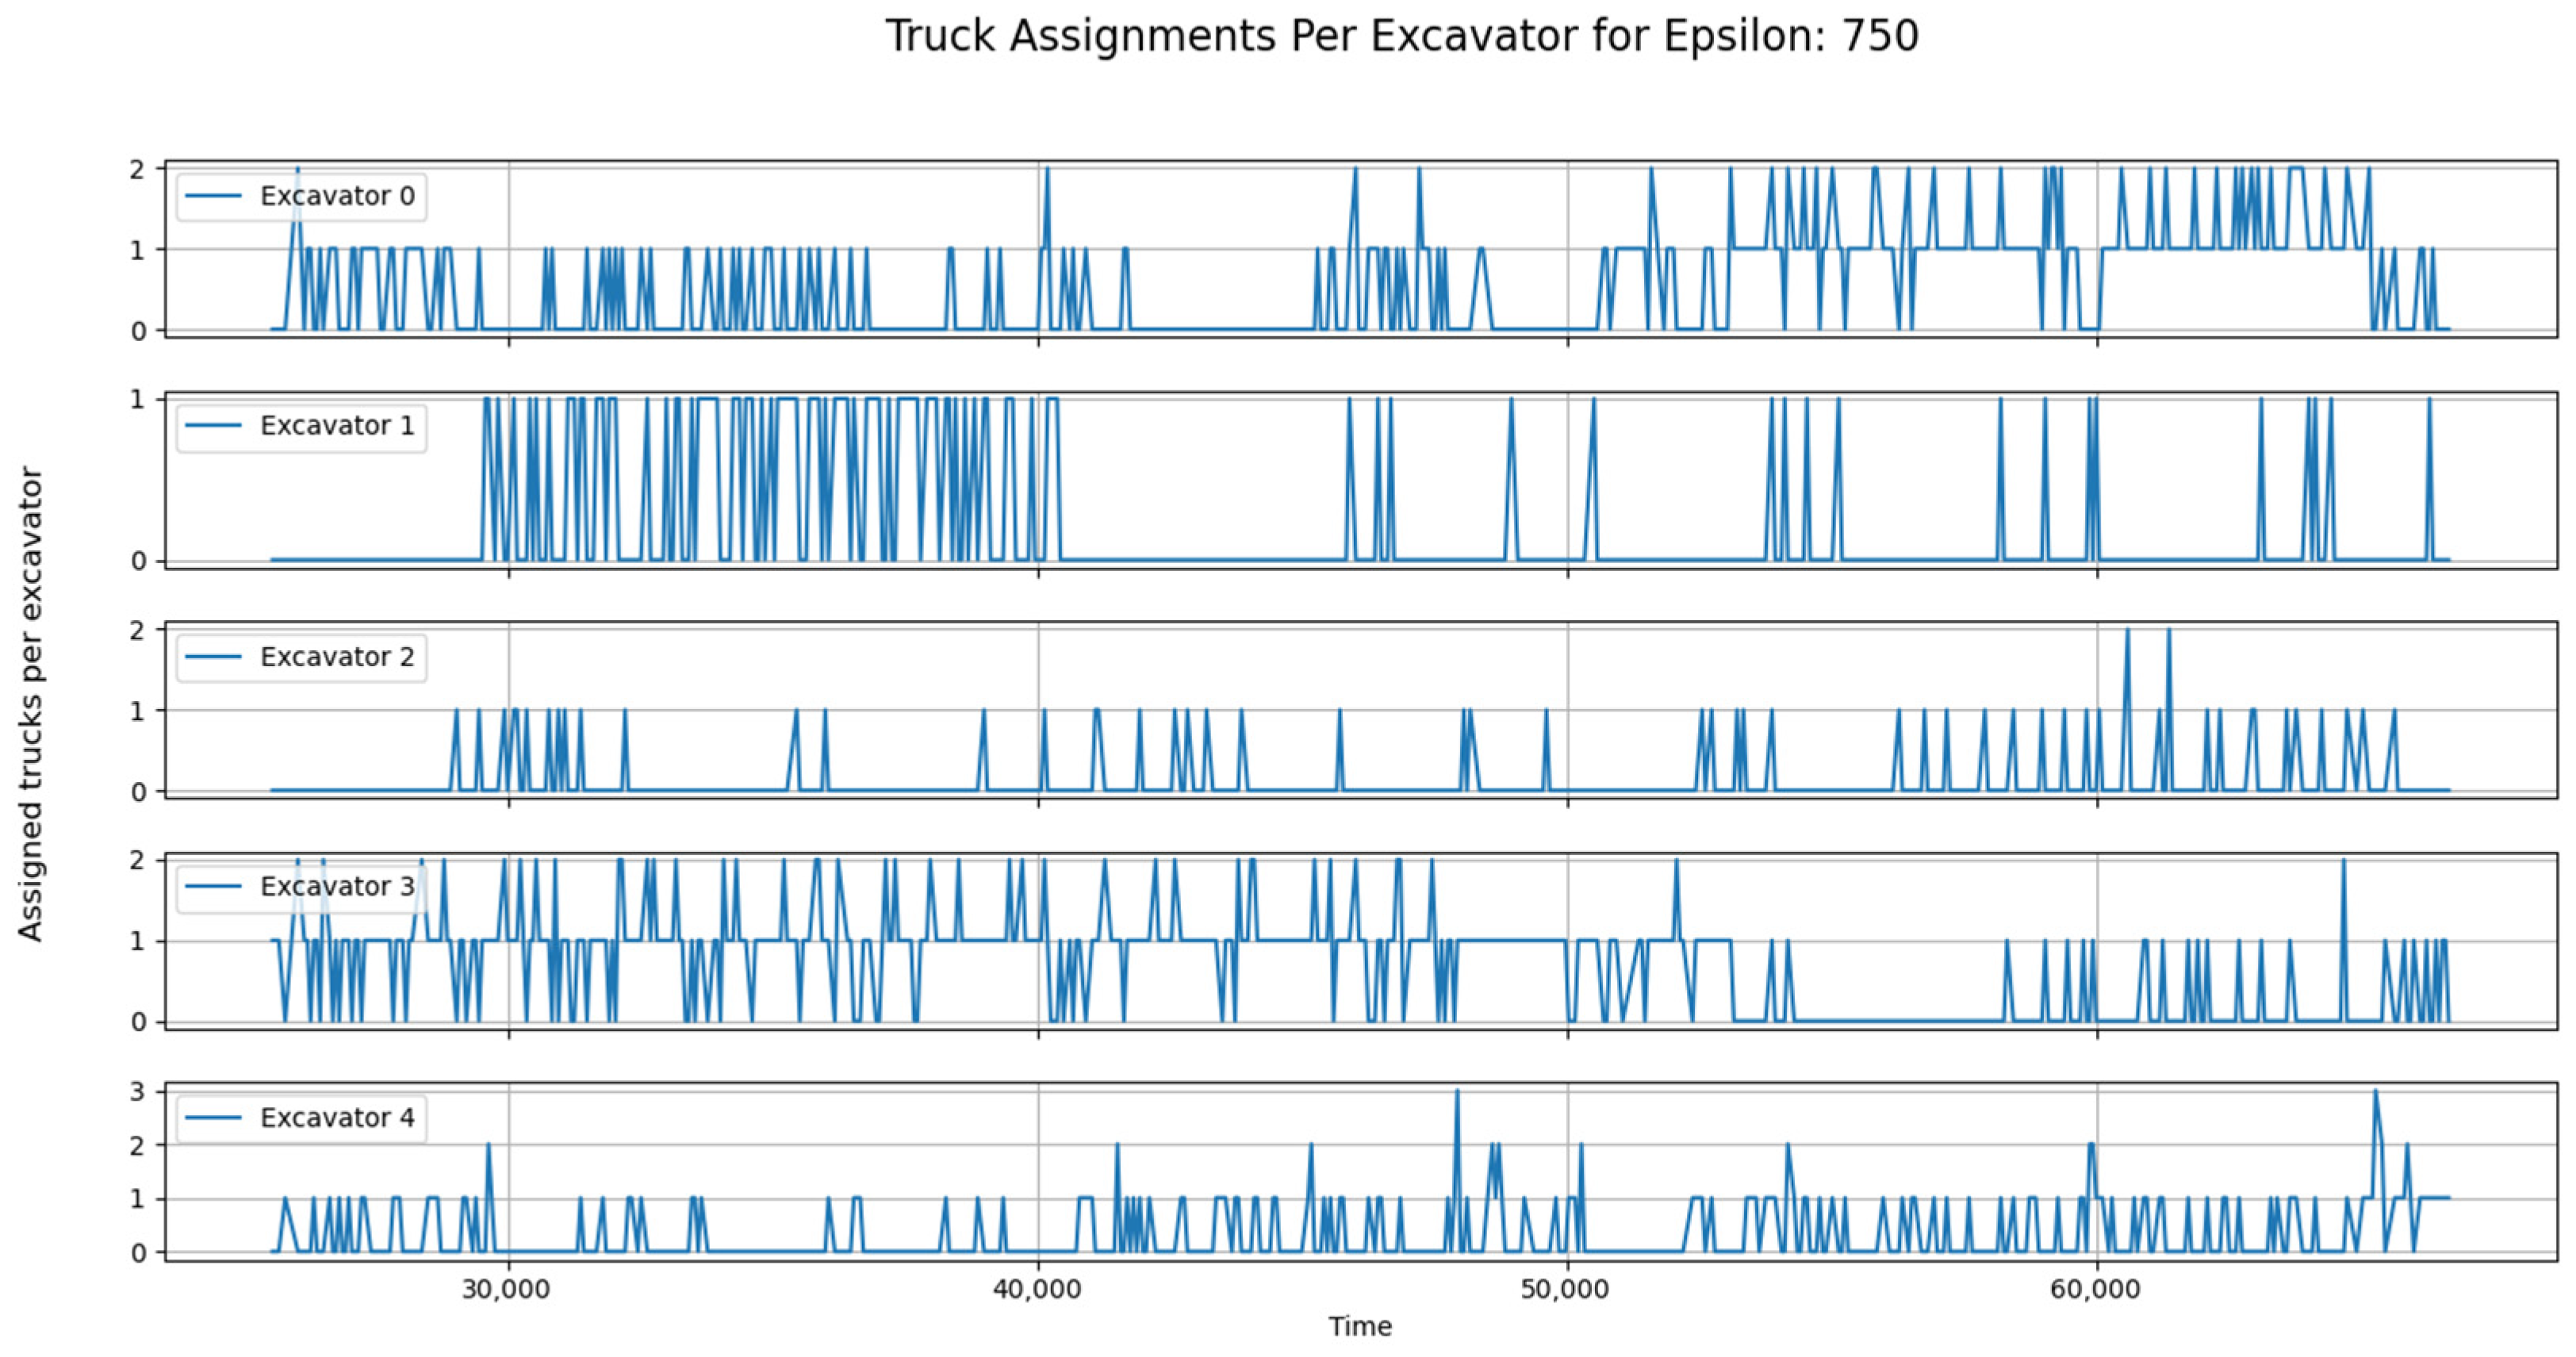
3.2. Results of Multi-Objective Optimization Model

A multi-objective optimization model is developed using input variables obtained from the image processing phase, where truck and excavator positions are detected and analyzed. The optimization problem aims to minimize the deviation from required truck-to-excavator assignments while simultaneously minimizing the total ready time of excavators. To systematically explore the trade-off between these two conflicting objectives, the epsilon constraint method is applied, treating the excavator’s ready time as a constraint while optimizing the assignment deviation. This approach enables the identification of optimal operational strategies by illustrating how strict enforcement of excavator idle times affects assignment targets and overall system efficiency. The Pareto frontier in Figure 9 reveals that minimizing the total excavator ready time leads to a substantial increase in assignment deviation, reaching approximately 500 units in the most constrained scenario. This indicates that reducing excavator idle time forces truck assignments that deviate significantly from the target distribution, likely due to the prioritization of immediate truck-excavator pairings overachieving the required allocation targets. As the constraint on deviation is progressively relaxed, the total deviation decreases sharply, reaching nearly zero at around 600 s of ready time. This suggests that achieving a balanced assignment distribution necessitates allowing higher truck queue times, which in turn increases excavator waiting times to ensure an optimal allocation of trucks. Beyond 600–700 s of ready time, the total deviation remains close to zero, implying that further increasing excavator idle time does not provide additional benefits in assignment accuracy. This observation highlights a critical threshold beyond which additional waiting time becomes inefficient, as it does not contribute to improved assignment balance but instead results in unnecessary operational delays.
The truck-to-excavator assignment results for the 750 s limit on total excavator ready time, as presented in Figure 10, demonstrate the effectiveness of incorporating computer vision-based input variables into a dispatching algorithm for fleet management in open-pit mines. By leveraging real-time image processing, the model accurately designates truck and excavator positions, enabling an automated and data-driven approach to optimizing fleet operations. This integration of computer vision enhances decision-making by providing dynamic, real-time input variables, ensuring that truck assignments align with operational constraints while minimizing deviation from target distributions. The results highlight the potential of computer vision-assisted optimization in improving the efficiency of mine dispatching systems, ultimately reducing delays and enhancing overall productivity.

4. Discussion

This work shows a shift to long-term operational decisions that use data. Making the work of seeing data automatic helps the mining industry move to less need for people, lower costs, and a greener way of mining. The mining field can take in a lot from pairing new tech in computer vision with smart plans to push more study in AI and machine learning to deal with hard work issues. Computer vision in mining could change the sector. By means of data-driven decision-making, this approach fosters sustainable transitions and digitalization, therefore enabling the mining sector to be more efficient and future-ready. Low quality, inadequate camera counts, and visual problems resulting from dust make applying computer vision technology for processing CCTV data difficult, nevertheless. Notwithstanding these difficulties, developments in camera technology help to make these problems controllable; the running expenses to solve them are small in relation to the advantages.
The YOLO framework was selected for our application due to its high real-time performance and efficiency, enabled by its single-shot architecture that provides fast and sufficiently accurate results, complemented by readily available resources, extensive community support, and comprehensive documentation, all of which enhance our research and development efficiency and confirm YOLO as the optimal choice. The video recordings, obtained from the mining operation as agreed at the project’s outset and not publicly available, were processed at one frame per second—analyzing only one out of every 30 frames from a 30 FPS camera feed—since the equipment’s status changes moderately slowly, allowing us to efficiently utilize computational capacity while maintaining effective real-time algorithm execution.
A significant limitation of the proposed method for optimizing truck-to-excavator assignments lies in the challenge of ensuring human drivers adhere precisely to algorithm-driven schedules in real-world operations. Although the study showcases the theoretical potential of computer vision as an alternative to real-time dispatching systems like DISPATCH, its practical application is constrained by the complexities of coordinating human behavior, suggesting that optimal performance may require automation. As a potential direction for future research, integrating the system with a mobile application installed on drivers’ smartphones could provide real-time guidance and feedback, offering a practical interim solution.
The algorithm was primarily tested during the day under clear weather conditions, with limited testing conducted at night. It was observed that the model performs effectively in well-lit areas but may face challenges in low-visibility conditions. Similarly, in foggy weather, the detection accuracy depends on whether trucks and excavators remain within the camera’s field of vision; otherwise, the model fails to recognize objects. Another limitation is that cameras in the loading area must not only cover the loading zone but also capture truck entry and exit points to ensure accurate tracking. Additionally, equipment failures require manual deactivation and reactivation in the system, which may cause delays in operations. To enhance the system, future developments could integrate automated malfunction detection based on prolonged inactivity or visual cues such as smoke, enabling immediate reporting and notification of maintenance teams. Furthermore, incorporating natural language processing models could enhance real-time status detection of equipment, improving overall efficiency in monitoring activities such as loading, dumping, and maneuvering.
Further studies are needed to evaluate the viability and impact of this approach, potentially facilitating a transition toward fully automated vehicle fleets. Generally, the use of computer vision in mining supports sustainable practices and digitization for a more effective future in the sector by means of data-driven decision-making. The use of the epsilon-constraint method showed the trade-offs between lower excavator idle time and achieving daily production goals. This method helps to improve operational decision-making in addition to reducing fuel consumption and traffic and improving safety. Measuring queue densities at facilities and guiding trucks to alleviate congestion, sending real-time traffic management data to decision-makers, improving internal communication, and automating operational data collecting help this study support the mining sector. In conclusion, this study exposes the potential of integrating computer vision to revolutionize the open-pit mining fleet management using multi-objective optimization. The results highlight a particularly significant progress, i.e., the reduction in excavator idle time while keeping or improving on production target compliance. This has been demonstrated through Pareto front analysis. The use of the YOLO v8 model for real-time vehicle detection and the multi-objective binary integer programming model enabled us to achieve a more optimized truck-to-excavator assignment procedure, which improved the overall operational efficiency.

Author Contributions

Conceptualization, K.H., M.M. and M.M.K.; methodology, K.H. and M.M.K.; software, K.H. and M.M.; validation, K.H. and M.M.K.; formal analysis, K.H. and M.M.; data curation, K.H. and M.M.; writing—original draft preparation, K.H. and M.M; writing—review and editing, K.H. and M.M.K.; visualization, K.H. and M.M.; supervision, M.M.K.; project administration, M.M.K.; funding acquisition, M.M.K. All authors have read and agreed to the published version of the manuscript.

Funding

This research was funded by the Scientific Research Projects Department of Istanbul Technical University, grant number MGA-2024-45702.

Institutional Review Board Statement

Not applicable.

Informed Consent Statement

Not applicable.

Data Availability Statement

Data available on request due to legal restrictions.

Acknowledgments

The authors thank Enes Fatih Tünay for his contribution to the earlier work and development of initial versions of the method.

Conflicts of Interest

The authors declare no conflicts of interest.

Abbreviations

The following abbreviations are used in this manuscript:
YOLOYou Only Look Once
CCTVClosed-Circuit Television
CVComputer Vision
OBOverburden
MLMachine Learning
CNNConvolutional Neural Network
mAPMean Average Precision
AIArtificial Intelligence

References

  1. Ellinger, A.; Woerner, C.; Scherer, R. Automatic Segmentation of Bulk Material Heaps Using Color, Texture, and Topography from Aerial Data and Deep Learning-Based Computer Vision. Remote Sens. 2023, 15, 211. [Google Scholar] [CrossRef]
  2. Radulescu, M.; Dalal, S.; Lilhore, U.K.; Saimiya, S. Optimizing mineral identification for sustainable resource extraction through hybrid deep learning enabled FinTech model. Resour. Policy 2024, 89, 104692. [Google Scholar] [CrossRef]
  3. Bendaouia, A.; Abdelwahed, E.H.; Qassimi, S.; Boussetta, A.; Benzakour, I.; Benhayoun, A.; Amar, O.; Bourzeix, F.; Baïna, K.; Cherkaoui, M.; et al. Hybrid features extraction for the online mineral grades determination in the flotation froth using Deep Learning. Eng. Appl. Artif. Intell. 2024, 129, 107680. [Google Scholar] [CrossRef]
  4. Abrarov, A. Flotation Froth Monitoring Using Unsupervised Multiple Object Tracking Methods. J. Miner. Mater. Sci. 2023, 4, 1054. [Google Scholar] [CrossRef]
  5. Singh, P.; Murthy, V.M.S.R.; Kumar, D.; Raval, S. Enhancing dragline operations supervision through computer vision: Real time height measurement of dragline spoil piles dump using YOLO. Geomat. Nat. Hazards Risk 2024, 15, 2322492. [Google Scholar] [CrossRef]
  6. Chow, B.H.Y.; Reyes-Aldasoro, C.C. Automatic gemstone classification using computer vision. Minerals 2022, 12, 60. [Google Scholar] [CrossRef]
  7. Imam, M.; Baïna, K.; Tabii, Y.; Ressami, E.M.; Adlaoui, Y.; Benzakour, I.; Abdelwahed, E.H. The Future of Mine Safety: A Comprehensive Review of Anti-Collision Systems Based on Computer Vision in Underground Mines. Sensors 2023, 23, 4294. [Google Scholar] [CrossRef] [PubMed]
  8. Huang, M.Q.; Ninić, J.; Zhang, Q.B. BIM, machine learning and computer vision techniques in underground construction: Current status and future perspectives. Tunn. Undergr. Space Technol. 2021, 108, 103677. [Google Scholar] [CrossRef]
  9. Sharma, H.; Kumar, H.; Mangla, S.K. Enablers to computer vision technology for sustainable E-waste management. J. Clean. Prod. 2023, 412, 137396. [Google Scholar] [CrossRef]
  10. Dilek, E.; Dener, M. Computer Vision Applications in Intelligent Transportation Systems: A Survey. Sensors 2023, 23, 2938. [Google Scholar] [CrossRef] [PubMed]
  11. Oudah, M.; Al-Naji, A.; Chahl, J. Hand Gesture Recognition Based on Computer Vision: A Review of Techniques. J. Imaging 2020, 6, 73. [Google Scholar] [CrossRef] [PubMed]
  12. Bhargava, A.; Bansal, A. Fruits and vegetables quality evaluation using computer vision: A review. J. King Saud Univ. Comput. Inf. Sci. 2021, 33, 243–257. [Google Scholar] [CrossRef]
  13. Spencer, B.F., Jr.; Hoskere, V.; Narazaki, Y. Advances in Computer Vision-Based Civil Infrastructure Inspection and Monitoring. Engineering 2019, 5, 199–222. [Google Scholar] [CrossRef]
  14. Li, J.; Green-Miller, A.R.; Hu, X.; Lucic, A.; Mohan, M.M.; Dilger, R.N.; Condotta, I.C.; Aldridge, B.; Hart, J.M.; Ahuja, N. Barriers to computer vision applications in pig production facilities. Comput. Electron. Agric. 2022, 200, 107227. [Google Scholar] [CrossRef]
  15. Alsakka, F.; Assaf, S.; El-Chami, I.; Al-Hussein, M. Computer vision applications in offsite construction. Autom. Constr. 2023, 154, 104980. [Google Scholar] [CrossRef]
  16. Fang, W.; Ding, L.; Love, P.E.; Luo, H.; Li, H.; Peña-Mora, F.; Zhong, B.; Zhou, C. Computer vision applications in construction safety assurance. Autom. Constr. 2020, 110, 103013. [Google Scholar] [CrossRef]
  17. Shah, N.; Bhagat, N.; Shah, M. Crime forecasting: A machine learning and computer vision approach to crime prediction and prevention. Vis. Comput. Ind. Biomed. Art 2021, 4, 9. [Google Scholar] [CrossRef] [PubMed]
  18. Terven, J.; Cordova-Esparza, D.; Romero-Gonzales, J. A Comprehensive Review of YOLO Architectures in Computer Vision: From YOLOv1 to YOLOv8 and YOLO-NAS. Mach. Learn. Knowl. Extr. 2023, 5, 1680–1716. [Google Scholar] [CrossRef]
  19. Maity, S.; Chakraborty, A.; Singh, P.K.; Sarkar, R. Performance Comparison of Various YOLO Models for Vehicle Detection: An Experimental Study. In Lecture Notes in Networks and Systems; Springer Nature: Singapore, 2023. [Google Scholar] [CrossRef]
  20. Ehrgott, M. Multicriteria Optimization, 2nd ed.; Springer Nature: Dordrecht, The Netherlands, 2005. [Google Scholar]
  21. Zhou, J.; Zou, J.; Zheng, J.; Yang, S.; Gong, D.; Pei, T. An infeasible solutions diversity maintenance epsilon constraint handling method for evolutionary constrained multiobjective optimization. Soft Comput. 2021, 25, 8051–8062. [Google Scholar] [CrossRef]
Figure 1. Workflow diagram of the method.
Applsci 15 04603 g001
Figure 2. Precision performance of YOLO models [20].
Applsci 15 04603 g002
Figure 3. Object tagging on the Roboflow platform.
Applsci 15 04603 g003
Figure 4. Different scenarios of mining operations: (a) Scenario 1 (no trucks in the green area); (b) Scenario 2 (one truck in the green area); (c) Scenario 3 (multiple trucks in the green area); and (d) truck on a dump site.
Applsci 15 04603 g004
Figure 5. Confidence levels of detected trucks and excavators on a processed image.
Applsci 15 04603 g005
Figure 6. Object detection accuracy metrics of the trained model.
Applsci 15 04603 g006
Figure 7. Example detections from the test set.
Applsci 15 04603 g007
Figure 8. Confusion matrix of the trained model.
Applsci 15 04603 g008
Figure 9. Pareto frontier of 2 objective functions.
Applsci 15 04603 g009
Figure 10. Truck to excavator assignment of a 10 h shift.
Applsci 15 04603 g010
Table 1. The hyperparameters of the trained model.
HyperparameterValue
Batch Size16
OptimizerAdamW
Learning rate0.01
Weight decay0.0005
Momentum0.937
Drop out0.0
Table 2. Required assignment number of excavators.
Excavator IDs# of Required Assignment
0280
174
250
3249
4246
Table 3. Dump site to excavator travel times (in seconds).
Excavator IDs01234
Dump Site IDs
0230250300450500
1250350500400200
2350500500400200
3500370700650550
41000500200500750
550010005002101000
62105001000210500
Table 4. Example dataset of the trucks and excavator ready times.
Time of the Shift (s)25,56025,68025,80026,04026,16026,22026,280
Truck IDs30003000
50500050
60000000
90009000
1000000100
110000000
1200120000
130000000
140000000
2500002500
Excavator Ready Times (s)0138182361165676
14268414840283788366836083548
23633351333933153303329732913
393723336711134
49122210293367818
Table 5. Example dataset of truck locations.
Time of the Shift
(s)
25,56025,68025,80026,04026,160
Truck IDs19999999999
29999999999
3999999199
49999999999
5991999999
69999999999
79999999999
89999999999
12999969999
139999999999
149999999999
15199999999
16999999299
Table 6. Test set evaluation metrics.
ClassImagesInstancesPrecisionRecallmAP50mAP50–95
all1242890.9660.9780.990.911
excavator1191370.950.9750.9860.912
truck1061520.9820.980.9930.91
Disclaimer/Publisher’s Note: The statements, opinions and data contained in all publications are solely those of the individual author(s) and contributor(s) and not of MDPI and/or the editor(s). MDPI and/or the editor(s) disclaim responsibility for any injury to people or property resulting from any ideas, methods, instructions or products referred to in the content.

