
Practices of BIM-Enabled Assessment of Politehnica University Timisoara Building Stock for a More Sustainable Future

 , ,
, ,  ,
,  ,
,  ,
,  and
and 
Abstract
1. Introduction
2. Contribution of the USE-REC Project in the Sustainability Objectives of the United Nations’ Agenda 2030
- i.
- Identify energy losses,
- ii.
- propose solutions for energy efficiency, and
- iii.
- reduce the carbon footprint of student accommodations from the Politehnica University Timișoara.
3. Data and Method
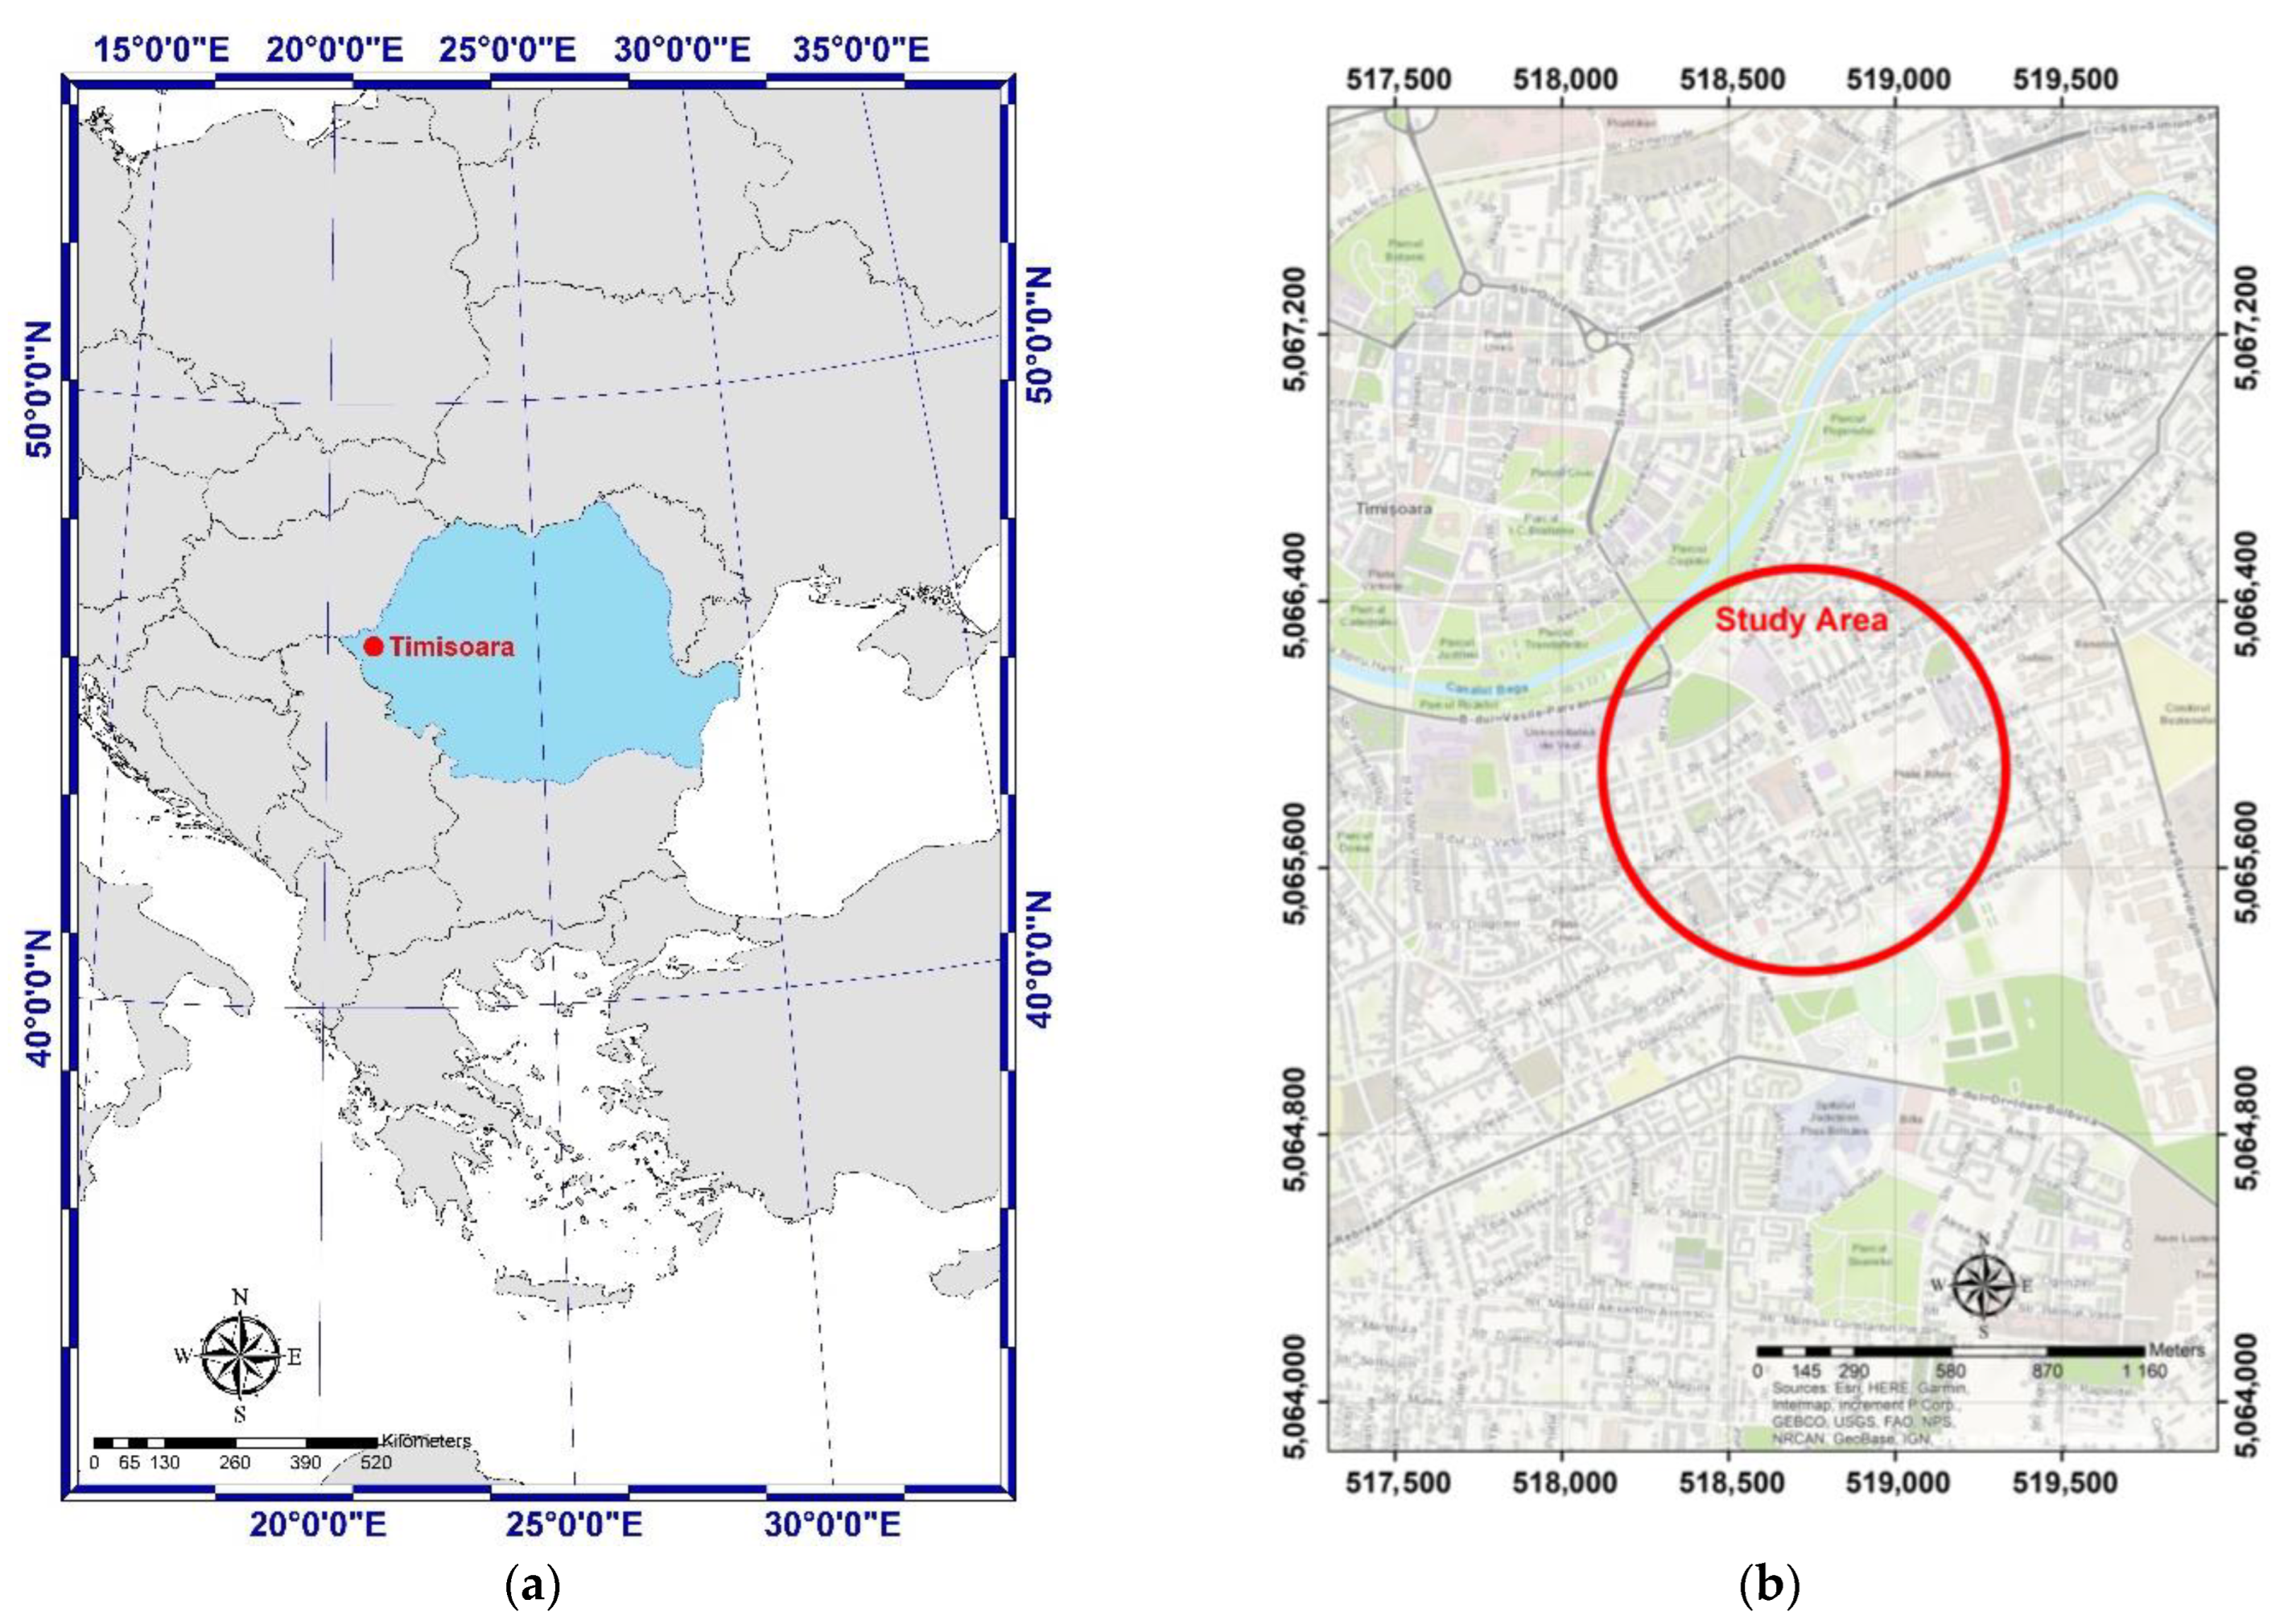
3.1. Study Area
3.2. Workflow of the Developed Methodology
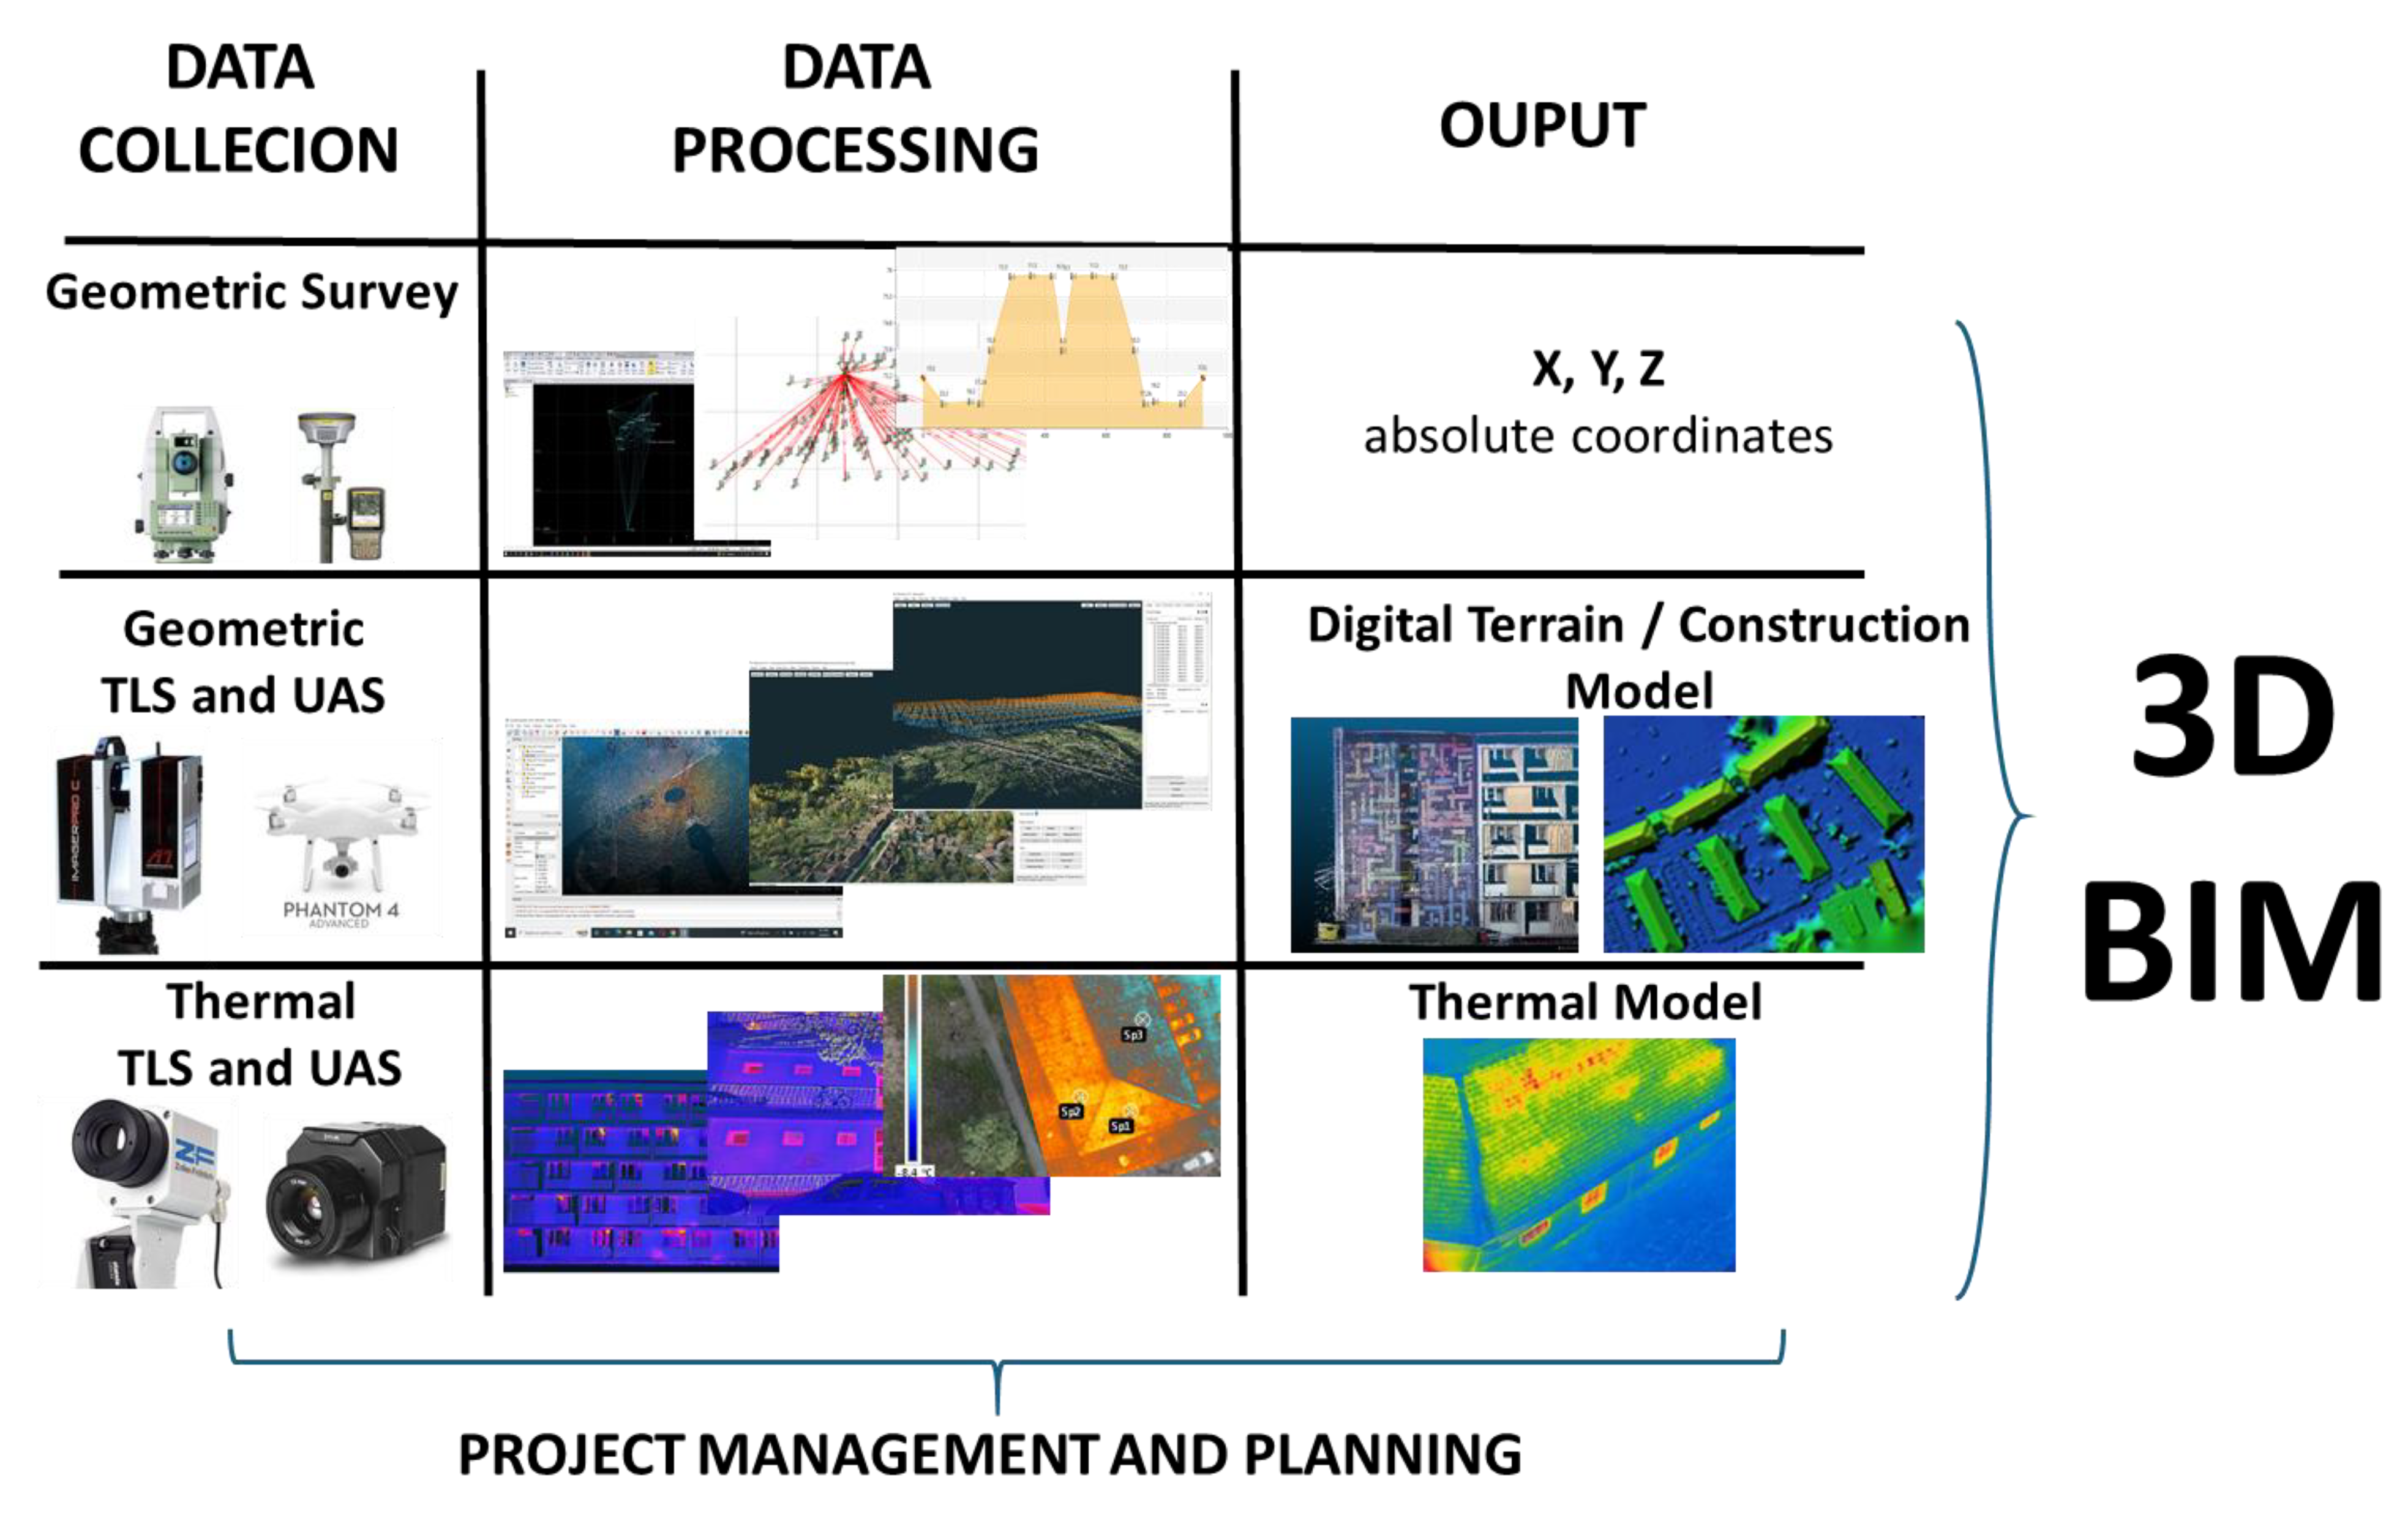
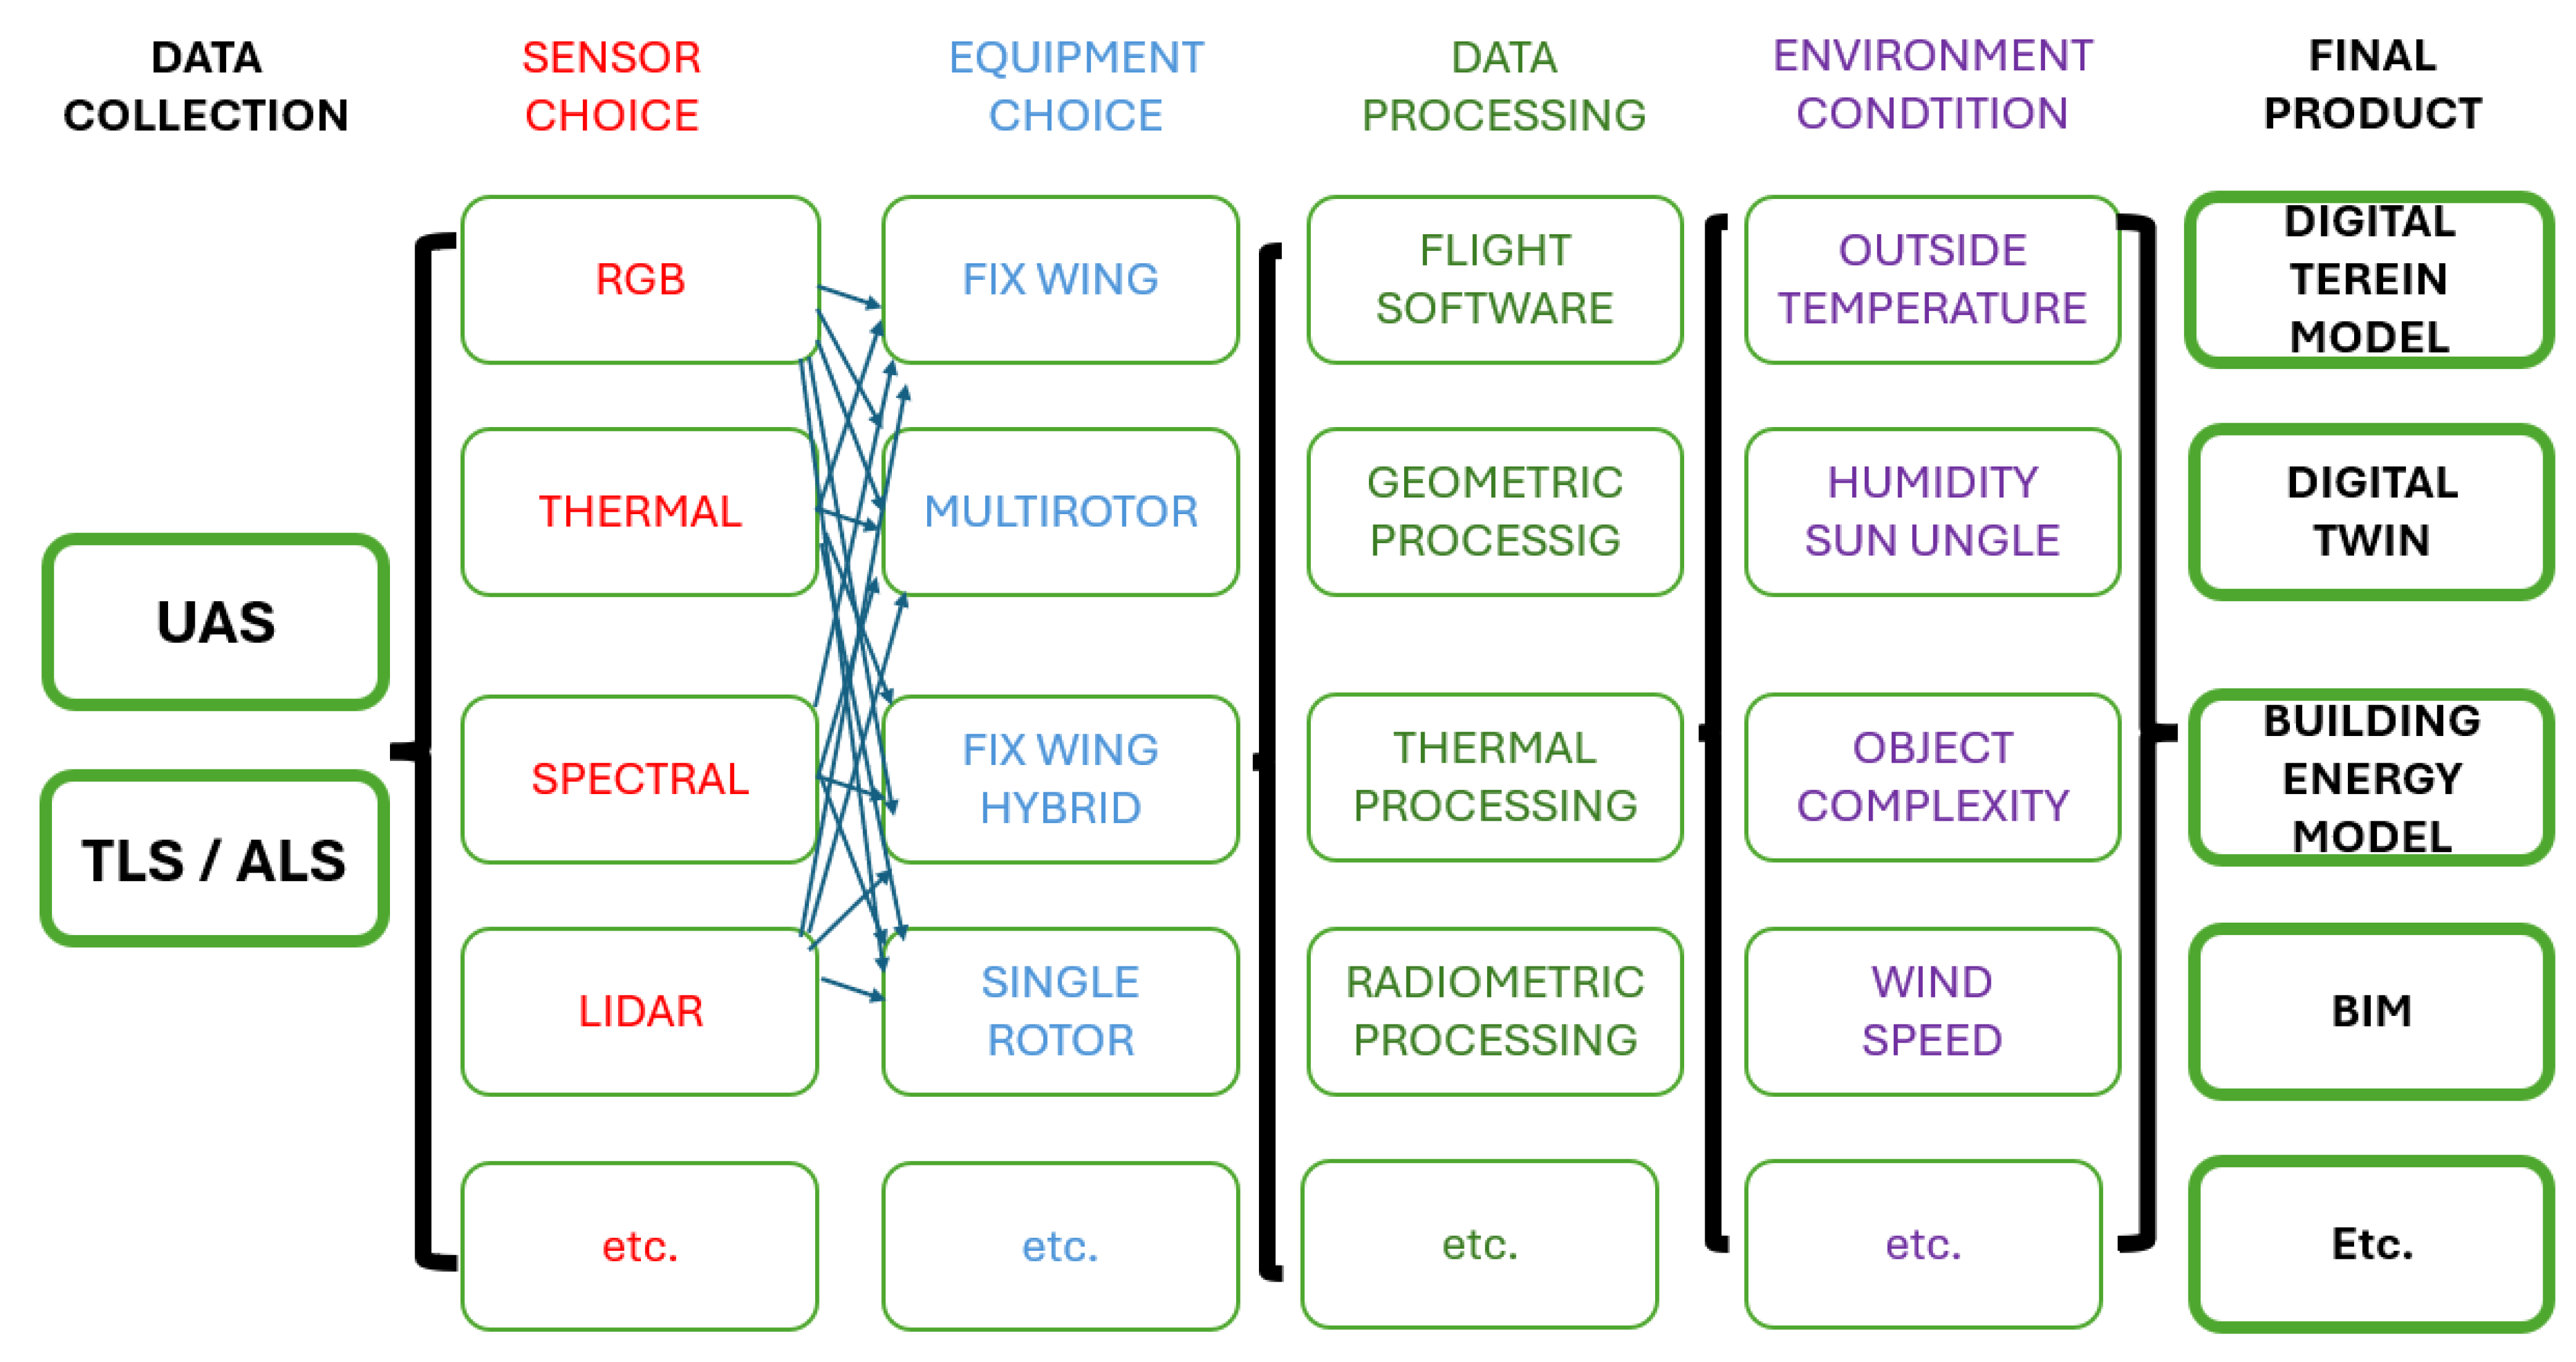
3.2.1. Data Collection
3.2.2. Data Processing
- -
- coordinates of thermal original images;
- -
- coordinates of rectificated thermal images in a local frame;
- -
- projective parameters.
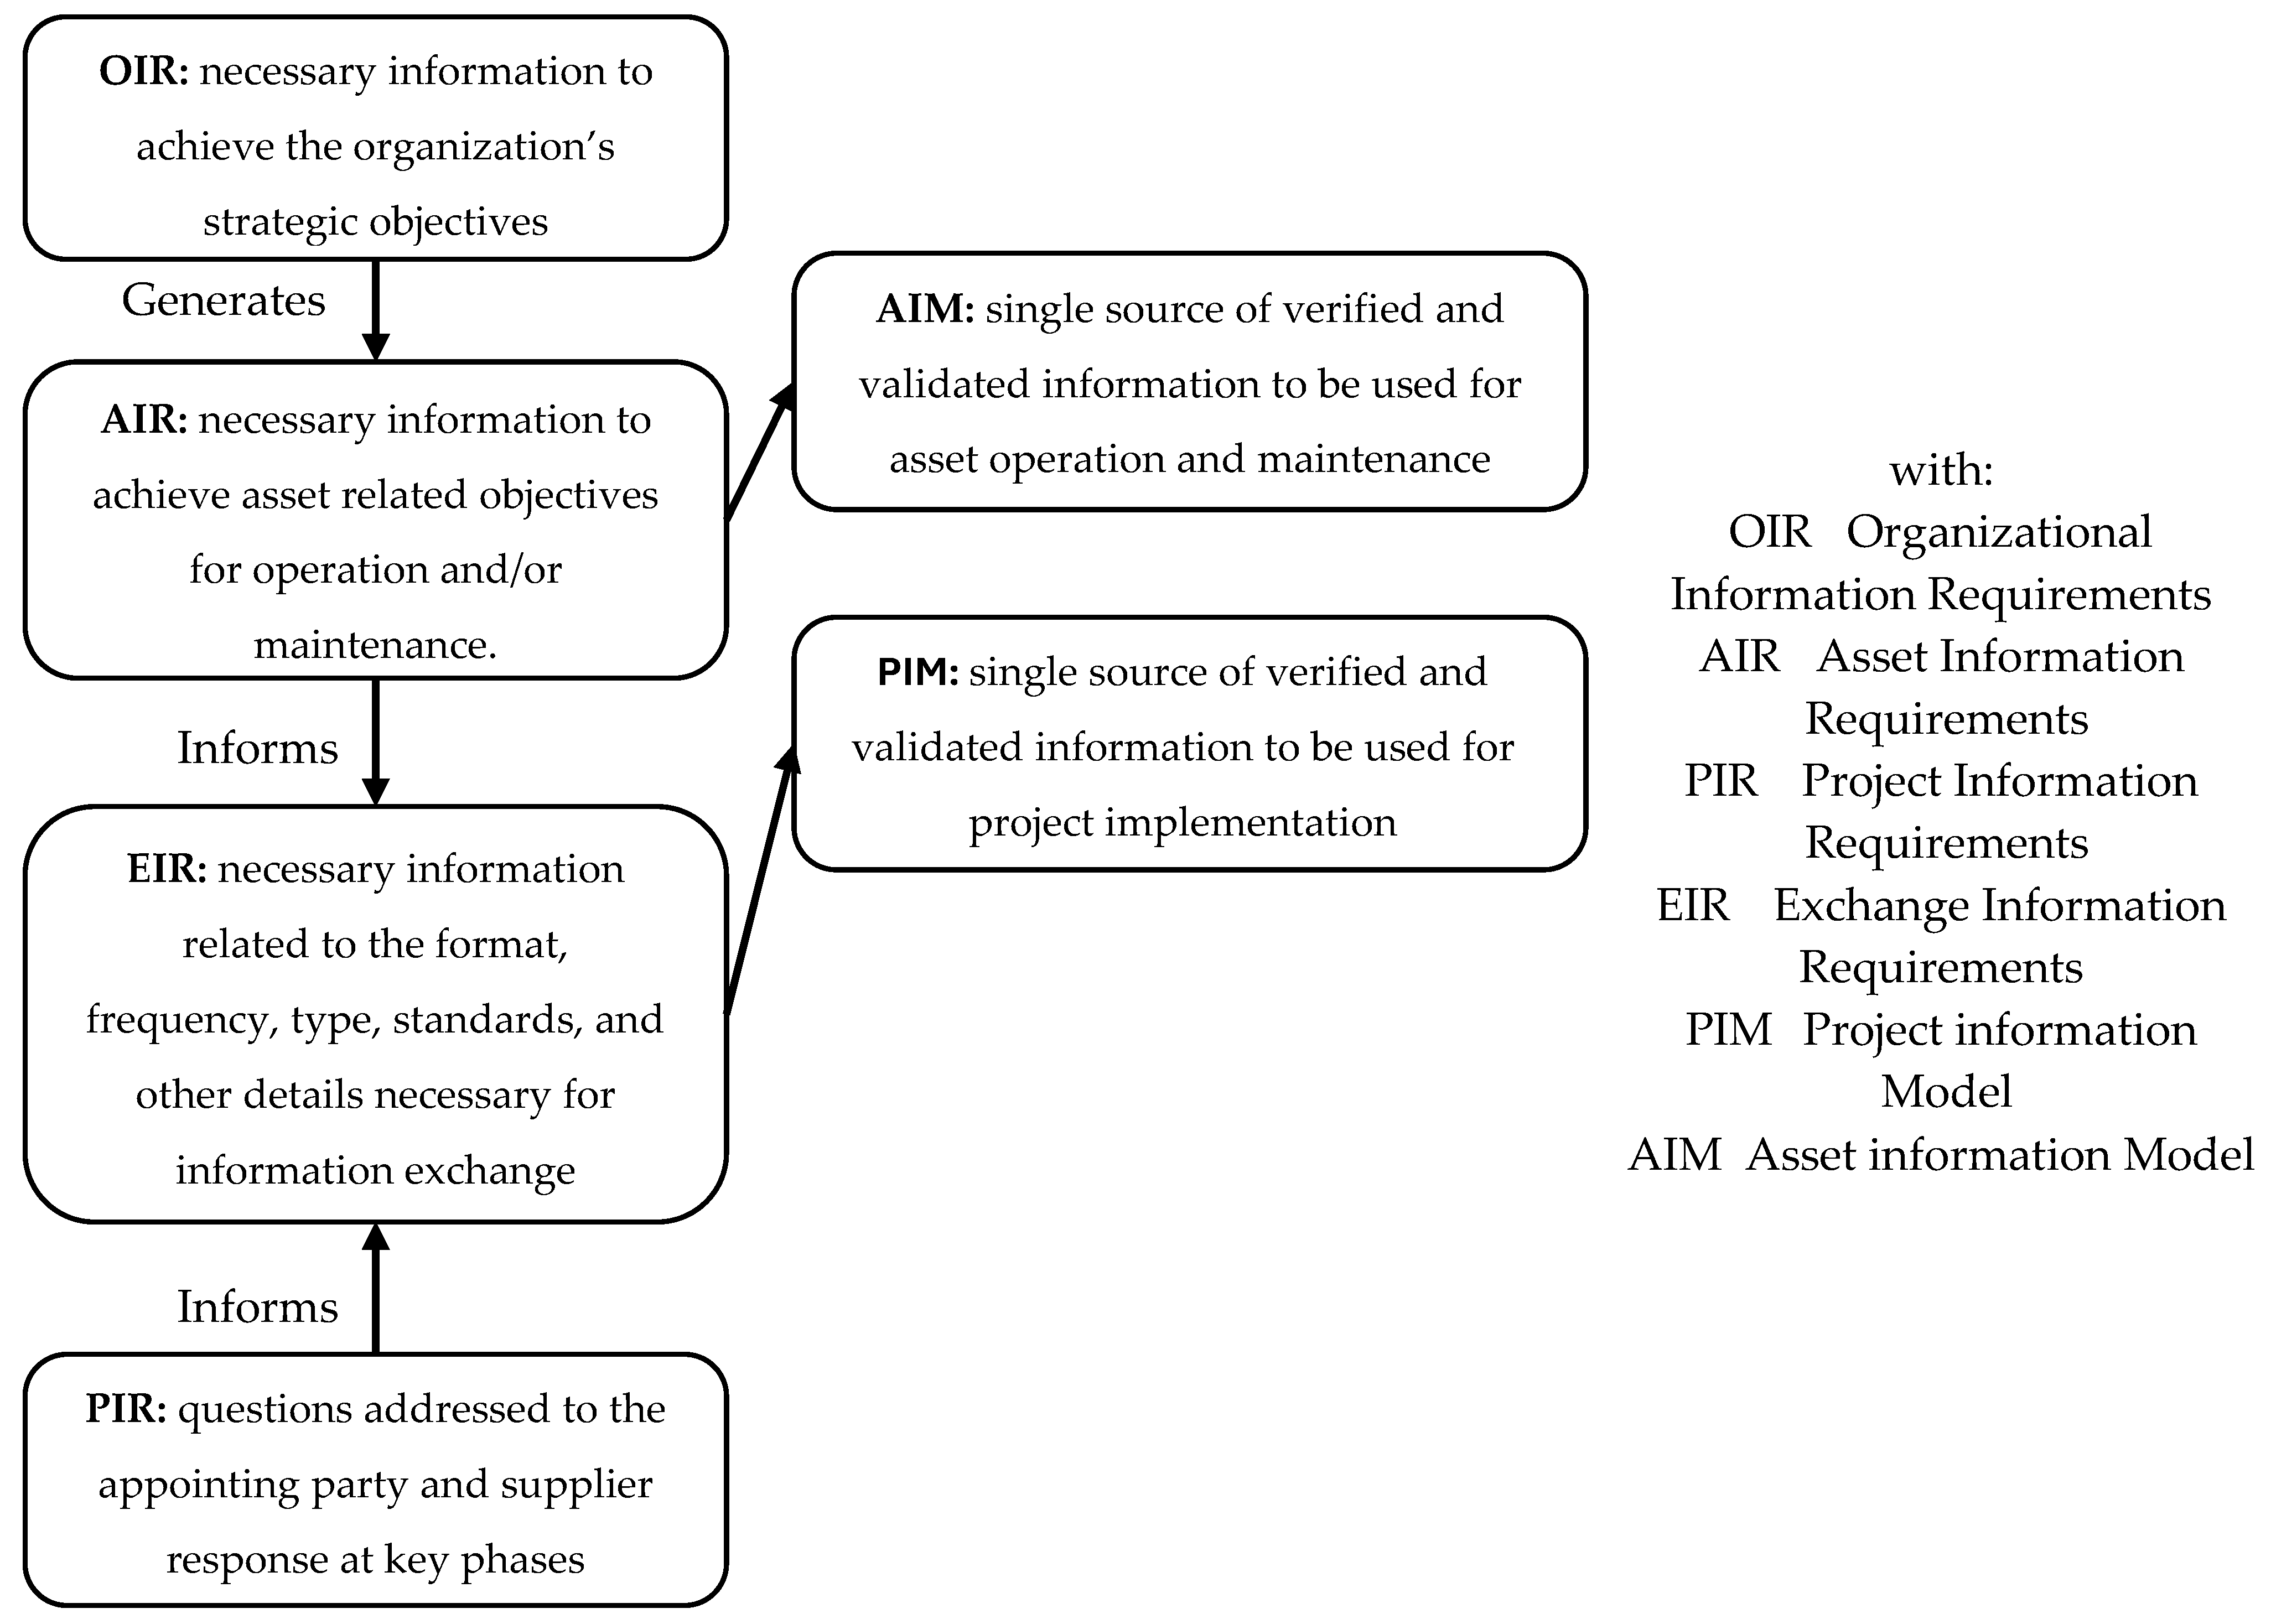
3.2.3. Project and Management Planning
- -
- In the first stage, data collection is achieved through technologies such as 3D laser scanning (TLS) and/or photogrammetry, where data about the conditions of the physical asset are collected. The result is an accurate digital representation that includes the structural elements, installations, finishes and other relevant characteristics of the asset in accordance with the defined requirements; for collecting data related to elements that are not visible (e.g., underground installations), GPR (Ground Penetration Radar) can be used.
- -
- In the second stage, field data are consolidated and used to create a detailed BIM model (at the minimum agreed LoD—Level of Detail) that includes digital representations of all relevant components of the asset. This model constitutes the Project Information Model (PIM), a vital tool for consolidating information about the current state of the asset;
- -
- In the third stage, the PIM is further augmented with detailed information (e.g., history of previous interventions, material testing results, technical expertise, etc.) reflecting the current state of the asset; within this step, the PIM consolidates as the single source of truth for the project.
- -
- The BIM model purpose and use (e.g., building geometry, location, orientation, envelope thermal characteristics) to support the assessment of building environmental impact (current and future), as well as architectural elements that may influence interventions (i.e., envelope thermal rehabilitation). The model will also be used for visualisation by all actors involved (including facility managers, engineers, architects and other associated consultants).
- -
- The Level of Detail (LoD)/Level of Development (LOD) [24] shall be sufficiently high to allow assessment of the current state and support the project development of planned interventions. Furthermore, the model must provide a way to compare the digital model with the real building, allowing differences to be identified and quantified to facilitate the identification of areas that require special attention and subsequent intervention.
- -
- The geometric model shall be accompanied by information (e.g., metainformation in the form of attributes, properties or additional details) and additional documentation from field data. Further information related to the modelling procedures used and any initial assumptions and limitations is also expected. The rationale for this information is to ensure transparency and facilitate model verification and validation.
- -
- Scanning resolution and precision shall ensure a specific maximum relative error for the point clouds (e.g., below 10 mm) to ensure an accurate representation of the existing structure.
4. Experimentation on the Case Study
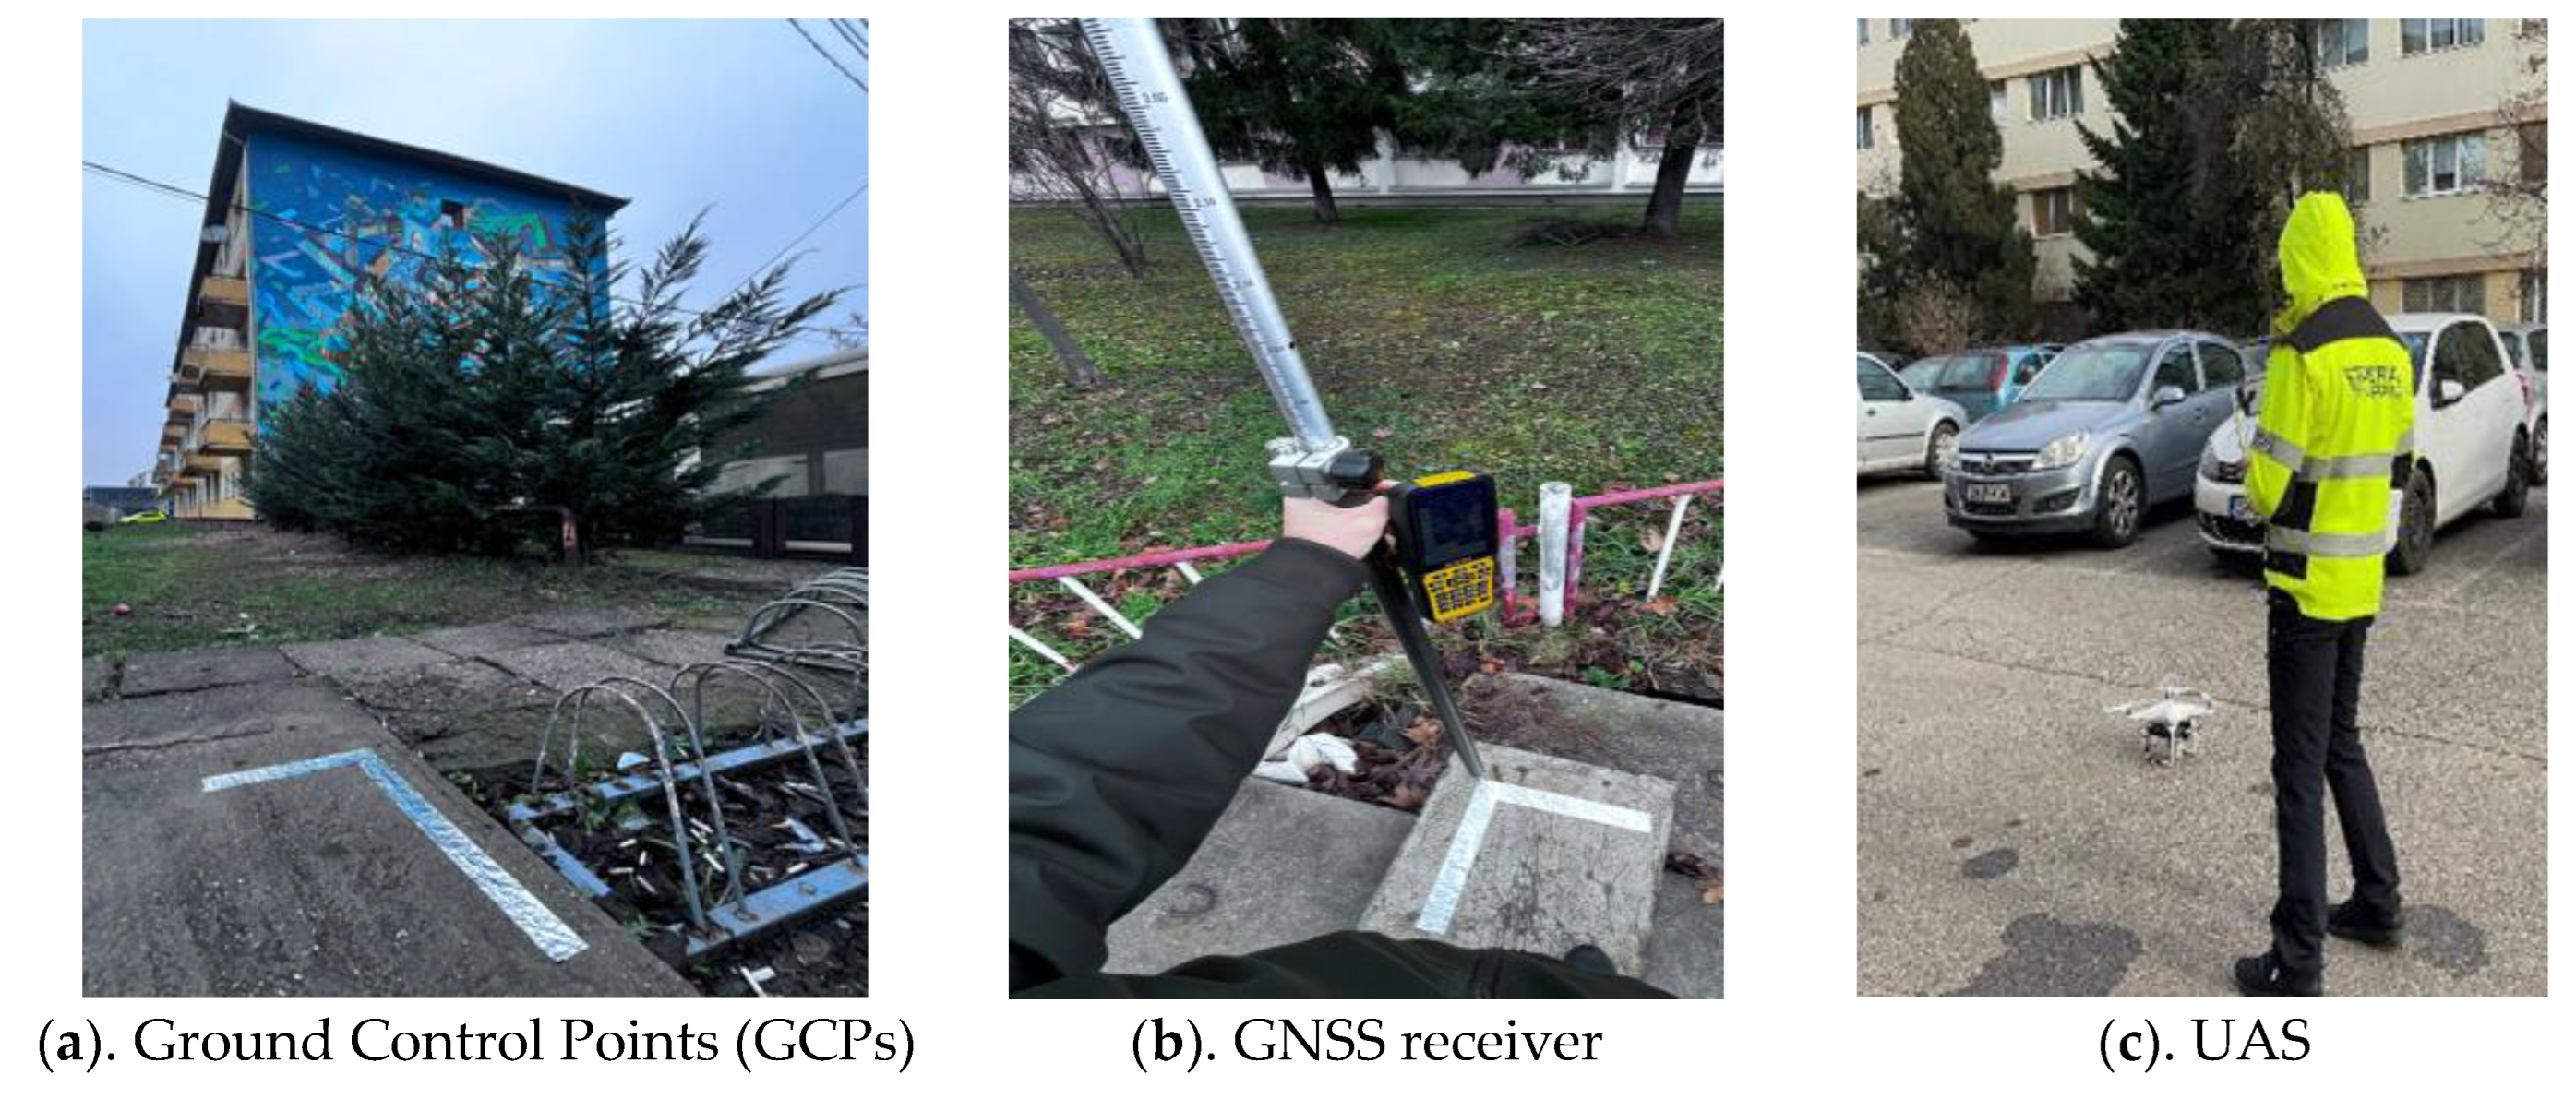
4.1. Data Collection: Project Planning and Equipment
4.2. Experiments and Equipment
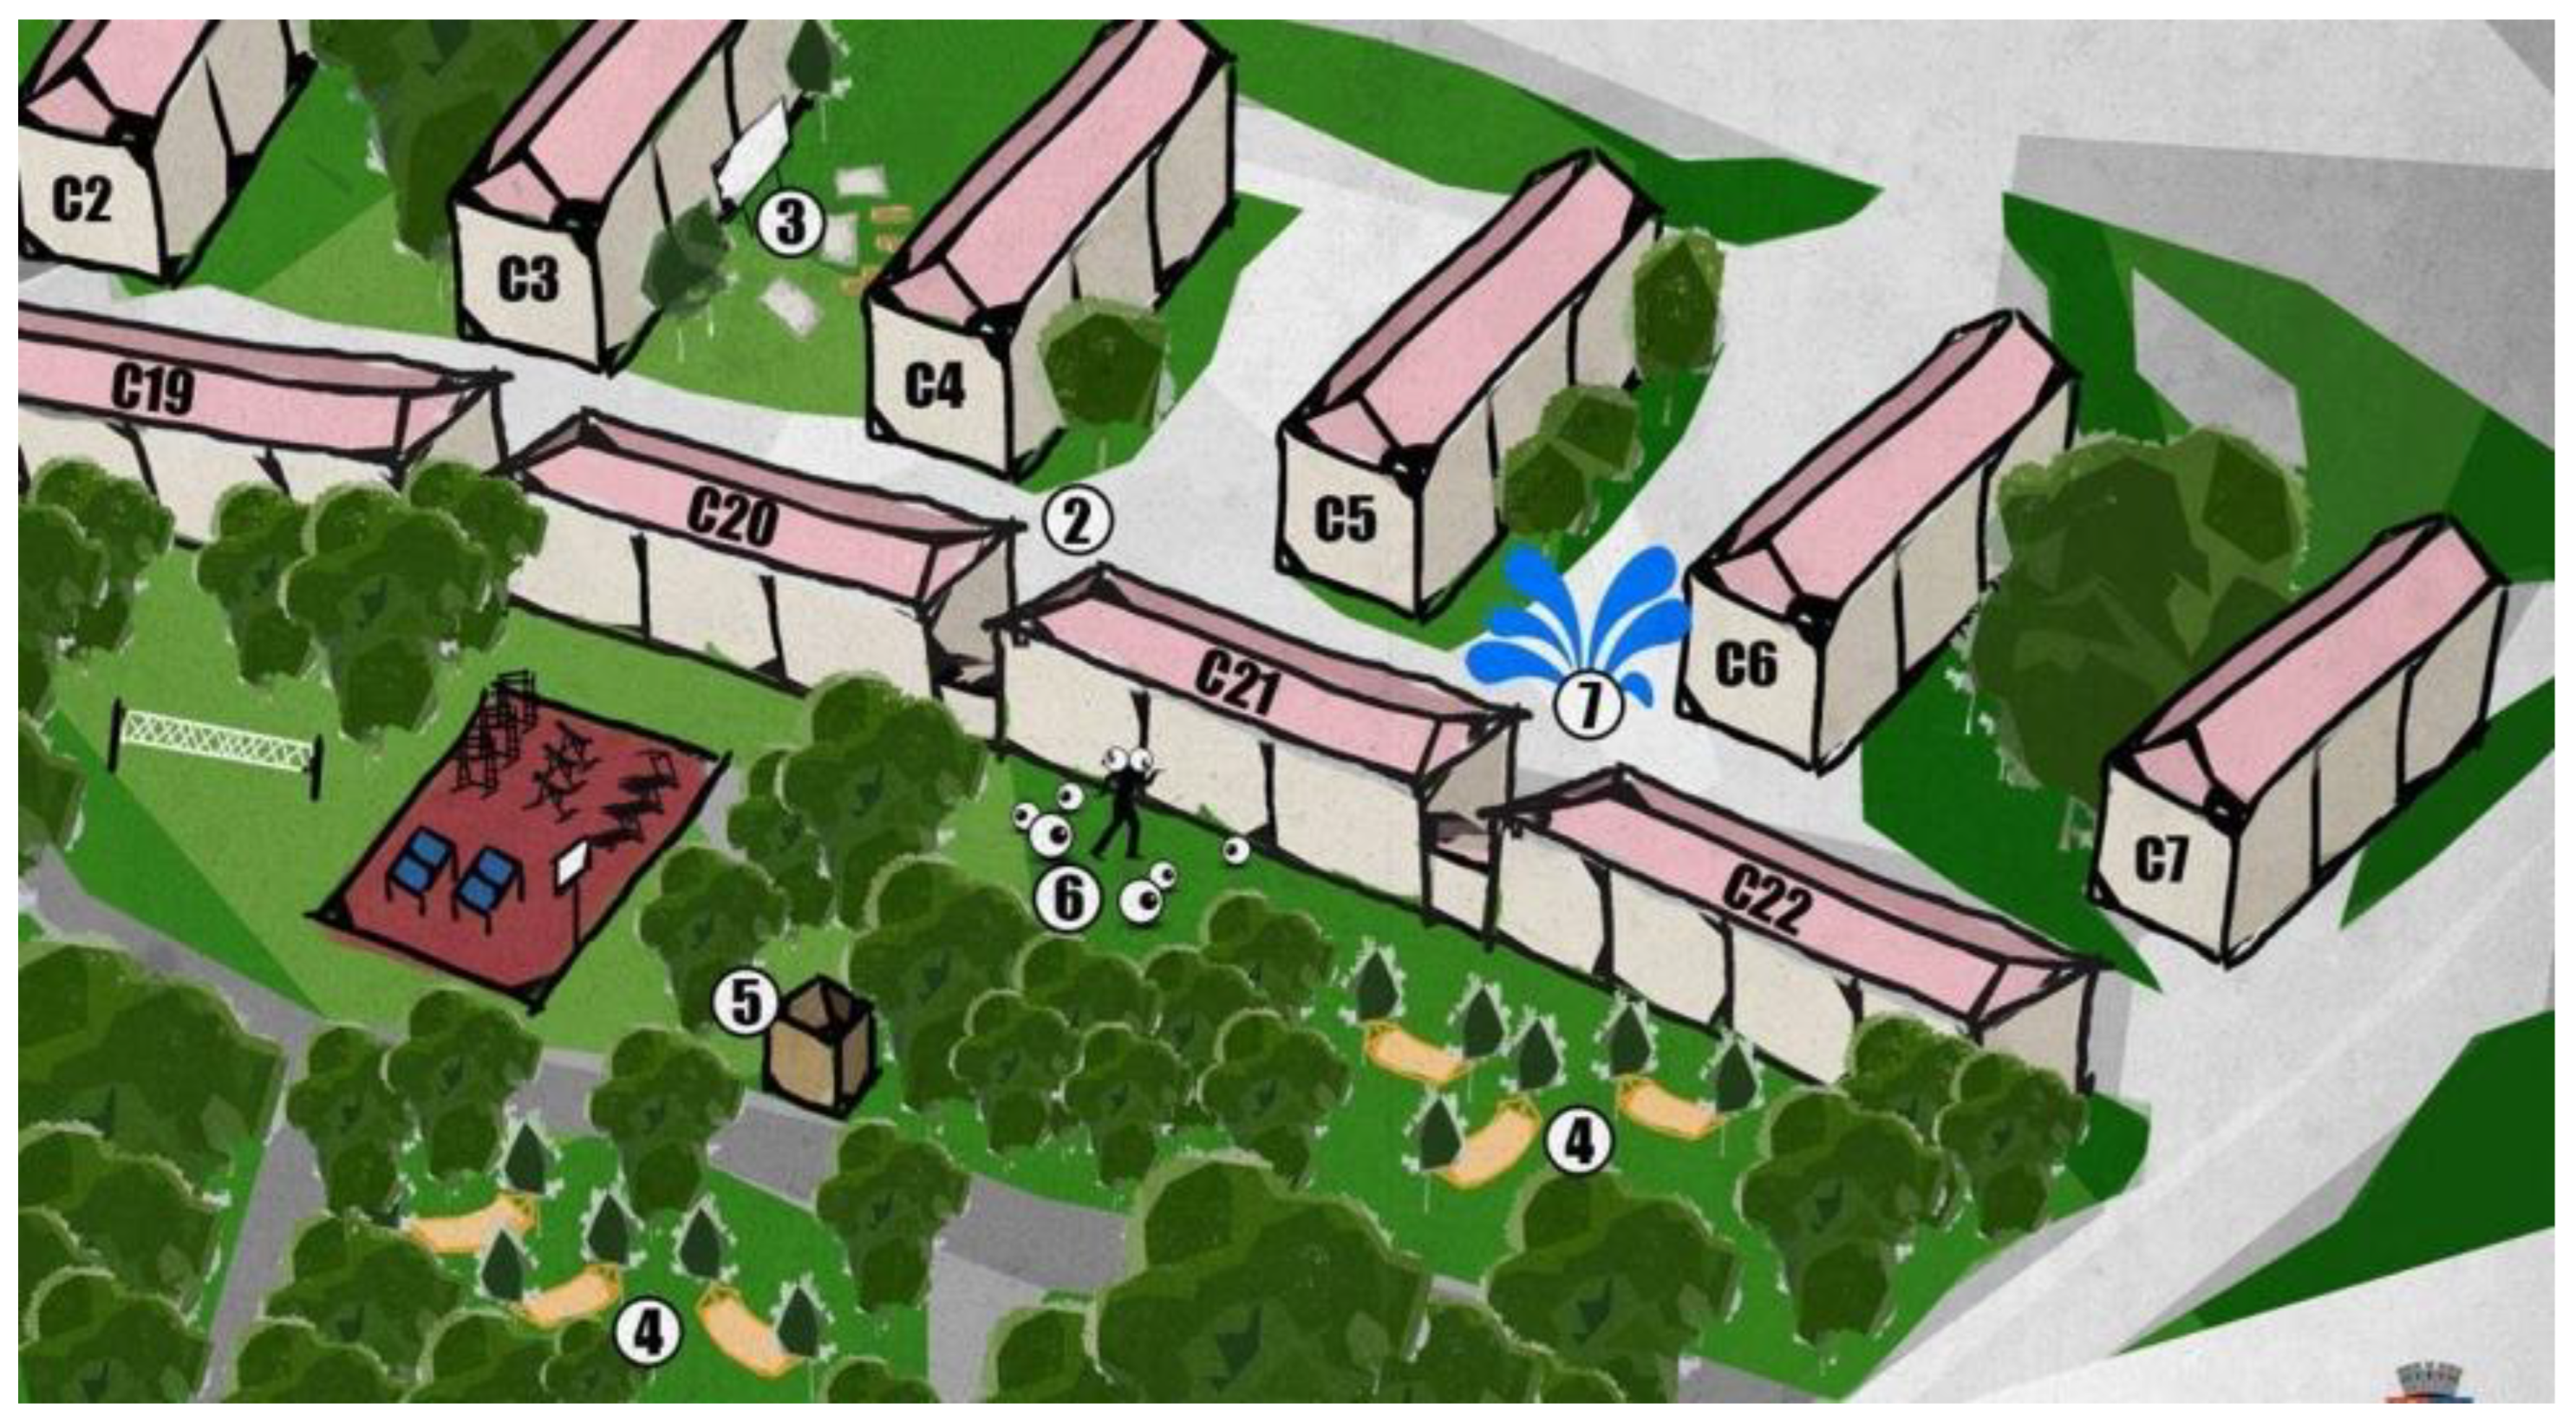
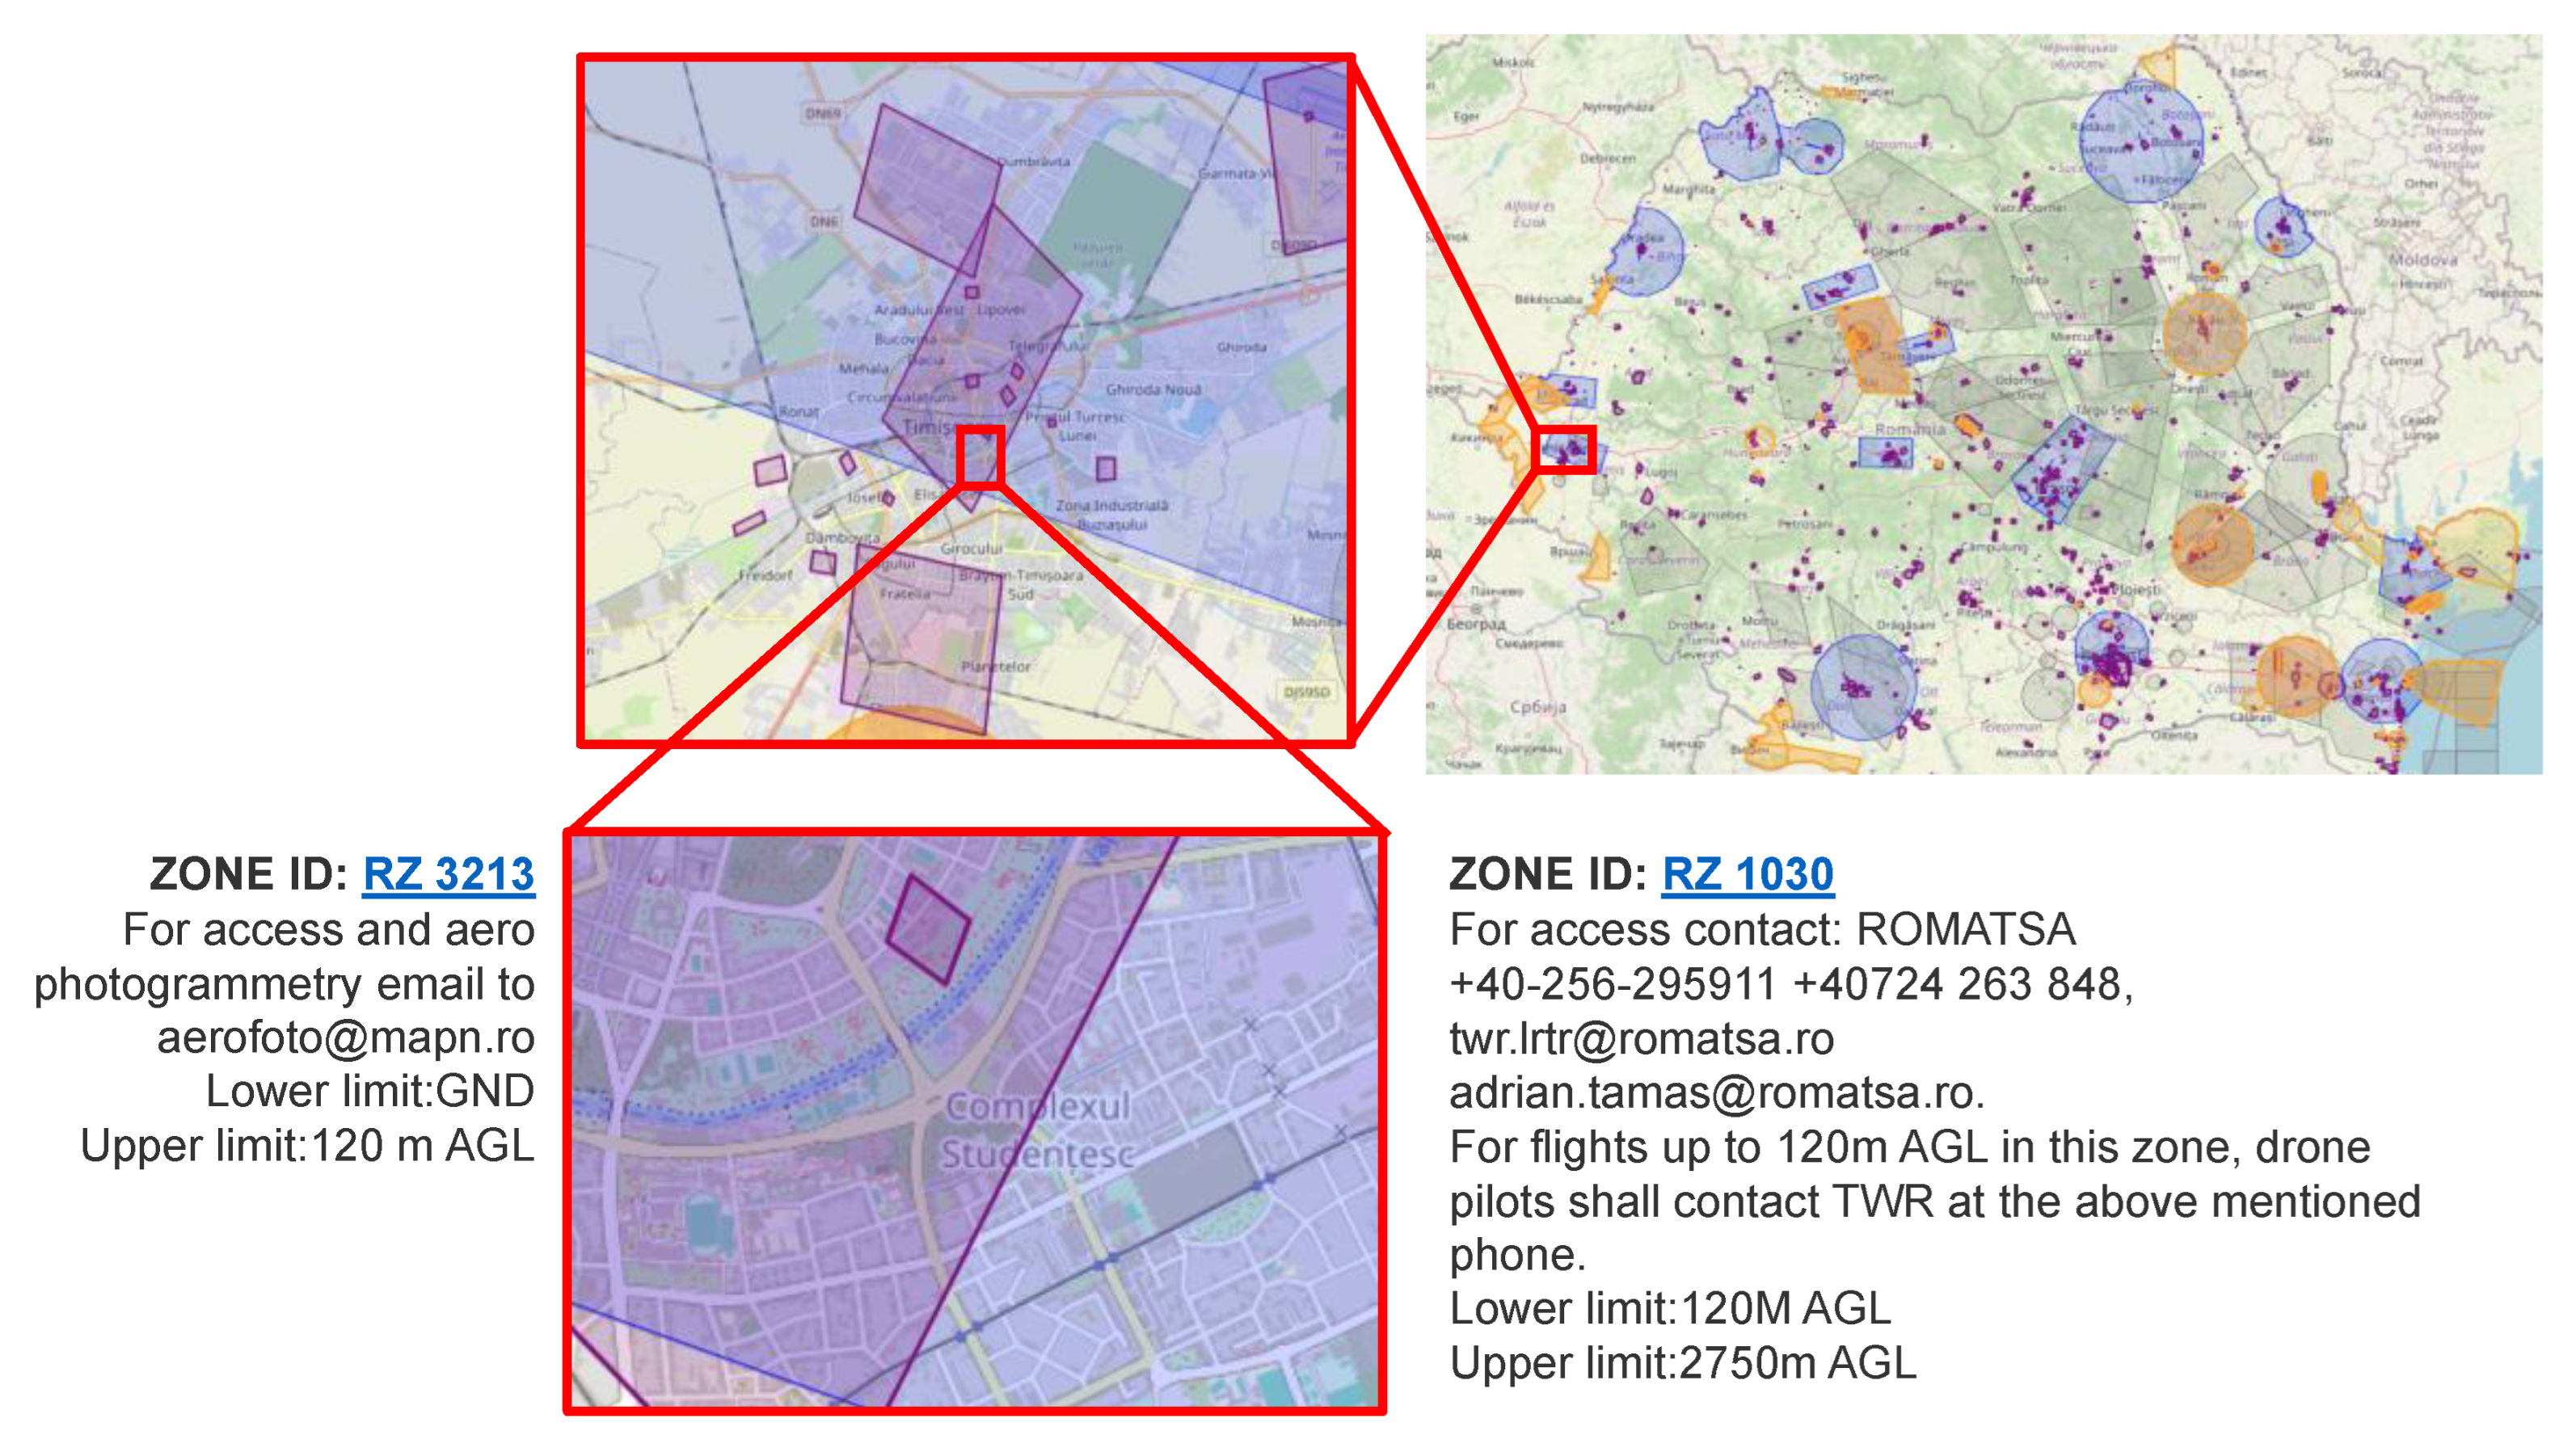
4.3. Surveyed Area and Considered Assets
- -
- Restricted geo-zones (marked yellow) limit Unmanned Aerial System (UAS) operations which are subject to fulfilment of an imposed set of conditions, since these areas are usually near airports, heliports, national parks, military installations, hospitals, nuclear power plants or any kind of key industrial site.
- -
- Facilitated geo-zones (marked green) rate UAS operations to ‘Open’, so drones can be flown without restrictions.
- -
- U-Space airspace (marked blue) represents a portion of the lower space where operations are managed for drones and other vehicles that operate in it.
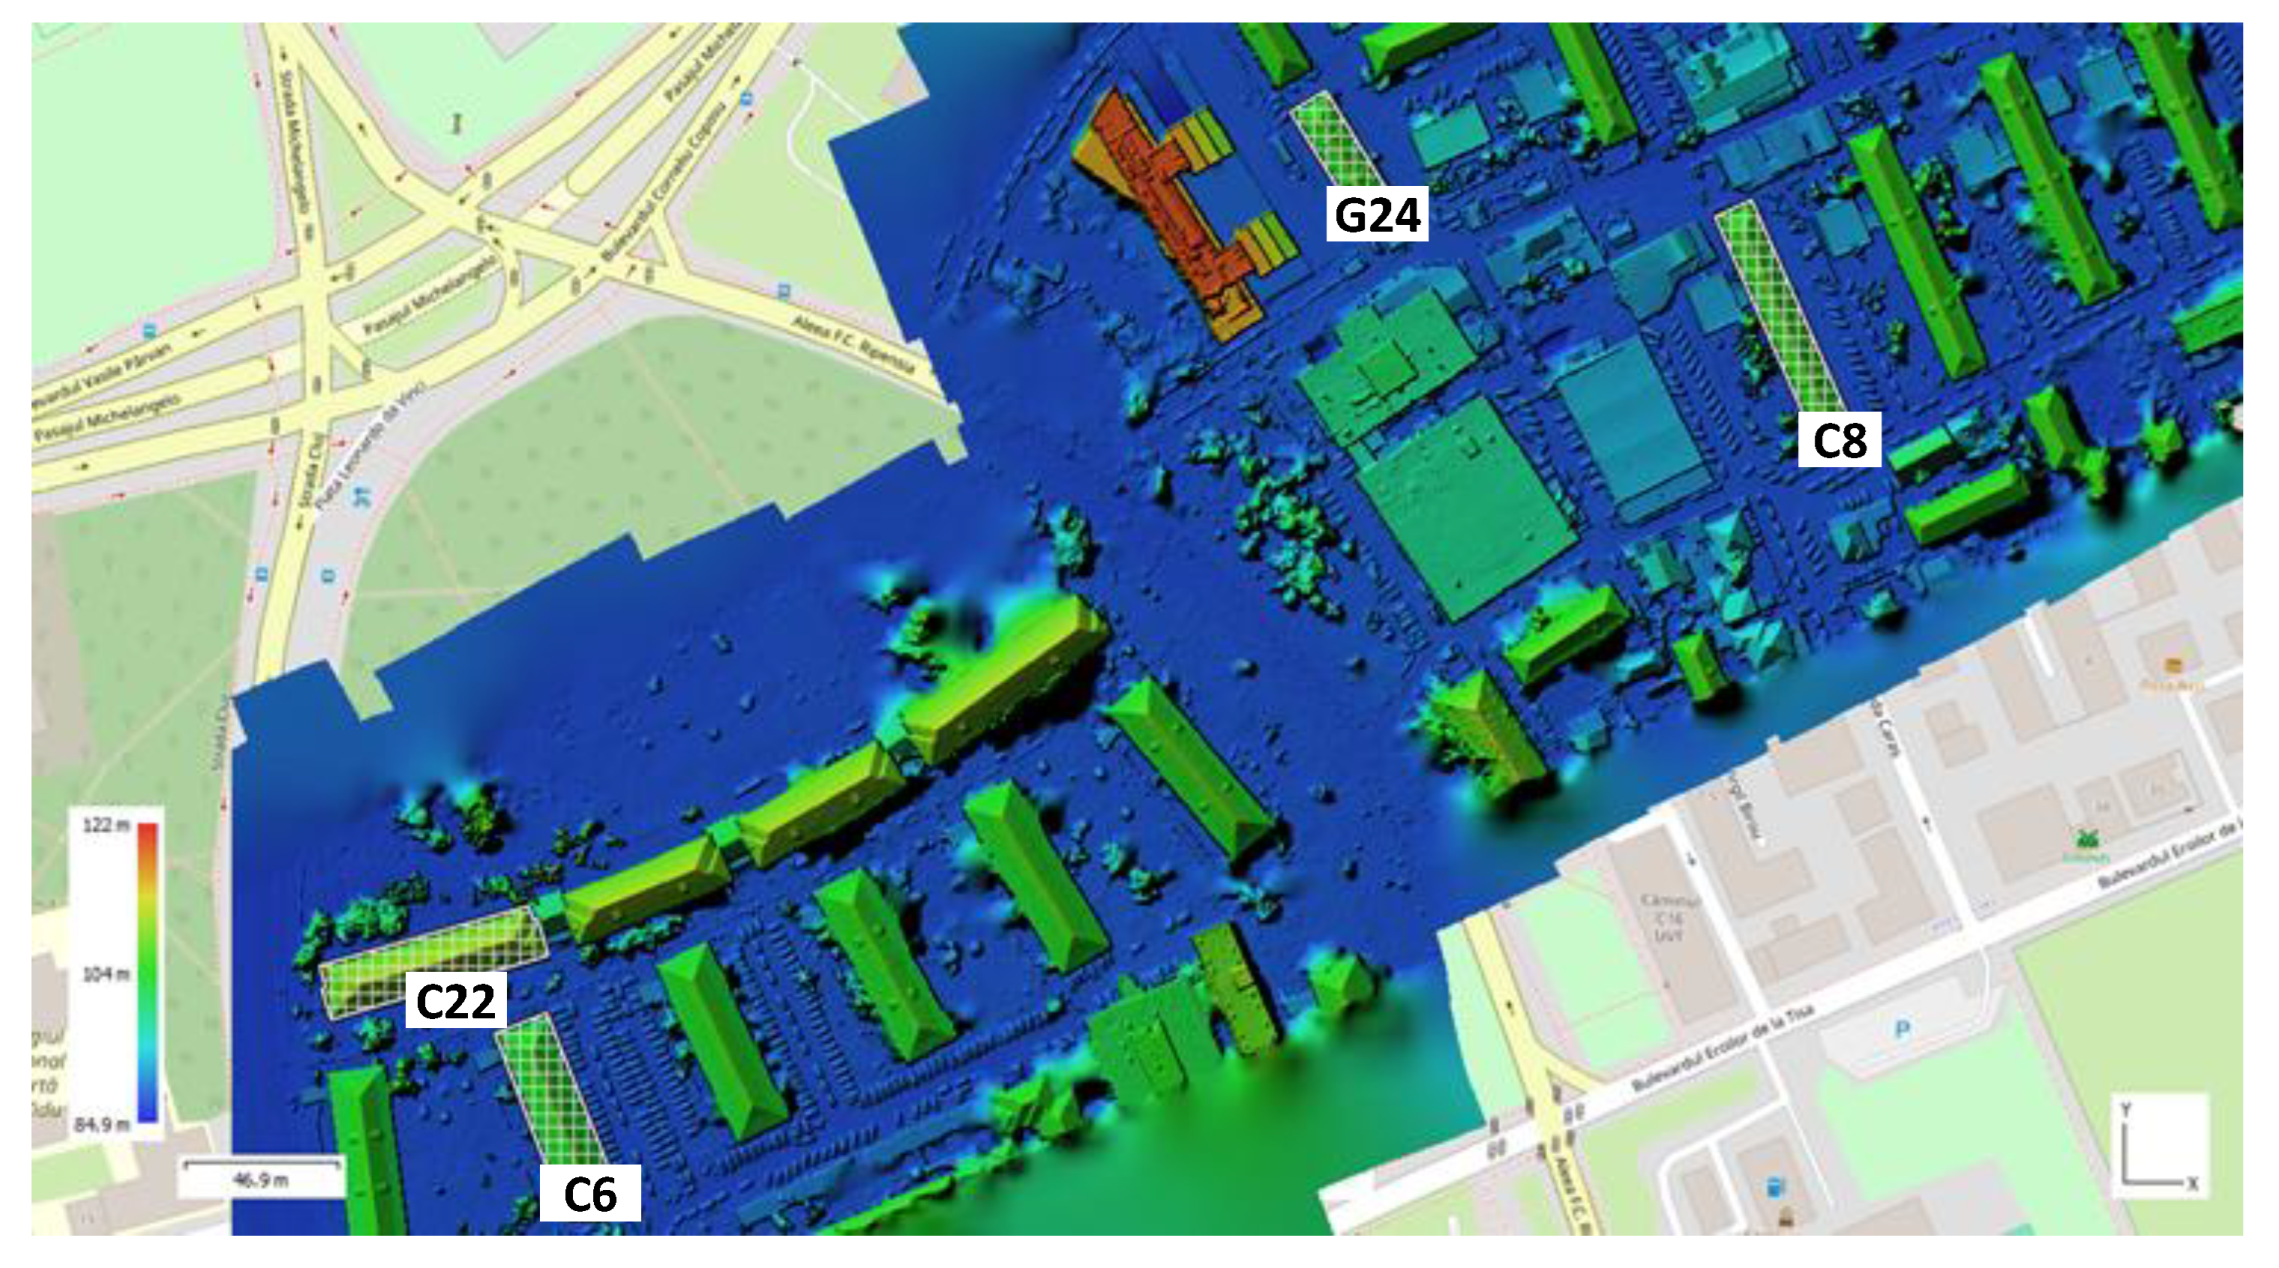
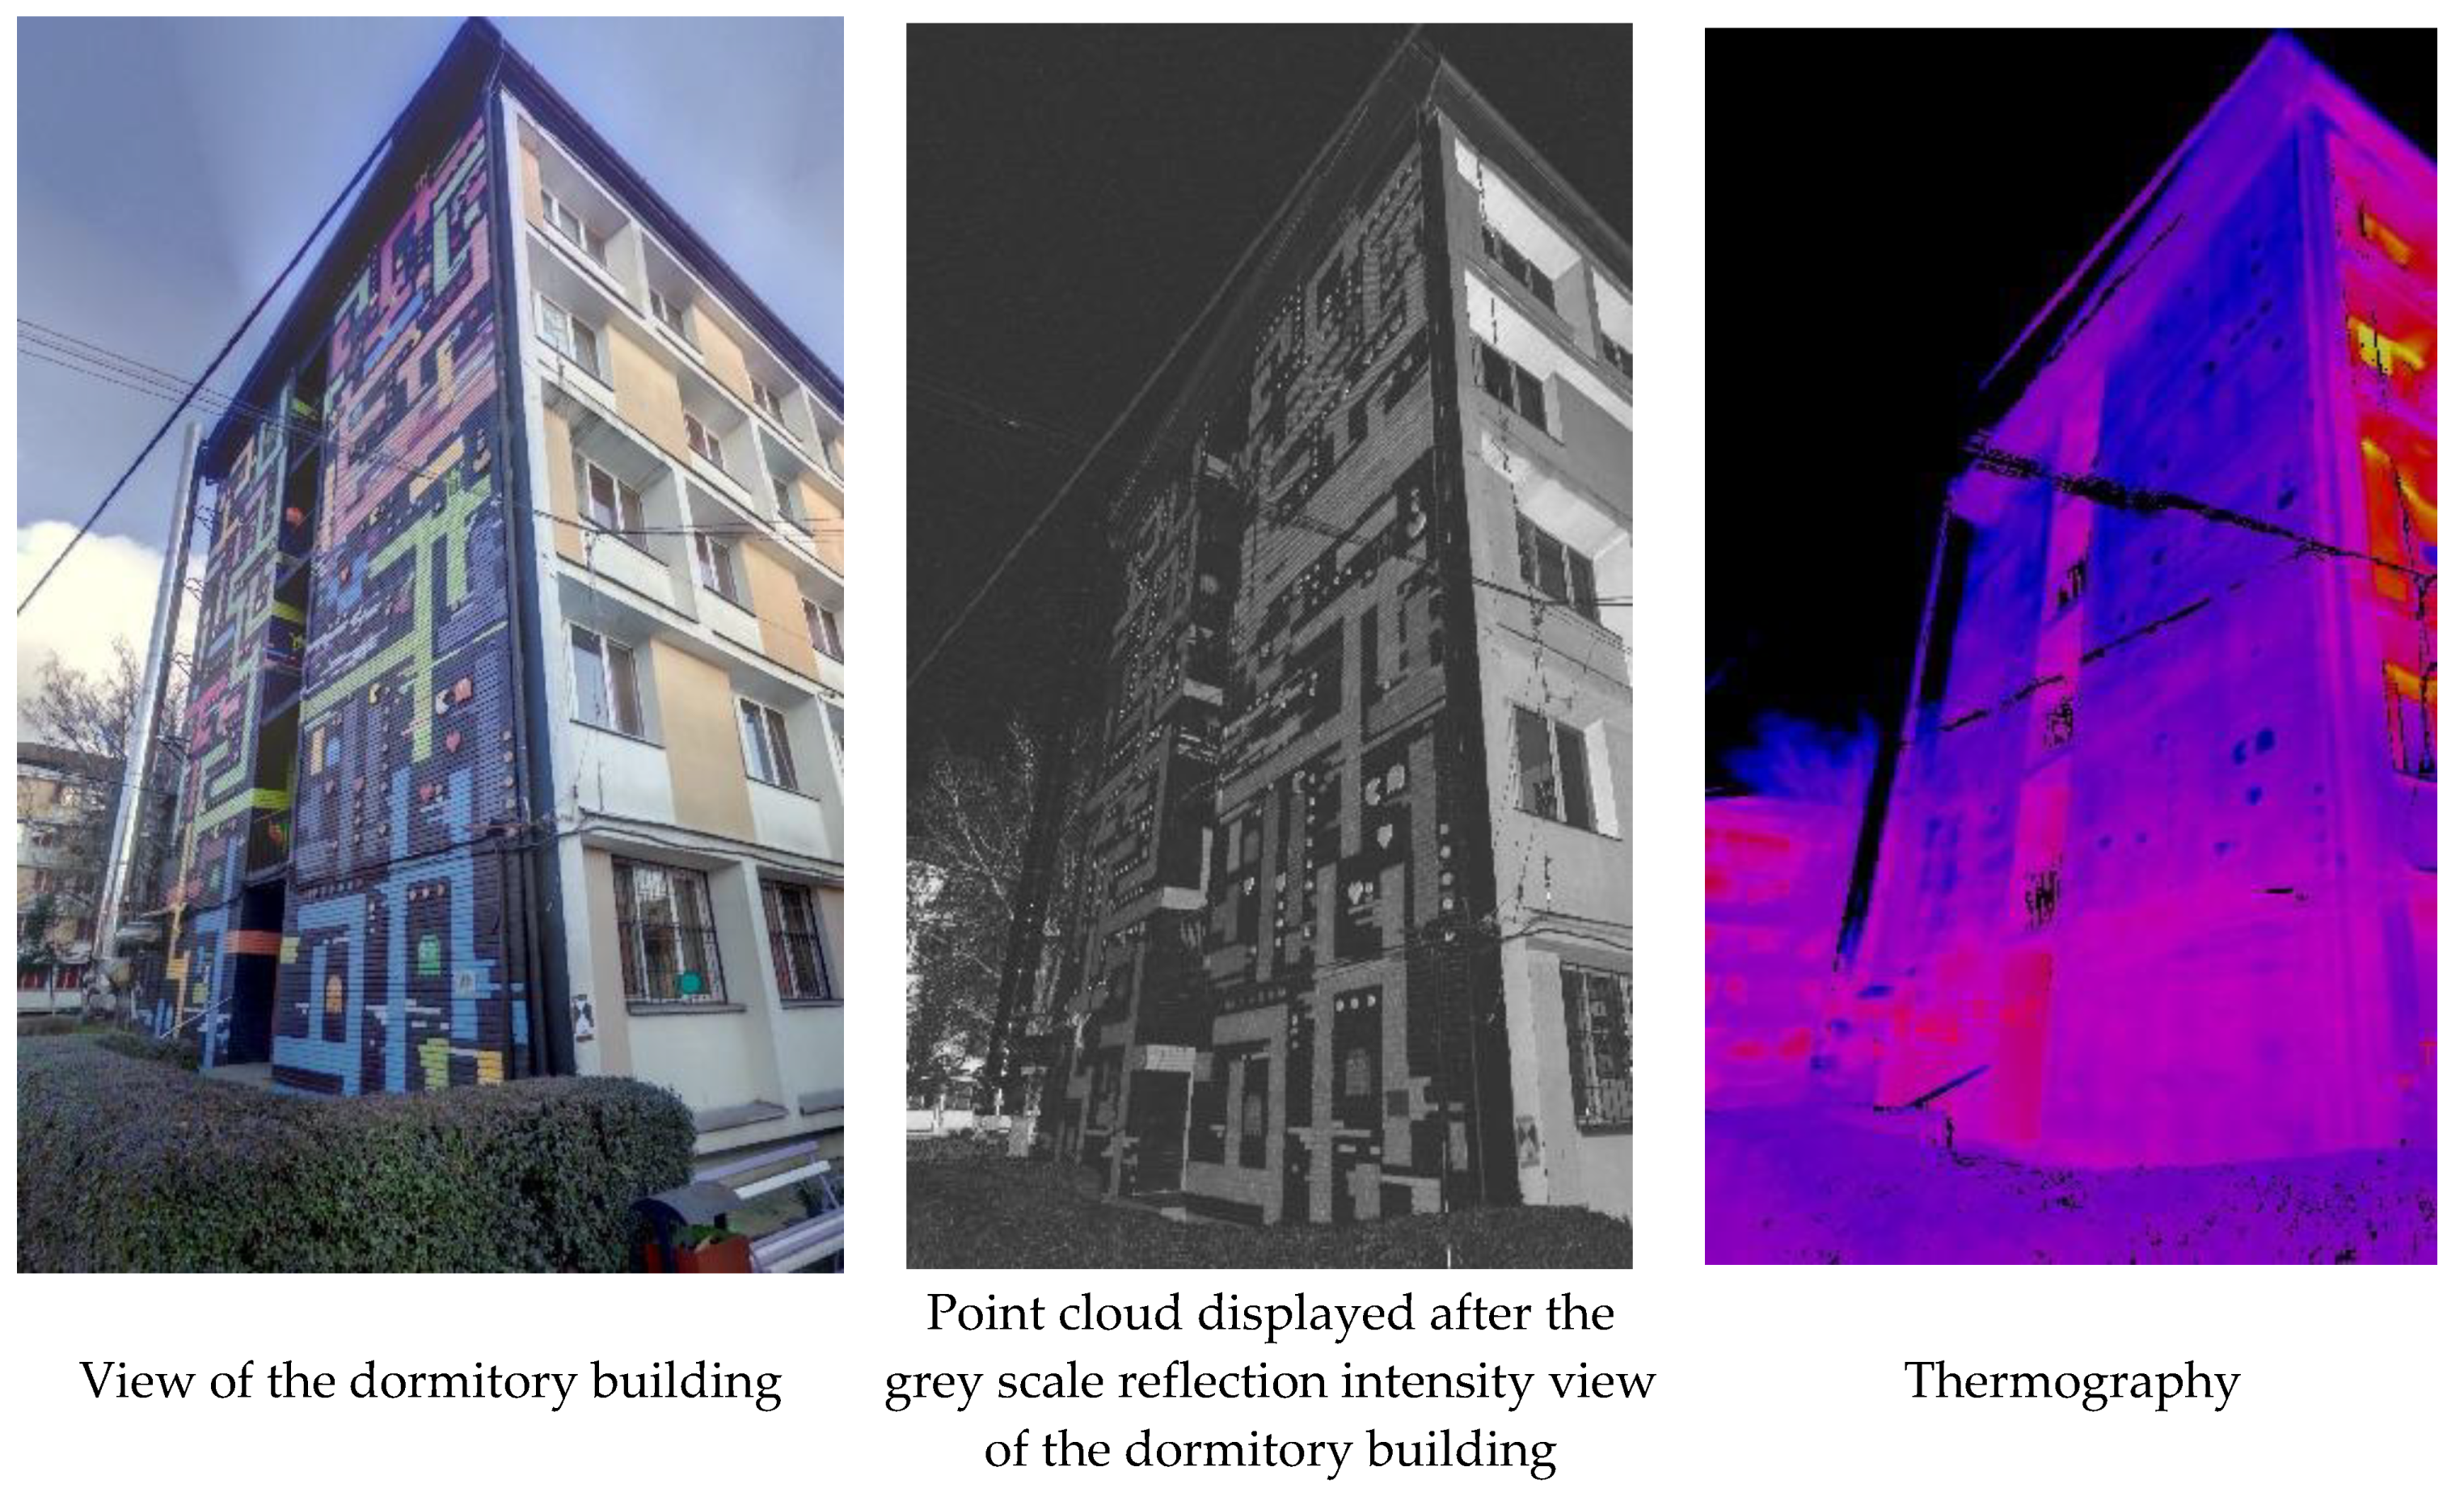
4.4. Photogrammetric and Scanning 3D Reconstruction
4.5. BIM for Energy Conservation Measures
5. Conclusions
Author Contributions
Funding
Institutional Review Board Statement
Informed Consent Statement
Data Availability Statement
Conflicts of Interest
List of Abbreviations
| ALS | Aerial Laser Scanning |
| AIM | Asset Information Models |
| AIR | Asset Information Requirements |
| BIM | Building Information Model |
| EASA | European Union Aviation Safety Agency |
| ECM | Existing Conditions Model |
| EEA | European Economic Area |
| EPBD | Energy Performance of Buildings Directive |
| GNSS | Global Navigation Satellite System |
| GPS | Global Positioning System |
| LEED | Leadership in Energy and Environmental Design |
| LoD | Level of Detail |
| LiDAR | Light Detection and Ranging |
| NDT | Non-Destructive Testing |
| PIM | Project Information Models |
| PIR | Project Information Requirements |
| RTK | Real Time Kinematics |
| TIR | Thermal infrared |
| TLS | Terrestrial Laser Scanning |
| UAS | Unmanned Aerial System |
| UAV | Unmanned Aerial Vehicle |
| USE-REC | University Students Engaging in Responsible and Sustainable Energy Consumption |
References
- Pescari, S.; Merea, M.; Pitroaca, A.; Vilceanu, C.B. A Particular Case of Urban Sustainability: Comparison Study of the Efficiency of Multiple Thermal Insulations for Buildings. Sustainability 2022, 14, 16283. [Google Scholar] [CrossRef]
- Agrasar-Santiso, K.; Millan-Garcia, J.A.; Otaduy-Zubizarreta, J.P.; Baïri, A.; Martín-Garín, A. Diagnosis of Heritage Buildings by Non-Destructive Techniques, 1st ed.; Herrán, B.T., Bienvenido-Huertas, D., Eds.; Elsevier: Amsterdam, The Netherlands, 2024; pp. 133–158. [Google Scholar] [CrossRef]
- Zhang, C.; Zou, Y.; Dimyadi, J.; Chang, R. Thermal-textured BIM generation for building energy audit with UAV image fusion and histogram-based enhancement. Energy Build. 2023, 301, 113710. [Google Scholar] [CrossRef]
- Jin, M.; Cimillo, M. UAV-Based Geometry Data Acquisition for Building Energy Modelling. In Lecture Notes in Civil Engineering; xArch—Creativity in the Age of Digital Reproduction Symposium—Creativity in the Age of Digital Reproduction; Springer Nature: Singapore, 2024; pp. 34–41. [Google Scholar] [CrossRef]
- Parracho, D.F.; Martins, J.P.; Barreira, E. A Workflow for Photogrammetric and Thermographic Surveys of Buildings with Drones. In New Advances in Building Information Modeling and Engineering Management; Springer: Berlin/Heidelberg, Germany, 2023; pp. 77–95. [Google Scholar] [CrossRef]
- Biswanath, M.K.; Hoegner, L.; Stilla, U. Thermal Mapping from Point Clouds to 3D Building Model Facades. Remote Sens. 2023, 15, 4830. [Google Scholar] [CrossRef]
- Habibi, S. Role of BIM and energy simulation tools in designing zero-net energy homes. Constr. Innov. 2021, 22, 101–119. [Google Scholar] [CrossRef]
- Project No. 346695, U.-R. University Students Engaging in Responsible and Sustainable Energy Consumption (USE-REC)—2022/346695; Energy Programme in Romania, Norway Grants 2014–2021; Fundația Politehnica Timisoara: Timisoara, Romania, 2023; Available online: https://fundatiapolitehnica.ro/?page_id=2817 (accessed on 7 April 2025).
- Stoian, C.E.; Șimon, S.; Gherheș, V. A Comparative Analysis of the Use of the Concept of Sustainability in the Romanian Top Universities’ Strategic Plans. Sustainability 2021, 13, 10642. [Google Scholar] [CrossRef]
- Sharbafian, M.; Yeganeh, M.; Motie, M.B. Evaluation of Shading of Green Facades on Visual Comfort and Thermal load of the Buildings. Energy Build. 2024, 317, 114303. [Google Scholar] [CrossRef]
- Bayomi, N.; Nagpal, S.; Rakha, T.; Fernandez, J.E. Building envelope modeling calibration using aerial thermography. Energy Build. 2021, 233, 110648. [Google Scholar] [CrossRef]
- Warchoł, A.; Pęzioł, K.; Baścik, M. Energy-Saving Geospatial Data Storage—LiDAR Point Cloud Compression. Energies 2024, 17, 6413. [Google Scholar] [CrossRef]
- Ramón, A.; Adán, A.; Castilla, F.J. Thermal point clouds of buildings: A review. Energy Build. 2022, 274, 112425. [Google Scholar] [CrossRef]
- Ocaña, S.M.; Guerrero, I.C.; Requena, I.G. Thermographic survey of two rural buildings in Spain. Energy Build. 2004, 36, 515–523. [Google Scholar] [CrossRef]
- Lagüela, S.; Martínez-Sánchez, J.; Armesto-González, J.; Arias, P. Energy efficiency studies through 3D laser scanning and thermographic technologies. Energy Build. 2011, 43, 1216–1221. [Google Scholar] [CrossRef]
- Parente, C.; Pepe, M. Benefit of the integration of visible and thermal infrared images for the survey and energy efficiency analysis in the construction field. J. Appl. Eng. Sci. 2019, 17, 571–578. [Google Scholar] [CrossRef]
- Luhmann, T.; Robson, S.; Kyle, S.A.; Boehm, J. Close Range Photogrammetry and 3D Imaging; De Gruyter: Berlin, Germany, 2013. [Google Scholar] [CrossRef]
- ISO 19650-1; Organization and Digitization of Information About Buildings and Civil Engineering Works, Including Building Information Modelling (BIM), Information Management Using Building Information Modelling; Part 1: Concepts and Principles. ISO: Geneva, Switzerland, 2018.
- Tmušić, G.; Manfreda, S.; Aasen, H.; James, M.R.; Gonçalves, G.; Ben-Dor, E.; Brook, A.; Polinova, M.; Arranz, J.J.; Mészáros, J.; et al. Current Practices in UAS-based Environmental Monitoring. Remote Sens. 2020, 12, 1001. [Google Scholar] [CrossRef]
- Klapa, P.; Gawronek, P. Synergy of Geospatial Data from TLS and UAV for Heritage Building Information Modeling (HBIM). Remote Sens. 2022, 15, 128. [Google Scholar] [CrossRef]
- Available online: https://ucm.buildingsmart.org/use-case-management (accessed on 10 September 2024).
- Available online: www.buildingsmart.org/wp-content/uploads/2019/02/bSI-Awards-2019-Use-Case-Documentation-V4-1.xlsx (accessed on 18 November 2024).
- Abualdenien, J.; Borrmann, A. Levels of detail, development, definition, and information need: A critical literature review. J. Inf. Technol. Constr. 2022, 27, 363–392. [Google Scholar] [CrossRef]
- Romatsa Aeronautical Information Portal. Available online: https://Flightplan.romatsa.ro/init/drones (accessed on 18 November 2024).
- Strelnikova, D.; Ioneanu, S.; Herban, S.; Paulus, G.; Manfreda, S. Operations Manual for the Use of UAS in Environmental Studies (Based on SORA 2.0), 1st ed.; Zenodo: Geneva, Switzerland, 2022. [Google Scholar] [CrossRef]
- Commission Implementing Regulation (EU). Commission Implementing Regulation (EU) 2019/947 of 24 May 2019 on the Rules and Procedures for the Operation of Unmanned Aircraft. Available online: http://data.europa.eu/eli/reg_impl/2019/947/oj (accessed on 20 December 2024).
- González-Aguilera, D.; Lagüela, S.; Rodríguez-Gonzálvez, P.; Hernández-López, D. Image-based thermographic modeling for assessing energy efficiency of buildings façades. Energy Build. 2013, 65, 29–36. [Google Scholar] [CrossRef]
- Pili, S.; Desogus, G.; Melis, D. A GIS tool for the calculation of solar irradiation on buildings at the urban scale, based on Italian standards. Energy Build. 2018, 158, 629–646. [Google Scholar] [CrossRef]
- Benz, A.; Taraben, J.; Debus, P.; Habte, B.; Oppermann, L.; Hallermann, N.; Morgenthal, G. Framework for a UAS-based assessment of energy performance of buildings. Energy Build. 2021, 250, 111266. [Google Scholar] [CrossRef]
- Kardoš, M.; Sačkov, I.; Tomaštík, J.; Basista, I.; Borowski, Ł.; Ferenčík, M. Elevation Accuracy of Forest Road Maps Derived from Aerial Imaging, Airborne Laser Scanning and Mobile Laser Scanning Data. Forests 2024, 15, 840. [Google Scholar] [CrossRef]
- Kinnen, T.; Blut, C.; Effkemann, C.; Blankenbach, J. Thermal reality capturing with the Microsoft HoloLens 2 for energy system analysis. Energy Build. 2023, 288, 113020. [Google Scholar] [CrossRef]
- Yurtseven, H. Comparison of GNSS-, TLS-and Different Altitude UAV-Generated Datasets on the Basis of Spatial Differences. ISPRS Int. J. Geo-Inf. 2019, 8, 175. [Google Scholar] [CrossRef]


| Façade | Scanned Object | Average Value [°C] | Standard Deviation [°C] |
|---|---|---|---|
| North | Walls | 8.5 | 0.79 |
| Windows (closed) | - | - | |
| Windows (open) | - | - | |
| Foundation | 9.20 | 0.26 | |
| East | Walls | 9.67 | 0.42 |
| Windows (closed) | 12.43 | 0.67 | |
| Windows (open) | 21.27 | 1.10 | |
| Foundation | 11.27 | 0.45 |
| Façade | Scanned Object | Average Value [°C] | Standard Deviation [°C] |
|---|---|---|---|
| South | Walls | 4.57 | 0.31 |
| Windows (closed) | 7.70 | 0.28 | |
| Windows (open) | 18.80 | - | |
| Foundation | 8.95 | 0.07 | |
| Access door | 11.30 | 1.27 | |
| Technical room access | 10.00 | - | |
| Technical room window | 21.10 | - | |
| East | Walls | 3.13 | 0.25 |
| Windows (closed) | 4.67 | 0.49 | |
| Windows (open) | 15.57 | 1.60 | |
| Foundation | 6.20 | - |
| Façade | Scanned Object | Average Value [°C] | Standard Deviation [°C] |
|---|---|---|---|
| North | Walls | 7.83 | 0.29 |
| Windows (closed) | 10.47 | 0.65 | |
| Windows (open) | 22.87 | 1.77 | |
| Foundation | 9.37 | 0.15 | |
| West | Walls | 5.77 | 0.57 |
| Windows (closed) | 9.27 | 0.12 | |
| Inter-storey slab | 7.30 | 0.82 | |
| Foundation | 7.93 | 0.25 |
| Façade | Scanned Object | Average Value [°C] | Standard Deviation [°C] |
|---|---|---|---|
| North | Walls | 8.30 | 0.40 |
| Windows (closed) | 9.35 | 0.07 | |
| Windows (open) | 20.10 | - | |
| Foundation | 9.30 | 0.30 | |
| East | Walls | 8.10 | 0.70 |
| Windows (closed) | 10.63 | 0.78 | |
| Windows (open) | 19.83 | 0.59 | |
| Foundation | 9.63 | 0.12 |
Disclaimer/Publisher’s Note: The statements, opinions and data contained in all publications are solely those of the individual author(s) and contributor(s) and not of MDPI and/or the editor(s). MDPI and/or the editor(s) disclaim responsibility for any injury to people or property resulting from any ideas, methods, instructions or products referred to in the content. |
© 2025 by the authors. Licensee MDPI, Basel, Switzerland. This article is an open access article distributed under the terms and conditions of the Creative Commons Attribution (CC BY) license (https://creativecommons.org/licenses/by/4.0/).
Share and Cite
Herban, S.; Crișan, A.; Pescari, S.; Alionescu, A.; Zdrenghea, P.; Vîlceanu, C.-B.; Ungureanu, V.; Costantino, D.; Pepe, M.; Alfio, V.S. Practices of BIM-Enabled Assessment of Politehnica University Timisoara Building Stock for a More Sustainable Future. Appl. Sci. 2025, 15, 4660. https://doi.org/10.3390/app15094660
Herban S, Crișan A, Pescari S, Alionescu A, Zdrenghea P, Vîlceanu C-B, Ungureanu V, Costantino D, Pepe M, Alfio VS. Practices of BIM-Enabled Assessment of Politehnica University Timisoara Building Stock for a More Sustainable Future. Applied Sciences. 2025; 15(9):4660. https://doi.org/10.3390/app15094660
Chicago/Turabian StyleHerban, Sorin, Andrei Crișan, Simon Pescari, Adrian Alionescu, Paul Zdrenghea, Clara-Beatrice Vîlceanu, Viorel Ungureanu, Domenica Costantino, Massimiliano Pepe, and Vincenzo S. Alfio. 2025. "Practices of BIM-Enabled Assessment of Politehnica University Timisoara Building Stock for a More Sustainable Future" Applied Sciences 15, no. 9: 4660. https://doi.org/10.3390/app15094660
APA StyleHerban, S., Crișan, A., Pescari, S., Alionescu, A., Zdrenghea, P., Vîlceanu, C.-B., Ungureanu, V., Costantino, D., Pepe, M., & Alfio, V. S. (2025). Practices of BIM-Enabled Assessment of Politehnica University Timisoara Building Stock for a More Sustainable Future. Applied Sciences, 15(9), 4660. https://doi.org/10.3390/app15094660