Abstract
In this paper, an accurate error compensation method based on geometric parameter correction and process optimization is proposed for the problem of coupling error in a heavy-load longitudinal and transversal swing table (HLTST) under space constraints, which makes it difficult to control the position efficiently and accurately. The key geometric parameters of pitch and roll layers are determined according to the machining process and assembly relationship, and the kinematic model is modified to effectively reduce the impact of contour error on the system’s accuracy. A coupling error model is established and its transmission mechanism is analyzed to develop a positioning error compensation strategy. Numerical simulation is employed to examine the distribution law, sensitivity, and volatility of independent error and coupling error. This aids in optimizing the design of the table’s machining process by balancing machining accuracy and economy. After the identification of the error parameters, the error compensation model is verified using the uniform design experimentation. The experimental results demonstrate 96.94% and 65.63% reductions in absolute average errors for the pitch and roll angles, respectively, especially when the maximum positioning error under the maximum load condition is controlled within ±5%, which significantly enhances motion accuracy and robustness under complex working conditions. This provides theoretical support and practical guidance for real-world engineering applications.
1. Introduction
A heavy-load longitudinal and transversal swing table (HLTST) is a crucial mechanism for carrying large components and adjusting their position, especially compact and small-sized tables, which are commonly used in aerospace and military applications, automated production, marine operations, intelligent manufacturing, and other important areas [1,2], such as spacecraft assembly [3,4,5], precision CNC machining [6], wave compensation [7], large-scale 3D printing, and other heavy-duty precision control application scenarios. In important military security links such as aircraft bomb loading and missile assembly, the precision and efficiency of the table’s attitude adjustment has an important impact on the aircraft re-deployment preparation time [8] and the quality of strategic and tactical equipment production [9]. Consequently, enhancing the positioning accuracy and reducing the adjustment time are key strategies for improving the operational performance of heavy-duty precision positioning equipment.
Defects in machining and the assembly of parts, coupled with the presence of transmission clearance—an original positioning deviation—make it challenging for various axes of motion in a table to achieve an ideal geometric state. These cumulative errors are collectively referred to as the system’s geometric errors [10,11]. In the process of multi-axis combined motion of the table, geometric errors will generate coupling relations and crosstalk with each other through the motion chain while gradually accumulating to the end of the system [12,13,14], which will have a serious impact on the positioning accuracy and efficiency of the table, so how to accurately model and compensate for the geometric errors is an urgent problem that needs to be solved.
In addressing the aforementioned challenges, numerous studies have been undertaken by researchers. Tang et al. [15] took the six-axis motion platform in a laser welding system as the research object. Based on the stream of variation theory, they established an error transfer model. The experimental results show that this method can intuitively reflect the process of error propagation and accumulation. It can effectively improve the accuracy and alignment efficiency of the optical device and help understand the trend of power loss in the laser welding process. Zheng et al. [16] established a geometric and kinematic error model for the six-axis motorized fiber alignment stage based on the multi-body system error theory and developed an error compensation strategy according to the error sensitivity analysis, which significantly improved the fiber alignment accuracy and efficiency of the automatic alignment system for optical waveguide devices. Song et al. [17] employed crew theory and the exponential product formula to create a geometric error model for the rotational axes of a five-axis motion platform. The experimental results showed that this method reduced the platform’s pose error by 28.1%. Yu et al. [18] established a coupling error model of the contact probe of a three-dimensional screw-thread-measuring machine based on mechanical and geometrical analysis methods. The experimental results showed that when the measuring device moved by 10 μm, the probe’s displacement deviation increased by 2 μm, and the calculated deflection angle was consistent with the theoretical value. This model offers a foundational framework for probe error decoupling and enhances the accuracy of the probe-guiding mechanism. Zhang et al. [19] addressed the significant issue of geometric error coupling in five-axis machine tools and proposed an Optimal Proportional Compensation Method considering multiple-direction coupling effects, which increased the compensation accuracy by 58.9% and reduced the number of compensation terms by 44.4%. He and Shi [20] addressed the issue of freeform surface contour errors’ sensitivity to geometric errors in ultra-precision machine tools and proposed a mathematical mapping model of geometric errors and contour errors and an error compensation method based on sensitivity parameters. Experiments indicated that this method could reduce freeform surface contour errors by approximately 30.85%. Luo et al. [21] introduced an accurate error compensation method for multi-axis parallel machines based on Jacobi geometric parameter correction and coupling error evaluation, reducing the position and posture errors of the parallel mechanism by 64.93% and 55.29%, respectively, and significantly improving motion accuracy. Shen et al. [22] proposed an error compensation method using a radial basis function neural network optimized by the whale optimization algorithm, enhancing the average pose accuracy of parallel mechanisms by 85.07% and thereby validating the effectiveness of intelligent algorithms in error compensation for complex systems. Nguyen et al. [23] proposed a unified geometric error model for three-axis machine tools, reducing the geometric errors of machine tools by over 85% and significantly simplifying the complexity of machine tool error compensation. Liu et al. [24] proposed a mechanism–data hybrid approach for dual-drive machine tools, establishing a comprehensive error model based on multi-body system dynamics and optimizing geometric errors through sensitivity-guided grey wolf optimization, which reduced tool center positioning errors by 41% and axis non-synchronization errors by 35%. Zhang et al. [25] proposed a deep learning-based approach for comprehensive pose error prediction in parallel robots, integrating an encoder–decoder network framework with multi-layer convolutional sparse coding (CSC) and efficient channel attention (ECA) modules. The method leverages Monte Carlo dropout to estimate prediction uncertainties, addressing both geometric and non-geometric error components. Experimental validation on a Stewart platform demonstrated high accuracy and robustness under various loading conditions, with superior performance compared to typical models. The results highlight the method’s potential to enhance operational precision and reliability in high-precision applications.
In summary, significant advancements have been made in the field of error modelling and compensation for complex mechanical systems. However, there is a paucity of studies focusing on error compensation methods for heavy-load precision assembly equipment in enclosed or semi-enclosed and confined spaces. HLTSTs are rated for a minimum load of 2.5 t, with a maximum reach of less than 500 mm × 500 mm × 200 mm. This often makes it challenging to reasonably layout the position detection sensor, thereby making it difficult to directly measure the coupling error generated by the multi-axis motion. As a result, full closed-loop control cannot be achieved, and the focus of the research shifts to how to compensate for coupling error under these restricted conditions. Furthermore, the existing error compensation methods do not trace the geometric errors from the perspective of machining, assembly, and other intrinsic mechanisms, resulting in the inability to provide guidance for the design and machining of parts at the source.
To address the issues outlined above, this study introduces a precise error compensation technique that encompasses both geometric parameter correction and process optimization. By correcting the key geometric parameters of the inverse kinematics model of the table’s pitch and roll layers, the effect of contour errors on the table’s pose is reduced. The coupling error model of rotary axes is established, and the decoupling compensation strategy for the table’s position error is proposed. The main characteristics of independent and coupling errors are analyzed through numerical simulation to optimize the tolerance design of key parts. The accuracy of the error model and the feasibility of the compensation strategy are verified by error compensation experiments.
2. Theory and Method
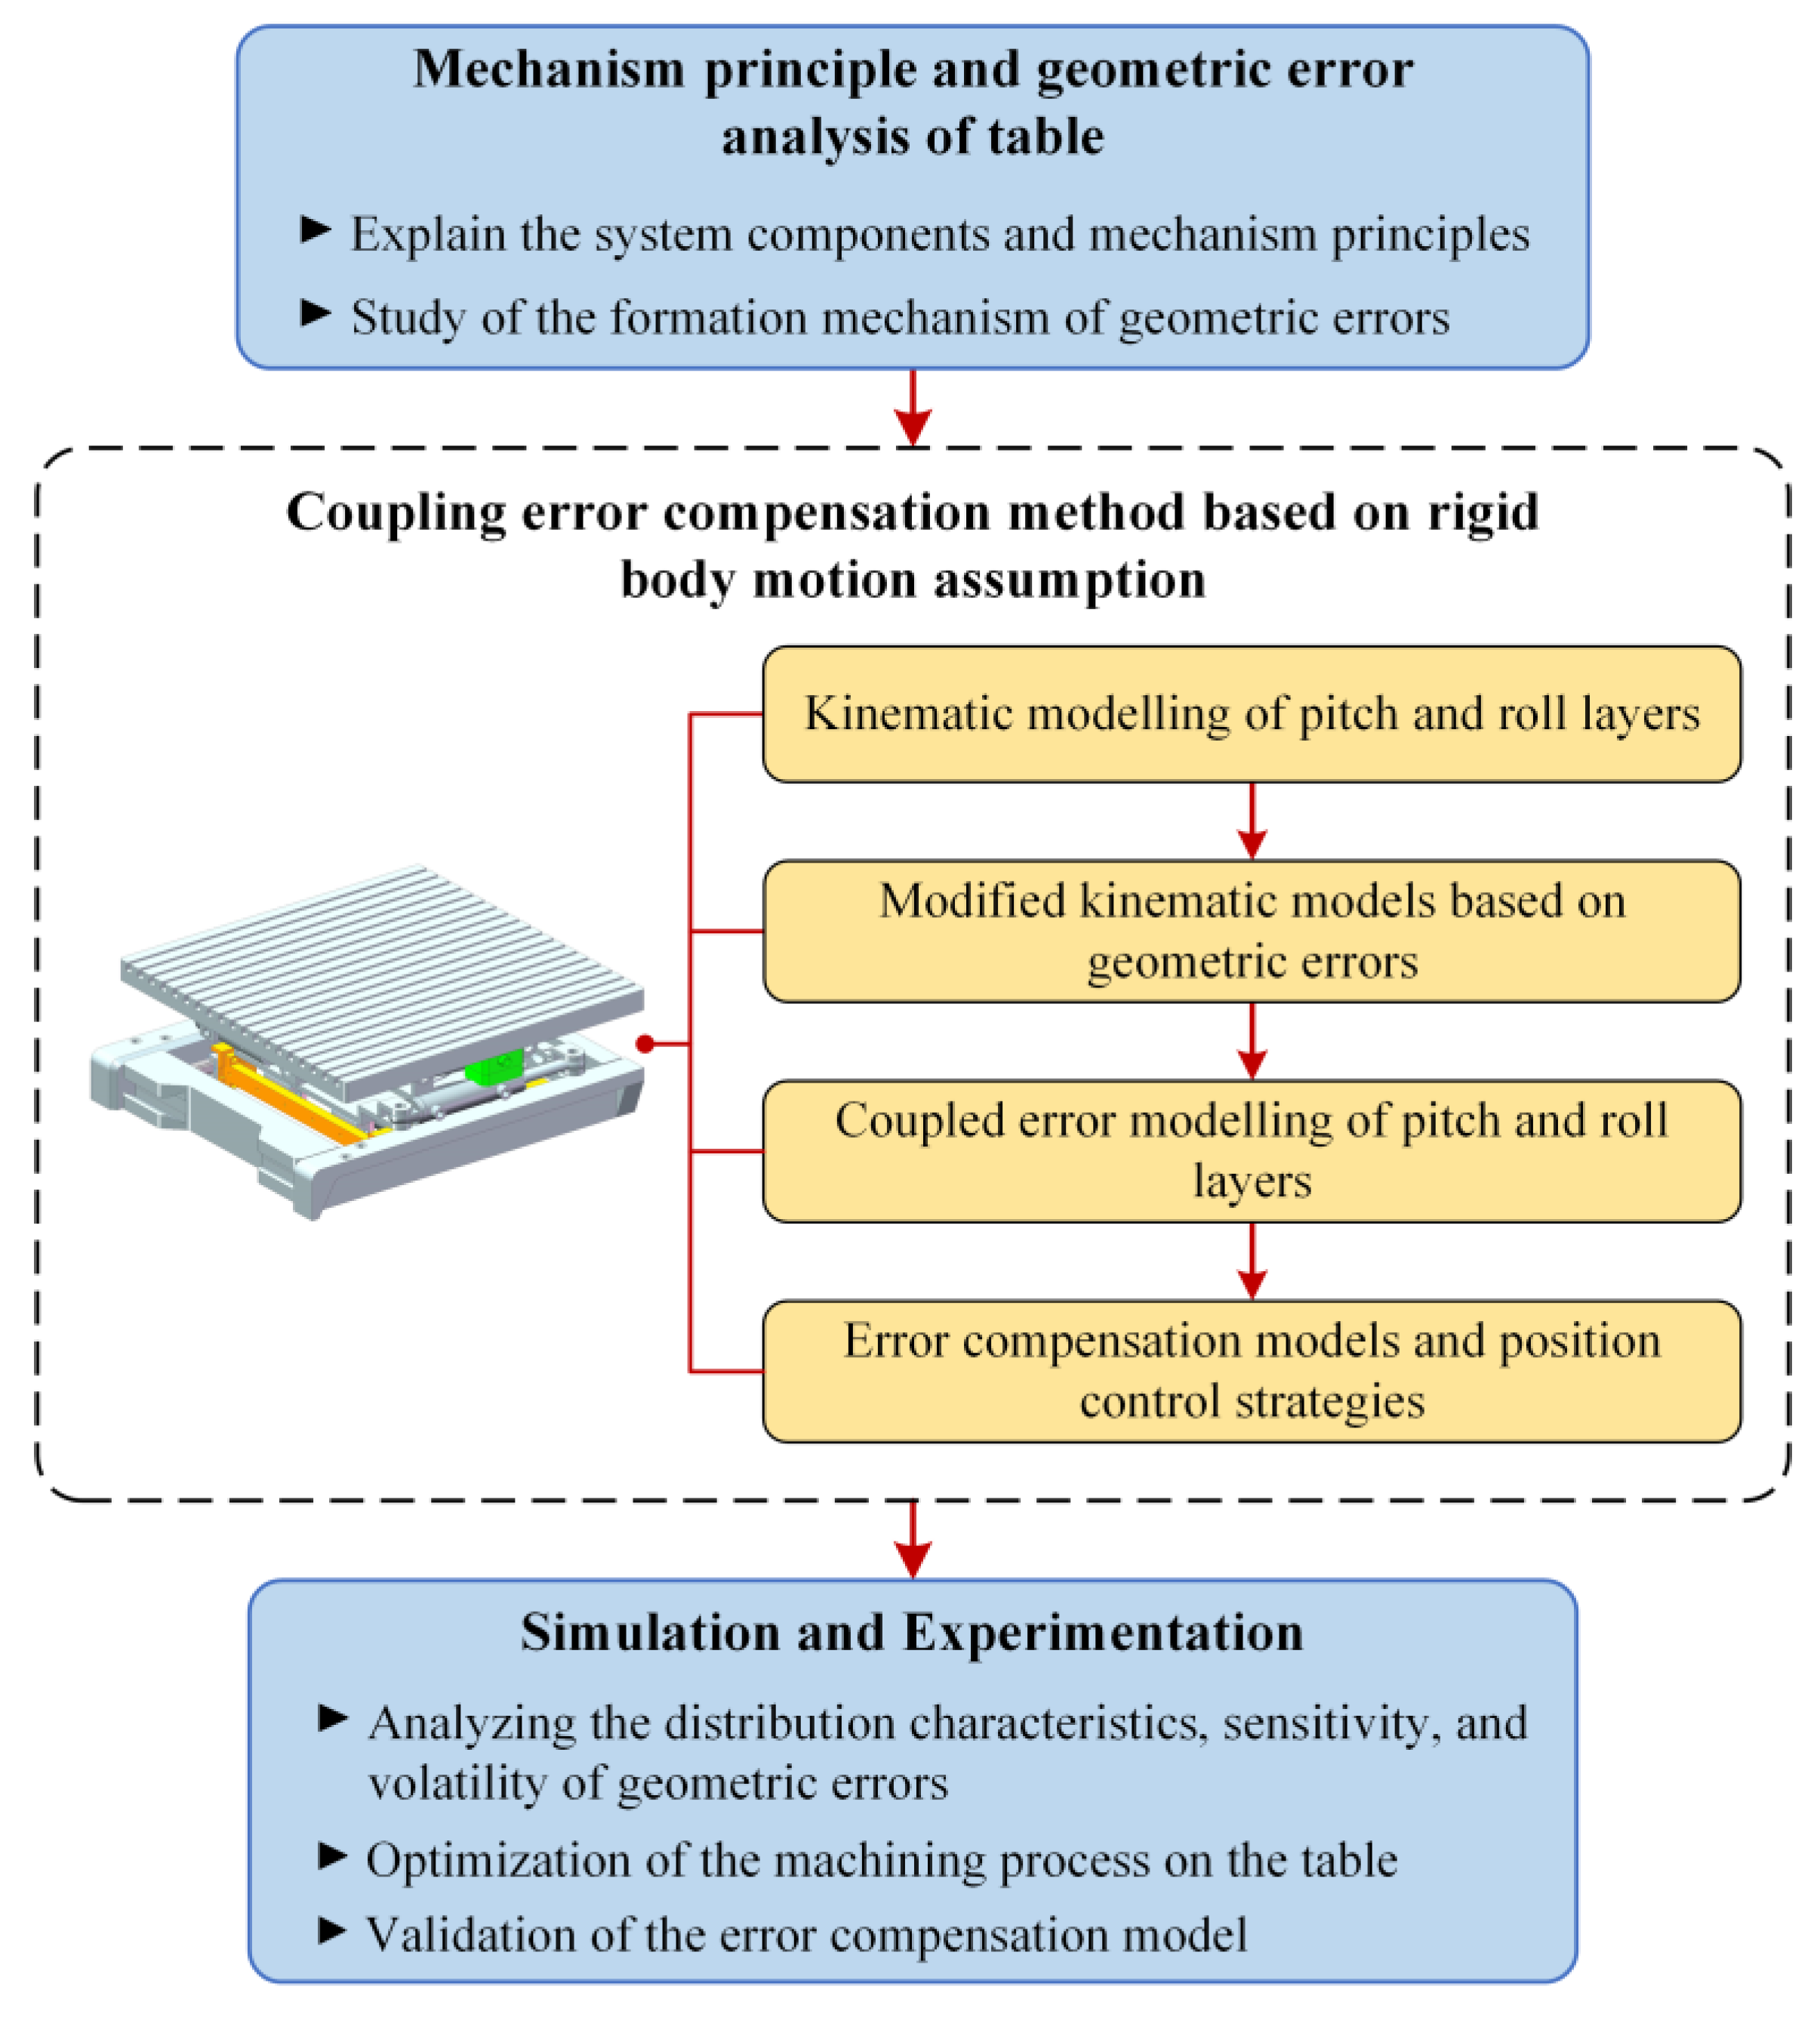
The system framework of the coupling error compensation method is illustrated in Figure 1. This study first introduces the structural configuration and operational principle of the motion platform, followed by an analysis of the geometric error generation mechanism in the pitch and roll layers that significantly influence the table’s positioning. Subsequently, coupling error modelling and compensation are implemented through the following methodology: initially establishing the kinematic model of pitch and roll layers then calibrating critical parameters in the kinematic model considering geometric errors. A coupling error model is developed based on rigid body motion assumptions, ultimately yielding the platform’s error compensation model and position control strategy. The distribution characteristics, sensitivity indices, and variation patterns of geometric errors in the pitch and roll layers are systematically investigated through numerical simulations and compensation experiments. The experimental results validate the proposed coupling error compensation approach.
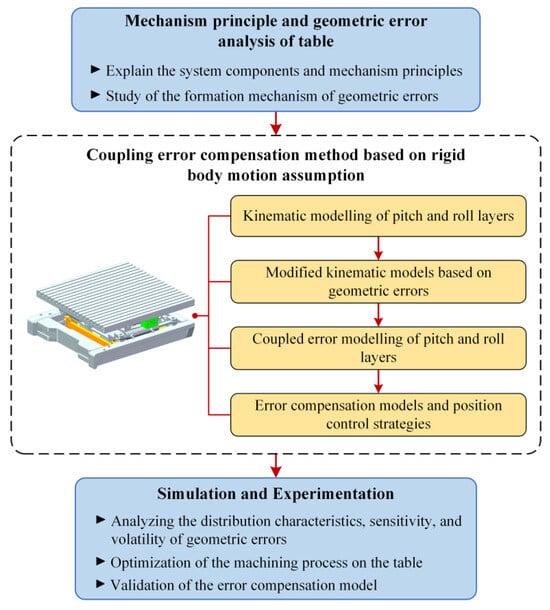
Figure 1.
Framework of coupling error compensation method.
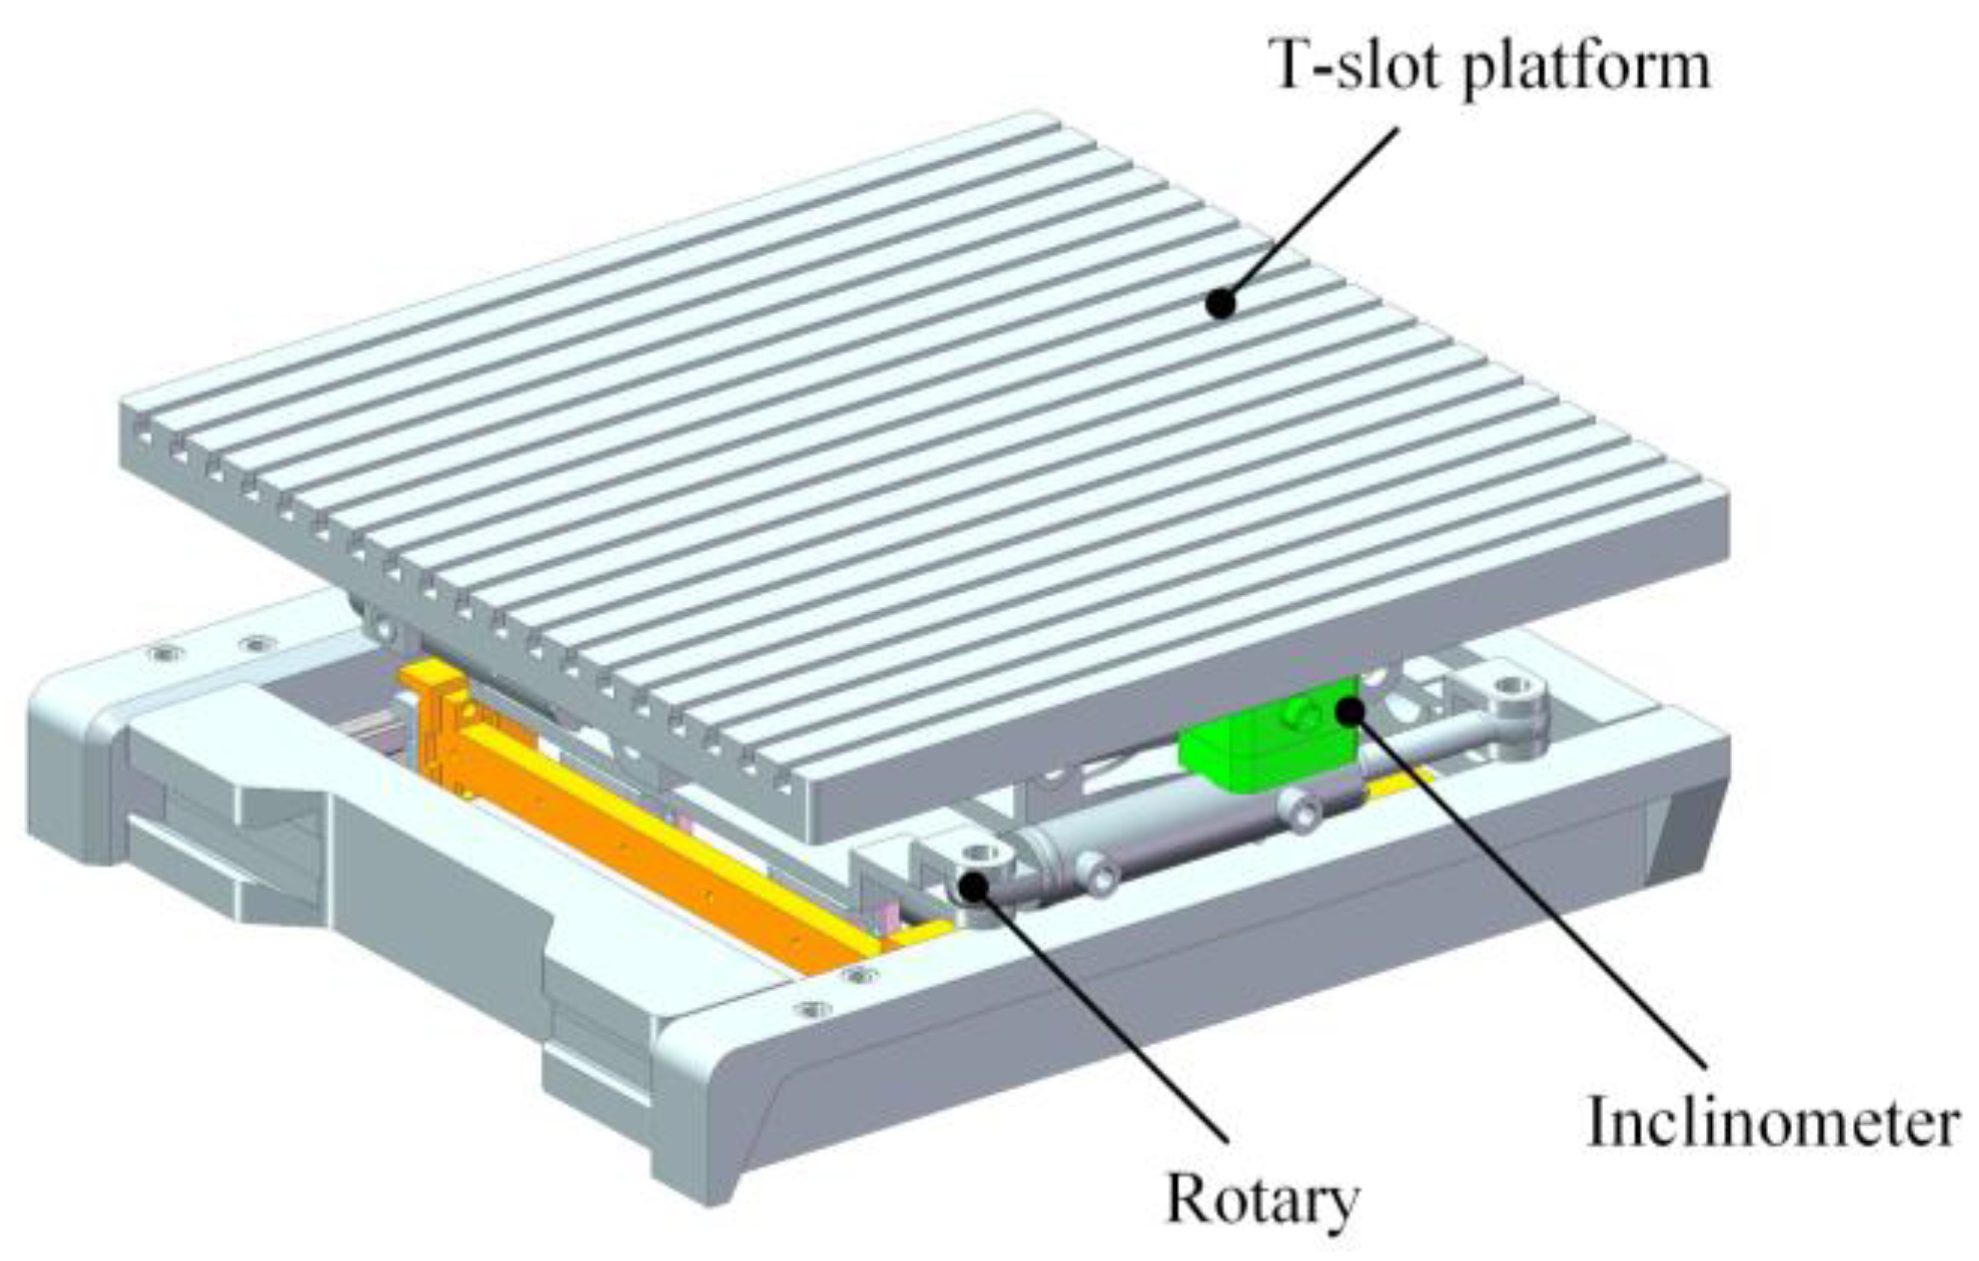
As shown in Figure 2, the table’s motion system is hydraulically driven to achieve a higher load capacity within a smaller volume. The motion axes, based on the assembly sequence, are categorized into the 1—longitudinal, 2—transverse, 3—rotary, 4—pitch, and 5—roll layers, each of which is rigidly connected and operates independently. The longitudinal and traversing layers are linear motion mechanisms consisting of hydraulic cylinders and guide rails. The rotary motion of the table is accomplished by the expansion and contraction of the hydraulic cylinders on both sides of the rotary level in opposite directions. The pitch and roll layers are both bilateral circular groove pulley mechanisms. The hydraulic cylinders on both sides of the mechanism will synchronously expand and contract to make the pulleys slide in the circular arc groove to achieve the rotation of the table. Inclination sensors are mounted on the table’s flange to monitor changes in its attitude, while the hydraulic cylinders are fitted with internal displacement sensors to detect the actual stroke.

Figure 2.
Composition of HLTST.
The pose of the table is influenced by a multitude of error factors, which can be categorically grouped into four primary sources: geometric errors, control errors, force errors [26], and thermal errors [27]. Geometric errors are mainly caused by the machining, assembly, and fatigue wear of the parts, which are the principal factors that impact the motion accuracy of intricate mechanical systems [28].
Figure 3 illustrates the internal architecture of the HLTST. The traverse layer and longitudinal layer both use precision guideways with high geometric and guiding accuracy, which have less influence on the table’s pose. The rotary layer is assembled with high-precision shaft holes, which also have a low impact on the table’s position. However, the pitch and roll layers, constructed with bilateral circular groove pulley mechanisms, present challenges due to their complex processing and assembly requirements. These result in significant geometric errors. Furthermore, the coupling nature of these structures means that movements in the pitch and roll layers can lead to cumulative coupling errors. In summary, this paper delves into the modelling and compensating of geometric errors in the pitch and roll layers, which influence the table’s pose.
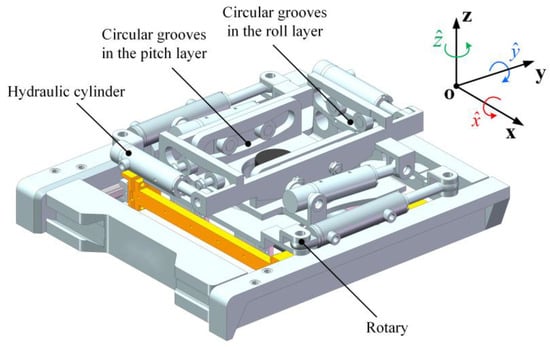
Figure 3.
Mechanism of HLTST.
2.1. Kinematics Modelling
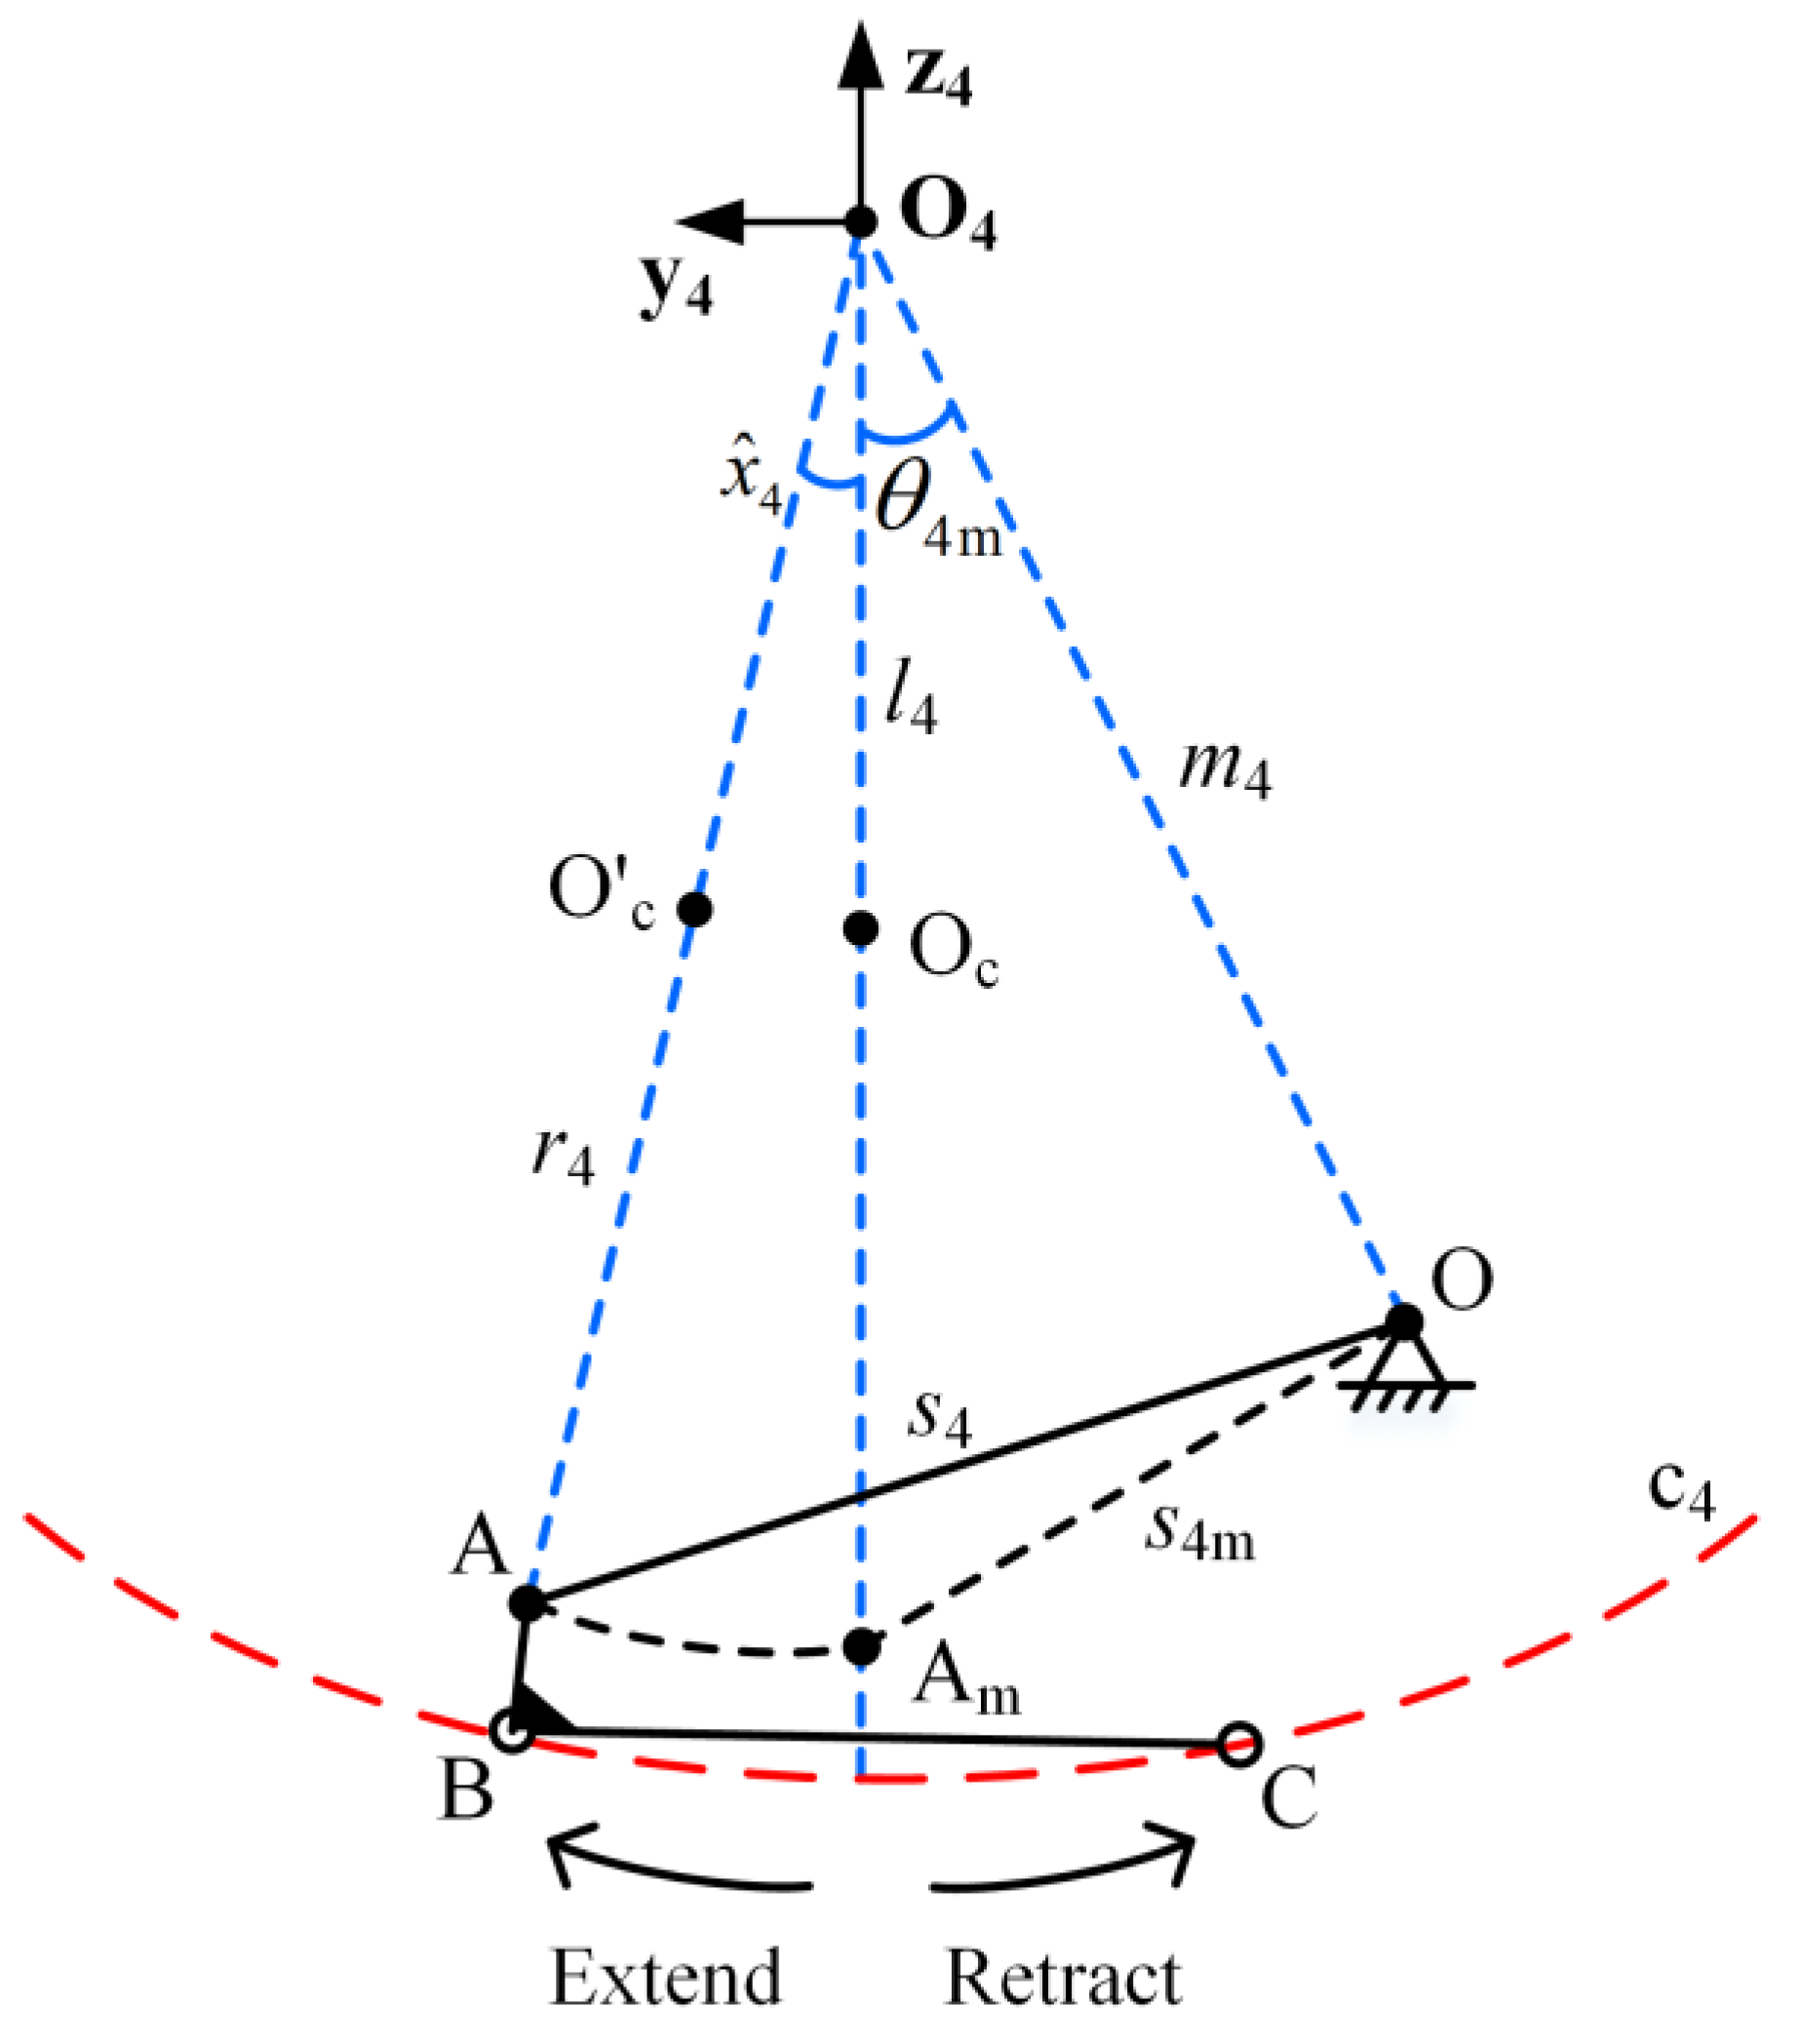
The schematic diagram of the pitching mechanism is shown in Figure 4. One end of the hydraulic cylinder is hinged at point O, and its piston rod and pulley module are hinged at point A; s4 represents the stroke of the hydraulic cylinder; O4 is the center of the circular slot; and r4 is the radius of rotation of the circular slot. Adjustment of the table’s pitch angle is achieved by controlling the movement of pulleys B and C in the circular arc groove c4. The T-slot platform’s center point, Oc, is situated on the line O4, A, at a distance l4 from O4; θ4 indicates the starting angle of the pitching mechanism; the hydraulic cylinder stroke in the starting state is s4m; and the pitch angle is 0 rad. When the stroke of the hydraulic cylinder is s4, the table rotates around the x4-axis of the coordinate system in which O4 is located, Oc moves to Oc’, and the angle between O4Oc’ and O4Oc is the pitch angle of the table.
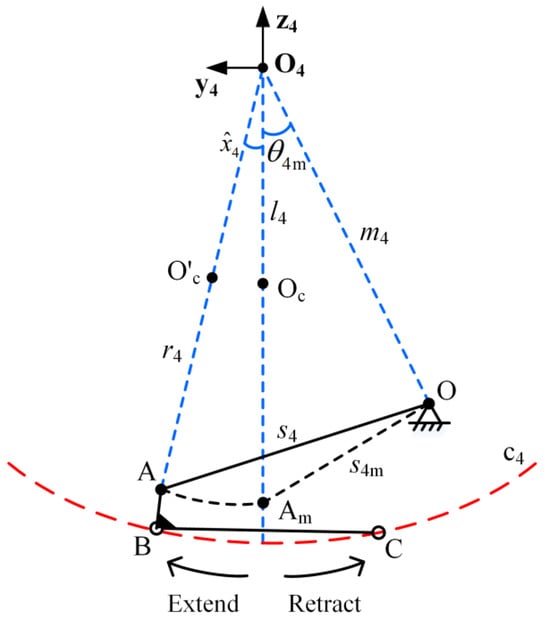
Figure 4.
Mechanism principle of pitch layer.
By analyzing the geometrical relations of the moving mechanism, a positive kinematic model of the pitch layer can be obtained as
where is the starting angle of the pitch mechanism. Since the roll layer has the same kinematic mechanism as the pitch layer, the positive kinematic model for the roll layer can be obtained as
where is the starting angle of the roll mechanism.
2.2. Correction of Geometric Parameters for Kinematic Models
In order to facilitate the adjustment of the attitude, the pitch and roll mechanism of the pulley and the arc groove of the clearance fit the main mating surface for the pulley column surface and the arc groove of the lower arc surface. Notably, pulleys are comparatively easier to machine, resulting in higher geometric accuracy. However, the circular groove, being a curved surface profile, necessitates high precision and proves challenging to machine, thus leading to potential geometric errors [29].
In industrial manufacturing, the term “profile of a surface” is often employed as a geometric tolerance to measure the accuracy of freeform surfaces. This indicates the variation between the actual and ideal profiles. For a surface profile with a design datum, its tolerance zone is the area between a series of spherical envelopes with a diameter of tolerance value ζ, whose centers are located on the theoretical correct geometric shape of the measured feature determined by the datum. This can comprehensively control the size, shape, orientation, and position of the measured feature [30]. Therefore, using a surface profile with a design datum to measure the radial allowable offset of the actual arc surface of a circular arc groove relative to the ideal arc surface, the actual offset δ is defined as the contour error. For the internal arc surface that meets the surface profile tolerance requirements, there exists the relationship ζ ≥ 2δ.
Considering the effect of the contour error δ, the positive kinematic model of the pitch layer can be modified as
where r4′ denotes the actual radius of rotation of the tilting mechanism, δ4 denotes the face profile error of the circular groove, and the mathematical relation between them is r4′ = r4 + δ4. Similarly, the positive kinematics model of the table’s roll layer can be modified as
Since the motions between the pitch and roll layers are independent of each other, their inverse kinematic correction models can be expressed separately as
2.3. Modelling of Coupling Errors
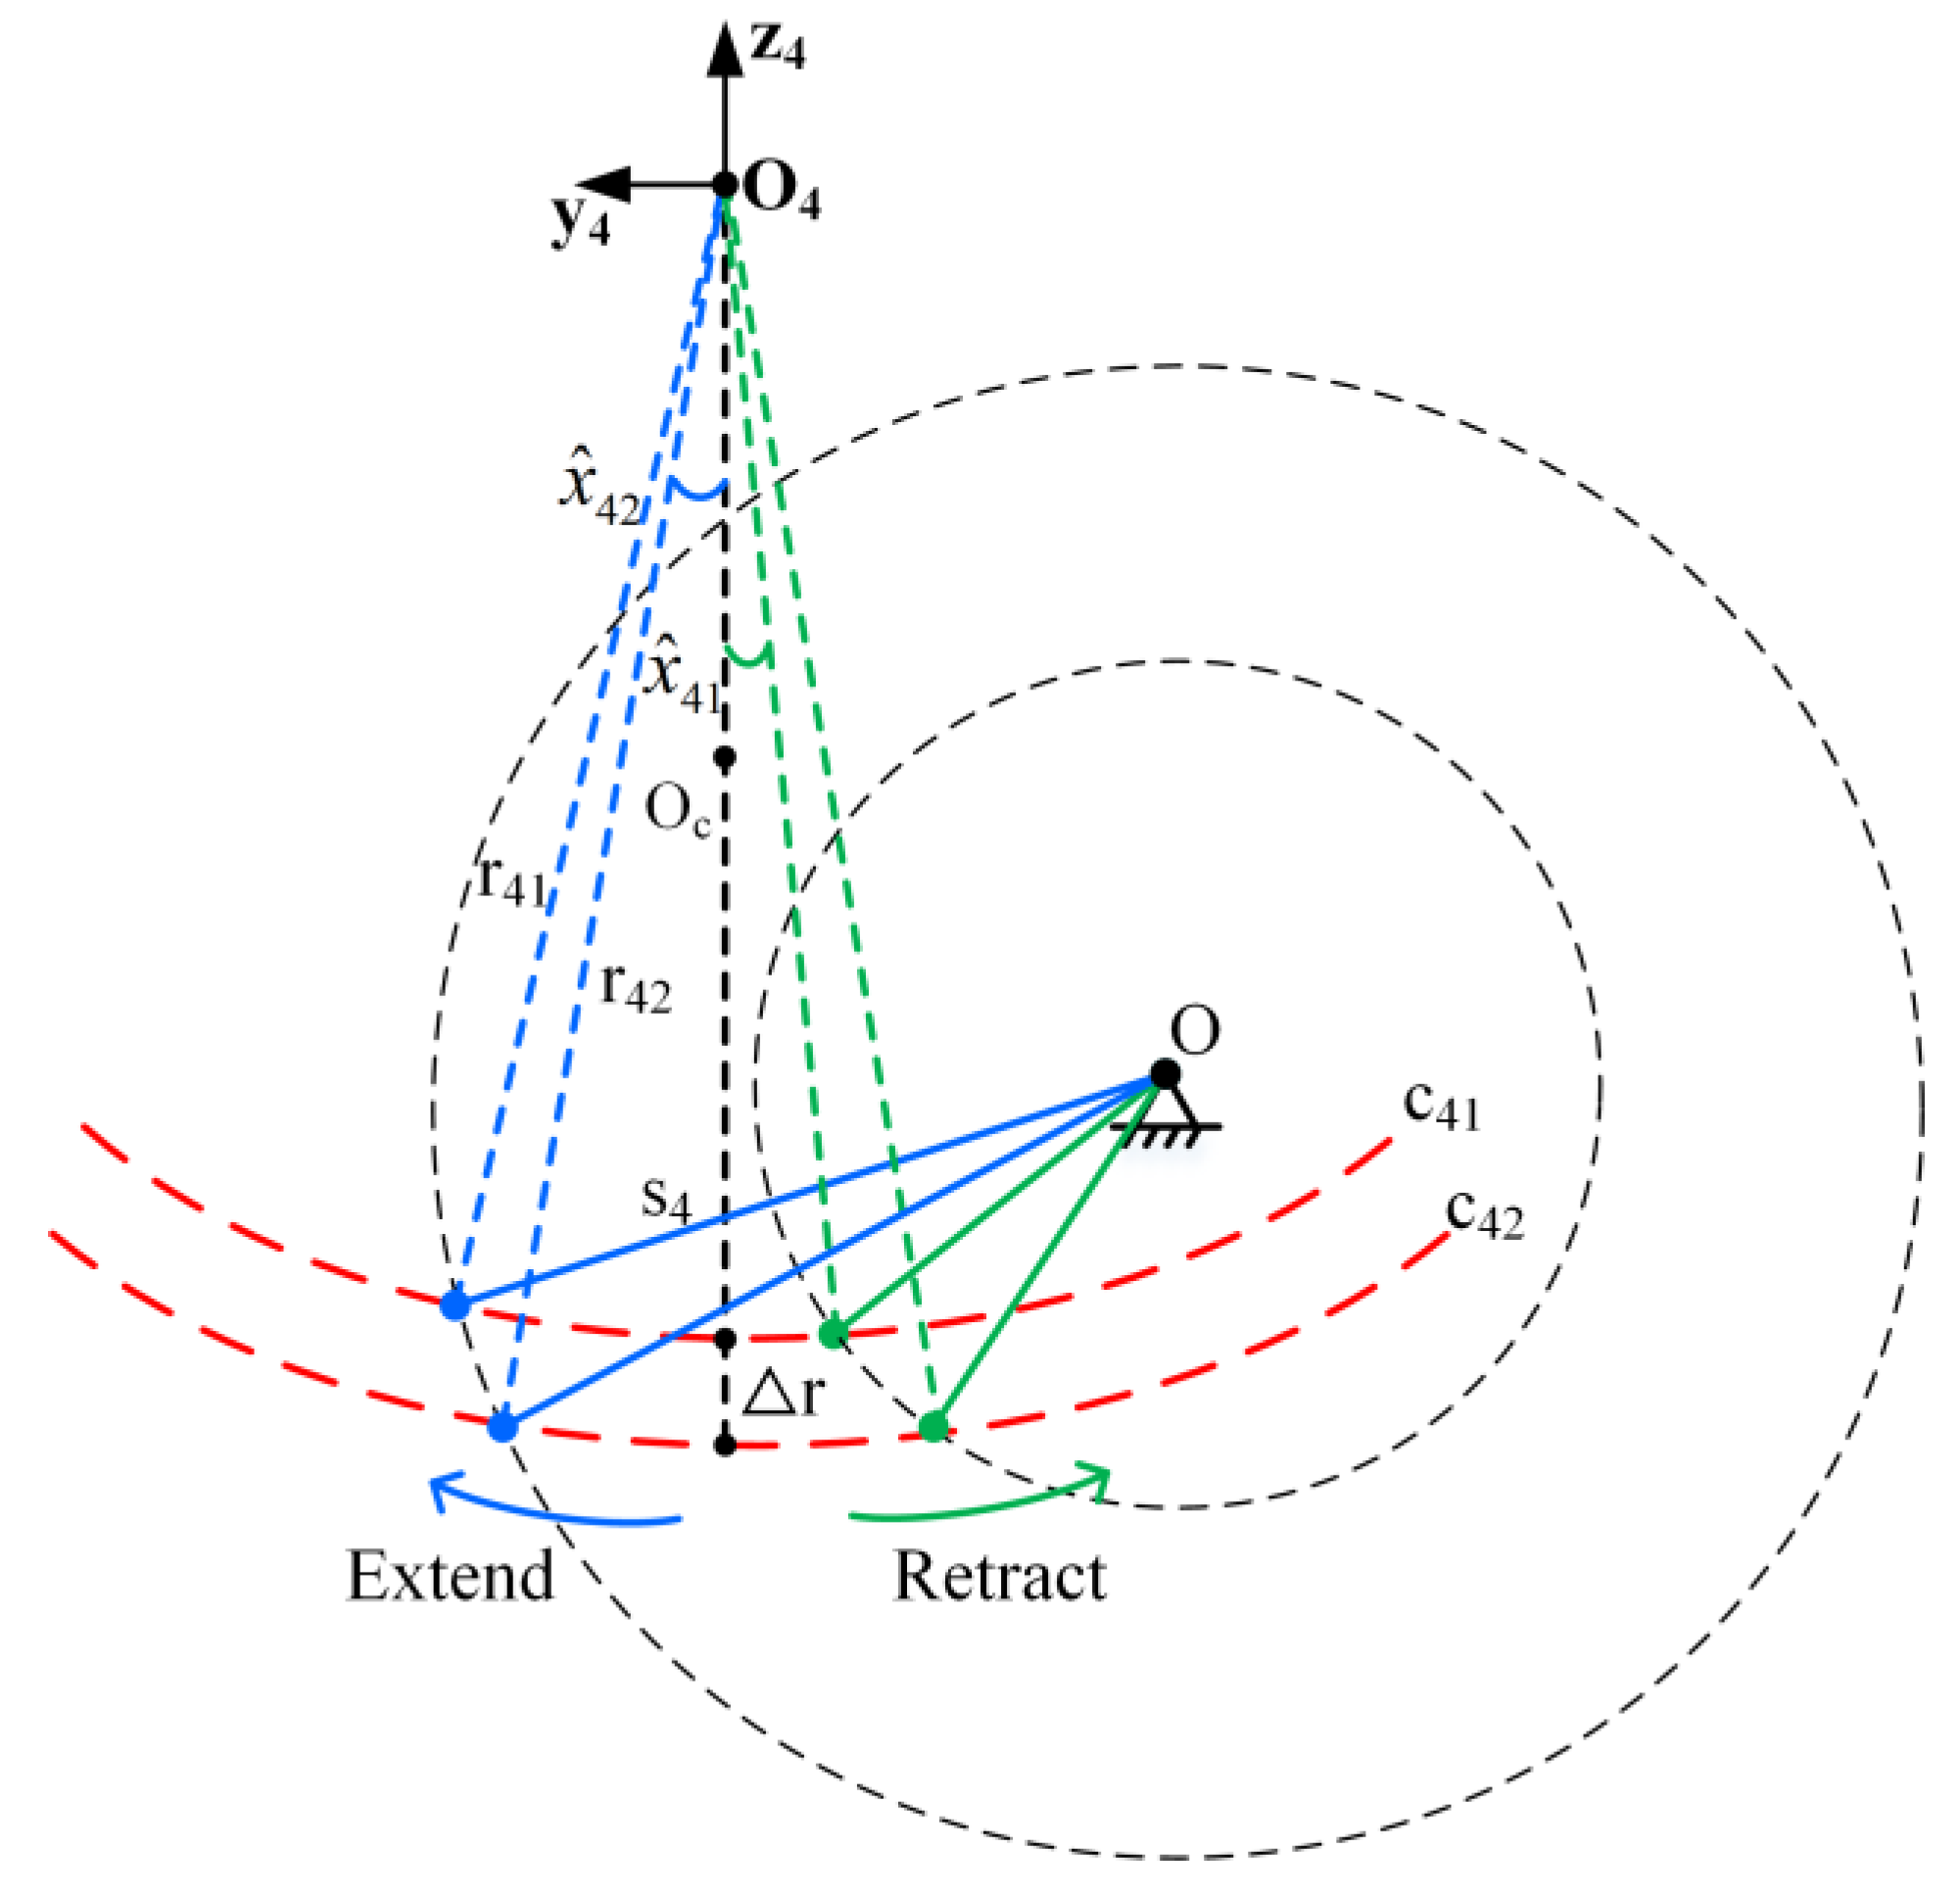
Consider the pitch level as a case in point. When the stroke of the hydraulic cylinders on both sides is s4, if the contour errors on both sides of the mechanism are not equal, it will make the pitch angles on both sides different. The pitch angle of the table is determined by the side of the pitch mechanism that has a lagging motion, and because the table is viewed as a rigid tandem system, the pitch angle when the hydraulic rod is extended is determined by the side with the larger radius of the arcuate slot. Conversely, when the hydraulic rod is retracted, the pitch angle aligns with the side showing the smaller radius of the arcuate slot. The specific principle is illustrated in Figure 5.

Figure 5.
Influence of surface contour error on pitching mechanism on both sides.
Define the contour error of the inner arc surface of the motion mechanism on both sides of the pitch layer as δ41 and δ42, and the actual rotation radius on both sides as r41 and r42, and then the difference in contour error can be expressed as ∆r4 = δ42 − δ41. An approximation of r4’ is given by r4 + 0.5∆r4, with ∆r42 being approximately equal to 0. Ignoring the motion error of the hydraulic cylinder itself, the inverse kinematics model of the pitch and roll layers can be modified as
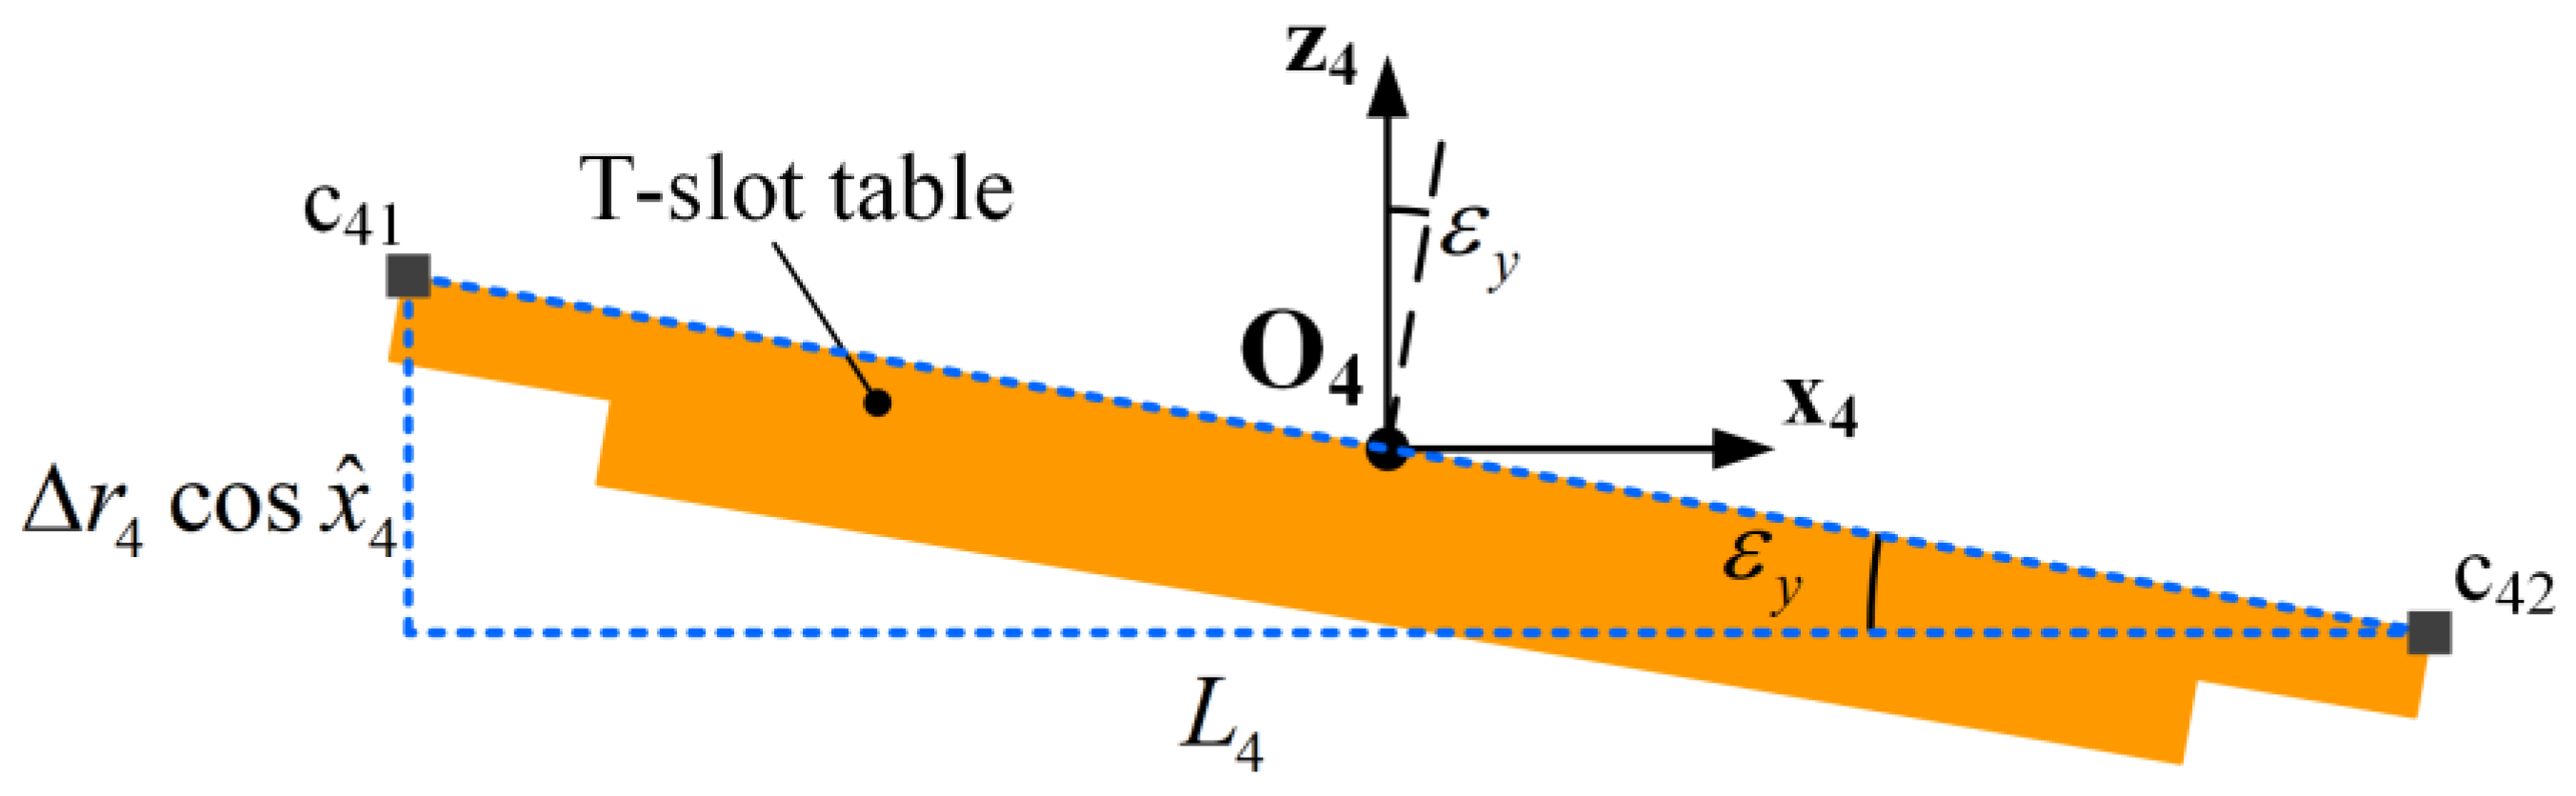
Furthermore, the process of pitching motion may induce a coupling error εy in the roll angle, attributable to the disparate contour errors on either side of the mechanism, as depicted in Figure 6. Based on the assumption that the table is a rigid body system, the coupling error of the tumbling angle is determined by the projection in the Z-direction. Consequently, the model for the coupling error of the tumbling angle can be articulated as
where L4 is the horizontal distance between the circular grooves on both sides of the pitch layer. Similarly, the tumbling motion of the table leads to a coupling error εx in the pitch angle, which can be expressed as
where L5 is the horizontal distance between the circular grooves on both sides of the roll layer.
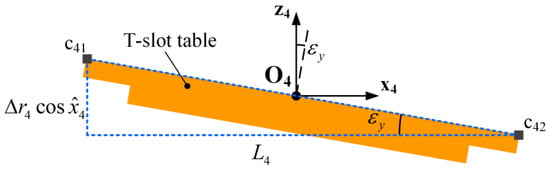
Figure 6.
Coupling errors from pitching motion.
2.4. Error Compensation Model
In order to quickly and accurately control the pose of the table, the control strategy of “first attitude, then position” is adopted. Firstly, the error compensation model is used to compensate for the attitude error of the table. Subsequently, any positional discrepancies resulting from this adjustment are addressed, targeting the desired position. The inverse kinematics model is then employed to determine the control volume for each hydraulic cylinder. This paper predominantly examines the error coupling relationship between pitch and roll angles and only investigates the error compensation methods for these two, with others being excluded from the discussion. The error compensation model for both pitch and roll layers can be represented as
where denotes the actual angle of motion, denotes the target angle, and denotes the coupling error. Combining Equations (5)–(11), the inverse kinematic model after error compensation can be obtained as
3. Results and Analysis
3.1. Kinematic Model Fitting
The design parameters of the pitch and roll layers of the heavy-load double swing table are shown in Table 1, and the positive kinematic models can be obtained by substituting the parameters as follows:

Table 1.
Mechanism parameters of pitch and roll layers.
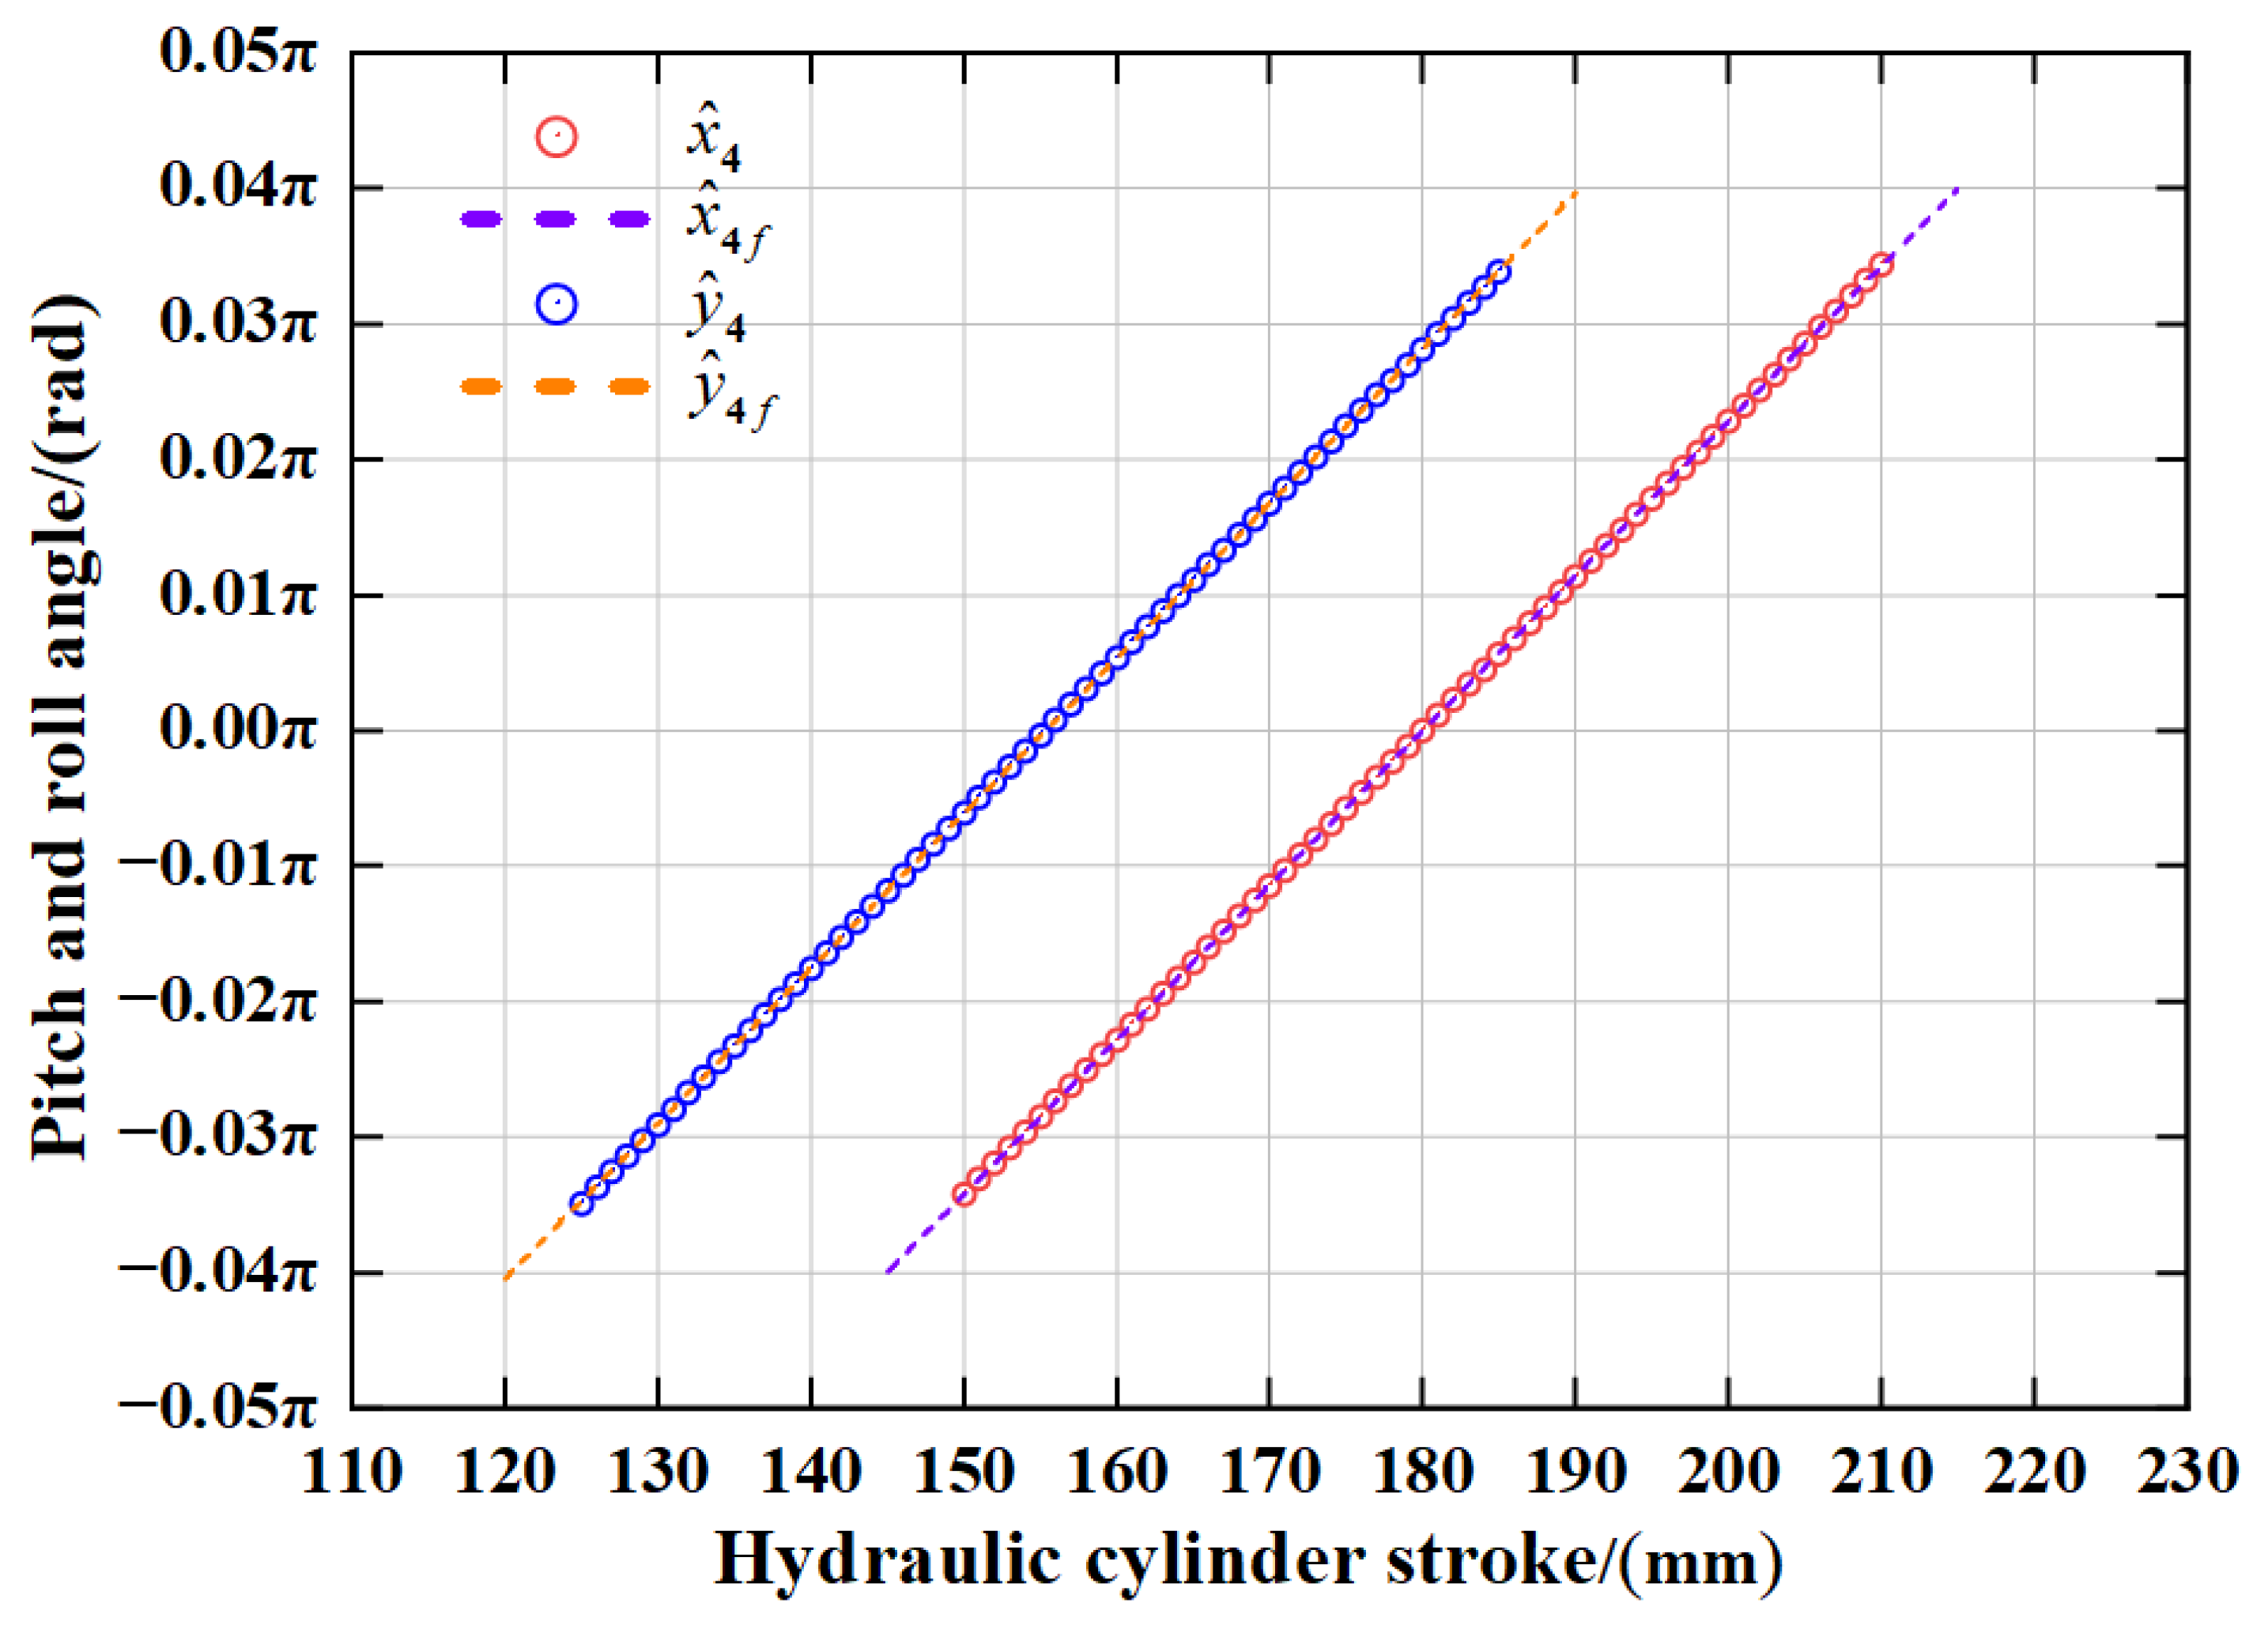
In order to facilitate the control of the table, a linear fit of Equations (14) and (15) was performed using the least squares method over the stroke range of the hydraulic cylinder, as shown in Figure 7, and the fitted positive kinematic model is:
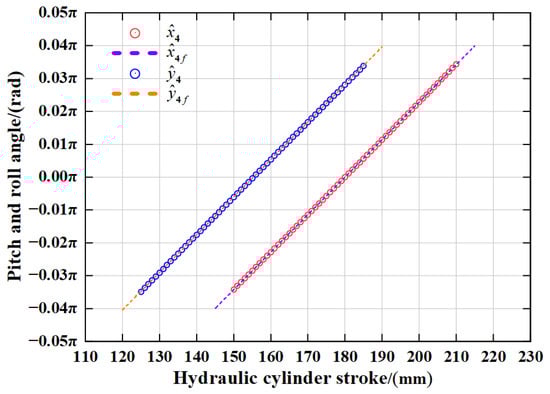
Figure 7.
Linear fitting of pitch layer and roll layer forward kinematics model.
The fitting coefficient of determination R2 ≈ 1. The maximum residual of the pitch angle is 0.03%, and the maximum residual of the roll angle is 0.48%, which indicates that the linear fitting is better and can satisfy the motion control accuracy requirements of the table.
Since the motions between the pitch and roll layers are independent of each other, the ideal inverse kinematics model for both can be derived from the fitted linear positive kinematics model as
According to the positive kinematic model of the mechanism, the independent errors of pitch and roll angles can be expressed as
3.2. Numerical Simulation and Process Optimization
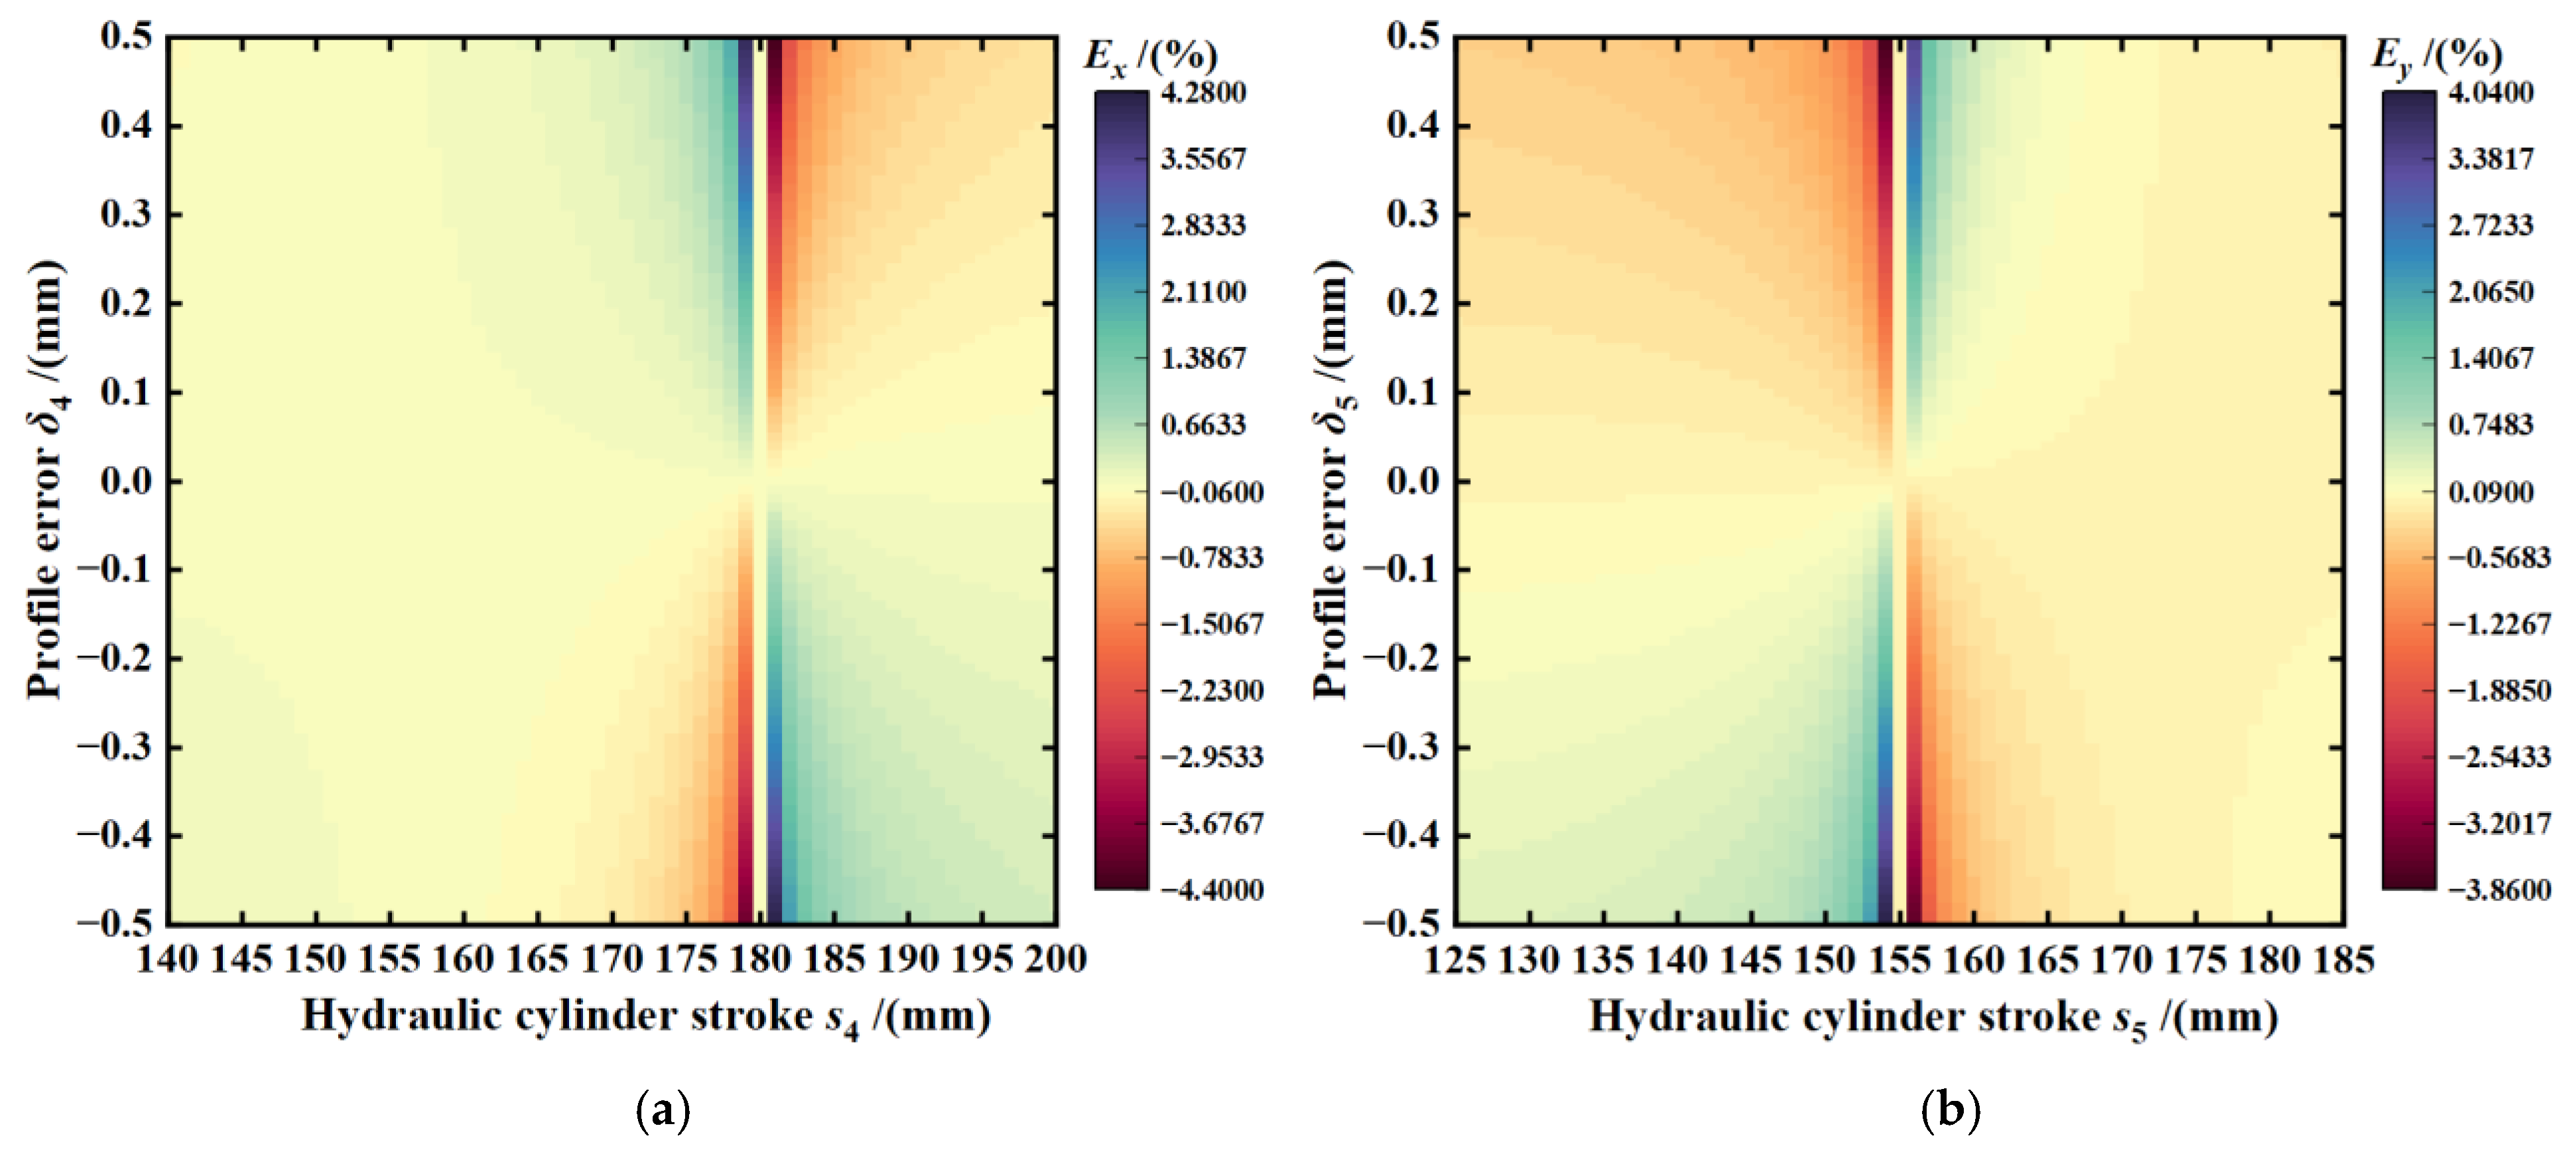
In order to analyze the distribution characteristics, sensitivity, and volatility of the geometric errors of the pitch and roll angles, numerical simulations of the independent and coupling errors were carried out based on Equations (9), (10), (20), and (21) using MATLAB R2020a on a PC with a 3.2 GHz CPU. The results of the effect of contour error δ on the independent errors of pitch and roll angles at different strokes of the hydraulic cylinder are shown in Figure 8.
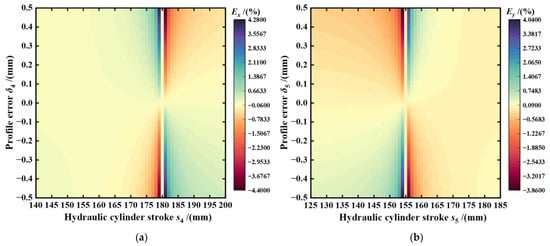
Figure 8.
(a) Heat map of pitch angle independent errors; (b) heat map of roll angle independent errors.
The error heat map shows that the absolute value of the angular independence error |E| is symmetrically distributed up and down with δ = 0 as the symmetry axis. Within the normal range of motion of the hydraulic cylinder, the absolute value of the pitch angle independence error |Ex| decreases with an increasing depression angle and increases with an increasing elevation angle. The absolute value of the roll angle independence error |Ey| increases with an increasing right roll angle and decreases with an increasing left roll angle.
In Figure 8a, the independent error Ex exhibits two distinct boundaries when the hydraulic cylinder stroke s4 at the pitch level approaches 180 mm. These boundaries display an antisymmetric distribution on their left and right sides. The horizontal coordinate corresponding to this boundary represents the initial travel after error correction. When δ4 > 0, the initial travel is shifted 1 mm to the right; conversely, it is shifted 1 mm to the left. Similarly, the error distribution of the roll layer also exhibits such characteristics. When δ lies between −0.5 mm and 0.5 mm, the extreme values of Ex and Ey are 4.28% and 4.04% and the extreme deviations are 8.68% and 7.90%, respectively. The error trends in the heat map illustrate that the roll angle is slightly more sensitive to contour errors than the pitch angle.
To ensure the precise manufacturing of equipment, it is imperative to establish strict tolerance limits for parts during the machining process design. Assuming that the absolute value of the error |E| ≤ 0.26% for both pitch and roll angles across any stroke, the contour errors must adhere to the following relationships:
In order to investigate the fluctuation of the independent error E in the stroke range of the hydraulic cylinder [31], the standard deviation of the independent error E corresponding to the different face profile errors δ is calculated according to Equation (23).
where σE is the standard deviation, Ei is the sample value, μE is the mean value, N is the total number of samples, and the calculation results are shown in Table 2. The magnitude of σE shows that when δ ϵ [−0.01, 0.01] mm, the independent errors E in the pitch and roll angles are less volatile. Therefore, in order to reduce the size and volatility of the errors in the pitch and roll angles, the dimensional deviation of the radius of the circular arc slot should be controlled within 0.01 mm as far as possible while balancing the processing difficulty and cost.
Table 2.
Volatility analysis of independent errors.
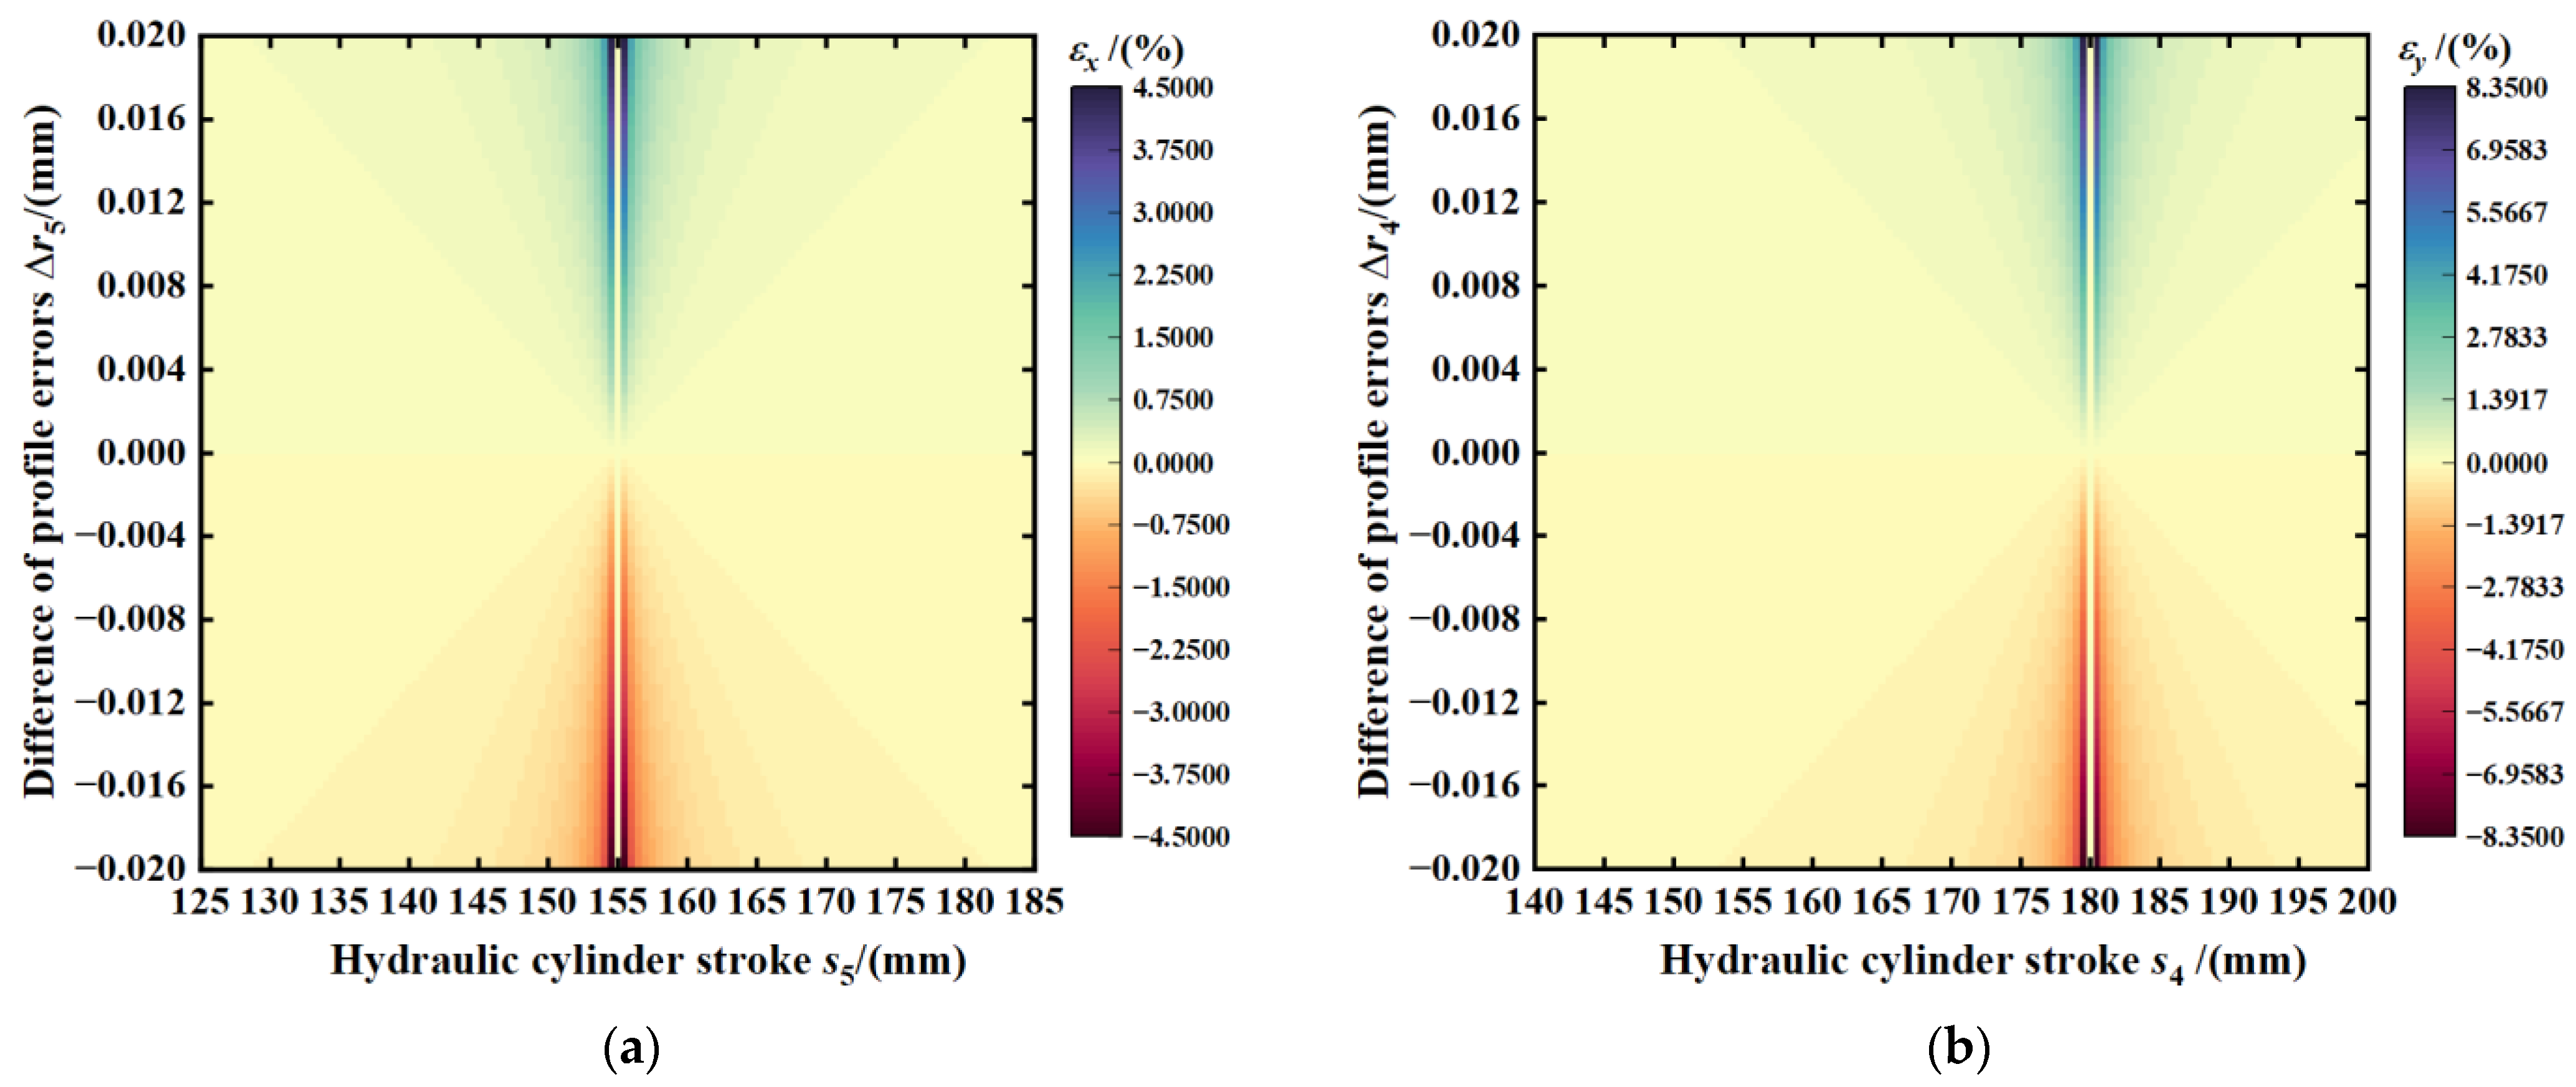
The results of the influence of the difference ∆r of the contour error of the pitch and roll layers on the coupling error ε at different strokes of the hydraulic cylinder are shown in Figure 9.

Figure 9.
(a) Heat map of pitch angle coupling errors; (b) heat map of roll angle coupling errors.
The heat map shows that the coupling error of the pitch and roll angles increases in parallel with the increase in the contour error difference ∆r. The extreme values of the coupling errors are ±4.50% and ±8.35%, respectively, and the extreme deviations are 9.00% and 16.70%, respectively. This suggests that the pitching motion significantly influences the roll angle, thus prioritizing the adjustment of the pitch layer in error compensation is necessary. Furthermore, the simulation results show that the effect of the hydraulic cylinder stroke on the coupling error is largest near the start position and small at other positions.
3.3. Error Compensation Experiments
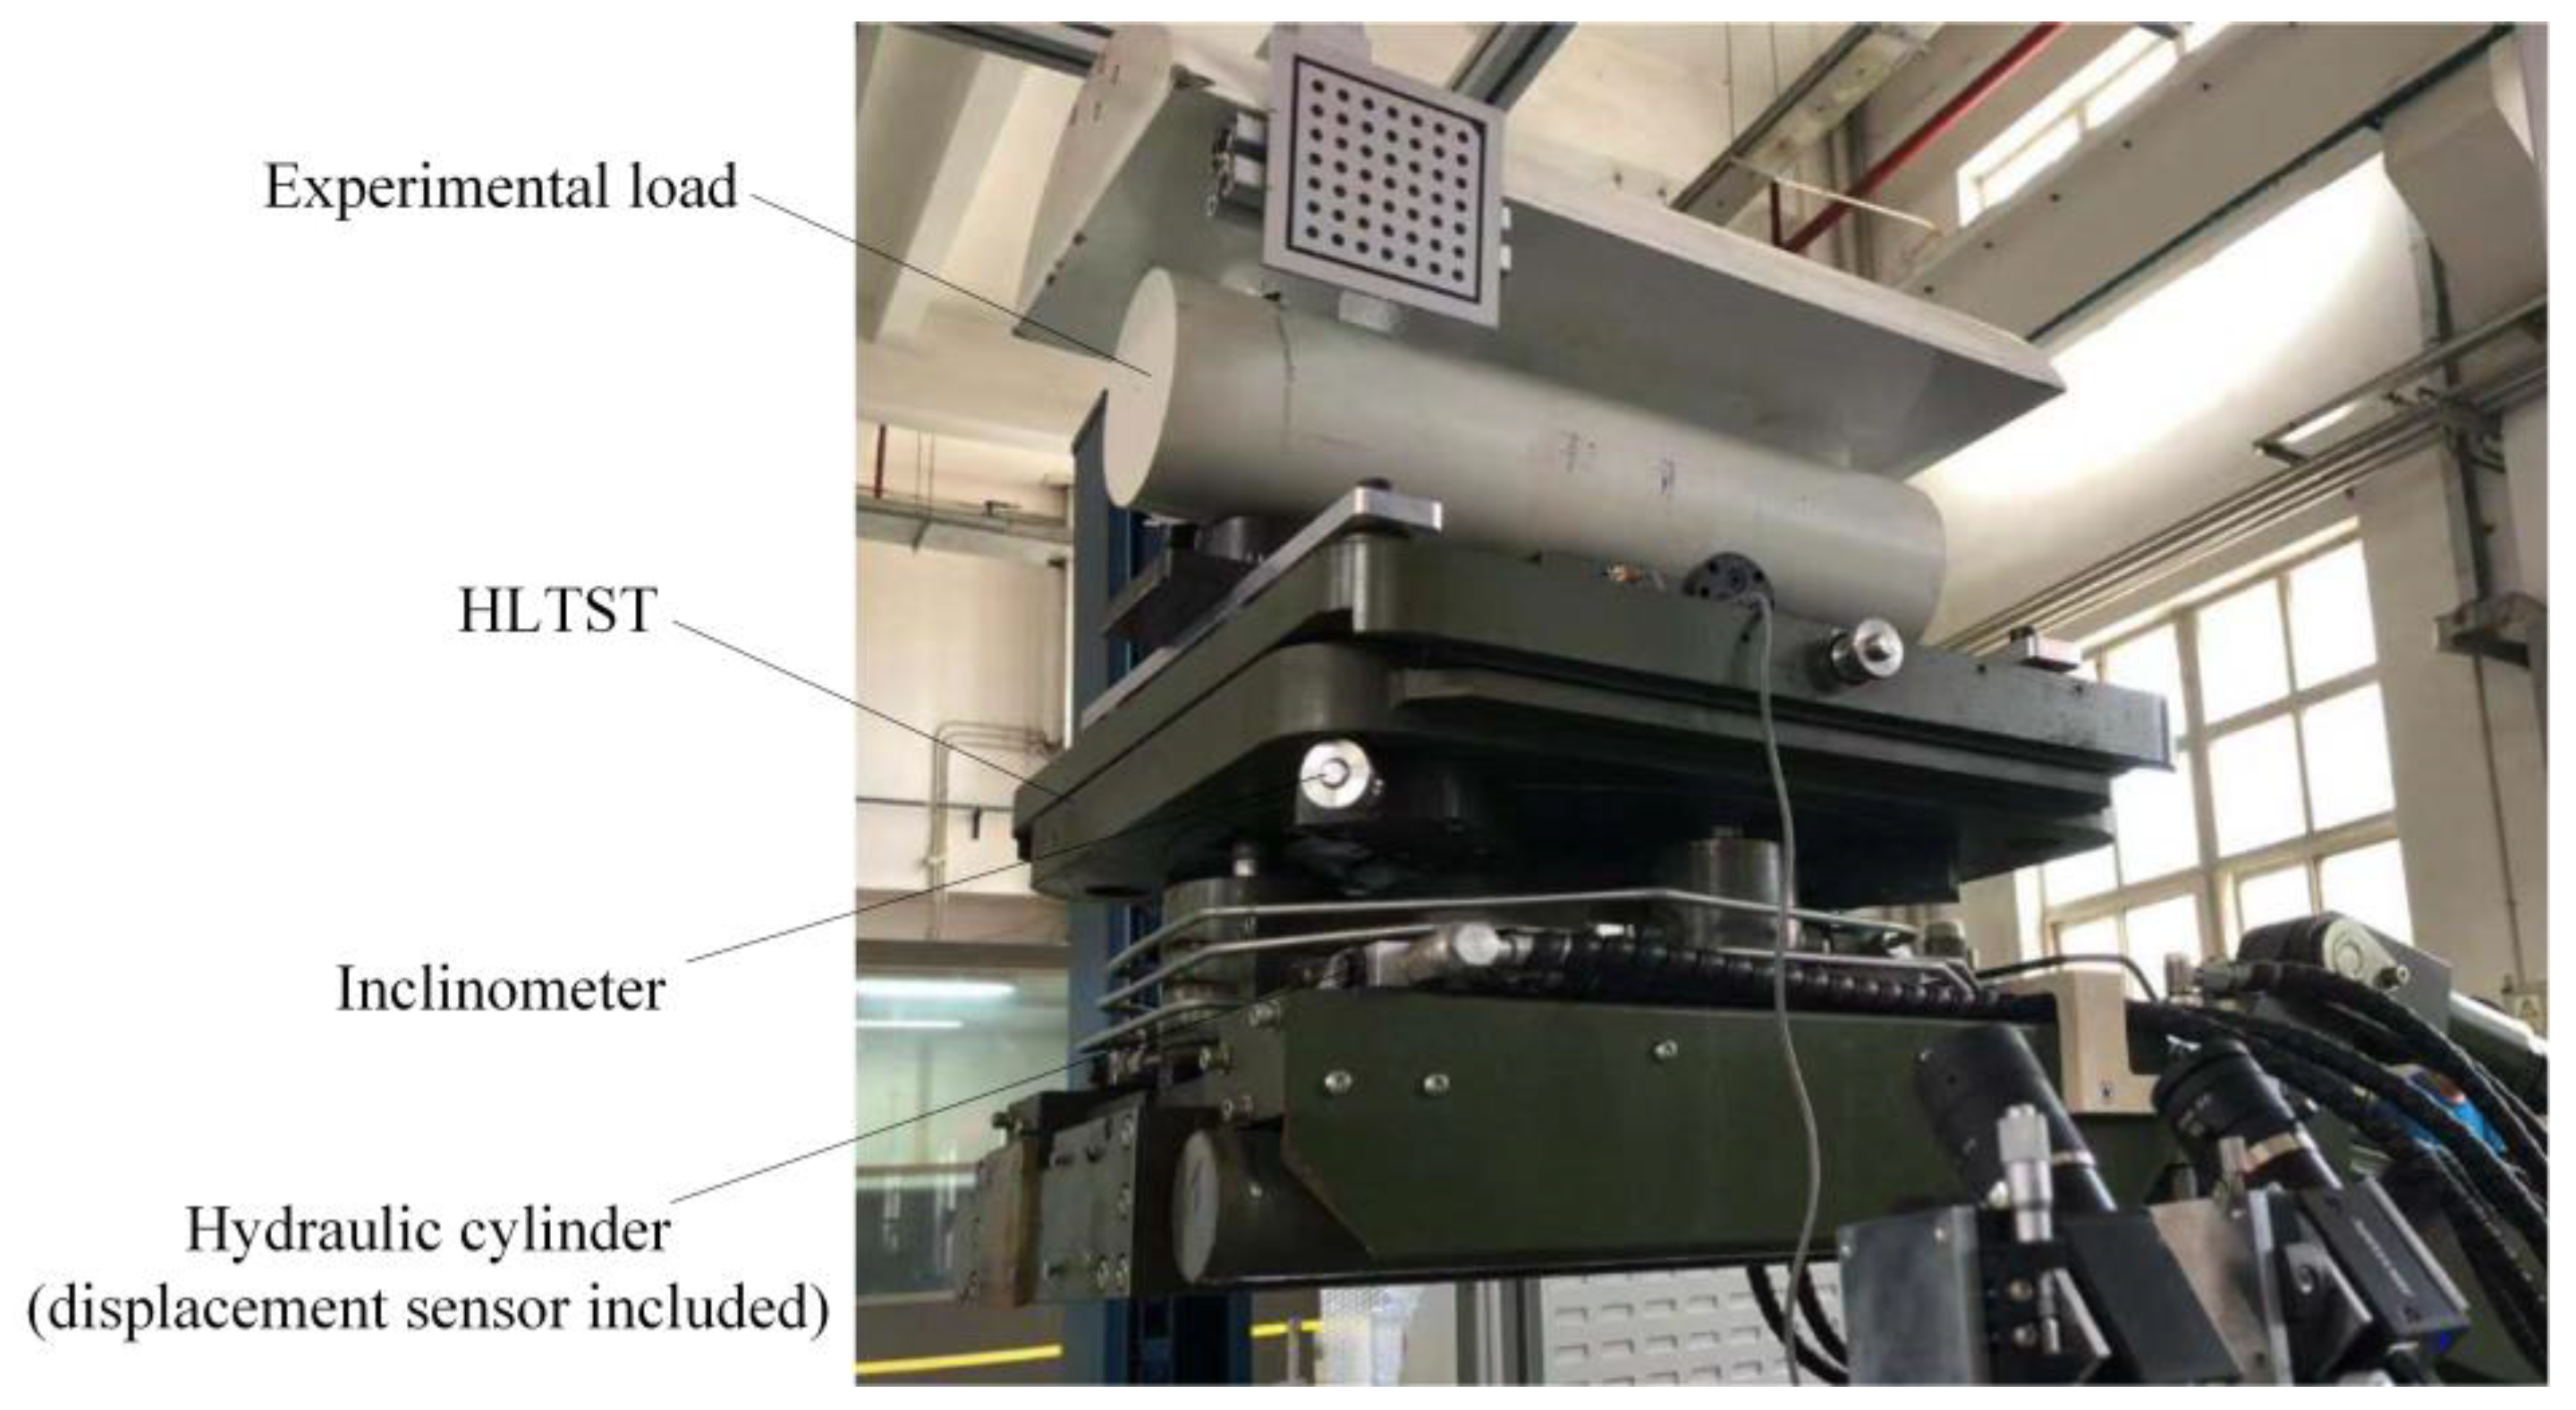
According to the results of the numerical simulation, the machining process of the HLTST is optimized and the error experimental platform is built based on the optimized table, as shown in Figure 10, in which the hydraulic cylinder is a custom-made product with a built-in displacement sensor, whose range is 50 mm, and the measurement accuracy is 0.01 mm; the table is installed with the Rion RNA826T inclination, with a measurement range of ±15°, a resolution of 0.001°, and a measurement accuracy of 0.02°.
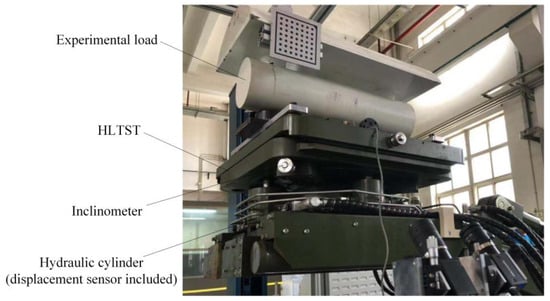
Figure 10.
Error experimental platform.
In order to verify the coupling error compensation model, the error compensation model of the table was first solved through parameter identification experiments. Subsequently, this model was employed to control the table’s movement to various orientations, allowing for the calculation of pitch and roll angle deviations. In the absence of a workbench load, and with = 0 and = 0 set, the pitch layer and roll layer were separately controlled to perform a reciprocating motion at specific angles, and the strokes of the hydraulic cylinders s4 and s5 were recorded. The experimental results are presented in Table 3 and Table 4.
Table 3.
Data of pitch layer error parameter identification experiments.
Table 4.
Data of roll layer error parameter identification experiments.
In the MATLAB R2020a fitting toolbox, Equations (12) and (13) were used as the fitting functions to fit the nonlinear least squares curves [32] to the data points in Table 3 and Table 4 to solve for the undetermined coefficients ∆r4 and ∆r5. The nonlinear model was first developed:
where is the multivariate input vector, is the parameter to be estimated, y is the observation, ε is the fitting error, and the objective of the optimization is to minimize the sum of squared residuals (SSE):
The optimal parameter estimates were obtained based on the Levenberg–Marquardt algorithm, and Jacobi matrix was calculated according to Equation (26).
The sensitivity matrix S is defined as
The effect of the perturbation of the observed data on the parameters to be estimated can be expressed as follows:
Taking R2 ≥ 0.99 as the accuracy index, the fitting leads to = −0.25165 and = −0.65232, with corresponding SSE values of 0.0104 and 0.0216. The matrix was derived using Equations (12) and (13), and the value of was subsequently calculated as follows:
Equation (28) shows that matrix is non-singular, indicating that the model parameters are less sensitive to data perturbations, and thus the error compensation model after parameter identification can be expressed as
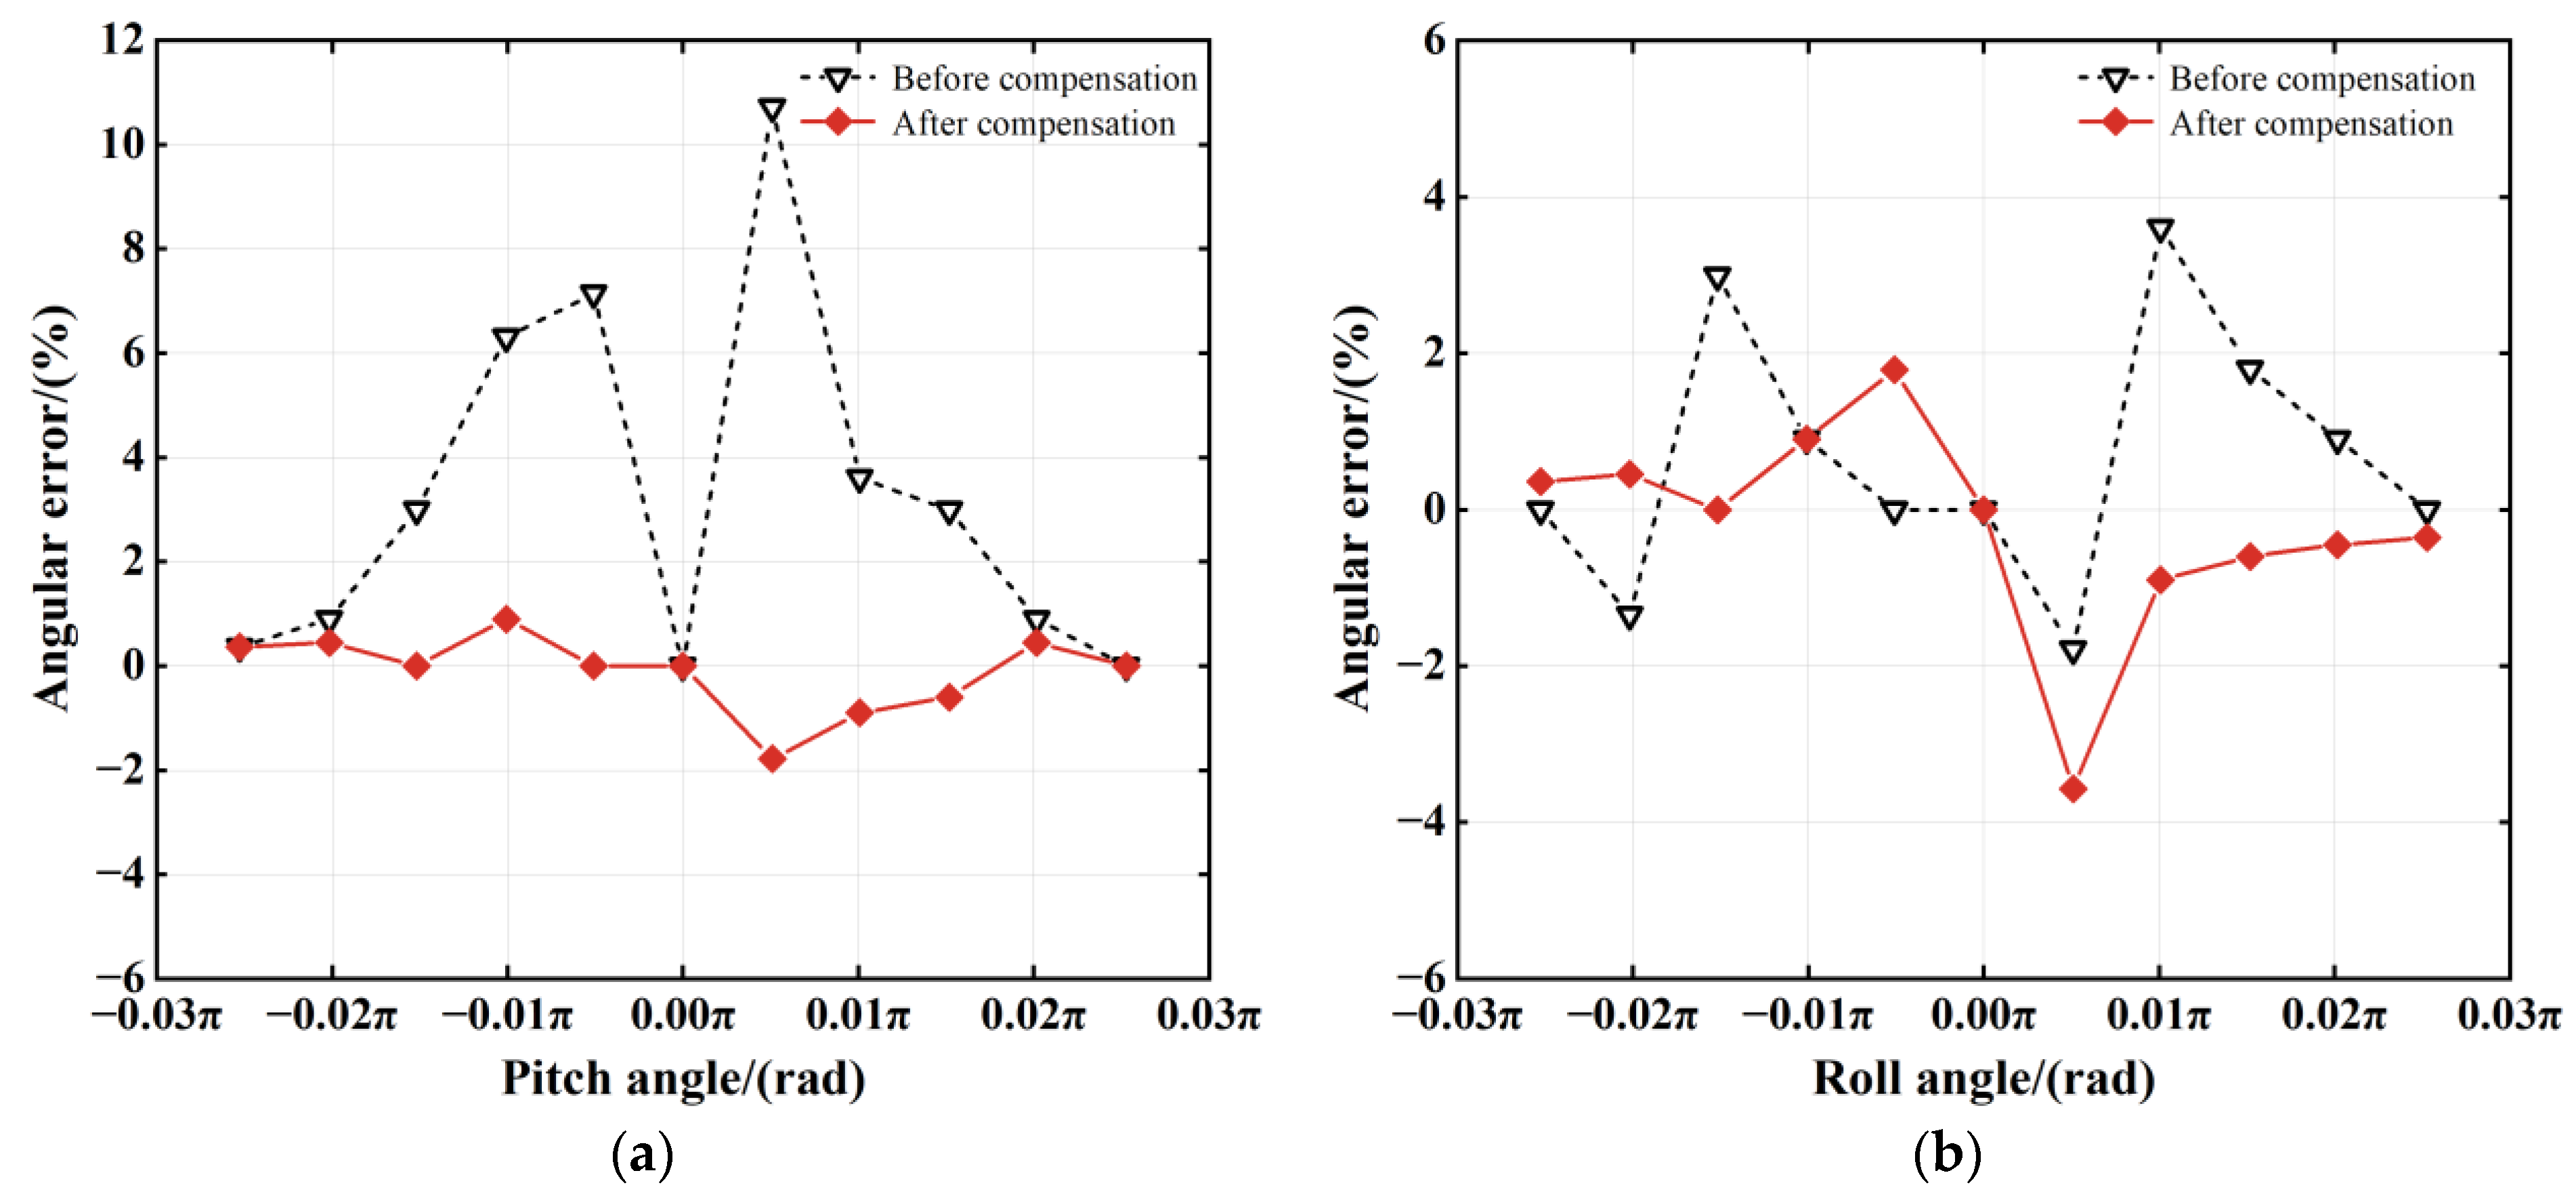
The error compensation model was deployed to regulate the movement of the unloaded table, aligning it with the attitude set via the uniform test design method. Subsequent to each movement, the angular error was recorded and the pitch and roll layers returned to their original positions before each movement. The variations in pitch and roll angles before and after compensation under no-load conditions are shown in Figure 11. The reductions in pitch and roll angle errors after the error compensation of the HLTST at no load and a rated load (2.5 t) are shown in Figure 12.
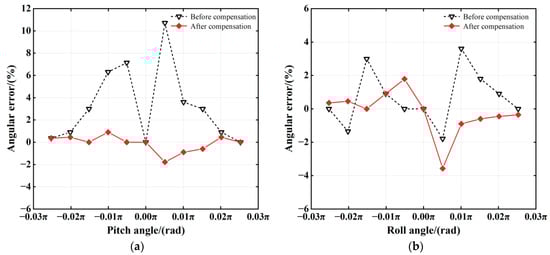
Figure 11.
(a) Error compensation for pitch angle under no load; (b) error compensation for roll angle under no load.
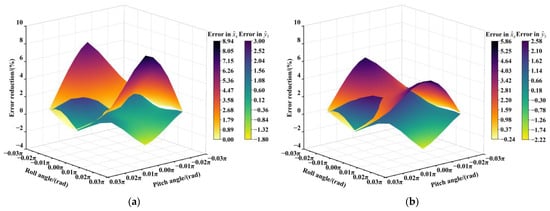
Figure 12.
(a) Error experiment under no load; (b) error experiment under rated load (2.5 t).
As demonstrated in Figure 11, the error compensation method achieved significant improvements in angular measurement accuracy. Specifically, the mean pitch angle error was reduced from 3.27% to −0.10%, while the mean roll angle error showed a similar improvement, decreasing from 0.64% to −0.22%. Notably, the maximum pitch angle deviation exhibited a substantial reduction from 10.71% to −1.78%, and the roll angle’s maximum error dropped from 3.60% to −3.57%. In addition, the root mean square error (RMSE) of pitch and roll angles were reduced by 84.52% and 23.56%, respectively, after the implementation of error compensation.
Figure 12 demonstrates that while the error compensation model exhibits slight performance degradation under rated load conditions compared with no-load operation, it remains effective in enhancing the HLTST’s positioning accuracy. Quantitative analysis revealed that the mean pitch angle error reduction decreased from 2.77% to 2.27% under the rated load, while the roll angle improvement maintained stability with mean error reduction changing from 0.36% to 0.35%. In addition, the maximum positioning errors of the HLTST in the pitch and roll angles under heavy-load conditions are 4.91% and −3.99%, respectively, which satisfy the positioning accuracy requirements. These results confirm the model’s robustness in maintaining positioning accuracy improvements across different operational conditions.
4. Conclusions
In this paper, for the problem of insufficient positioning control accuracy due to the coupling error of a heavy-load longitudinal and transversal swing table (HLTST) under space-constrained conditions, an accurate error compensation method based on geometric parameter correction and process optimization is proposed, which reduces the positioning error of the table by correcting the kinematic model, optimizes the machining process based on the results of numerical simulation, and finally verifies it through error compensation experiments.
The experimental results reveal that the inverse kinematics correction model established based on the contour error can significantly mitigate the direct impact of the circular surface machining error on the table’s pose. By analyzing the error characteristics via numerical simulation, we can provide theoretical guidance for part design, error allocation, and equipment factory inspection, thereby ensuring the table’s manufacturing accuracy. The error compensation model based on the assumption of rigid-body motion can mechanistically reflect the influence of geometric errors on the table’s attitude and realize the decoupling compensation of the pitch and roll angles. In the range of −0.0278π ~ 0.0278π, after the error compensation, the absolute average errors of the table’s pitch and roll angles decrease by 96.94% and 65.63%, respectively. Under the maximum load condition, the error compensation model is still able to control the maximum positioning error of the HLTST within ±5%. This demonstrates that the error compensation model significantly enhances positioning accuracy. Furthermore, the error compensation strategy, developed based on the sensitivity and coupling relationship of geometric errors, efficiently reduces the influence of highly sensitive error terms on the table’s positioning accuracy. This prevents multiple compensations and accelerates the compensation process, greatly contributing to shorter precision assembly times and increased suspension loading efficiency.
Author Contributions
Conceptualization, M.L. and W.L.; methodology, R.B.; software, S.L. (Shuo Li); validation, M.L. and X.Y.; formal analysis, R.B.; investigation, L.J.; data curation, S.L. (Suozhuang Li); writing—original draft preparation, R.B. and M.L.; writing—review and editing, M.L. and W.L.; project administration, M.L.; funding acquisition, W.L. All authors have read and agreed to the published version of the manuscript.
Funding
This research was funded by the National Natural Science Foundation of China, grant number 52475049.
Institutional Review Board Statement
Not applicable.
Informed Consent Statement
Not applicable.
Data Availability Statement
The data presented in this study are available upon request from the corresponding author. The data are not publicly available.
Acknowledgments
Thanks to each of the authors for their contributions to the manuscript and for the support of the funding project.
Conflicts of Interest
Author Liang Ji was employed by the company Beijing Shiny Technology Co., Ltd., Beijing. The remaining authors declare that the research was conducted in the absence of any commercial or financial relationships that could be construed as a potential conflict of interest.
References
- Li, G.; Li, Y.; Weng, S.F.; Wan, H.; Luo, D.B. Design and Simulation of a Novel 6-DOF Hybrid Mechanism Motion Platform for Pose Adjustment of Heavy Equipment. Iran. J. Sci. Technol. Trans. Mech. Eng. 2022, 47, 1055–1078. [Google Scholar] [CrossRef]
- Cui, R.; Ma, M.F.; Liu, H.Q.; Tan, Z.; Huang, X.Z.; Zhang, Y.M. Tolerance analysis of cradle-type double rotary table using the local parallel dimension chain method. Int. J. Adv. Manuf. Technol. 2024, 134, 1–18. [Google Scholar] [CrossRef]
- Liu, Y.; Yi, W.M.; Feng, Z.Q.; Yao, J.T.; Zhao, Y.S. Design and motion planning of a 7-DOF assembly robot with heavy load in spacecraft module. Robot. Comput. Integr. Manuf. 2024, 86, 102645. [Google Scholar] [CrossRef]
- Zhou, T.Y.; Gao, H. Modeling and simulation of the assembly accuracy of aero-engine rotors in the docking processes using a specially designed novel multi-DOF NC motion platform. Aerosp. Sci. Technol. 2021, 113, 106648. [Google Scholar] [CrossRef]
- Wang, R.; Xiong, X.Y.; Liang, H.S.; Zhang, J.Z. Optimization Design of Redundant Parallel Posture Adjustment Mechanism for Solar Wing Docking Based on Response Surface Methodology. Appl. Sci. 2024, 14, 8059. [Google Scholar] [CrossRef]
- Tang, X.X.; Zhou, H.B.; Jiang, X.N. Monocular vision-based online kinematic calibration method for five-axis motion platform. Meas. Sci. Technol. 2024, 35, 015033. [Google Scholar] [CrossRef]
- Tang, G.; Lei, J.M.; Li, F.R.; Zhu, W.D.; Xu, X.Z.; Yao, B.H.; Claramunt, C.; Hu, X. A modified 6-DOF hybrid serial–parallel platform for ship wave compensation. Ocean. Eng. 2023, 280, 114336. [Google Scholar] [CrossRef]
- Wei, Y.; Kang, R.; Cheng, H.L. Calculation method for military aircraft’s turnaround time. J. Beijing Univ. Aeronaut. Astronaut. 2008, 34, 1415–1418. [Google Scholar]
- Wang, H.; Chen, G.L. Research progress and perspective of robotic equipment applied in aviation assembly. Acta Aeronaut. Astronaut. Sin. 2022, 43, 49–71. [Google Scholar]
- Zhang, Z.; Jiang, F.; Luo, M.; Wu, B.H.; Zhang, D.H.; Tang, K. Geometric error measuring, modeling, and compensation for CNC machine tools: A review. Chin. J. Aeronaut. 2024, 37, 163–198. [Google Scholar] [CrossRef]
- Ramesh, R.; Mannan, A.M.; Poo, N.A. Error compensation in machine tools—A review Part I: Geometric, cutting-force induced and fixture-dependent errors. Int. J. Mach. Tools Manuf. Des. Res. Appl. 2000, 40, 1235–1256. [Google Scholar] [CrossRef]
- Fan, Y.C.; Fan, K.C.; Huang, Y.B. Modeling and compensation of enhanced volumetric error of machine tools containing crosstalk errors. Precis. Eng. 2024, 86, 252–264. [Google Scholar] [CrossRef]
- Jiang, Y.; Li, T.M.; Wang, L.P.; Chen, F.F. Kinematic error modeling and identification of the over-constrained parallel kinematic machine. Robot. Comput. Integr. Manuf. 2018, 49, 105–119. [Google Scholar] [CrossRef]
- Liao, Z.Y.; Wu, J.Z.; Wu, H.M.; Xie, H.L.; Wang, Q.H.; Zhou, X.F. Profile Error Estimation and Hierarchical Compensation Method for Robotic Surface Machining. IEEE Robot. Autom. Lett. 2024, 9, 3195–3202. [Google Scholar] [CrossRef]
- Tang, H.; Duan, J.A.; Lu, S.Q. Stream-of-Variation (SOV) Theory Applied in Geometric Error Modeling for Six-Axis Motion Platform. IEEE Trans. Syst. Man Cybern. Syst. 2020, 50, 762–770. [Google Scholar] [CrossRef]
- Zheng, Y.; Duan, J.A. A geometric and kinematic error model and compensation of a 6-axis motorized optical fiber alignment stage. Adv. Mech. Eng. 2015, 7, 1–12. [Google Scholar] [CrossRef]
- Song, Y.; Zhou, H.B.; Ju, X.; Li, Z.Q. Vision-based measurement for decoupling identification of geometric errors of rotating axes for five-axis platform. Meas. Sci. Technol. 2022, 33, 045007. [Google Scholar]
- Yu, J.; Yang, Y.L.; Cai, J.H.; Li, D.S. Coupling error model for the contact probe of a three-dimensional screw thread-measuring machine. Meas. Sci. Technol. 2022, 33, 055012. [Google Scholar] [CrossRef]
- Zhang, H.N.; Xiang, S.T.; Wu, C.; Yang, J.G. Optimal proportion compensation method of key geometric errors for five-axis machine tools considering multiple-direction coupling effects. J. Manuf. Process. 2024, 110, 447–461. [Google Scholar] [CrossRef]
- He, S.; Shi, T.L. Sensitivity analysis of surface contour error to geometric errors for four-axis ultra-precision machine tools. J. Manuf. Process. 2024, 131, 569–588. [Google Scholar] [CrossRef]
- Luo, Y.H.; Gao, J.; Chen, D.S.; Zhang, L.Y.; Liu, Y.C.; Zhong, Y.B. Accurate error compensation method for multi-axis parallel machine via singularized jacobi geometric parameter correction and coupling error evaluation. Robot. Comput. Integr. Manuf. 2024, 89, 102771. [Google Scholar] [CrossRef]
- Shen, H.Y.; Zhou, H.G.; Jin, Y.Y.; Li, L.; Deng, B.; Xu, J.W. Research on Pose Error Modeling and Compensation of Posture Adjustment Mechanism Based on WOA-RBF Neural Network. Machines 2024, 12, 782. [Google Scholar] [CrossRef]
- Nguyen, K.Q.; Khim, G.; Oh, S.J.; Ro, S.K. A unified geometric error model applicable to all configurations of three-axis machine tools. Int. J. Adv. Manuf. Technol. 2024, 134, 2653–2673. [Google Scholar] [CrossRef]
- Liu, Q.; Lu, H.; Yonezawa, H.; Yongezawa, A.; Kajiwara, I.; Jiang, T.; He, J.J. Geometric and dynamic error compensation of dual-drive machine tool based on mechanism-data hybrid method. Mech. Syst. Signal Process. 2025, 224, 112041. [Google Scholar] [CrossRef]
- Zhang, H.; Zhu, X.; Yang, M.; Liu, Z.H.; Cai, C.G. A deep learning approach for pose error prediction in parallel robots. Measurement 2025, 242, 115815. [Google Scholar] [CrossRef]
- Fang, S.P.; Liu, Y.S.; Otsubo, H.; Sumida, T. An automatic leveling method for the stage of precision machining center. Int. J. Adv. Manuf. Technol. 2012, 61, 303–309. [Google Scholar] [CrossRef]
- Li, Y.; Yu, M.L.; Bai, Y.M.; Hou, Z.Y.; Wu, W.W. A Review of Thermal Error Modeling Methods for Machine Tools. Appl. Sci. 2021, 11, 5216. [Google Scholar] [CrossRef]
- Peng, W.C.; Huang, J.F.; Wan, K.; Xia, H.J. A novel identification method for all geometric errors of rotary axis based on boundaryless constraint optimization method. Measurement. 2024, 234, 114876. [Google Scholar] [CrossRef]
- Chen, Y.P.; Wang, J.C.; Tang, Q.C.; Li, J. A Study on the Coarse-to-Fine Error Decomposition and Compensation Method of Free-Form Surface Machining. Appl. Sci. 2024, 14, 9044. [Google Scholar] [CrossRef]
- Liu, C.H.; Song, Z.J.; Sang, Y.C.; He, G.Y. An Improved Measurement Uncertainty Calculation Method of Profile Error for Sculptured Surfaces. Chin. J. Mech. Eng. 2019, 32, 1–10. [Google Scholar] [CrossRef]
- Shi, H.L.; Jiang, P.Y. Quality control in multistage machining processes based on a machining error propagation event-knowledge graph. Adv. Manuf. 2024, 12, 679–697. [Google Scholar] [CrossRef]
- Song, C.Y.; Li, Y.F.; Sui, J.H. Auxiliary model nonlinear innovation least squares algorithm for identification ship 4-DOF via full-scale test data. Sci. Rep. 2024, 14, 25861. [Google Scholar] [CrossRef] [PubMed]


Disclaimer/Publisher’s Note: The statements, opinions and data contained in all publications are solely those of the individual author(s) and contributor(s) and not of MDPI and/or the editor(s). MDPI and/or the editor(s) disclaim responsibility for any injury to people or property resulting from any ideas, methods, instructions or products referred to in the content. |
© 2025 by the authors. Licensee MDPI, Basel, Switzerland. This article is an open access article distributed under the terms and conditions of the Creative Commons Attribution (CC BY) license (https://creativecommons.org/licenses/by/4.0/).