Abstract
With the development of urbanization, building maintenance units (BMUs) have been widely used in super high-rise buildings. As aerial work machinery, condition monitoring plays a vital role in the safety maintenance and management of BMUs. However, BMUs have multi-source heterogeneous data relationships that are difficult for systems to understand. Moreover, at this stage, there is a lack of sufficient samples to support fault diagnosis data. Therefore, this paper proposes a real-time monitoring and fault diagnosis system for BMU operating conditions. This system, based on the Internet of Things (IoT) architecture, acquires and stores data from distributed BMU systems, improving the data collection and sharing rate throughout the entire process. A collaborative fault reasoning chain diagnosis model was established based on heterogeneous knowledge sources and real-time process signals, which increased the accuracy of fault identification to 97%. Finally, through simulation testing and evaluations, the system can stably transmit data within 6–7 days and accurately analyze the operational and fault status of BMU, with an error rate within 5%. It effectively improves the efficiency and accuracy of BMU condition monitoring and fault diagnosis and also provides a new method for the practical application of intelligent BMU operation and maintenance.
1. Introduction
BMUs are typically installed atop skyscrapers to transport maintenance personnel for exterior wall servicing [1]. As an aerial work platform, any safety mechanism failure, operational anomaly, or unexpected shutdown could endanger workers’ lives and incur catastrophic consequences [2,3]. Therefore, real-time monitoring and fault diagnosis are critical to minimize downtime and ensure operational reliability [4,5]. However, evolving architectural designs of commercial high-rises and diversified maintenance requirements have led to increasingly complex BMU configurations and structures. This complexity generates intricate multi-source data relationships, including the relationship between equipment structure and operating data, the relationship between operating data and fault status, and the relationship between fault status and fault causes [6]. Accurately modeling these multidimensional relationships and enabling rapid diagnostic outputs have become pivotal research challenges in fault diagnosis.
In recent years, with the maturation of multi-source information sensing and AI-assisted data mining technologies, knowledge-driven (KD) and data-driven (DD) approaches have been widely adopted in equipment condition monitoring (CM) and fault detection and diagnosis (FDD) [7,8,9]. DD fault diagnosis methods employ machine learning or deep learning algorithms to extract and identify fault patterns from operational datasets, though they often suffer from poor interpretability. In contrast, KD approaches primarily rely on textual rules, enabling networked and structured representation of domain knowledge. These methods equip machines with the capability to comprehend textual information and expert knowledge, thereby enhancing data interpretability, particularly for addressing the fundamental challenge of enabling computers to acquire domain expertise and understand the physical significance of data [10]. Beyond mere knowledge representation, KD techniques can also perform querying and reasoning based on established facts through semantic rules, thereby deriving new conclusions. Consequently, current research focuses on hybridizing DD and KD methodologies to strengthen a system’s ability to accurately diagnose faults [11,12]. For example, Li et al. [13] proposed a hybrid knowledge-based DD method for the distributed fault diagnosis of heterogeneous multi-agent systems, improving the decision-making ability of heterogeneous MAS. Hesam Hassanpour et al. [14] combined first principle knowledge with data for fault detection in HVAC systems to improve the performance of different clustering algorithms, outperforming purely DD methods. Li et al. [15] combined a data-driven symbol correction network with a model-driven orthogonal approximate message-passing network (OAMP Net) to correct detection errors in each iteration of the model-driven approach. However, this hybrid driving method requires the input of rich domain knowledge, accurate theoretical models, and massive system operation datasets, which are often very difficult to obtain. This relies on the long-term operation of the equipment and data accumulation [16,17,18]. In the case of insufficient public data samples, IoT technology is an effective method for obtaining big data samples [19,20]. For example, Jacome et al. [21] used IoT technology to obtain real-time data of photovoltaic systems to monitor their operating status and evaluate potential faults. IoT technology integrates physical information sensing, ultra-long-distance data transmission, and powerful cloud computing capabilities, effectively overcoming the coverage and real-time limitations of traditional data acquisition methods. Particularly suitable for remotely distributed systems like BMUs, it enables comprehensive data collection from all networked devices. The collected data are stored and processed through servers for model training and knowledge base updates. Real-time data acquisition further enhances diagnostic efficiency while significantly reducing equipment downtime.
Based on the above analysis, this study introduces a KD fused fault diagnosis approach within an IoT architecture for BMU operational data collection and fault state analysis. The proposed method integrates online equipment operational data with existing expert knowledge bases, enabling the mining of massive networked operational data to establish a global data relationship network and fault diagnosis inference links. This framework effectively achieves the intelligent management of BMU industry knowledge, facilitates smart fault analysis, and promotes information interconnectivity across the BMU industry. The main contributions of this paper are as follows:
- Establishment of an IoT architecture to acquire and store operational data from distributed BMU systems, forming a comprehensive dataset that serves as the foundation for system status analysis and fault detection.
- Development of a KD fusion framework that integrates expert-system prior knowledge with real-time operational data, which constructs multi-source relational association rules based on operational parameters and fault samples, ensuring the reliability of the proposed fault diagnosis model.
- Implementation of a multi-BMU integrated test system to validate the approach’s effectiveness. Experimental results demonstrate that the method simultaneously satisfies both accuracy and timeliness requirements for equipment fault diagnosis while providing comprehensive and innovative fault maintenance strategies.
2. System Design and Application
2.1. Overall System Architecture Design
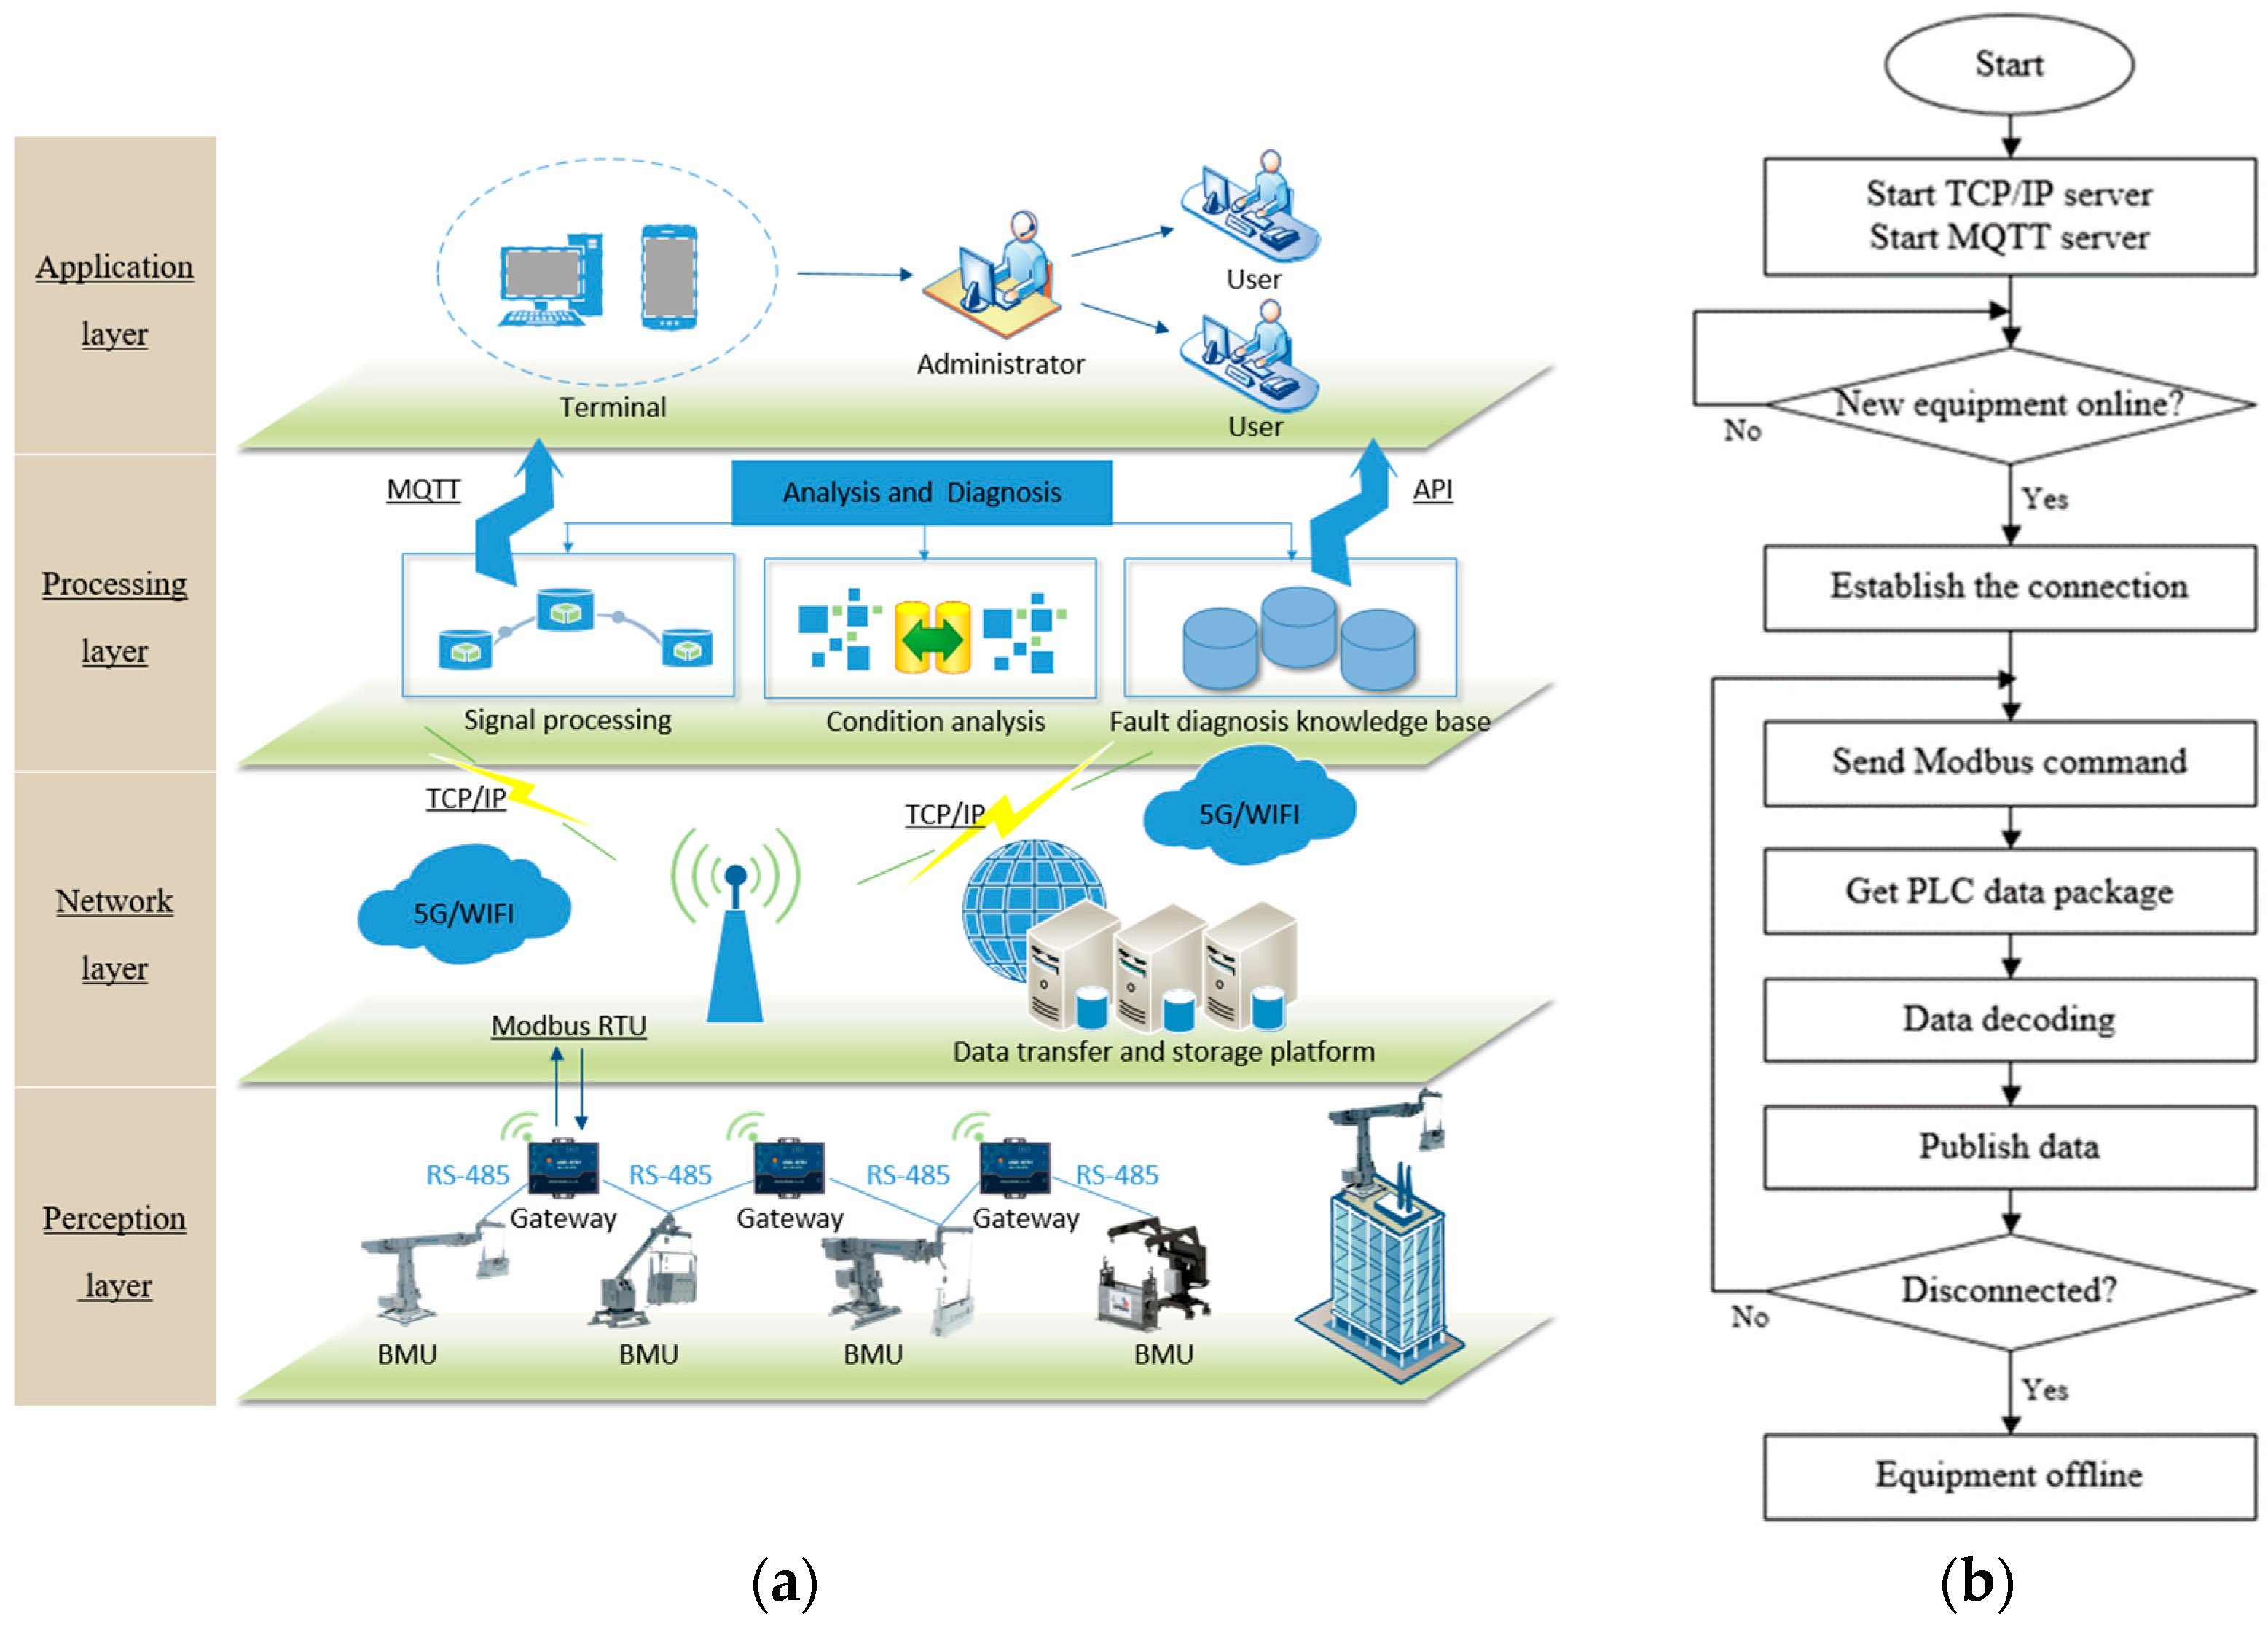
This article proposes a remote real-time status monitoring and fault diagnosis system for BMUs based on the IoT. The system architecture and data transmission process are illustrated in Figure 1a,b.
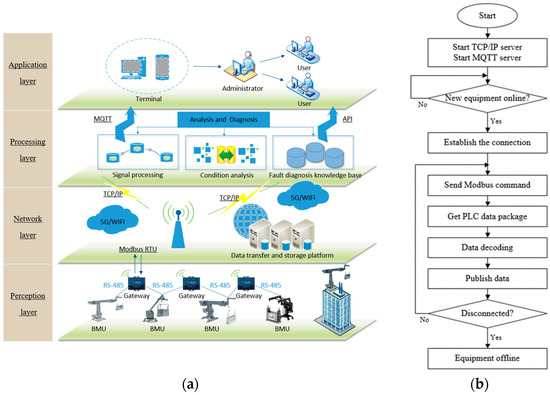
Figure 1.
(a) The structure of the system based on IoT. (b) Data transmission process.
As shown in Figure 1a, the system consists of 4 layers.
Perception Layer (Lp): This layer collects raw data through sensors and actuators on the BMU, which is processed by a gateway device (G) using Modbus RTU or similar protocols. Raw data are converted to a network-compatible format , as shown in Formula (1):
Network Layer (Ln): This layer ensures reliable data transmission from the perception layer to the data processing layer using communication technologies such as 5G or Wi-Fi, following the TCP/IP protocol stack. The data are transmitted as , as shown in Formula (2):
Data Processing Layer (Ldp): At this core layer, data from the network layer is analyzed using real-time fault diagnosis models (Mfd), generating diagnostic results R(t). This process is represented using Formula (3):
The results R(t) are published using MQTT and API for application access, as shown in Formula (4):
Application Layer (La): users interact with the system through a client interface, retrieving the diagnostic results and visualizing device status and fault information, as shown in Formula (5):
The system’s modular design, incorporating edge computing, cloud computing, and standard communication protocols, ensures seamless data flow across layers, achieving real-time monitoring and fault diagnosis for BMUs.
As shown in Figure 1b, the cloud server hosts both a TCP/IP server and an MQTT server. When remote devices come online, they establish connections with designated server ports. The TCP server then initiates Modbus requests for data acquisition using the format specified in Equation (6). The gateway returns data in the format shown in Equation (7). The received command formats are parsed into actual datasets, which are subsequently packaged into JSON format via the MQTT protocol and published under the topic ‘$BMUMS/DevTx/id’. The application layer can access all device data by subscribing to this topic.
This entire process is implemented in the server as detailed in Algorithm 1:
| Algorithm 1: System data transmission and processing process |
| Input: client_socket Output: continuously monitor and process client requests 1. import socket 2. import MQTT 3. socket.socket() // Create a server-side socket object 4. bind((“ip”,port)) // Bind the host’s IP address and port number 5. Listen() 6. while True: 7. accept() // Wait for the client’s connection request 8. recv() // Receive gateway MAC ID 9. send() // Send MODBUS command to the client 10. recv() // Receive gateway return message 11. analy() // Data parsing function 12. mqtt_client.publish() // MQTT server publishes messages 12. if the device goes offline 13. close() // Close the connection 14. break |
2.2. Establishment of the Real-Time Fault Diagnosis Model Based on Multi-Correlation Data
Diagnosing faults in BMUs effectively necessitates integrating diverse, multi-source data, including both real-time operational parameters and prior knowledge derived from equipment documentation and expert systems. To address this challenge, this paper proposes a collaborative fault inference chain model. This model organizes the required knowledge and diagnostic processes into two distinct but interconnected layers:
Data Layer: This foundational layer establishes a structured and formalized knowledge base. Its purpose is to represent the complex relationships between BMU components, operational states, potential faults, and associated data points, integrating prior knowledge in a machine-interpretable format.
Inference Layer: this layer operates on top of the data layer. It implements the diagnostic logic, utilizing the structured knowledge base and real-time operational data feeds to infer the current system state and identify potential faults.
2.2.1. Construction of Data Layer Structure
The construction of the data layer, introduced above, focuses on creating a comprehensive and structured representation of BMU-related knowledge. This involves capturing both concrete semantic descriptions of facts and abstract conceptual attributes [22,23]. The primary goal is to abstract key concepts (like equipment components, actions, and faults), their attributes, and the relationships between them from the available domain knowledge. This process defines the description scope, hierarchical architecture, and association rules of the global data structure needed for the diagnosis.
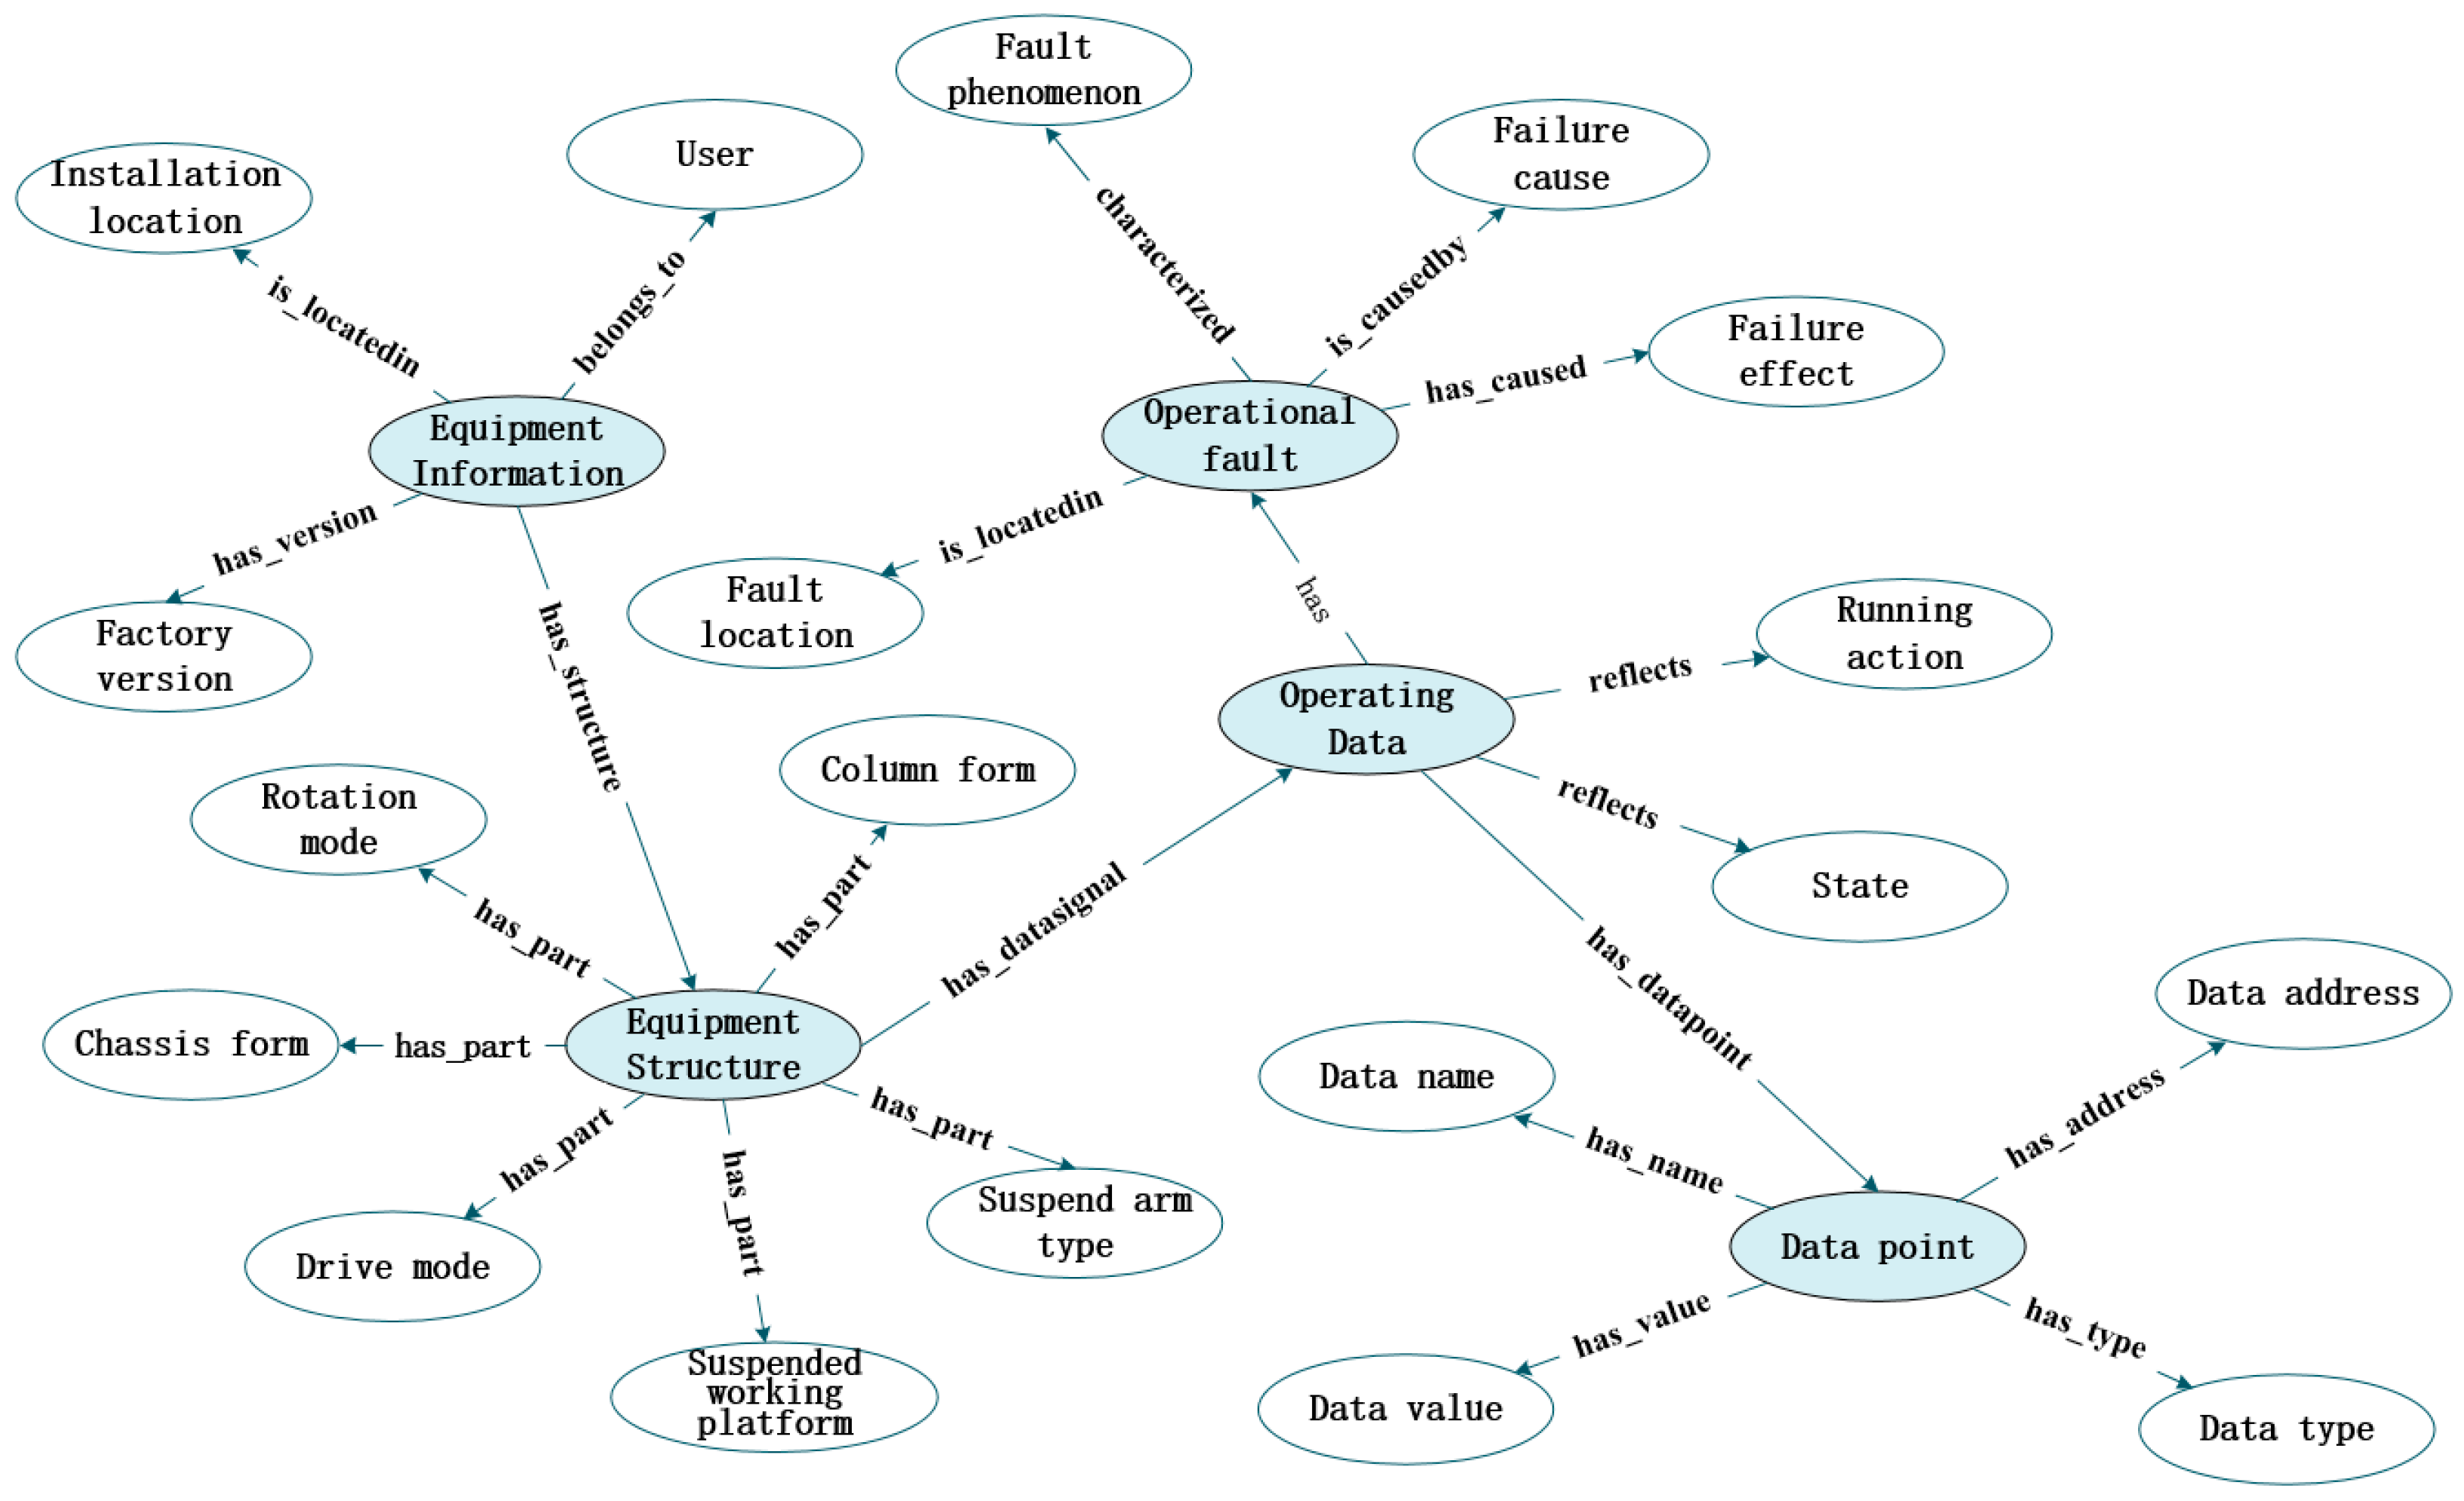
This study employs a top-down construction methodology. Concepts are identified and then linked via directed edges that represent the logical or physical relationships between them. This methodology results in the BMU data layer structure framework diagram shown in Figure 2.
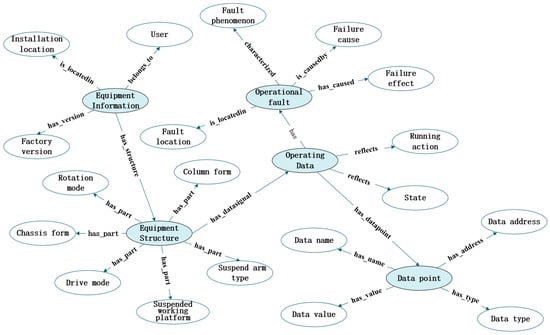
Figure 2.
BMU data layer structure framework diagram.
Figure 2 illustrates the correlation between device structure, action form, fault information, and operational data. Among them, the structure of the device determines the actions and functions that the device can perform, and each action has data points related to it. The data points have attributes such as the type, address, and value, and the action or fault state of the device can be inferred through the value attributes of the data points. The type and address attributes can be used to determine the fault type and locate the fault. Therefore, the core concept of describing the fault diagnosis problem of BMU operations can be divided into basic equipment data, which mainly include the equipment model, the user unit, factory installation information, project information, etc.; operating data, which mainly include the equipment operating status, operating time, abnormal alarms, operating data values, etc.; and fault data, which mainly include the fault type, fault description, fault analysis, fault location, and handling suggestions. Finally, the integration of BMU equipment structure, installation location, action form, fault description, fault location, fault analysis and other information was achieved, and the correlation between all concepts was expressed.
2.2.2. Design of the Diagnostic Model Based on a Fault Constitutive Relationship
The relationship between general fault phenomena and root causes is based on binary data, which cannot be used to handle more complex multi-source data relationships [24,25]. Therefore, based on the established data layer structure model and the application of multivariate relationship knowledge expression methods, this article introduces operational data variables into the fault phenomenon–fault cause correlation matrix and establishes a multi-source relationship correlation matrix based on operational data, fault phenomena, and fault causes. Firstly, establish the correlation between operational data and fault phenomena, as shown in Figure 3.
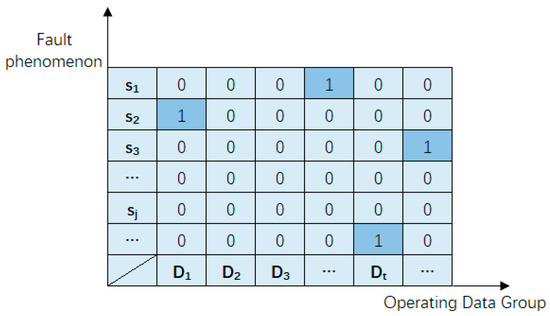
Figure 3.
Schematic diagram of the correlation between operational data and fault phenomena.
From Figure 3, it can be observed that the real-time operational dataset Dt plays a crucial role in this process, representing different real-time data states or feature sets. By introducing a predefined diagnostic rule set , each rule rj is associated with a specific fault phenomenon and defines a mapping from the real-time data space to a Boolean output. A rule rj is activated, and the corresponding fault phenomenon sj is triggered if and only if the data vector Dt satisfies the logical conditions defined by rj. These rules reflect domain expert knowledge, device operating safety thresholds, or anomaly patterns learned from historical data. Specifically, under a particular real-time data state Dt, the rule rj can identify and activate the corresponding fault phenomenon sj by satisfying its logical conditions, i.e., rj (Dt) = 1, as shown in Figure 3. The result of this process is the formation of a set of active fault phenomena Sactive (t), which contains all the fault phenomena corresponding to the triggered rules. This set can be expressed using Formula (8).
The schematic in Figure 3 provides a visual representation of the decision result matrix of rule set Rdiag under different real-time data inputs, reflecting the process of identifying system-level fault symptoms from real-time data. This process not only achieves the recognition of fault phenomena but also provides a foundation for subsequent fault cause analysis.
Upon identifying an active fault phenomenon , the next step is to infer the most likely cause from the predefined set of potential root causes , as outlined in Table 1.

Table 1.
The causes of each fault phenomenon.
Due to the often ambiguous nature of the relationship between phenomena and causes, which may exhibit “one-to-many” or “many-to-many” characteristics, probabilistic methods are introduced to quantify the inference process. The methodology employs Bayesian inference, integrating statistical correlations extracted from historical data or expert knowledge. The strength of the relationship between phenomena and causes is modeled as conditional probabilities.
Formally, a phenomenon–cause probability matrix I is constructed, where its dimensions are Z × M, corresponding to Z causes and M phenomena. This matrix is explicitly defined in Formula (9):
The elements of the matrix Ikj are rigorously defined as the posterior probability , representing the likelihood that the root cause fk is responsible for the fault phenomenon sj, as shown in Formula (10):
This matrix serves as the core of the diagnostic knowledge base, quantifying the inference strength from the symptom sj to the root cause fk. Parameter estimation for the matrix I typically involves statistical analysis of a large dataset of historical fault cases. A common approach is to use frequency-based maximum likelihood estimation, as shown in Equation (11):
where represents the number of instances in which phenomenon sj occurs and is associated with root cause fk, and denotes the total number of occurrences of phenomenon sj in the historical dataset. The validity of this estimation relies on the adequacy and representativeness of the historical data, assuming that the statistical patterns observed remain applicable in the current diagnostic context.
During the inference process, for any identified active fault phenomenon , the diagnostic system extracts the corresponding column vector from the probability matrix I as Formula (12):
Vector Pj provides the posterior probability distribution of all potential root causes , given the observed phenomenon sj. Based on the maximum a posteriori (MAP) criterion, the most probable root cause is determined by Formula (13):
In practical applications, the system typically outputs a ranked list of candidate root causes, which are ordered by the probability Ikj, to assist maintenance personnel in decision-making. This process completes the transition from raw data to the identification of system-level symptoms, enabling effective diagnostic reasoning.
2.2.3. Construction of a Data Processing Layer Framework with a Real-Time Fault Diagnosis Model
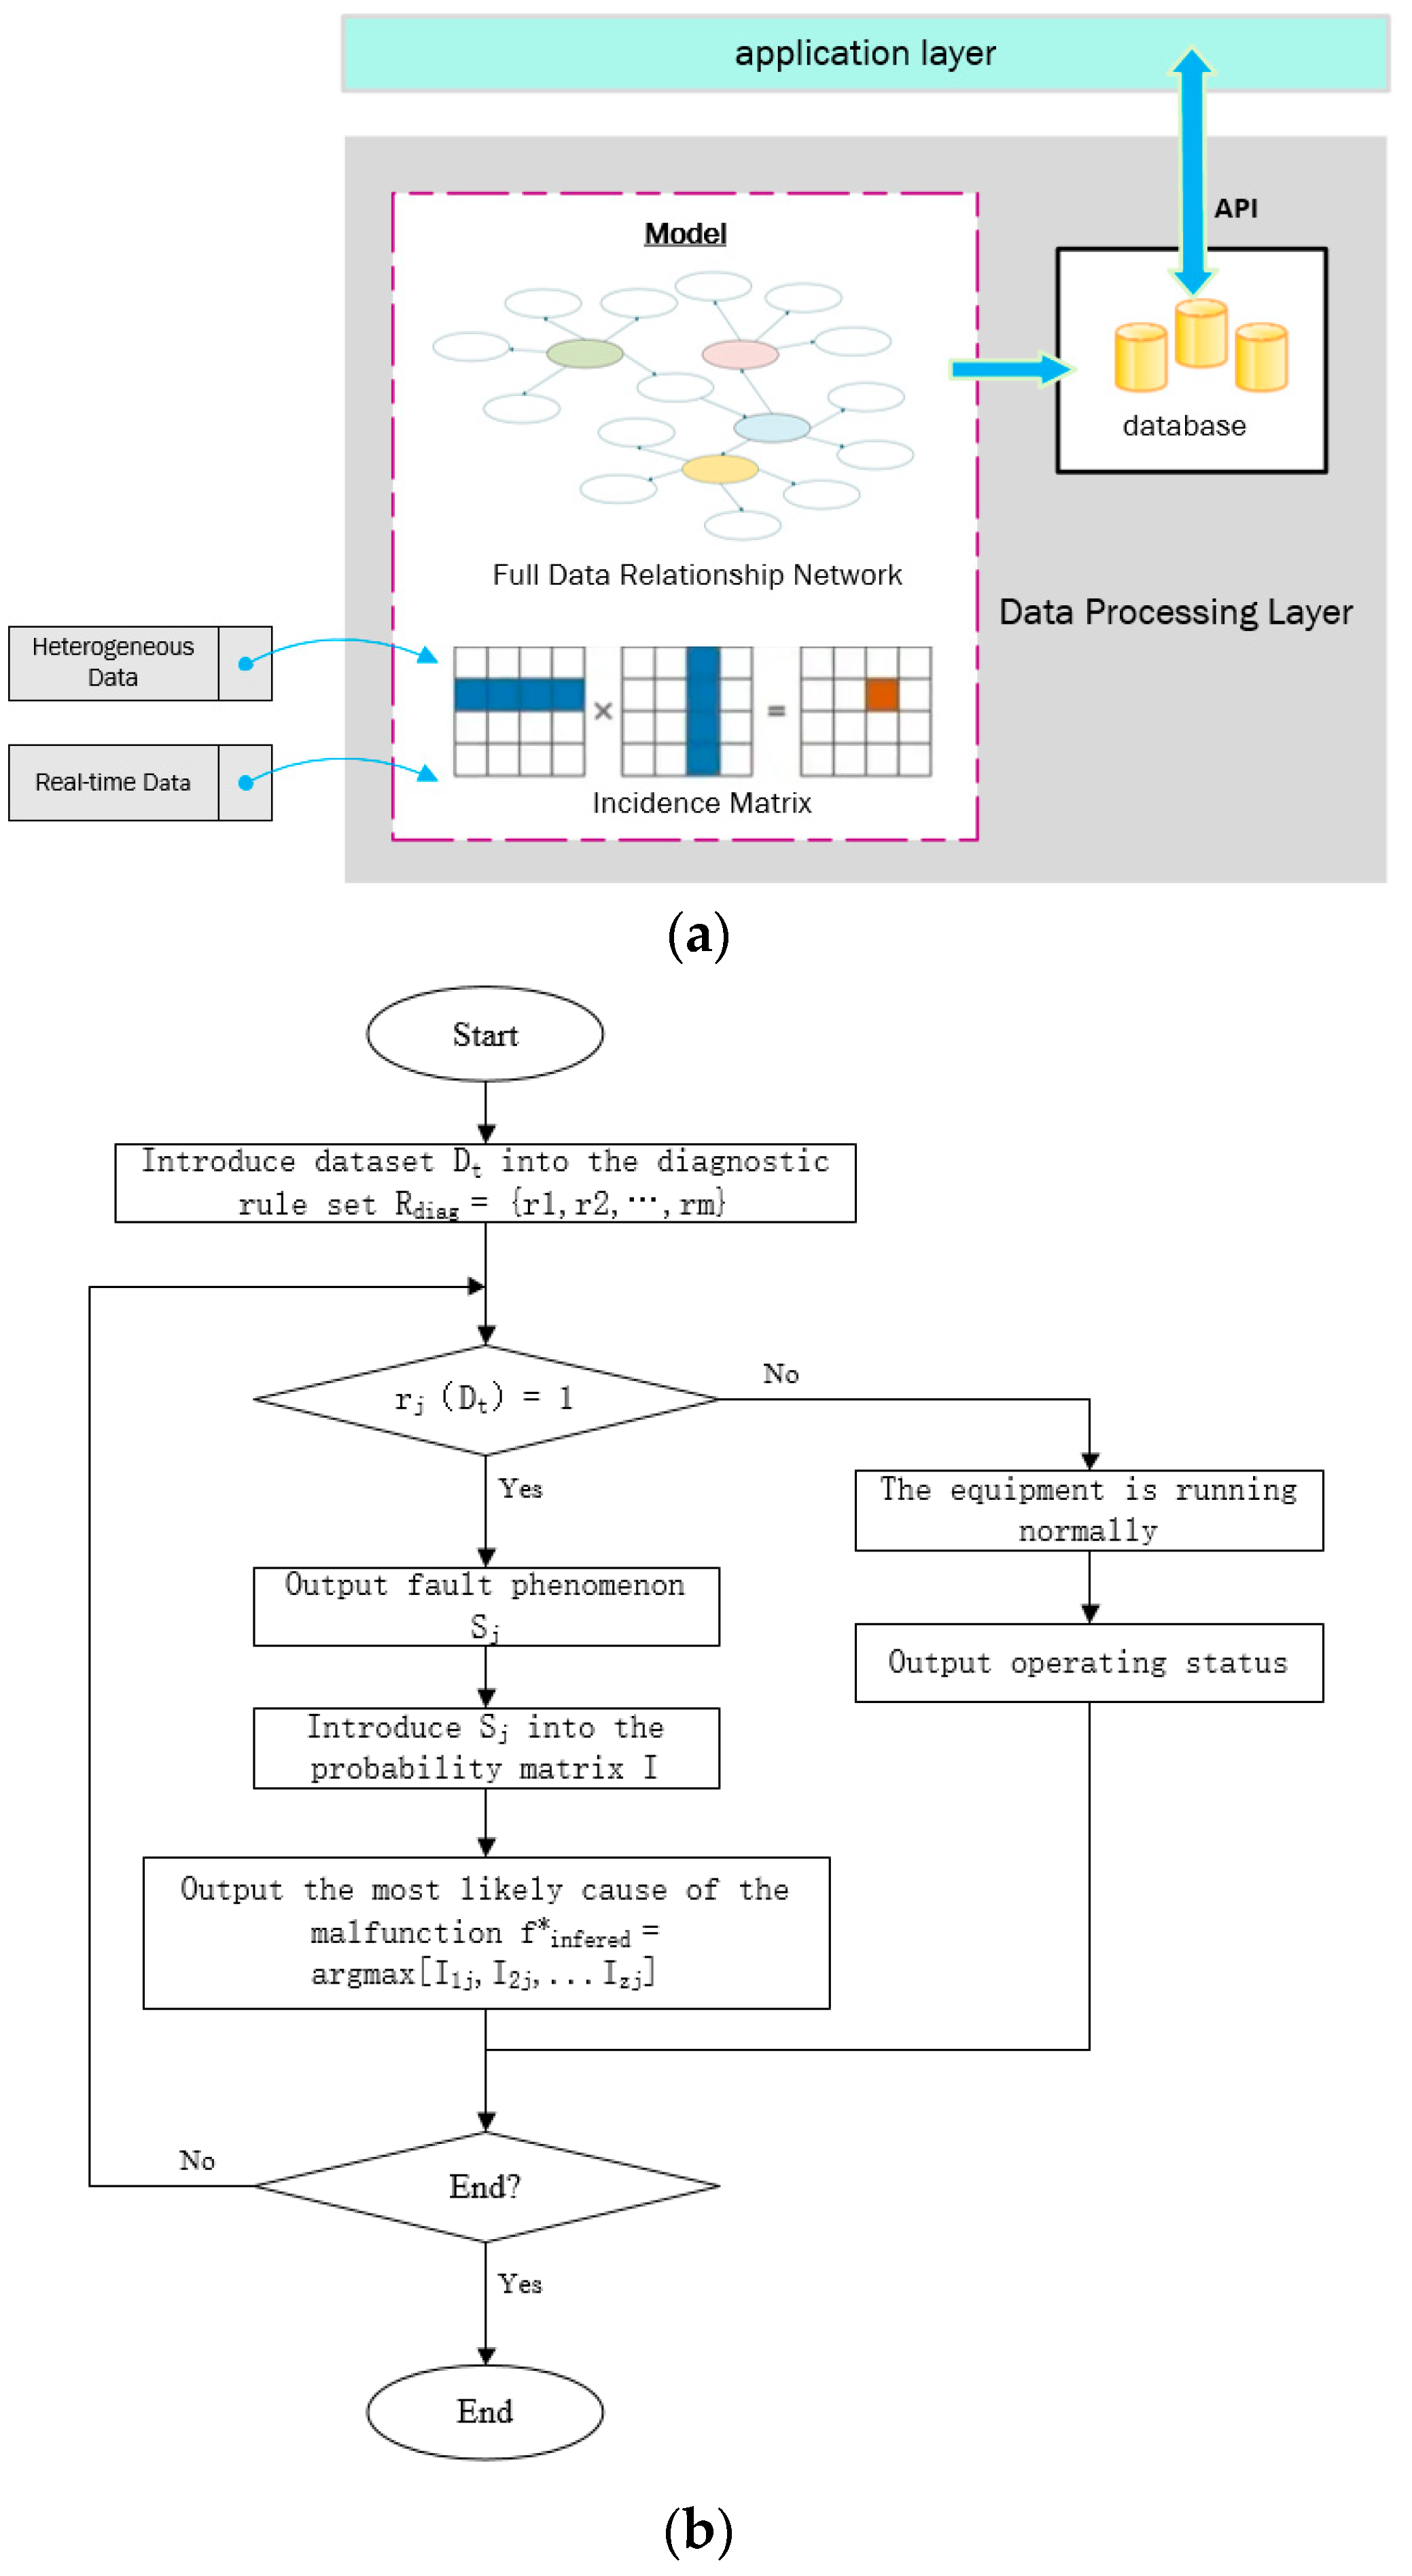
Based on the established global data relationship network for BMU operation and the correlation matrix of multi-source relationships for operationa data-fault phenomenon-fault root cause, a data processing layer framework incorporating a real-time fault diagnosis model was constructed. The basic structure and diagnostic process of the framework are shown in Figure 4a,b.
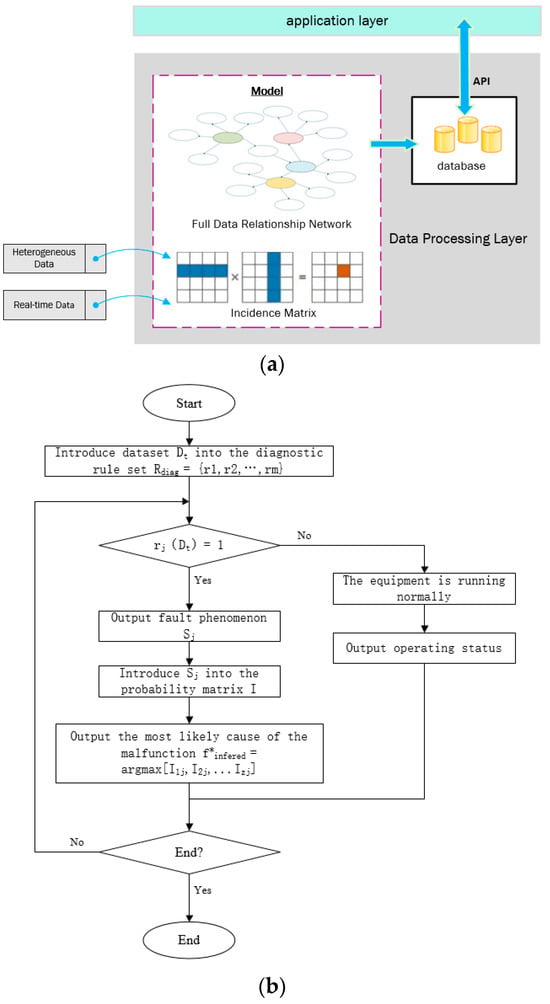
Figure 4.
(a) Data processing layer architecture. (b) Condition analysis and fault diagnosis process of the system.
From Figure 4a, it can be seen that the data relationships are stored in the database and embedded in the data processing layer in a system-recognizable manner. Among them, the storage methods of data in the data processing layer include process data classification and fault information storage, which can classify signals and analyze possible causes of faults based on fault diagnosis rules, provide diagnostic recommendations, and then interact with the application layer to ensure the independence of the fault diagnosis knowledge base, facilitating the update and maintenance of diagnostic rules and solutions. Based on the real-time fault diagnosis model established above, the specific calculation process for state analysis and fault diagnosis is shown in Figure 4b.
3. The Simulation Test of the System
3.1. Establishment of the Testing System
In order to verify the practical application of the system, we have built a test system for simulation testing. Building the test system includes developing the simulation control system of the BMU, connecting the remote communication module, building the cloud server, etc. [26,27]. The key elements of the test system are shown in Table 2.
Table 2.
Key elements of the test system.
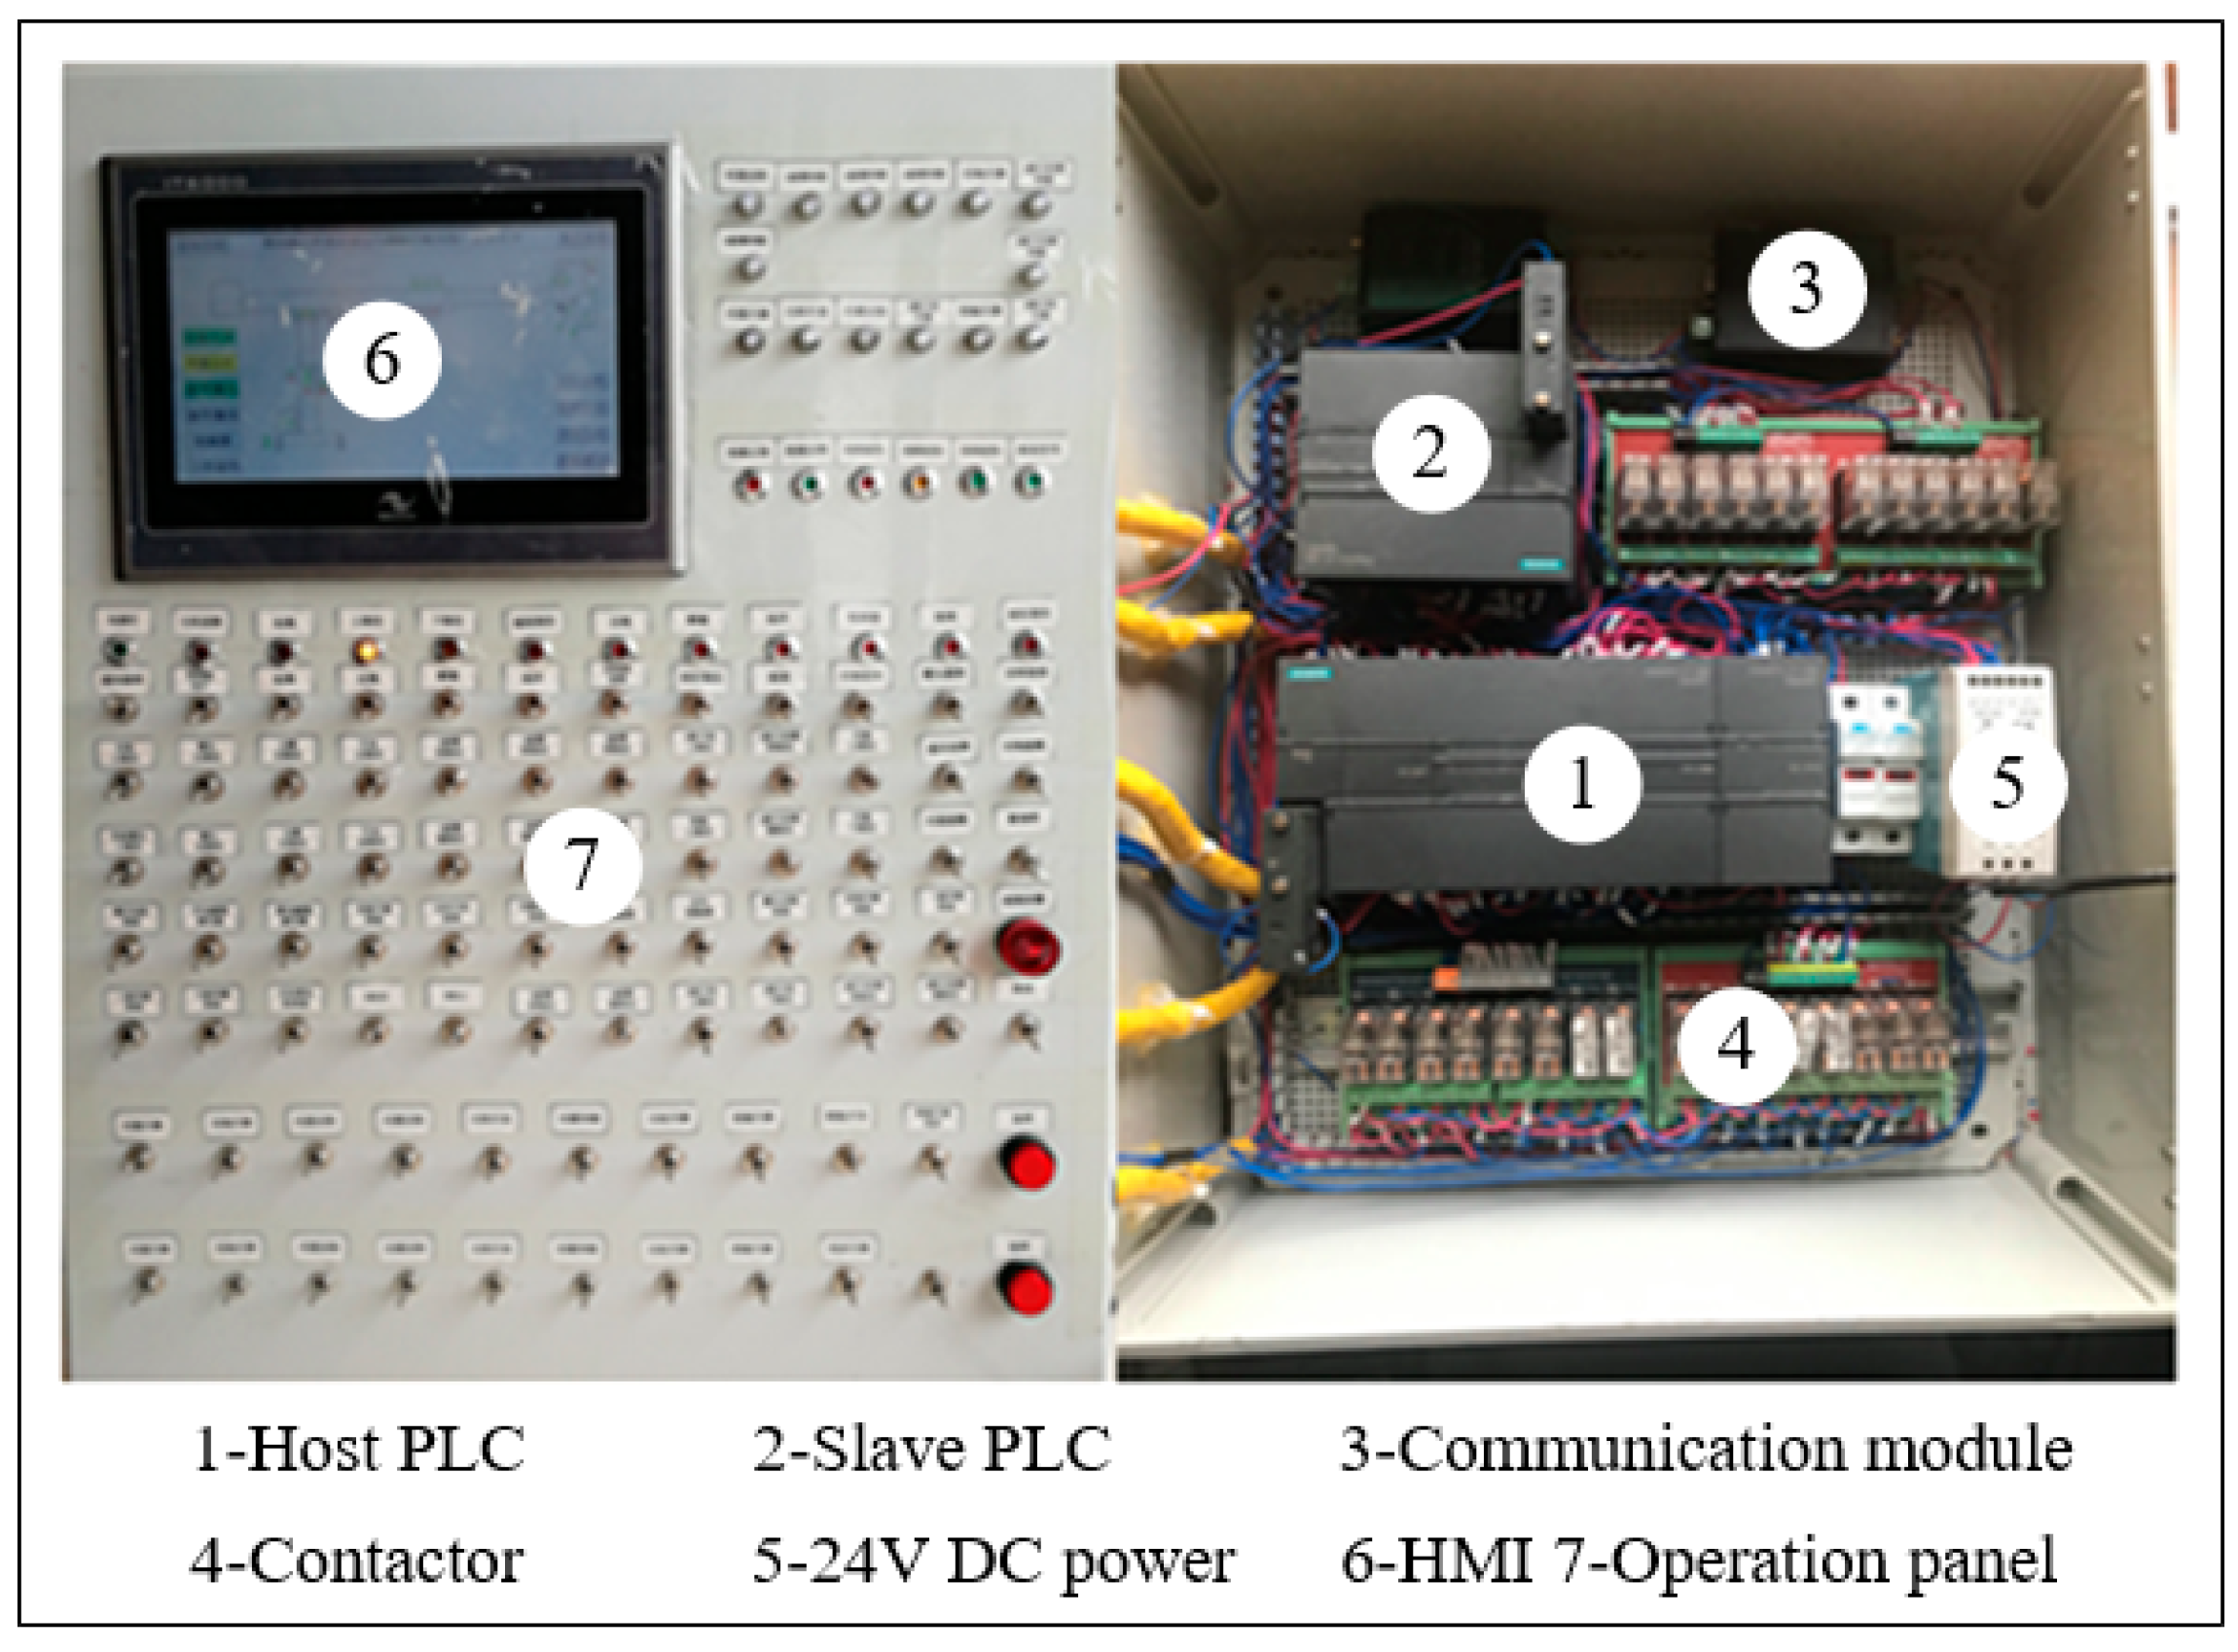
The BMU control system controls the input and output signals of the PLC to simulate the working state of the BMU. This system includes PLC, HMI, a power supply, a switch, the contactor, an indicator light, and other components, and the communication module is connected to the system via the RS485 interface, as shown in Figure 5. The module configuration involves both serial port and network protocol settings. The serial port parameters (baud rate, data bits, etc.) must match those of the BMU controller. The network protocol adopts TCP/IP, with the communication module configured as a TCP client. The cloud server’s public IP address and receiving port are added to establish the connection. Each communication module features a factory-programmed MAC address that serves as its unique identifier. During each power-on sequence, the module uploads this MAC address to the server upon establishing a connection, which serves as the primary device authentication criterion.

Figure 5.
Simulation control system of the BMU and its main parts.
In the cloud server environment, a TCP server was implemented using Python 3.9, while EMQX 4.0 was deployed as the MQTT broker to receive and process data streams [28,29]. The client adopts a B/S architecture, utilizing Apache as the web server to process client requests. The Apache server is configured by setting the website’s homepage and domain name. After completing the configuration, the Apache server is started, enabling browser access to the client through the domain name. The database uses MySQL 8.0, and the client operates the database by calling API interfaces.
3.2. Application Simulation Analysis
To verify the effectiveness of the IoT-based BMU remote monitoring and fault diagnosis system proposed in this paper (see Section 2 for details), especially the performance of its fault diagnosis model, in this study, a simulation control system is established for the BMU and cloud server, and we conducted a series of simulation experiments. Considering the various operating conditions and fault modes that may occur during actual BMU operation (refer to Table 1), the experiment used a simulated dataset containing normal operating conditions and multiple typical fault types to obtain real-time data of the BMU simulation control system at a frequency of 2 s. Figure 6a demonstrates the monitoring interface during normal BMU operation (executing the boom left-rotation maneuver). After inputting the fault samples of the left-rotation contactor into the system, the client displays the interface shown in Figure 6b.
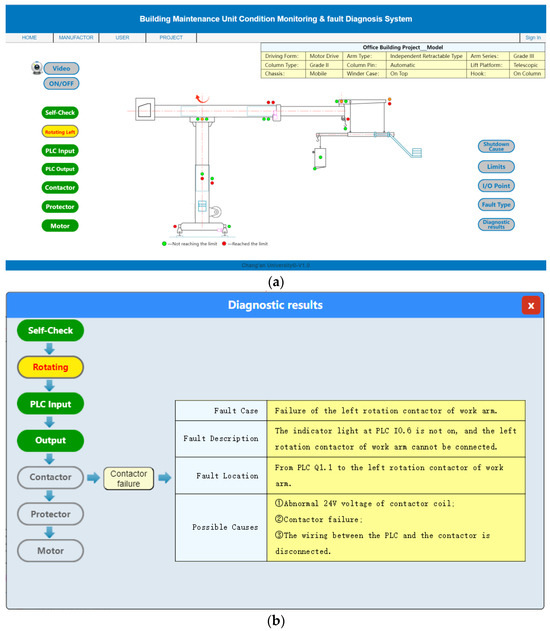
Figure 6.
(a) BMU operating CM. (b) The diagnosis results displayed in the information window of the client.
3.3. Result Analysis
The simulation dataset is generated by the BMU testing system, which contains six categories of states, covering normal operation, and five typical BMU faults that are selected according to Table 1:
- Category 0: Normal Operation
- Category 1: Host Communication Abnormality
- Category 2: Inverter Fault—Excessive Temperature
- Category 3: Rope Slack Fault
- Category 4: No Input Signal—Knob Contact Malfunction
- Category 5: Contactor Failure—Left Rotate as an Example
For these categories, key features capable of reflecting their state differences were selected for simulation, including normal operation signals, communication connection signals, inverter signals, rope slack switch signals, knob input signals, and contactor feedback signals. The dataset contains a total of 1200 samples (200 samples per category), with each sample representing a data snapshot at a specific time point. During data generation, appropriate noise was added to simulate data fluctuations under real operating conditions.
3.3.1. Diagnostic Performance Evaluation
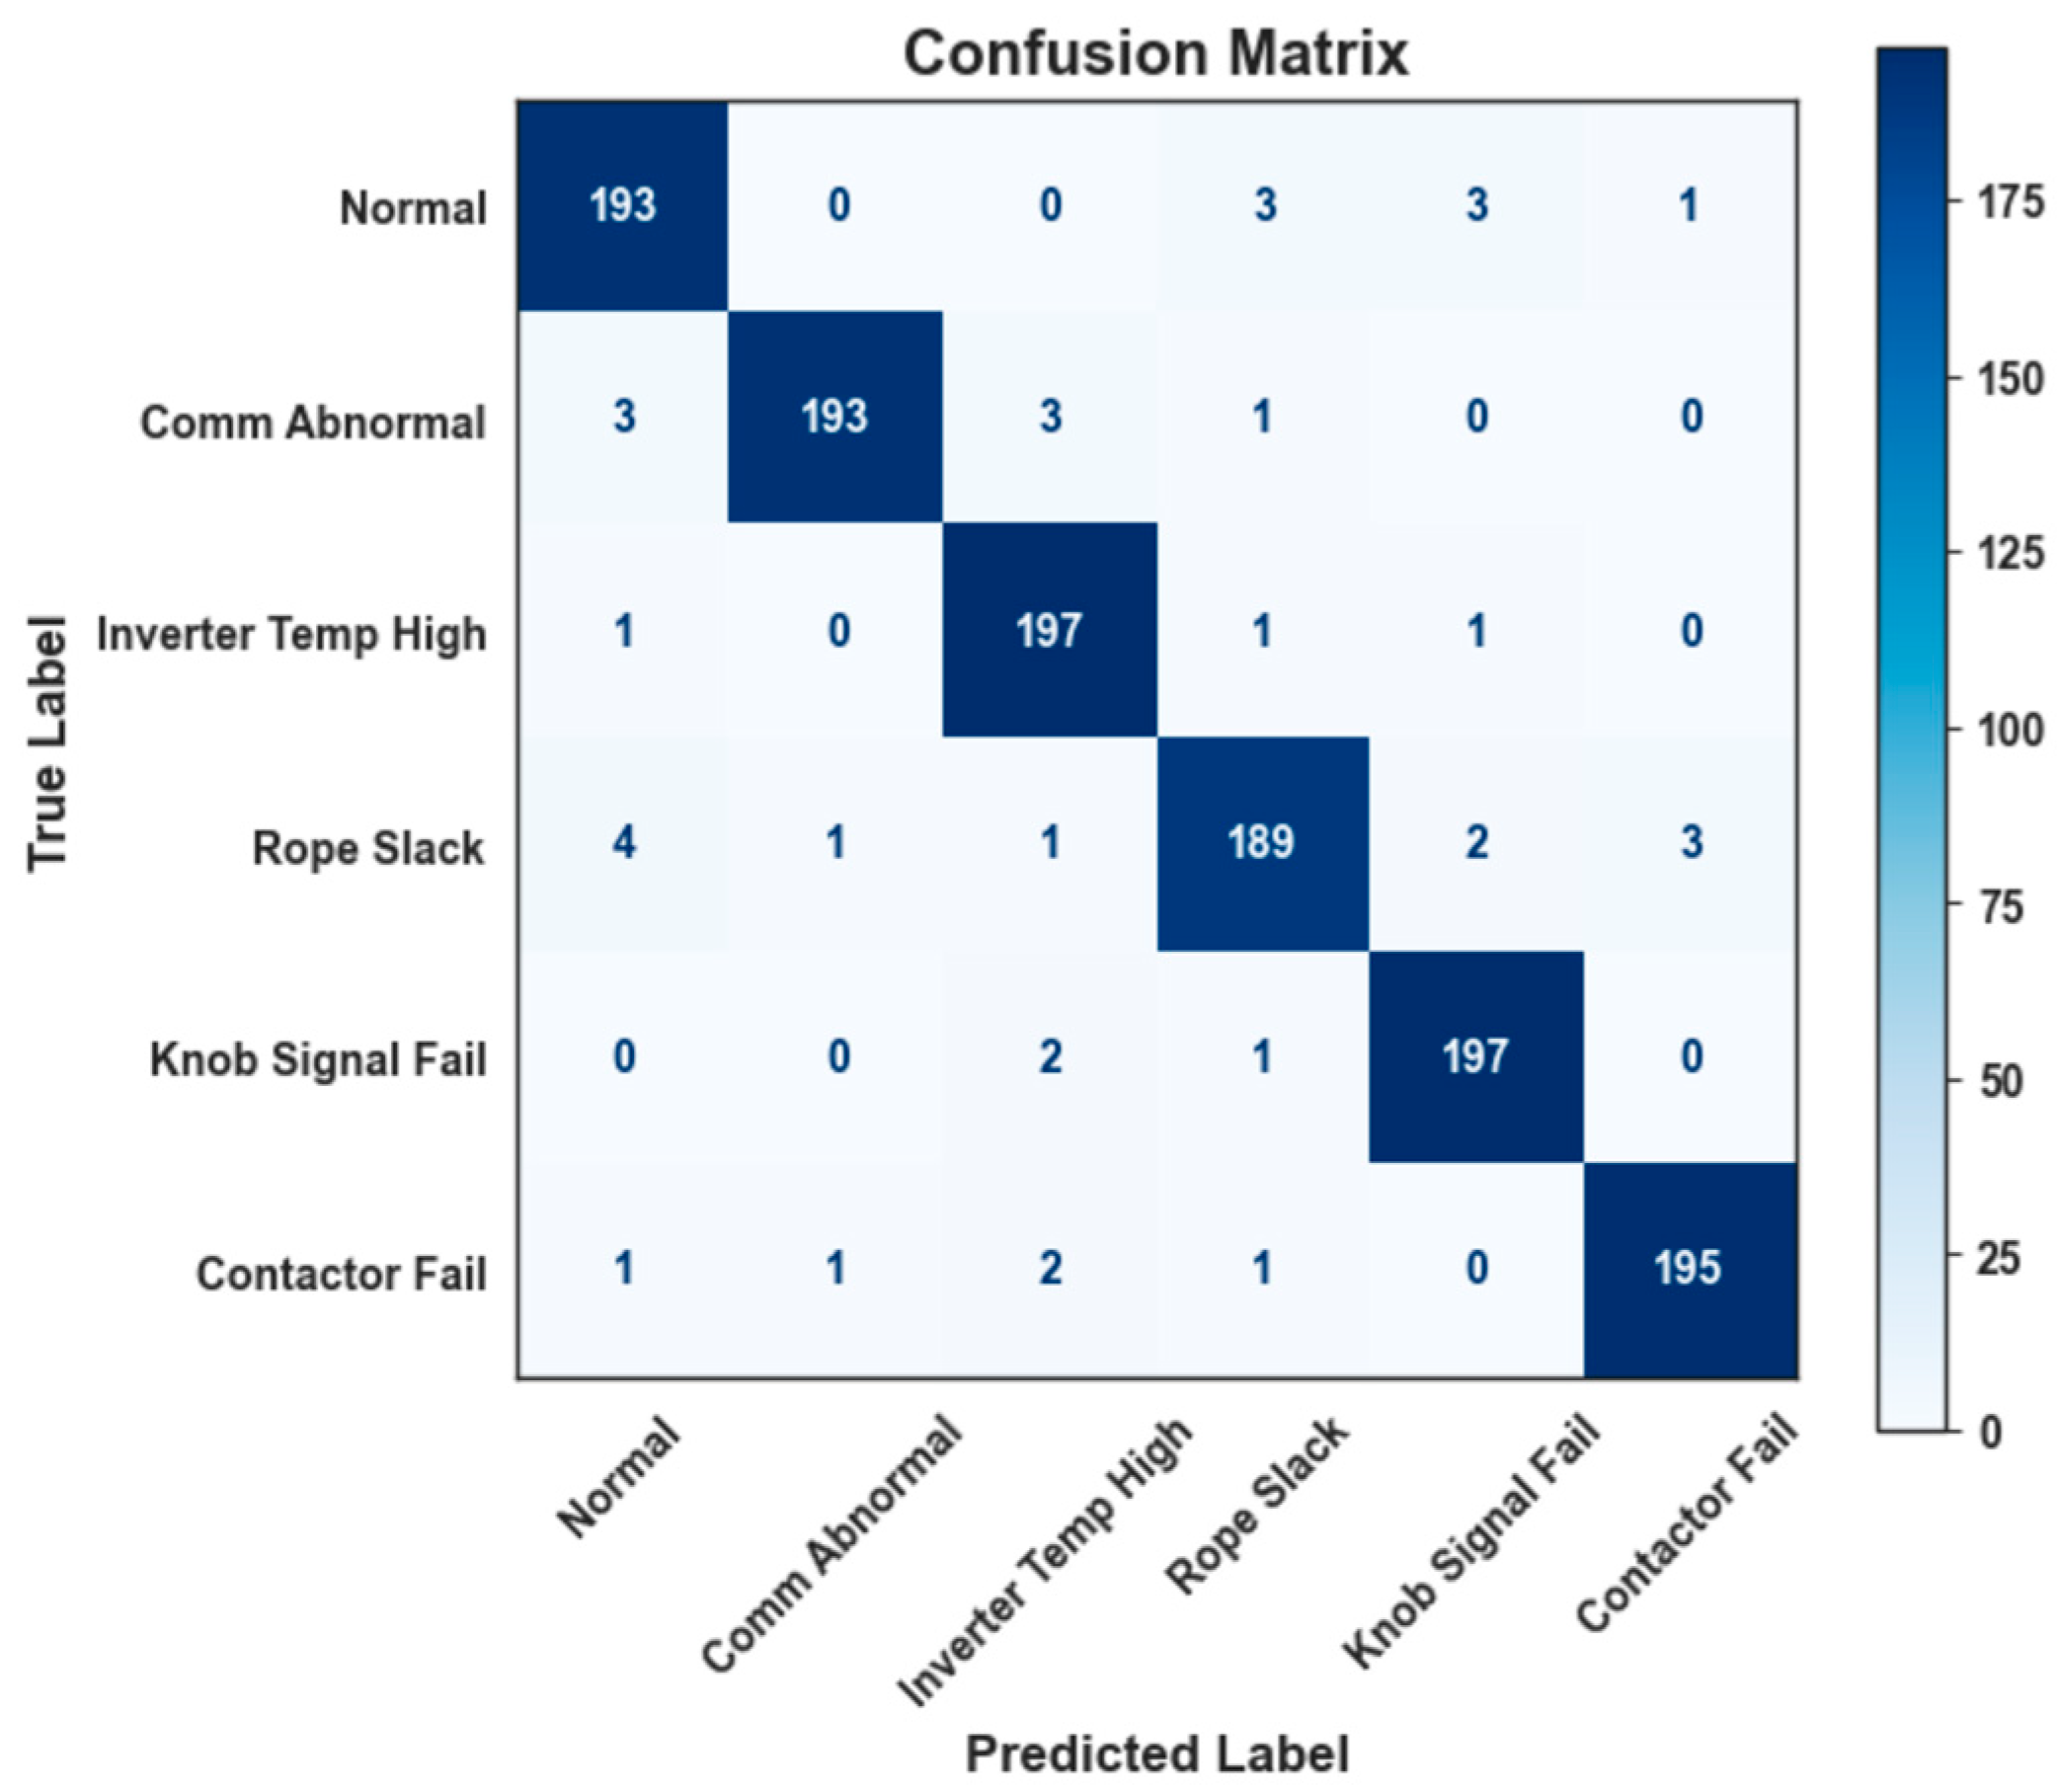
The fault recognition capability of the diagnostic model proposed in Section 2.2 was evaluated using a simulated dataset, as shown in Figure 7.
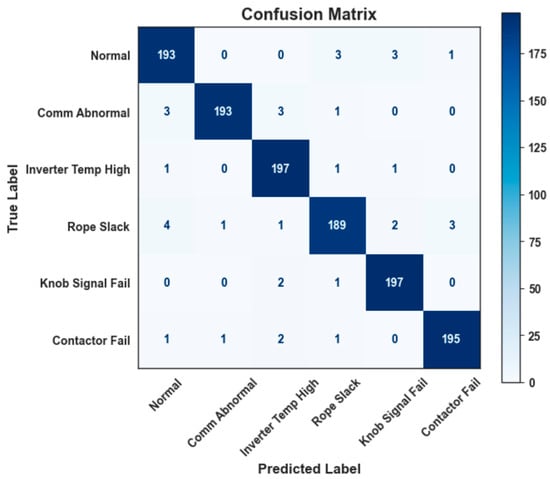
Figure 7.
Confusion matrix.
Figure 7 shows the confusion matrix between the predicted category of the model and the true category of the sample in the simulated diagnosis. From Figure 7, it can be seen that the values of the main diagonal elements of the matrix are much higher than those of the non-diagonal elements, indicating that the model has very high recognition accuracy for all six categories. For example, for categories such as “normal operation” and “contactor failure”, the vast majority of samples are correctly classified. A small number of values on non-diagonal lines reveal confusion in the model. A small number of samples in category 4 were incorrectly identified as category 1, revealing a certain similarity in the selected features between these two types of faults. Overall, the diagnostic accuracy reached 97%, verifying both the feasibility and effectiveness of this diagnostic framework.
3.3.2. Feature Effectiveness Analysis
To comprehensively evaluate the capability of the selected feature set in distinguishing different fault categories, t-distributed Stochastic Neighbor Embedding (t-SNE) was employed to reduce the dimensionality of the high-dimensional feature data, and the visualization results in the 2D space are presented in Figure 8.
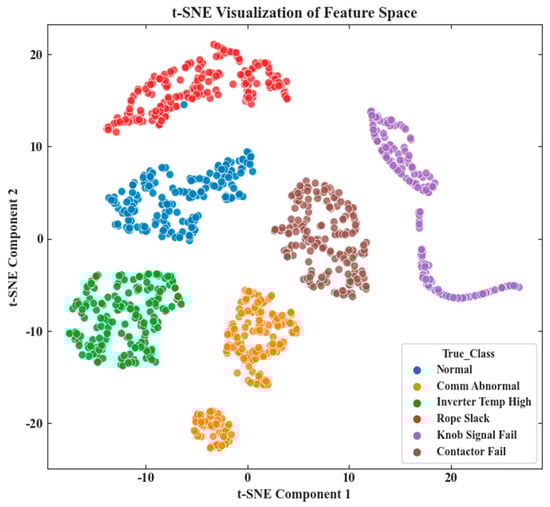
Figure 8.
t-SNE visualization of the feature space.
In Figure 8, each point represents a data sample, and the color corresponds to its true category label. It can be observed that the sample points of different categories tend to form relatively independent clusters in the two-dimensional space. The cluster of “normal operation” (blue dots) has good discrimination from the clusters of other fault categories. Most fault categories, such as “contactor failure” and “rope slack”, have also formed unique clustering areas. Overall, the t-SNE visualization results indicate that based on the selected features in this paper, different fault categories and normal states have good separability in the feature space, which further supports the conclusion that the proposed diagnostic model can achieve high accuracy.
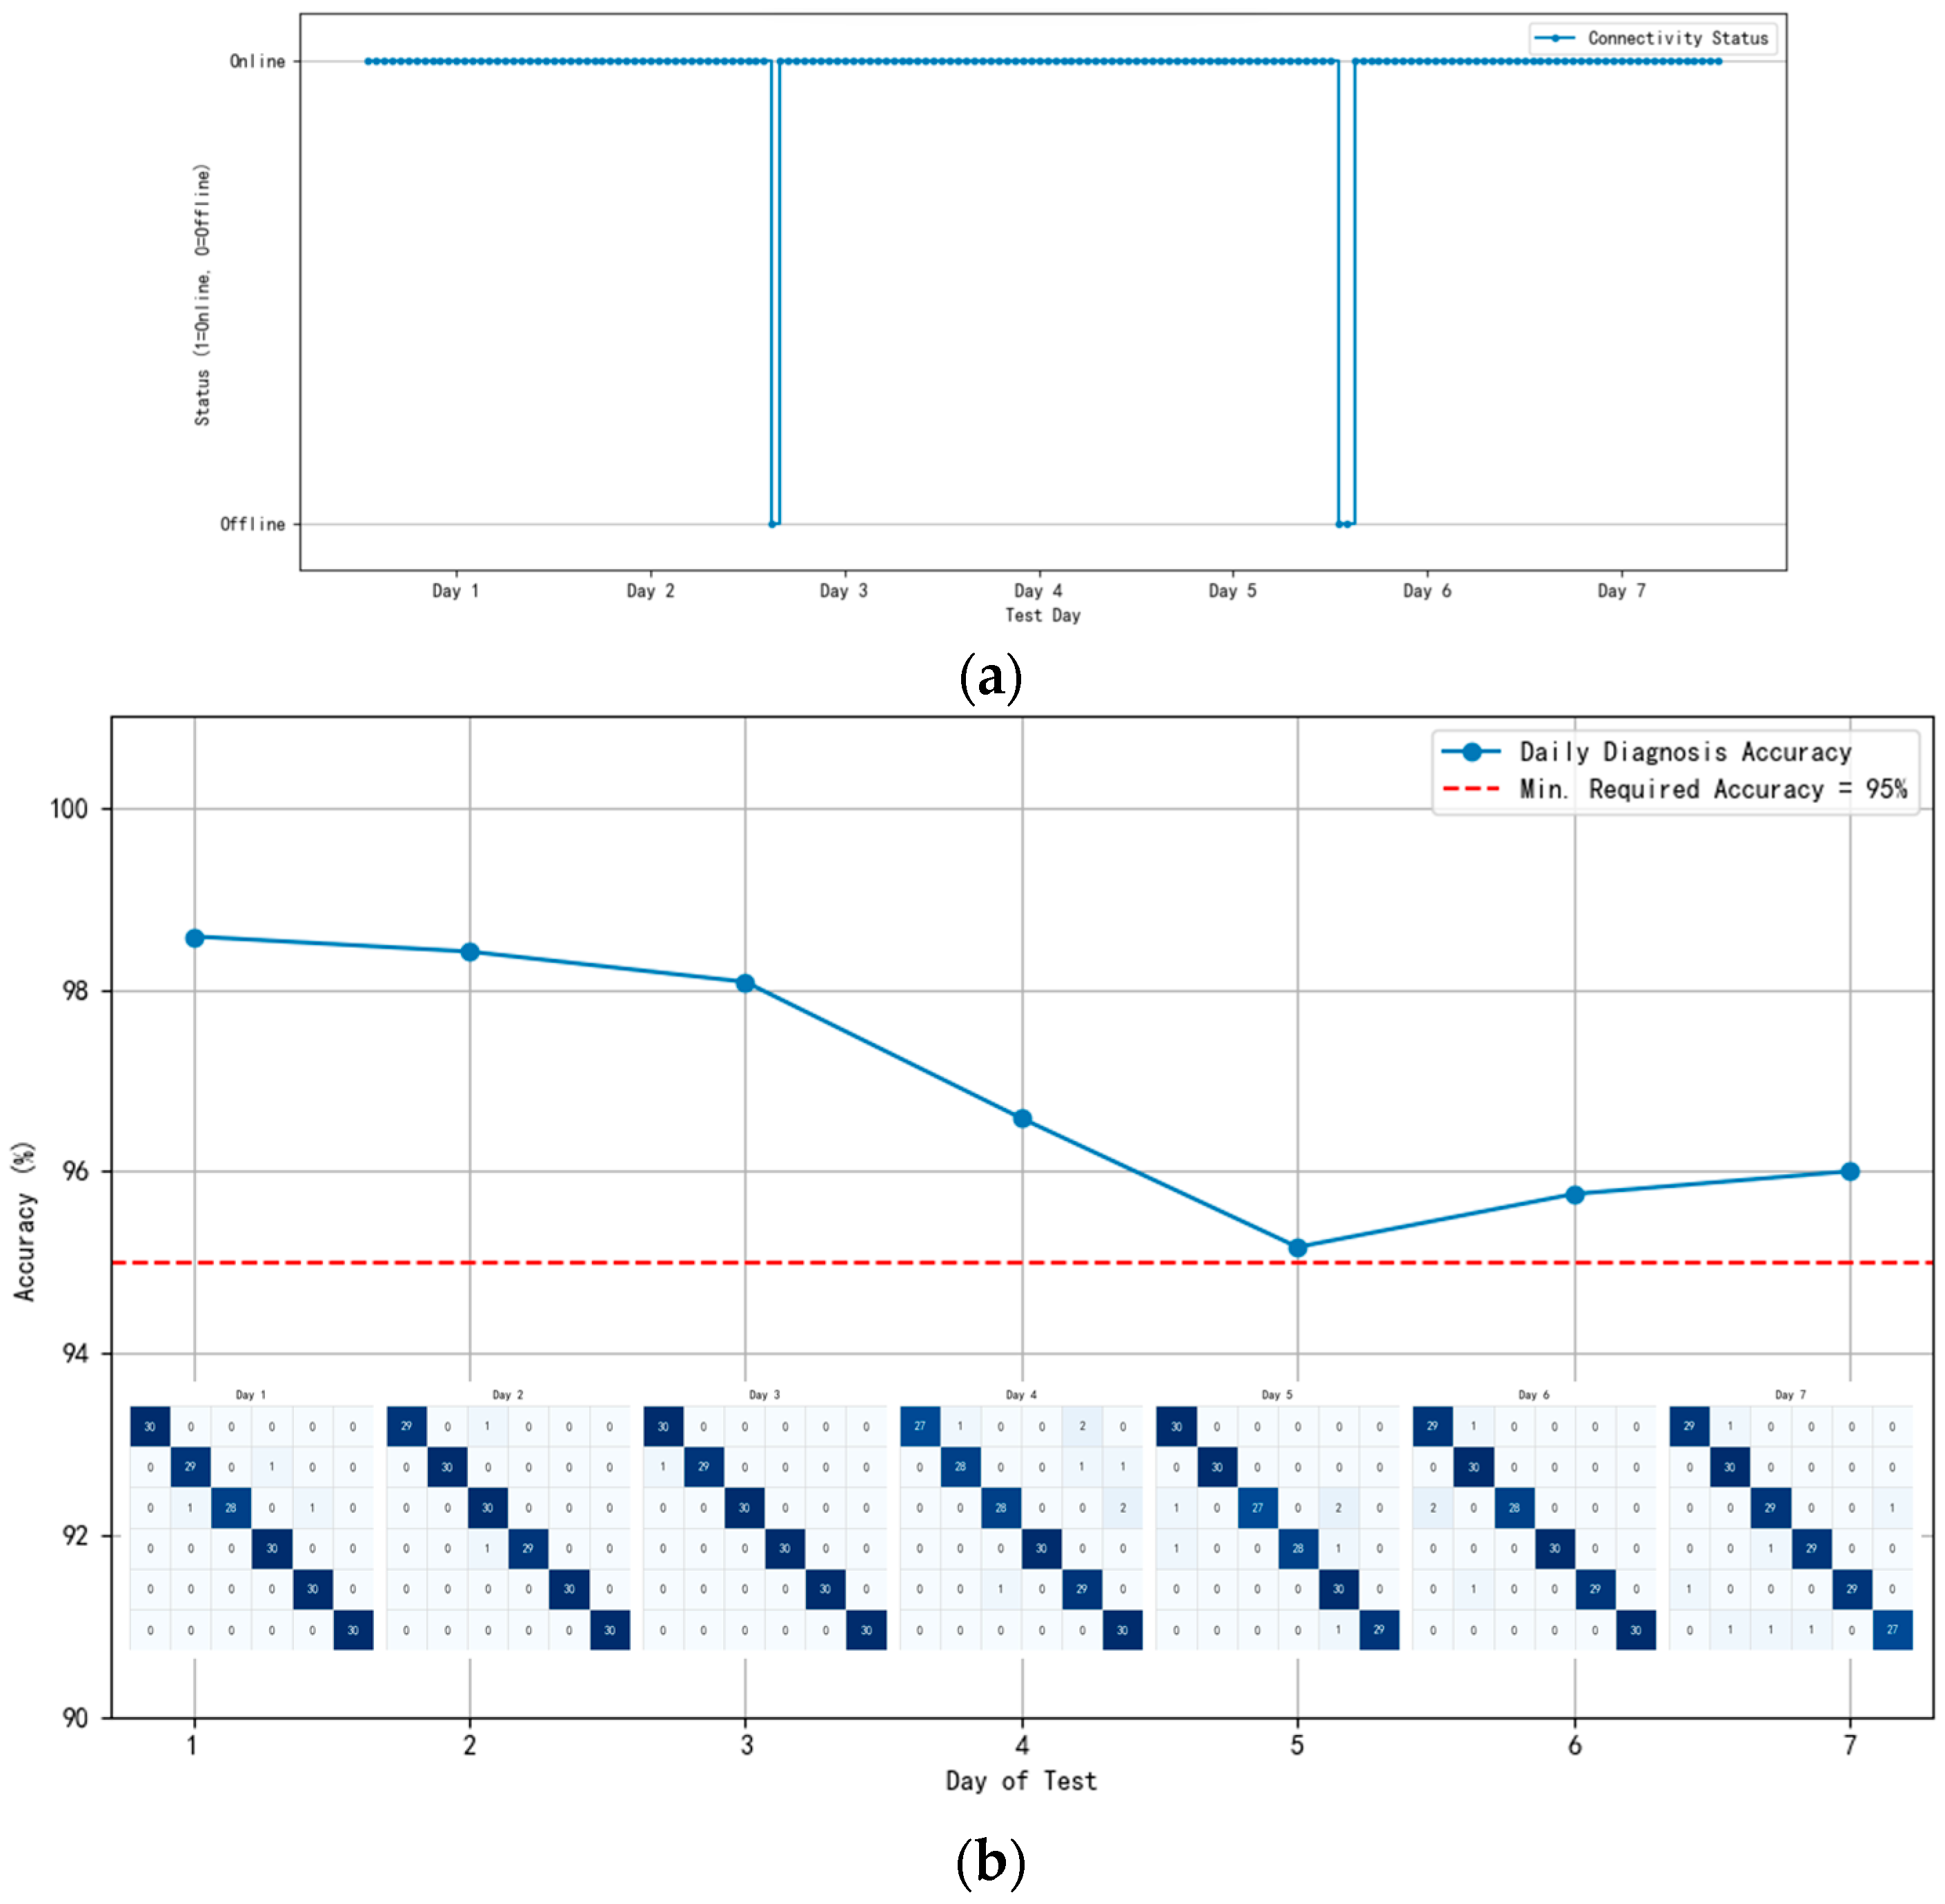
3.3.3. Stability Analysis
To evaluate the long-term operational reliability of the system, a 7-day continuous simulation test was conducted. The stability of its connection is shown in Figure 9a, and based on this, the performance stability of the diagnostic model during long-term operation was further evaluated. In the test, the 7-day simulation process was divided into seven time windows, and the comprehensive recognition accuracy of the diagnostic model for all states (normal and various types of faults) within each window was independently calculated. The result is shown in Figure 9b.
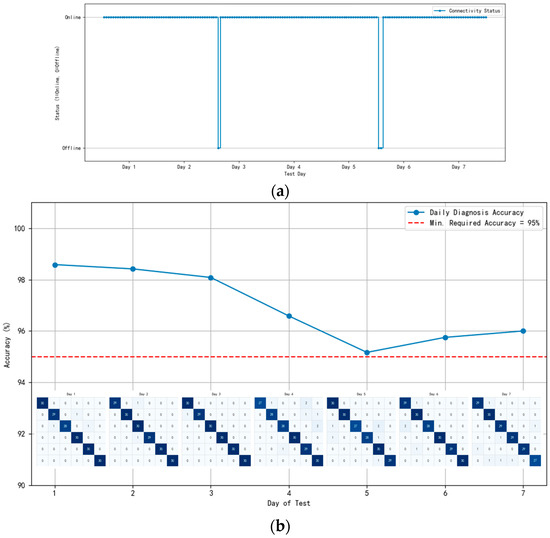
Figure 9.
(a) Simulated system connectivity over 7days. (b) Simulated diagnosis accuracy over 7 days.
The system connection status shown in Figure 9a indicates that the system maintained a high degree of connection stability during the testing period, proving its reliability as the foundation of the remote monitoring platform. From Figure 9b, it can be seen that although there was performance degradation throughout the entire 7-day testing cycle, the diagnostic accuracy of each time window remained stable at over 95%, indicating that the diagnostic model proposed in this paper not only has high overall accuracy but also exhibits good performance stability under simulated continuous operating conditions. Combining the results of Figure 9a,b, it has been verified that the system can stably transmit data and continuously provide high-precision state analysis and fault diagnosis.
4. Conclusions
In summary, based on the IoT architecture, this article has achieved the acquisition and storage of complex multi-source data for BMUs. On this basis, the system integrates expert-system prior knowledge with real-time operational data, establishing multi-source relational association rules based on operational data and fault samples, thereby enhancing its real-time CM and fault diagnosis capabilities. An integrated test system with multiple BMUs was constructed, and the test dataset extracted from it was used to evaluate the system’s real-time fault recognition rate, achieving 97% accuracy as measured by a confusion matrix. Furthermore, simulated continuous operation tests were conducted to assess the system’s stability in analyzing BMU operational and fault states.
The development of this system not only enhances the efficiency and accuracy of real-time CM and fault diagnosis for BMUs but also lays a solid foundation for the practical implementation of intelligent maintenance in BMU applications. The real-time fault diagnosis method, which preprocesses complex multi-source data relationships of BMUs through an IoT architecture and integrates expert-system prior knowledge with real-time operational data, provides novel technical approaches and solutions for this field.
While the system has achieved its initial objectives, certain limitations remain. The system could be enhanced through two key aspects:
- (1)
- Although this study proposes IoT-based data collection to address insufficient samples, the process remains time-consuming. Future improvements could incorporate evolutionary learning mechanisms and data augmentation techniques to expand the sample size, thereby obtaining more accurate real-time data and refining the fault diagnosis correlation model.
- (2)
- The current fault diagnosis method focuses on outputting real-time status results and root cause analysis for BMU but lacks preventive recommendations. The system could integrate multi-axis force sensors and machine learning algorithms to analyze structural wear, enabling predictive maintenance strategies and establishing a comprehensive intelligent maintenance framework for BMUs.
Author Contributions
Validation, R.S.; Data curation, K.L.; Writing—original draft, B.D.; Writing—review & editing, B.D., K.L., C.L. and R.S.; Project administration, C.L.; Funding acquisition, C.L. All authors have read and agreed to the published version of the manuscript.
Funding
This work was financially supported by the National Natural Science Foundation of China (No. 51465035) and the Natural Science Foundation of Gansu Province of China (No. 20JR5RA466).
Institutional Review Board Statement
Not applicable.
Informed Consent Statement
Not applicable.
Data Availability Statement
The data that support the findings of this study are available from the corresponding author upon reasonable request.
Acknowledgments
The authors would like to thank the anonymous reviewers for the insightful discussions.
Conflicts of Interest
The authors declare no conflicts of interest.
Abbreviations
The following abbreviations are used in this manuscript:
| IOT | Internet of Things |
| BMUs | Building Maintenance Units |
| TCP/IP | Transmission Control Protocol/Internet Protocol |
| MQTT | Message Queuing Telemetry Transport |
| API | Application Programming Interface |
| KD | Knowledge Driven |
| DD | Data-Driven |
| CM | Condition Monitoring |
| FD | Fault Diagnosis |
| MASs | Multi-Agent Systems |
| HVAC | Heating, Ventilation and Air Conditioning |
| OAMP | Orthogonal Approximate Message Passing |
| JSON | JavaScript Object Notation |
| PLC | Programmable Logic Controller |
| HMI | Human Machine Interface |
References
- Lee, Y.S.; Kim, S.H.; Gil, M.S.; Lee, S.H.; Kang, M.S.; Jang, S.H.; Yu, B.H.; Ryu, B.G.; Hong, D.; Han, C.S. The study on the integrated control system for curtain wall building facade cleaning robot. Autom. Constr. 2018, 94, 39–46. [Google Scholar] [CrossRef]
- Fang, X.; Yang, X.; Xing, X.; Wang, J.; Umer, W.; Guo, W. Real-Time Monitoring of Mental Fatigue of Construction Workers Using Enhanced Sequential Learning and Timeliness. Autom. Constr. 2024, 159, 105267. [Google Scholar] [CrossRef]
- NU Ahmed, Optimal control and stabilization of building maintenance units based on minimum principle. J. Ind. Manag. Optim. 2021, 17, 1713–1727. [CrossRef]
- Pandithawatta, S.; Ahn, S.; Rameezdeen, R.; Chow, C.W.K.; Gorjian, N. Systematic Literature Review on Knowledge-Driven Approaches for Construction Safety Analysis and Accident Prevention. Buildings 2024, 14, 3403. [Google Scholar] [CrossRef]
- AlShorman, O.; Irfan, M.; Abdelrahman, R.E.; Masadeh, M.; Alshorman, A.; Sheikh, M.A.; Saad, N.; Rahman, S. Advancements in condition monitoring and fault diagnosis of rotating machinery: A comprehensive review of image-based intelligent techniques for induction motors. Eng. Appl. Artif. Intell. 2024, 130, 107724. [Google Scholar] [CrossRef]
- Cai, S.; Ma, Z.; Skibniewski, M.J.; Bao, S. Construction automation and robotics for high-rise buildings over the past decades: A comprehensive review. Adv. Eng. Inform. 2019, 42, 100989. [Google Scholar] [CrossRef]
- Es-sakali, N.; Zoubir, Z.; Kaitouni, S.I.; Mghazli, M.O.; Cherkaoui, M.; Pfafferott, J. Advanced predictive maintenance and fault diagnosis strategy for enhanced HVAC efficiency in buildings. Appl. Therm. Eng. 2024, 254, 123910. [Google Scholar] [CrossRef]
- Sahu, A.R.; Palei, S.K.; Mishra, A. Data-driven fault diagnosis approaches for industrial equipment: A review. Expert Syst. 2024, 41, e13360. [Google Scholar] [CrossRef]
- Yan, R.; Zhou, Z.; Shang, Z.; Wang, Z.; Hu, C.; Li, Y.; Yang, Y.; Chen, X.; Gao, R.X. Knowledge Driven Machine Learning Towards Interpretable Intelligent Prognostics and Health Management: Review and Case Study. Chin. J. Mech. Eng. 2025, 38, 5. [Google Scholar] [CrossRef]
- Hasan, S.M.; Lee, K.; Moon, D. Augmented reality and digital twin system for interaction with construction machinery. J. Asian Archit. Build. Eng. 2022, 21, 564–574. [Google Scholar] [CrossRef]
- Narasimhan, S.; Biswas, G. Model-based diagnosis of hybrid systems. IEEE Trans. Syst. Man Cybern.-Part A Syst. Hum. 2007, 37, 348–361. [Google Scholar] [CrossRef]
- Wilhelm, Y.; Reimann, P.; Gauchel, W.; Mitschang, B. Overview on hybrid approaches to fault detection and diagnosis: Combining data-driven, physics-based and knowledge-based models. Procedia Cirp 2021, 99, 278–283. [Google Scholar] [CrossRef]
- Li, R.; Jiang, B.; Zong, Y.; Lu, N.; Guo, L. Distributed Fault Diagnosis for Heterogeneous Multiagent Systems: A Hybrid Knowledge-Based and Data-Driven Method. IEEE Trans. Fuzzy Syst. 2024, 32, 4940–4949. [Google Scholar] [CrossRef]
- Hassanpour, H.; Hamedi, A.H.; Mhaskar, P.; House, J.M.; Salsbury, T.I. A hybrid clustering approach integrating first-principles knowledge with data for fault detection in HVAC systems. Comput. Chem. Eng. 2024, 187, 108717. [Google Scholar] [CrossRef]
- Li, H.; He, Y.; Zheng, S.; Zhou, F.; Yang, H. Dual-Driven Learning-Based Multiple-Input Multiple-Output Signal Detection for Unmanned Aerial Vehicle Air-to-Ground Communications. Drones 2024, 8, 180. [Google Scholar] [CrossRef]
- Wang, Y.; Yin, M.; Wang, H.; Ye, X.; Ma, X. Sample-Evaluation-Enhanced Machine Learning Approach for Fault Diagnosis of Hybrid Systems. IEEE Trans. Instrum. Meas. 2024, 73, 3527313. [Google Scholar] [CrossRef]
- Peng, J.; Andreas, K.; Wang, D.; Niu, Z.; Zhi, F.; Wang, J.; Liu, X.; Ovtcharova, J. A systematic review of data-driven approaches to fault diagnosis and early warning. J. Intell. Manuf. 2023, 34, 3277–3304. [Google Scholar]
- Cheng, Y.; Gu, H.; Suo, M. A normal-fault sample translator for fault diagnosis with insufficient fault samples. Expert Syst. Appl. 2025, 266, 126109. [Google Scholar] [CrossRef]
- Gupta, V.; Sharma, M.; Pachauri, R.; Babu, K.D. Performance analysis of solar PV system using customize wireless data acquisition system and novel cleaning technique. Energy Sources Part A Recovery Util. Environ. Eff. 2022, 44, 2748–2769. [Google Scholar] [CrossRef]
- Yousuf, M.; Alsuwian, T.; Amin, A.A.; Fareed, S.; Hamza, M. IoT-based health monitoring and fault detection of industrial AC induction motor for efficient predictive maintenance. Meas. Control. 2024, 57, 1146–1160. [Google Scholar] [CrossRef]
- Jacome, F.; Andagoya-Alba, L.D.; Osorio, H.; Paredes, E. Real-time fault identification of photovoltaic systems based on remote monitoring with IoT. Int. J. Electr. Comput. Eng. Syst. 2024, 15, 225–234. [Google Scholar] [CrossRef]
- Lu, X.; Lu, Y.; Luo, L.; Lin, W.; Zhang, J. Remote data acquisition and management technology of power equipment based on Internet of Things. Mob. Inf. Syst. 2022, 2022, 3902541. [Google Scholar] [CrossRef]
- Hirsch, V.; Reimann, P.; Mitschang, B. Data-Driven Fault Diagnosis in End-of-Line Testing of Complex Products. In Proceedings of the 2019 IEEE International Conference on Data Science and Advanced Analytics (DSAA), Washington, DC, USA, 5–8 October 2019; pp. 492–503. [Google Scholar]
- Yusri, I.K. Solar panel remote monitoring and control system on miniature weather stations based on web server and ESP32. Int. J. Recent Technol. Appl. Sci. 2020, 2, 1–24. [Google Scholar]
- Li, W.J.; Li, H.; Gu, S.; Chen, T. Process fault diagnosis with model- and knowledge-based approaches: Advances and opportunities. Buildings 2020, 105, 104637. [Google Scholar] [CrossRef]
- Nayeri, M.R.; Araabi, B.N.; Yazdanpanah, M.; Moshiri, B. Design, implementation and evaluation of an expert system for operating regime detection in industrial gas turbine. Expert Syst. Appl. 2022, 203, 117332. [Google Scholar] [CrossRef]
- Motawa, I.; Almarshad, A. A knowledge-based BIM system for building maintenance. Autom. Constr. 2013, 29, 173–182. [Google Scholar] [CrossRef]
- Farooqi, N. Tackling Approach for Transferring Database to Knowledge Base via Practical Algorithm. Life Sci. J. 2019, 16, 6. [Google Scholar]
- Van Glabbeek, R.; Deac, D.; Perale, T.; Steenhaut, K.; Braeken, A. Flexible and Efficient Security Framework for Many-to-Many Communication in a Publish/Subscribe Architecture. Sensors 2022, 22, 7391. [Google Scholar] [CrossRef]


Disclaimer/Publisher’s Note: The statements, opinions and data contained in all publications are solely those of the individual author(s) and contributor(s) and not of MDPI and/or the editor(s). MDPI and/or the editor(s) disclaim responsibility for any injury to people or property resulting from any ideas, methods, instructions or products referred to in the content. |
© 2025 by the authors. Licensee MDPI, Basel, Switzerland. This article is an open access article distributed under the terms and conditions of the Creative Commons Attribution (CC BY) license (https://creativecommons.org/licenses/by/4.0/).