Abstract
The focus of this work is on the relationship between the quantitative structural characterization of bimetallic Au-Pd nanoparticles dispersed in an amorphous polymer matrix and their catalytic activity in the direct synthesis of hydrogen peroxide (DS reaction). Resonant X-ray powder diffraction with synchrotron radiation was employed to probe selectively and to reveal fine details of the structure of bimetallic nanoparticles embedded in the support. The semi-quantitative analysis of the resonant X-ray powdered diffraction data, made on a large number of metal nanoparticles, shows that in one of the polymer-supported Au-Pd catalyst for the DS reaction (P75) featured by an overall molar Pd/Au of about 5.54, the smallest metal nanoparticles (MNPs), which account for more than 99.9% of the total MNPs number and for more than 95% of the metal surface, are formed by practically pure palladium. The relative number of bimetallic alloyed nanoparticles is very small (less than 4 × 10² ppm) and they contribute to only about 2% of the total metal surface. In a second gold-enriched catalyst (P50) with an overall molar Pd/Au of 1.84, the proportion of the bimetallic alloyed nanoparticles increased to about 97% and they account for about 99% of the metal surface. As a result of the metal intermixing, the catalytic productivity for the DS reaction increased from 97 to 109 mmolH2O2/molH2, owing to the gold-promotion of palladium.
1. Introduction
Metal nanoparticles (MNPs) have received much attention for years due to their peculiar properties, which are appealing to basic sciences and innovative technologies. The complex interplay of several features provides them with unique electric, optical, magnetic, and chemical behaviors, which are determined by their composition, shape, and interaction with their local environment [1]. However, their high surface energy makes them unstable and highly reactive so that they easily oxidize and/or coalesce. To preserve their properties, their surface energy must be lowered; hence, the control of the preparation of MNPs is of the utmost importance to get reproducible materials. For this purpose, a wide range of chemical methods (bottom-up approach) is available, which generally require the aggregation of metal atoms obtained upon reduction under controlled conditions [2]. One way to stabilize MNPs against oxidation and/or coalescence is to use agents of both a molecular and macromolecular nature (capping agents and organic polymers, respectively) [3]. Among the latter ones, some have recently shown that gel-type cross-linked functional polymers (gel-type resins) are effective in the multi-gram scale preparation of MNPs [4]. In fact, on the basis of the nanometer size porosity of gel-type resins in the swollen state, we can control both the size and the size distribution of metal and metal oxide NPs through the template controlled synthesis (TCS) [5,6,7,8], thus showing that TCS is a reliable method for the preparation of very small metal particles (<10 nm) entangled within the polymer framework. Most importantly, this framework, apart from providing an efficient and reliable size and dispersion control, stabilizes the MNPs against coalescence, oxidation, and early ageing while preserving a remarkable chemical activity [9]. As a matter of fact, resins proved to be useful scaffolds for the preparation of nanostructured inorganic phases both in catalysis and material science (see, for example, [10,11,12,13,14]) and the knowledge of their morphology is important in this respect [9,15].
The great challenge in the frame of MNPs-based materials is the ability to understand and employ bimetallic systems in which the specific properties and characteristics of two different kinds of metals can be used and modulated. In several cases, bimetallic systems outperform the monometallic ones; however, very often, the specific reasons for this better behavior are not yet unequivocally understood [16,17,18]. In this regard, Au-Pd MNPs are exploited as catalysts for many reactions, such as, for example, the photoinduced generation of hydrogen molecules from water [19], oxidation of CO to CO2 [20], hydrogenation reactions [21,22], oxidation of alcohols and polyols with dioxygen [23], and direct synthesis of hydrogen peroxide (DS reaction) [24]. In several cases, Au-Pd catalysts perform better than monometallic Pd and their behavior has been widely investigated in the literature. It has been proposed that it is affected by the nature of the particles (alloys, eutectic-like, core-shell [25]) and several other experimental parameters, such as the synthetic procedure, and the composition and size of the MNPs [26,27], but the complexity of these systems prevented a single explanation for their behaviors. In particular, bimetallic Au-Pd catalysts supported on gel-type resin are promising systems both for the oxidation of aliphatic alcohols [5] and for the DS reaction [14,28,29], but a general in-depth understanding of the beneficial effect of gold has not yet been achieved.
The difficulty in the characterization of supported MNPs is multiple and arises from the presence of very small aggregates (usually less than 5 nm) embedded in an amorphous or crystalline matrix. The matrix, beneficial from the point of view of MNPs’ stabilization and size/dispersion control, heavily complicates their characterization. Standard techniques for structural characterization are not always well suited to the characterization of supported MNPs and may fail to achieve this goal. For example, the efficiency of X-ray powder diffraction (XRPD) is definitively reduced in the case of nanometer sized particles dispersed in stabilizing supports because the scattering coming from the matrix overlaps with the weak and broadened diffraction peaks from small MNPs [30]. Even transmission electron microscopy (TEM), employing the most advanced techniques, such as aberration corrected high resolution scanning transmission electron microscopy (HR-STEM), which is sensitive to the atomic numbers and is able to give quantitative information of bimetallic MNPs [31], cannot be fully exploited in the presence of a support except for the few MNPs which are sitting on the external surface of the matrix.
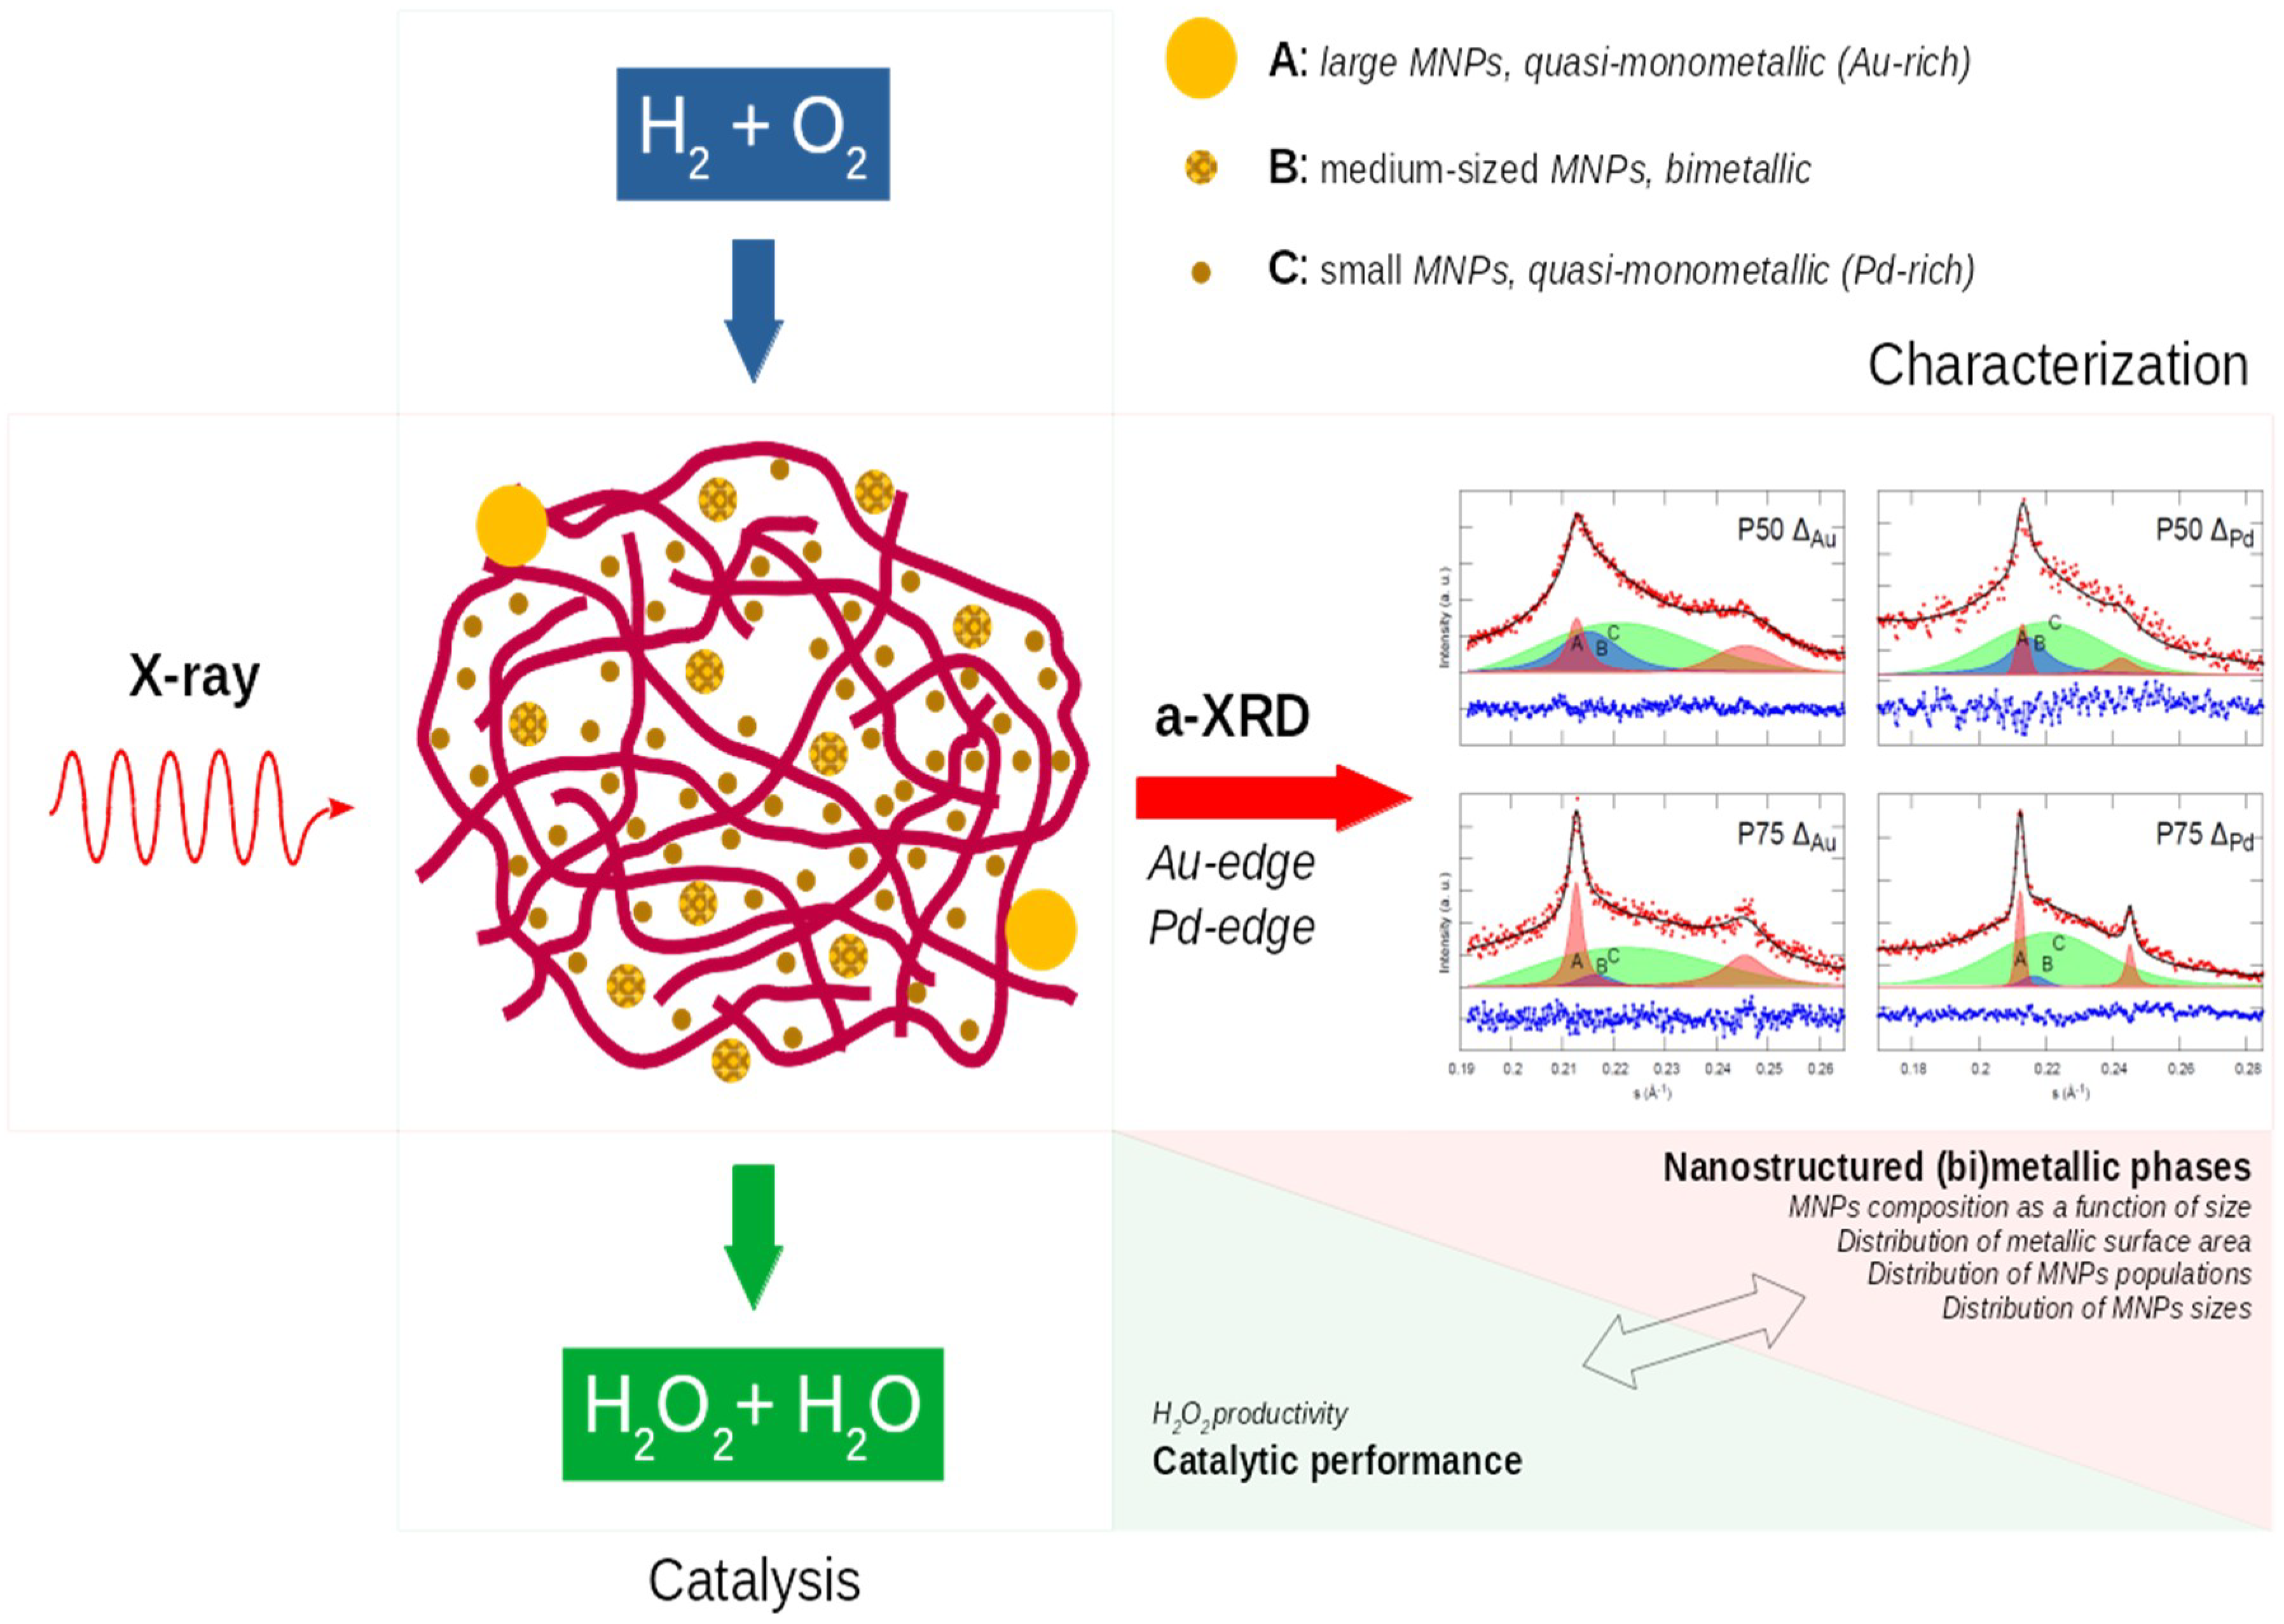
So far, based on what is reported in the literature, it is quantitatively difficult to characterize MNPs embedded in a matrix. Resonant (also called anomalous) X-ray diffraction (A-XRD) is a powerful technique often employed to selectively probe micro/nanocrystalline phases embedded in matrices [32,33,34]. Anomalous scattering is able to give information similar to the one provided by X-ray absorption measurements, but with the advantage that it is crystallographically site-selective. This technique exploits the ample variation of the anomalous scattering factor (the atomic scattering factor for the atom, j, is given by fj = f0 + f’ + if”, where f0 corresponds to the atomic scattering factor for a spherically symmetric collection of free electrons in the atom, and f’ and f” are the dispersion correction or “anomalous contributions”) [35] of a resonant atomic species close to its atomic absorption edge as a contrast factor to selectively extract its contribution to the overall scattering intensity from the sample. For this purpose, in the A-XRD experiment, the diffraction pattern is first measured with the X-ray energy tuned near (EN) the absorption edge of one of the metals in the bimetallic sample (the resonant species) and later with the X-ray energy tuned far away (EF) from the same edge. The intensity of X-rays diffracted by crystals depends on the structure factor and thus on the atomic scattering factors, fj, for each of the atoms, j, so that the intensity difference pattern, ΔI = IF − IN, contains only the peaks arising from the phases with the resonant species, because only the structure factors of the latter changed from IN to IF [36,37]. Dealing with supported metal catalysts, A-XRD is used as an efficient way to suppress the scattering of the support and to focus on the structure of the MNPs [38,39]. In the present work, we demonstrate that the A-XRD technique can be employed to highlight fine differences in the crystallographic nanophases composed of two different metals dispersed on a matrix. To our knowledge, this is the first time that this technique has been applied for the characterization and quantification of a very low concentration (less than or equal to 3 weight %) of supported MNPs. Our purpose was to shed some light on the structures of bimetallic MNPS and to correlate them with the catalytic activity. The overall strategy of the investigation is plotted in Scheme 1.
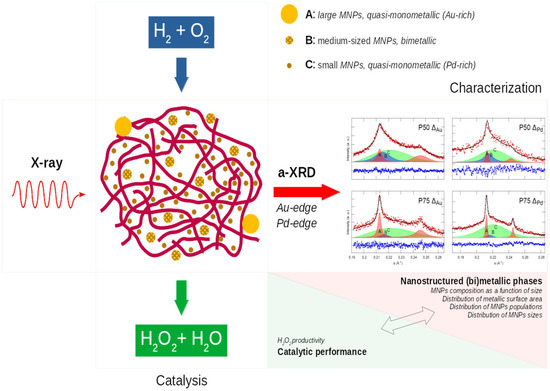
Scheme 1.
Overall strategy of the investigation provided in this article.
2. Results and Discussion
Two Au-Pd catalysts (P50: 2% Au: 2% Pd, w/w—1:1.85, mol/mol; P75: 3% Au: 3% Pd, w/w—1:5.57, mol/mol) were prepared with a two-step procedure (see Supporting Information) [5,7]. With the very same procedure, we also prepared two Au and Pd monometallic specimens. The total Au-Pd weight fraction was set to 4% for both the bimetallic samples and to 3% for the monometallic ones. The metal content of the samples was calculated from the difference of the metal concentration in the metal solution before and after the metal uptake. These bimetallic materials were employed as catalysts in the DS reaction, under non-explosive, relatively mild conditions, without the addition of any selectivity enhancer (such as mineral acids and halide ions) [40]. Although the catalytic productivity was low, this ensures that the observed performance of the catalysts depends exclusively on their intrinsic properties. The productivity of P50 and P75 materials was 109 and 97 mmolH2O2/molH2, respectively, better than a related monometallic Pd catalyst whose productivity was 64 mmolH2O2/molH2.
A-XRD measurements were performed at the BM08 beamline of the ESRF facility (Grenoble, France) [41] using an angle-dispersed set-up [42], based on a large area imaging plate detector (200 × 100 mm2), which ensured high quality/high statistics XRD patterns [33]. Glass capillaries (diameter 0.5 mm) were used as specimen holders for the powdered P50 and P75 samples. During the collection of the data, specimens were kept under rotation and continuously flushed with N2 to prevent any oxidation of the metal phases. The XRD patterns IN and IF were collected tuning the X-ray beam near (ENAu = 11,910 eV, ENPd = 24,345 eV) and far (EFAu = 11,700 eV, EFPd = 24,001 eV) from the Au LIII (EAu = 11,919 eV) and Pd K (EPd = 24,350 eV) edges.
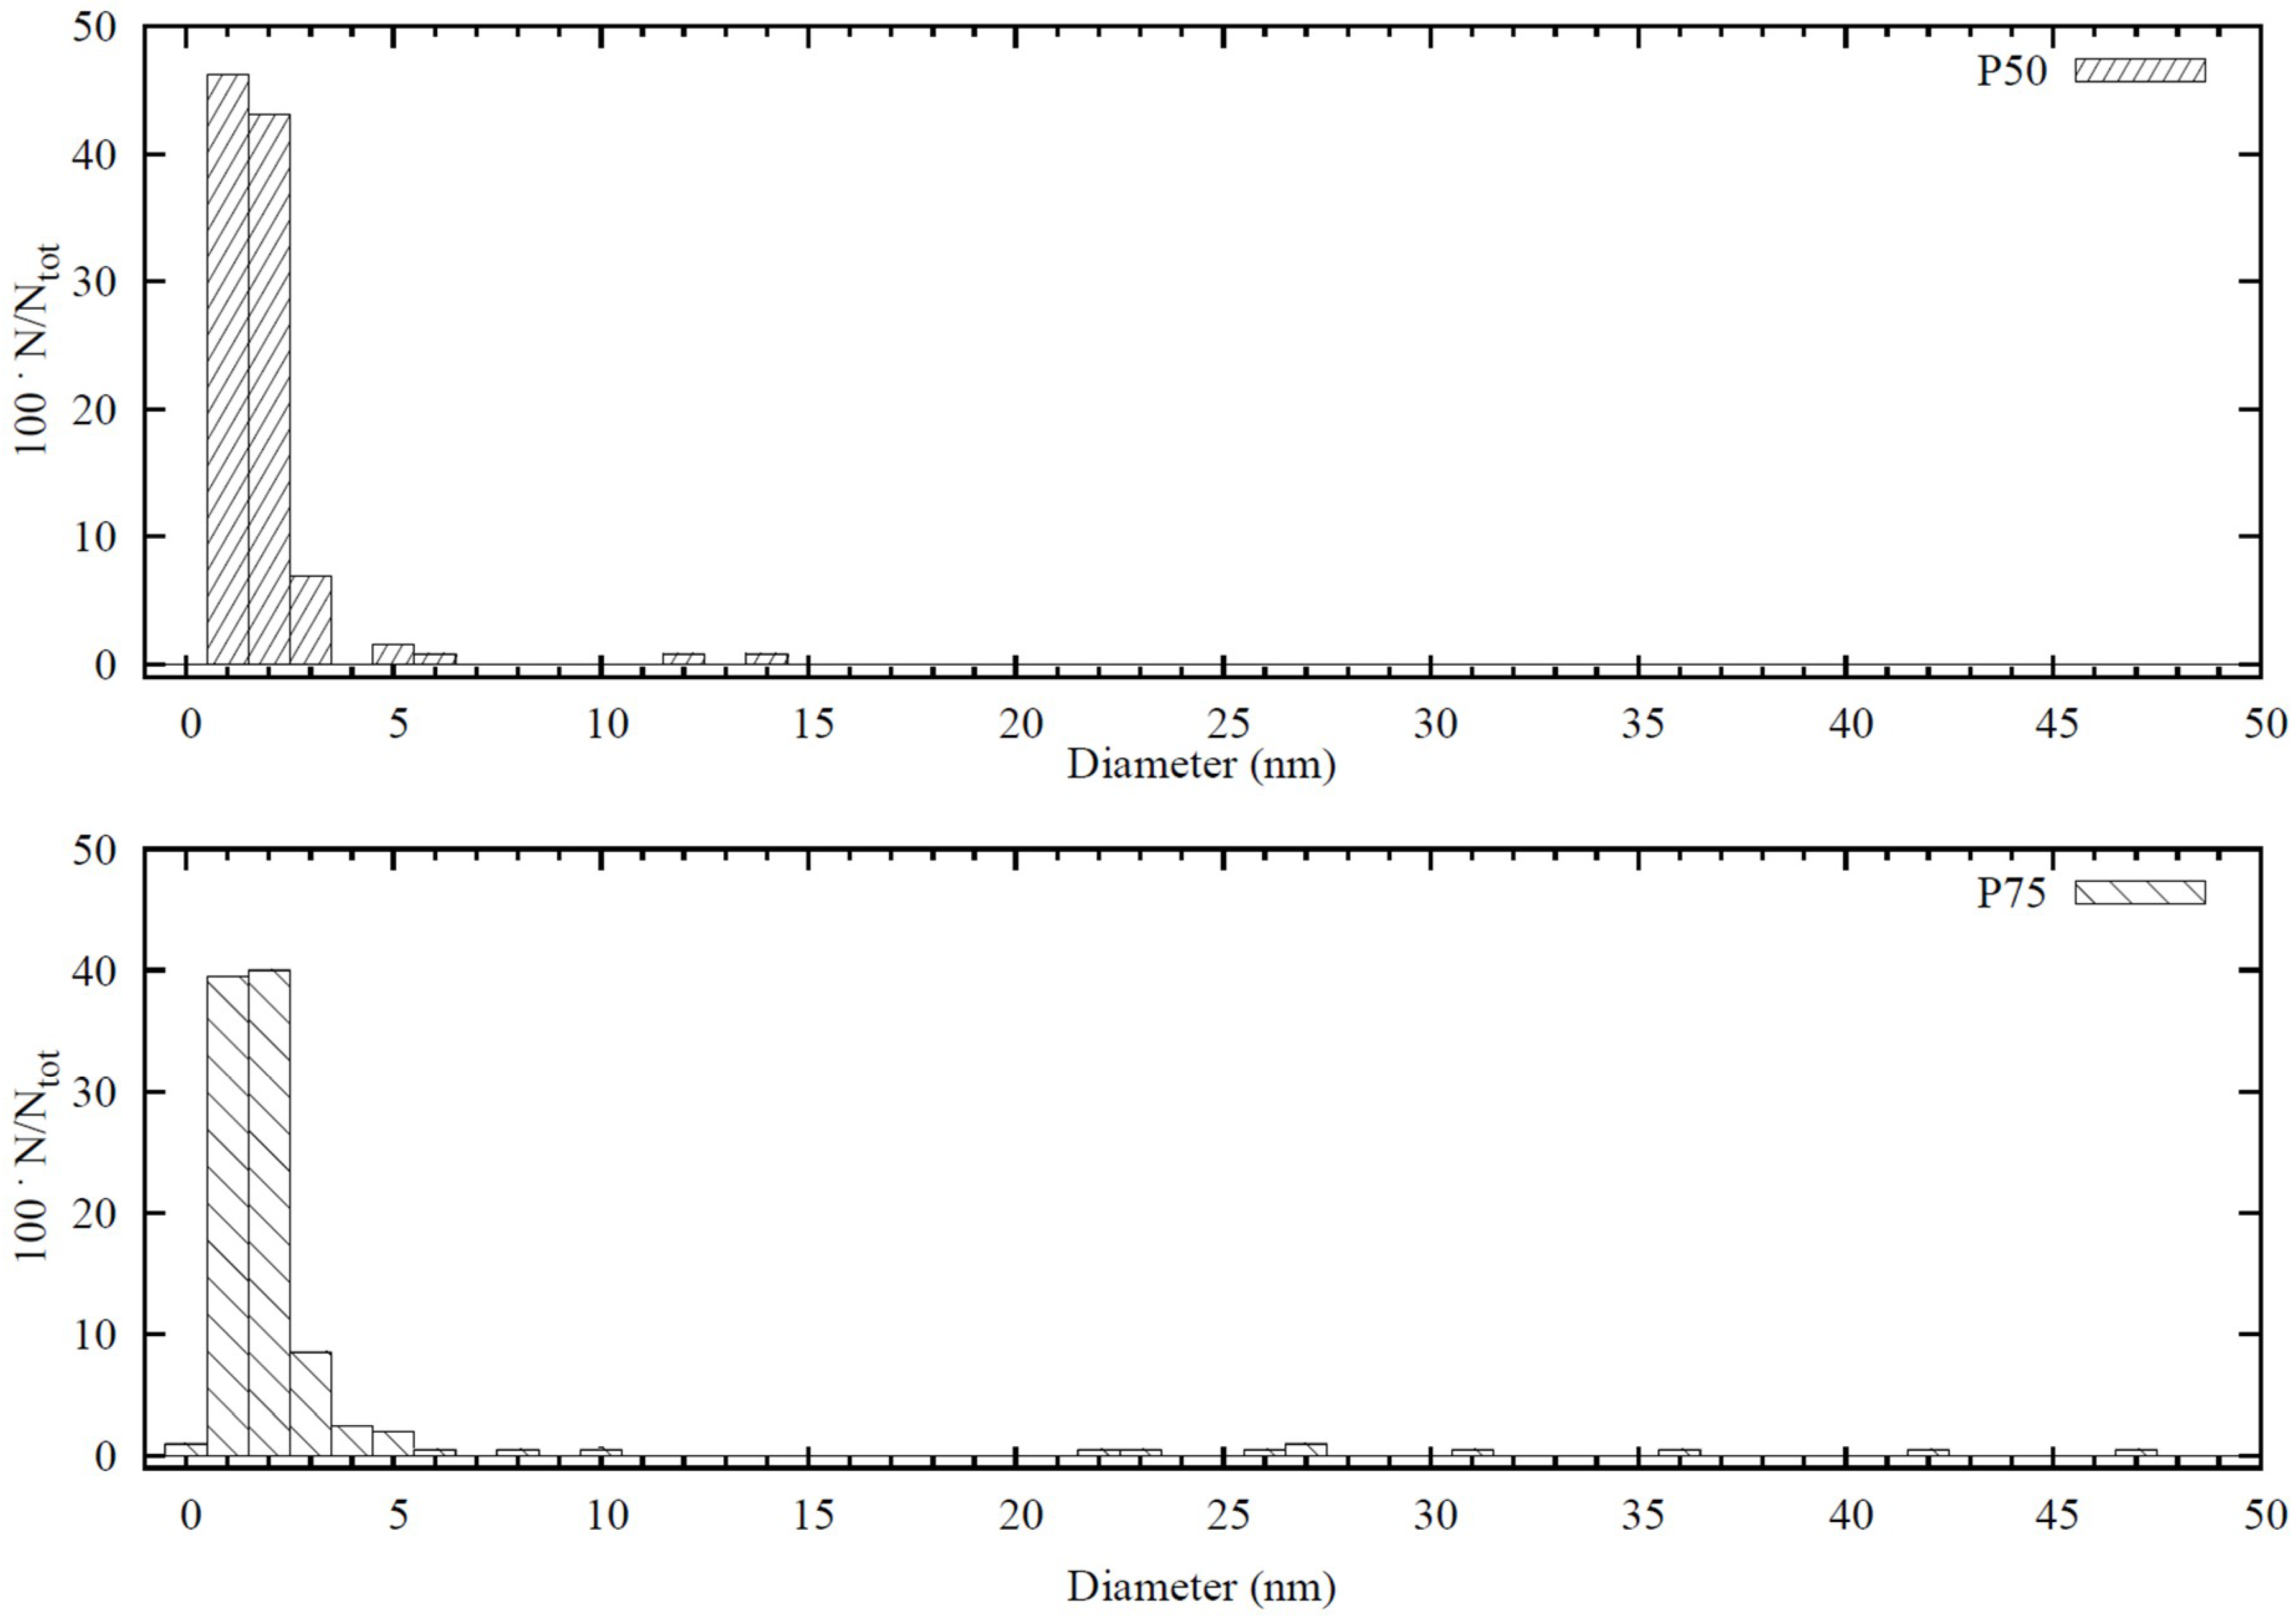
The size distribution and morphology of the MNPs in P50 and P75 were preliminary characterized by TEM and high resolution (transmission) electron microscopy (HREM). TEM images of P50 and P75 specimens (see Supporting Information and Figure S1) revealed a bimodal size distribution (Figure 1) with small (d ~ 1–2 nm) and a few medium size (10–20 nm) particles, the latter being larger in the P75 sample.
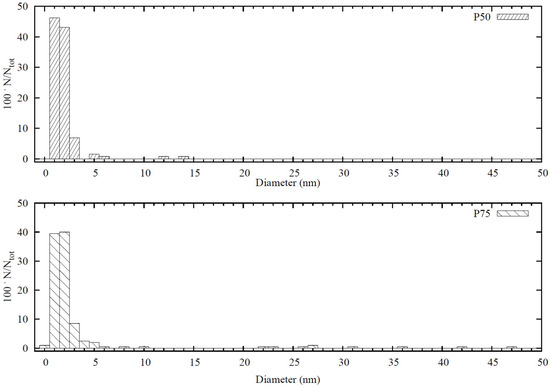
Figure 1.
Particle size distribution of P50 and P75 specimens. Very small nanoparticles (1–2 nm) and a few large clusters are present in both the specimens.
All the observed MNPs have the same crystalline fcc lattice, but the mismatch among the Au, Pd, and Au-Pd lattices is so small that TEM measurements did not provide any reliable information about the MNPs’ phase composition (JCPDS card No 04-0784).
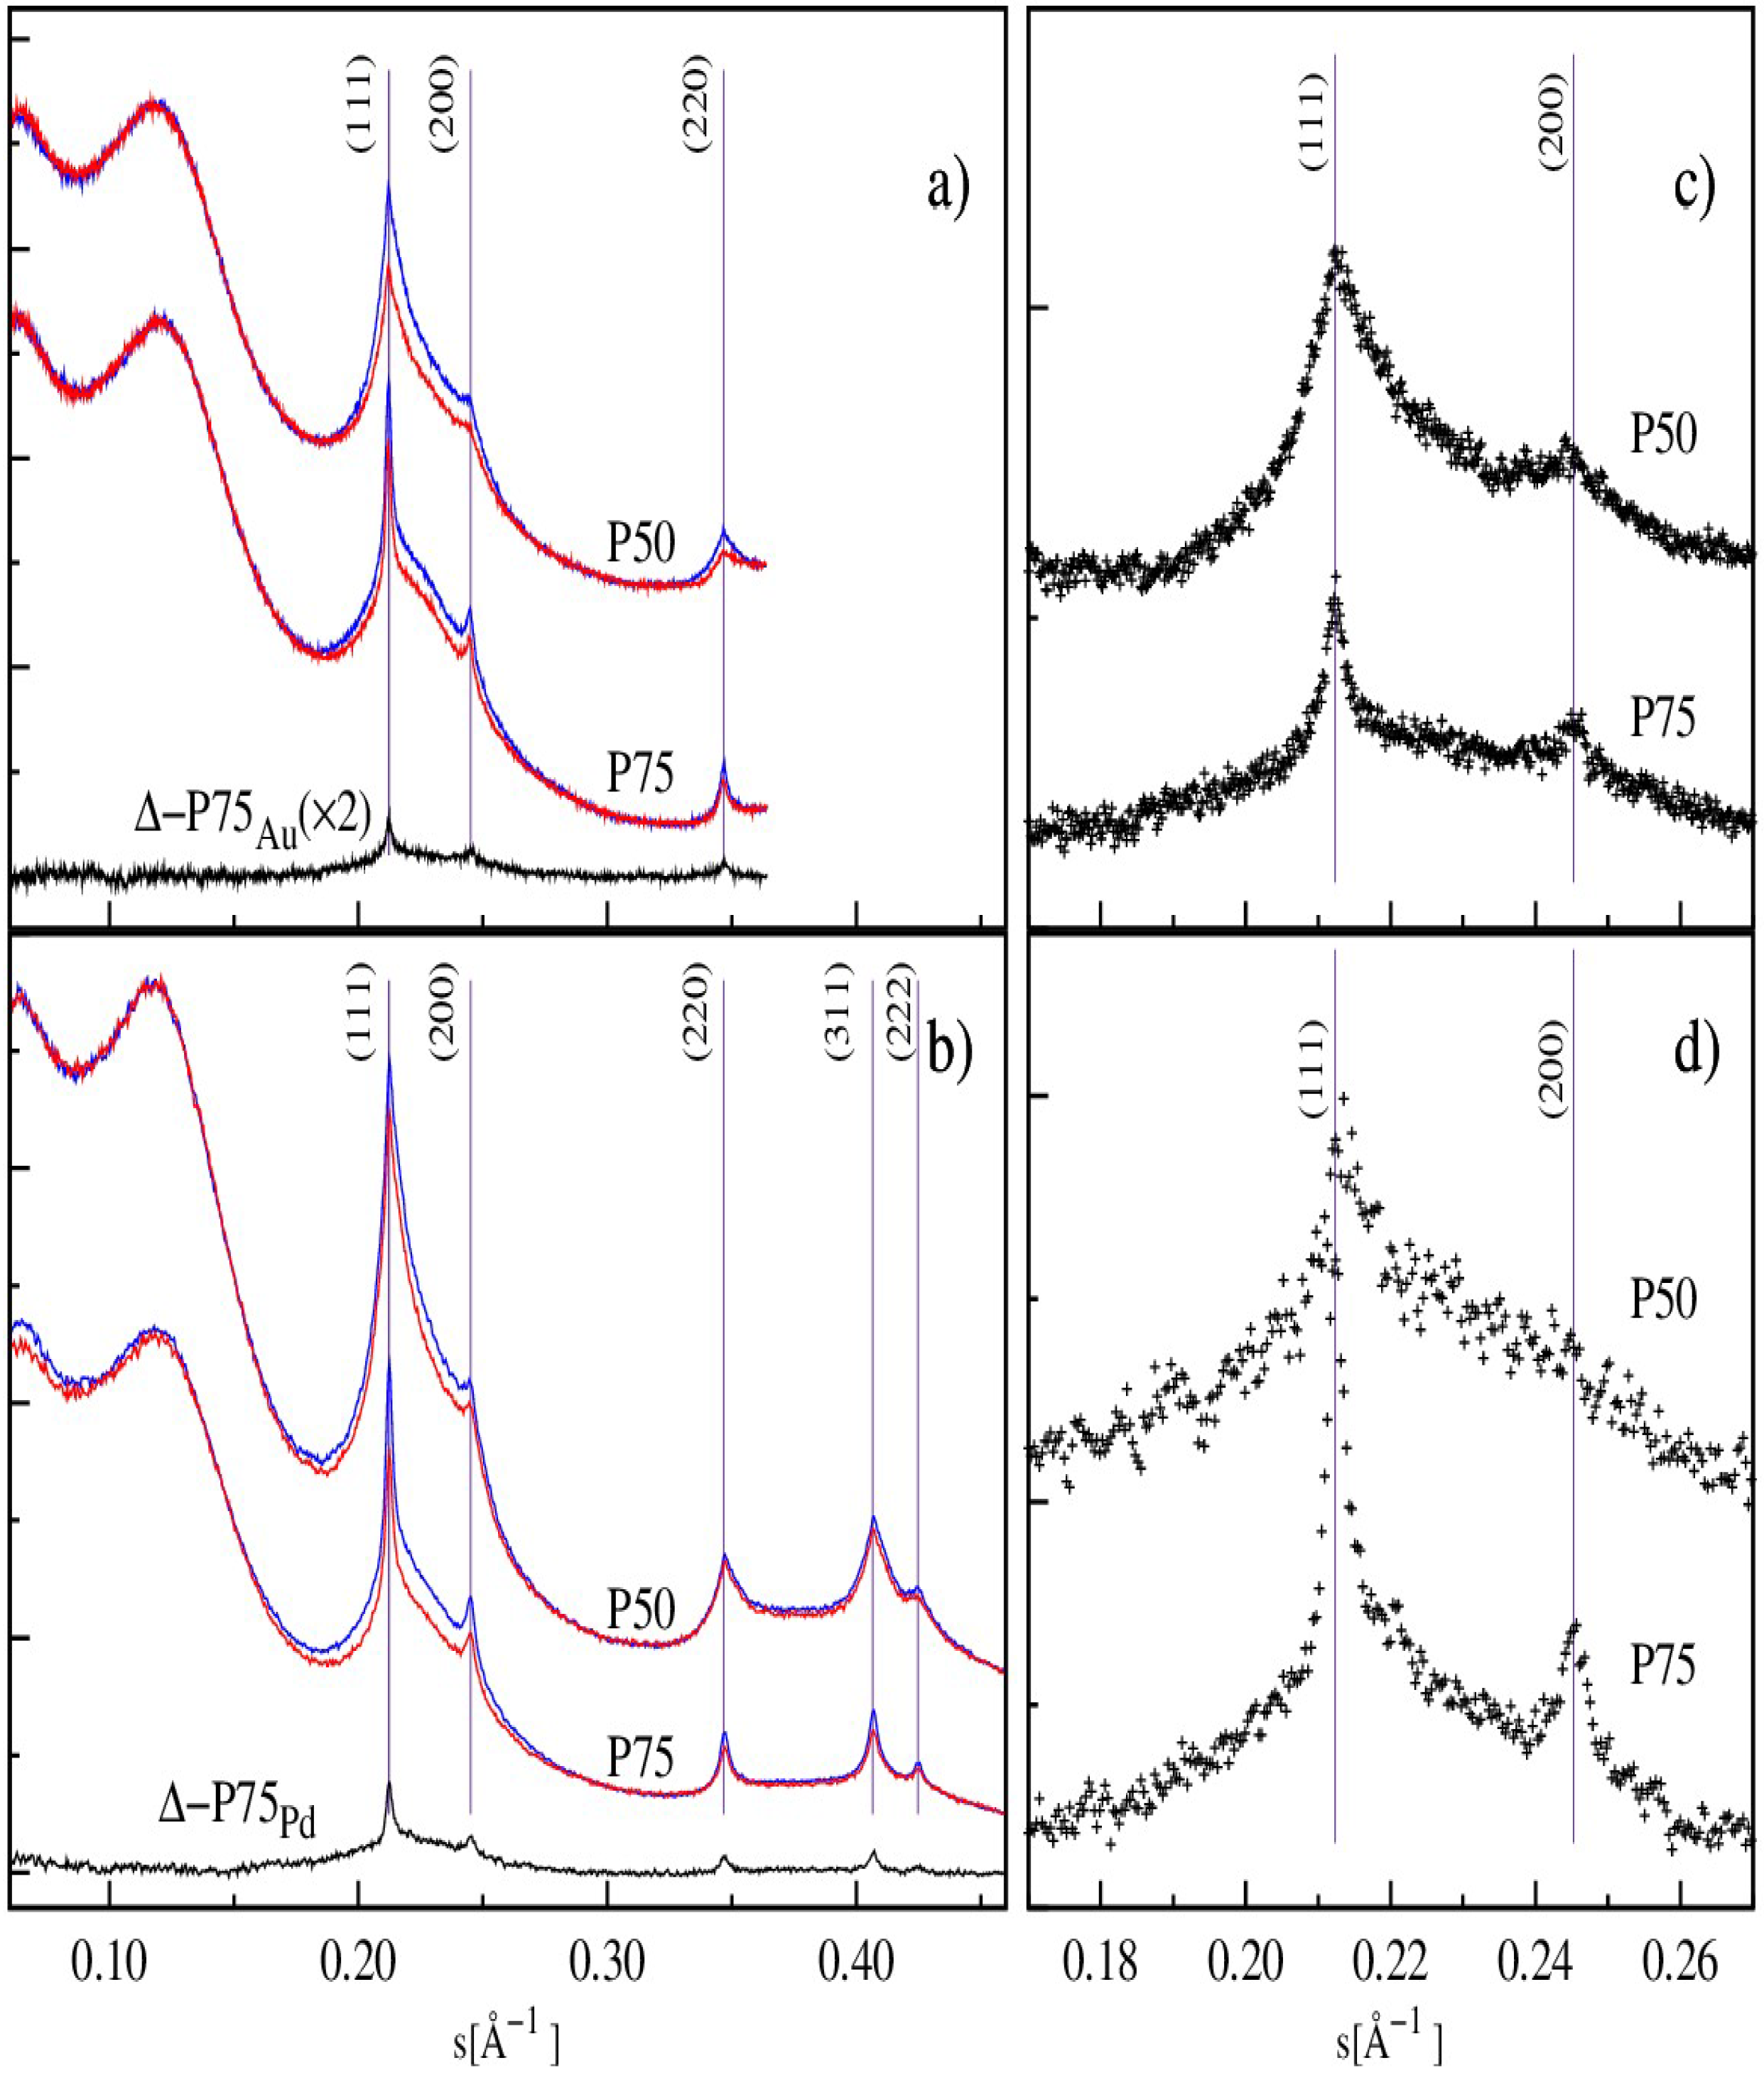
Figure 2 shows the A-XRD patterns collected at the Au LIII edge and Pd K edge, panels (a) and (b), respectively, as a function of the energy independent abscissa, s = sin(θ)/λ, for the two specimens P50 and P75. They show an intense background scattering coming from the polymer matrix and well defined peaks due to the MNPs. The abscissa values of the most intense peaks, calculated assuming a lattice parameter for Au aAu = 4.079 Å (JCPDS card No 46-1043), are in good agreement with the ones of pure Au (Figure 2a,b). The broad halo observable between the Au (111) and Au (200) lines is especially evident in the difference patterns, ΔI = IF − IN (Figure 2, panels c and d), where the contribution of the polymer matrix was subtracted. Since the difference pattern obtained from the A-XRD is due only to the scattering of the resonant atoms (that is Au atoms, Figure 2 panels a and c; Pd atoms, panels b and d), the broad halo, which is particularly evident for measurements at the Pd K edge, should arise from the scattering of a palladium-rich phase formed by very small (less than 2–3 nm) MNPs. The diffraction lines of pure palladium should appear at s values higher than those of the corresponding signals of gold, due to its shorter lattice parameters (aPd = 3.8898 Å [43]). As the signals from an alloy fall in between the Bragg peaks of the pure metals, the position of this halo is compatible with a small-sized Pd-Au bimetallic alloy phase. The presence of a population of MNPs characterized by a size smaller than 3 nm is confirmed by the TEM images (see Supporting Information, Figure S1) showing the co-existence of both large and small MNPs in agreement with the diffraction patterns.
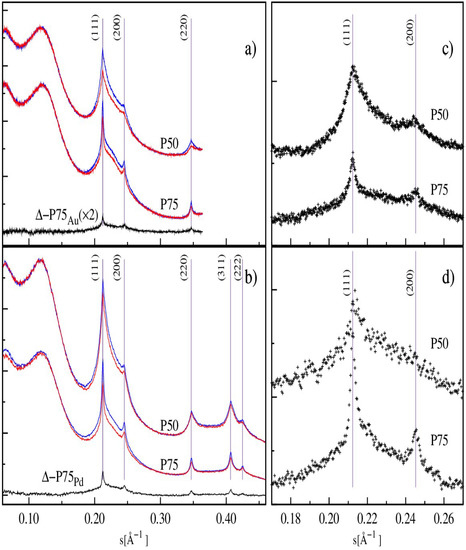
Figure 2.
A-XRD patterns for P50 and P75 (IF, red curves; IN: blue curves) as a function of the energy independent abscissa, s = sin(θ)/λ, at the Au LIII edge (a) and the Pd K edge (b). The curves of the two specimens are vertically shifted for the sake of clarity and the vertical lines highlight the expected position (shkl = 1/2dhkl) of Aufcc diffraction lines (aAu = 4.079 Å). The difference curve for P75 is reported for comparative purposes in (a,b). The difference patterns, ΔI, in the region of the (111) and (200) fcc diffraction lines calculated at the Au LIII edge and Pd K edge are illustrated for both P50 and P75 in (c,d), respectively.
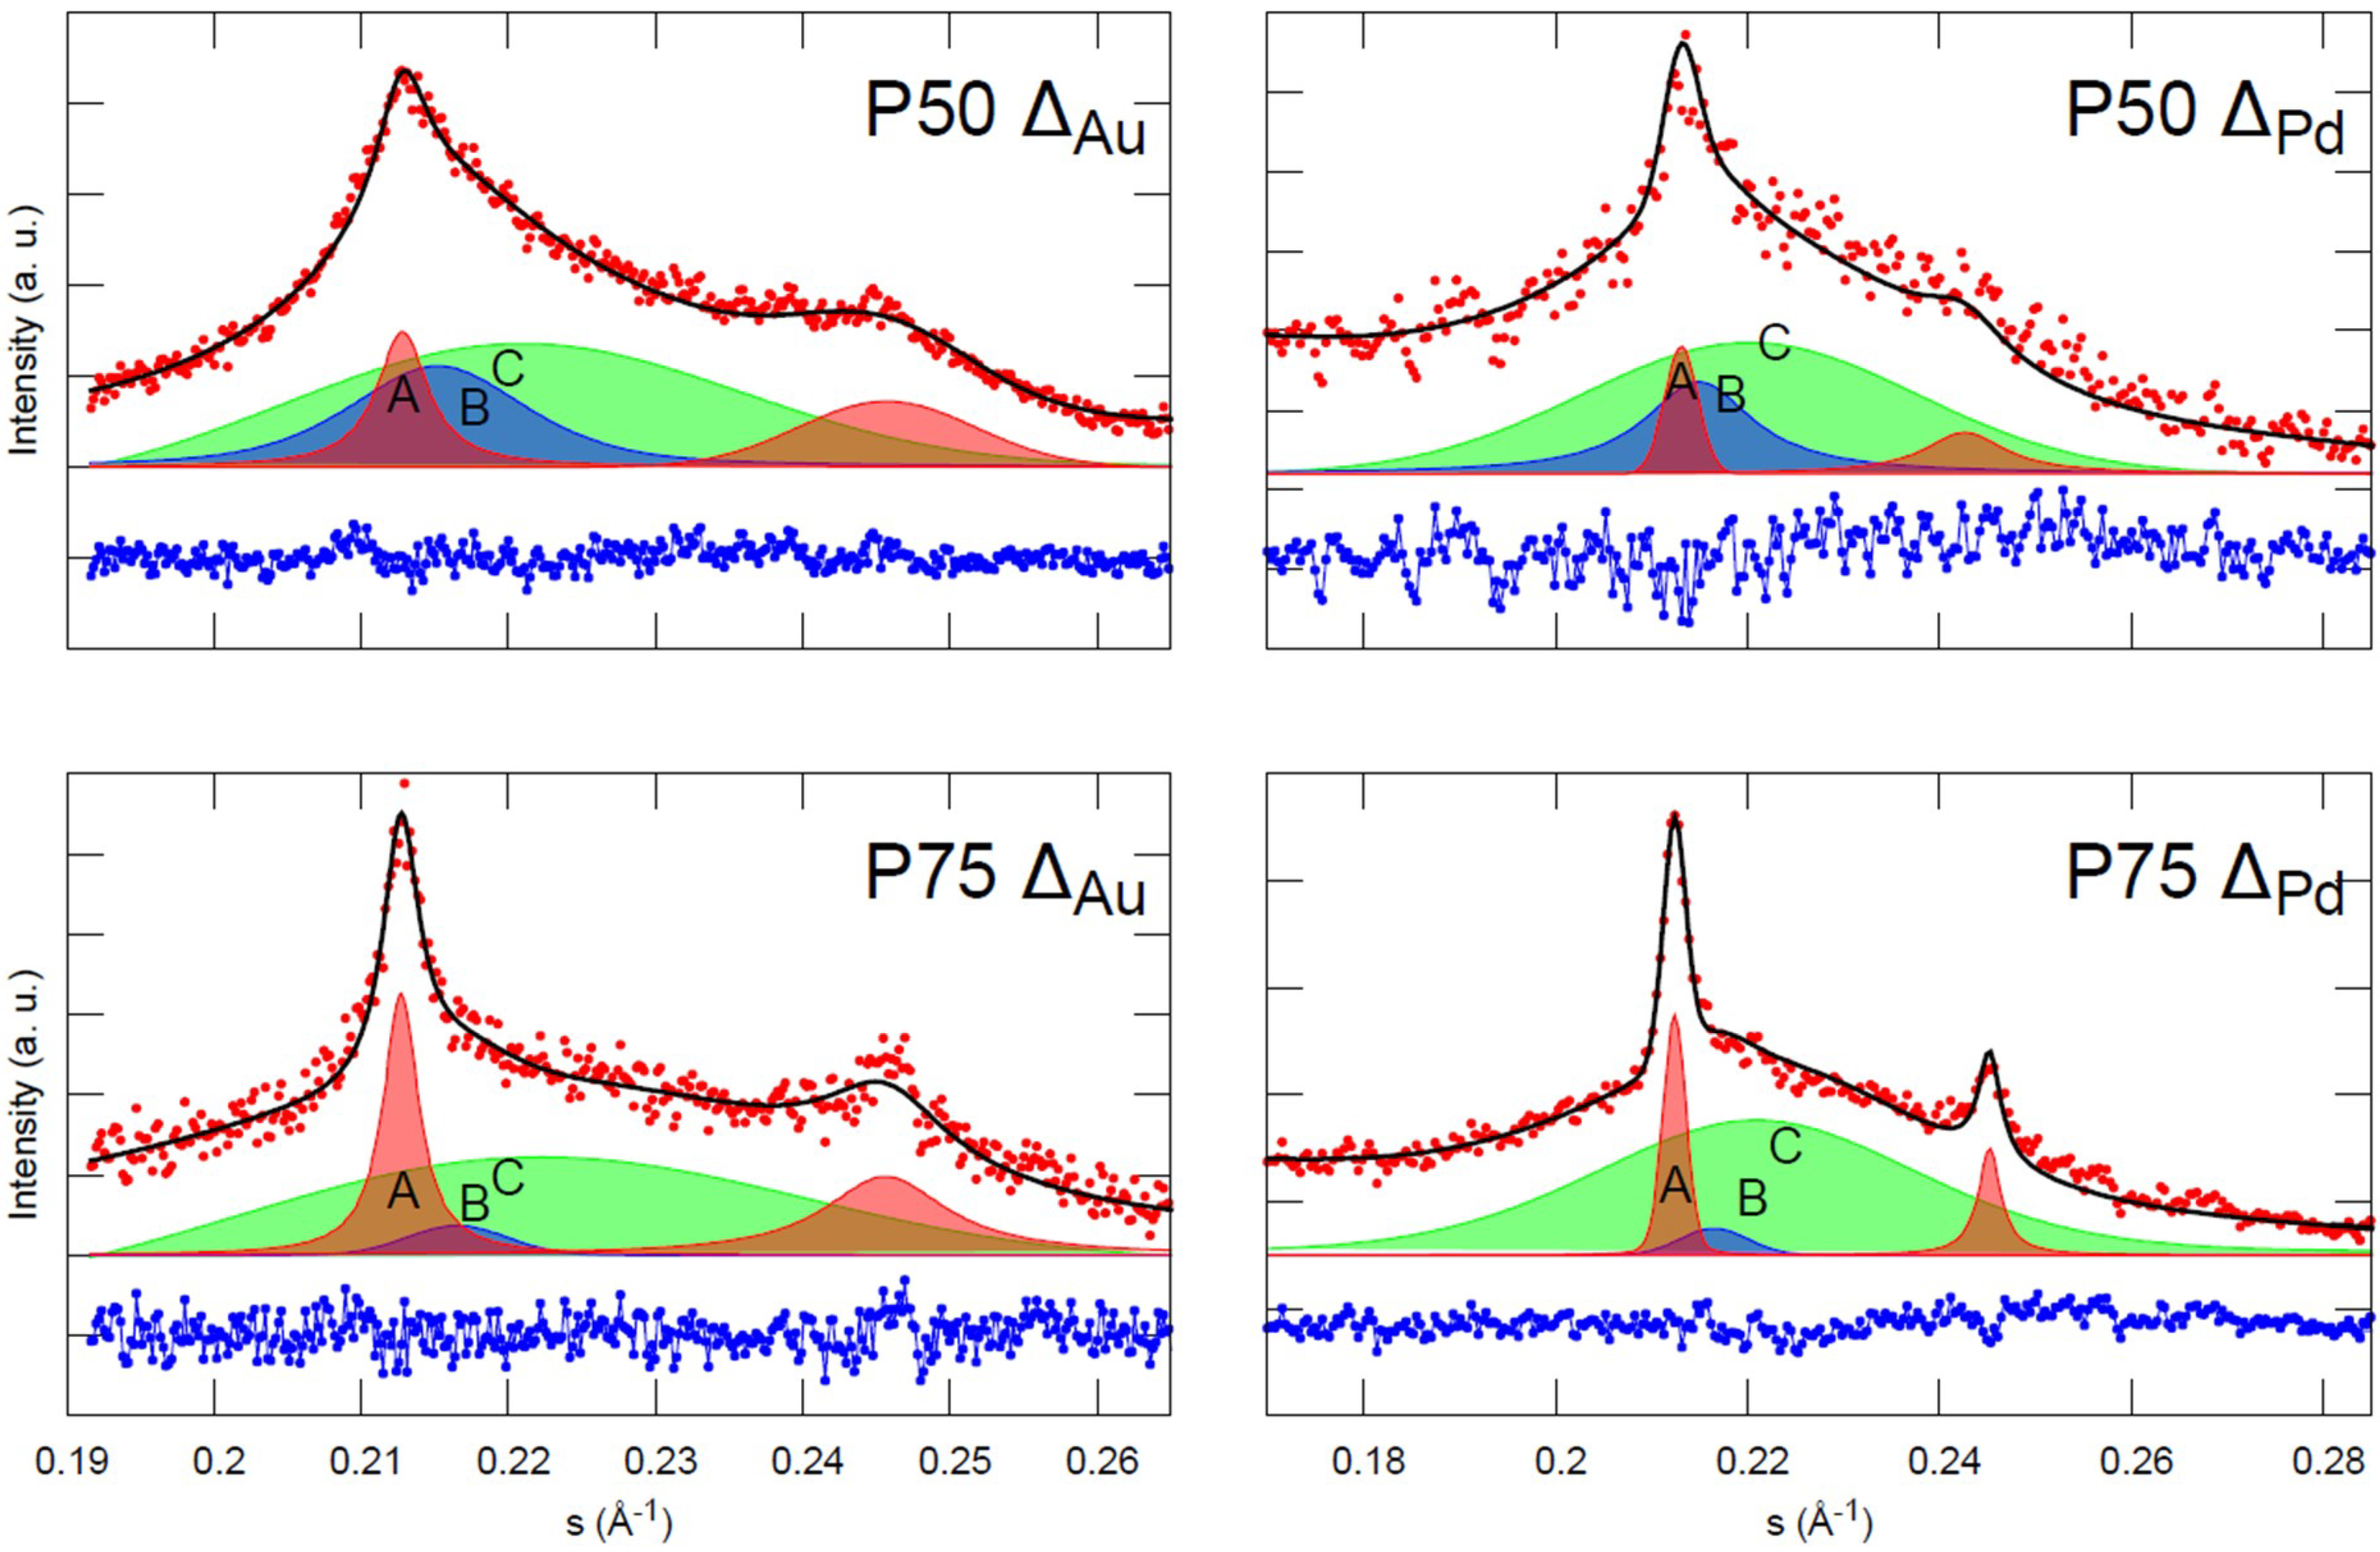
We can obtain quantitative information by fitting the difference patterns to pseudo-Voigt functions provided that the signal to noise ratio is adequate. We therefore analyzed the region around the (111) and (200) peaks, since in the higher angles’ region (i.e., above the (200) peaks), the difference signals become too weak for a reliable quantitative analysis. The best fits, which are shown in Figure 3, are obtained assuming the presence of three different phases (hereafter referred to as A, B, and C). The first phase (A) features two relatively sharp contributions (Figure 3, orange-shaded peaks), so that we were able to constrain their positions to the same lattice parameter; moreover, they imposed the same half-width and their intensity ratio was fixed to the I200/I111 value (about 0.49) of the (111) and (200) reflections of pure fcc gold. In this way, we reduced the number of refinable parameters, thus improving the reliability of the fitting procedure. For the second and third phases (B and C, respectively), only a single contribution in the region of the (111) reflection is required to achieve the best fit (Figure 3, blue- and green-shaded peaks, respectively). These contributions are much broader than the corresponding ones for phase A and they are positioned towards higher values of s. Accordingly, they can be associated to phases which are richer in palladium and composed of smaller MNPs in comparison with phase A. The (200) peaks expected for the phases B and C are observed as a tailing in the difference patterns at high s values; they can be simply accounted for by a single further contribution, which falls in the region where the (200) reflections of phases B and C should be observed, but it is not specifically attributed to any of them.
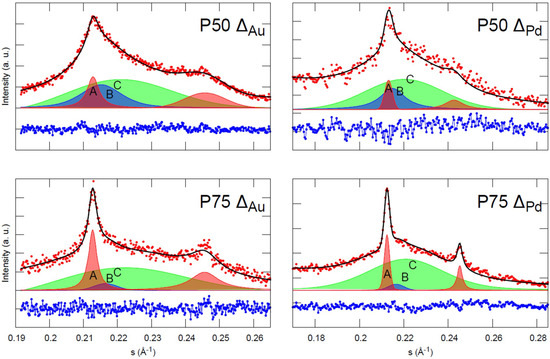
Figure 3.
Analysis of A-XRD difference patterns for P50 (upper panels) and P75 (lower panels) samples at Au (left) and Pd (right) edges. The experimental points (red dots) and the best fit line (black line) are shown together, with peaks corresponding to the bimetallic phases A (orange shade), B (green shade), and C (blue shade). The residuals (experimental-fit) are shown at the bottom (blue dots), shifted for clarity.
Figure 3 shows that there is a strong similarity between P50 and P75 samples at both Au and Pd edges. For both P50 and P75, one diffraction peak (the narrowest, A) is found almost coincident with that of pure gold (111). A second peak is observed in a position, which is in between those of pure gold (111) and pure palladium (111). The third one is found very close to that of pure palladium (111). As each of these peaks must be assigned to a different nanostructured phase, we can argue that phase A is very rich in gold, phase C is very rich in palladium, and phase B is a bimetallic alloy with some intermediate composition.
For each phase, the position of the (111) diffraction line provides information on the lattice parameter of the involved crystallographic phase. Vegard’s law establishes that the lattice parameter, ax, of a binary metallic alloy, AxB1−x, varies linearly with the concentration, x, of the constituting elements of the alloy (ax = aA + x (aB − aA), with aA and aB being the lattice parameters of the pure compounds. The Scherrer law relates the full width at half maximum of a diffraction peak to the volume-weighted average particle diameter, D (Å). The relative peak area is proportional to the phase fraction. The quantitative analysis of the ΔI difference data yields two sets of results (one obtained from the data at the gold edge and the other from the data at the palladium edge). As illustrated in Table 1, the results from the two independent sets match significantly well to one another.

Table 1.
Analysis of the A-XRD difference patterns. a, D, and %Au are the lattice parameter, the size, and the Au content, respectively, of the identified metal phases (A, B, C) from the (111) diffraction peak.
Not only is the trend in the change of the composition from phase A to phases B and C the same, but also the respective Au and Pd atomic percentages are very close to each other. These results show that the quantitative analysis of the data is self-consistent and that the discrepancies between the two sets of data can be assumed as an estimate of the “experimental uncertainty” of the method.
Looking at the results obtained at the Au edge (but similar considerations also apply for the Pd edge), as far as the chemical composition is concerned, phase A turns out to have atomic Au percentages of 98.0 ± 1.4% and 94.4 ± 1.3% in P75 and P50 respectively, so it can be considered to be formed by almost pure gold. As pure gold is not active in the DS reaction, this phase can be considered of little relevance in the catalytic behavior of P50 and P75. Moreover, as indicated by the TEM characterization, the amount of the largest MNPs is very low in both specimens; according to Scherrer analysis of the A-XRD data (see below), phase A is formed by the largest MNPs both in P50 and P75. This supports the hypothesis that phase A does not contribute to the overall activity of these catalysts in the DS reaction. Considering phase B, data analysis shows that this phase has an intermediate gold content, which is higher in P50 (83.6 ± 2.4%) and lower in P75 (~65.9%). This result is easily explained considering that in P50, the overall Au/Pd ratio is 1/1.85 while in P75 it is 1/5.57. It follows that P75 will be necessarily richer in Pd and lower in Au for phases B and C. Accordingly, the atomic percentage of Au present in phase C is ~0.1% for P75 and 8.6 ± 0.1% in P50. In summary, phase C is very rich in palladium (>90% Pd) in both specimens, and it is almost pure palladium in P75.
Within each phase, the size of the MNPs, as assessed from the Scherrer analysis of the respective (111) peaks, was strictly comparable in both P50 and in P75 (Table 2). Phase A always shows the largest MNPs, with diameters of about 11 nm for P50 and about 16 nm for P75. As mentioned above, TEM characterization suggests that the number of MNPs of phase A is very small. This is in agreement with the fact that these MNPs being so large and so rich in gold must be only a few, as the least abundant metal in the specimens (gold) is concentrated in this phase. Phase B is comprised of smaller MNPs, with diameters of about 3.3 nm for P50 and 5.6 nm for P75, while phase C is formed of tiny MNPs slightly larger than 1 nm. From the A-XRD analysis, the highest MNPs size is 16 nm, but TEM also shows the presence of even larger MNPs (tens of nm in diameter). However, according to HREM characterization, they are multi-twinned clusters (see Supporting Information, Figure S2) featured by several ordered domains, each one responsible for a single XRD signal [44].
Table 2.
MPNs population of phases A, B, and C of P50 and P75 and the atomic (molar) Pd/Au ratio as obtained from the data of Table 1 (see the text for the meaning of VMNP, NMNP, PMNP, NAu, and NPd).
The number of MNPs in each phase cannot be exactly assessed from the TEM data since sampling in the TEM is necessarily partial and the relevant results could not be fully representative. Moreover, the MNPs’ size of phases B and C are pretty close to each other and it is difficult to trace a boundary between their populations. However, the A-XRD analysis provided both the size and the composition of MNPs for each phase so that the relative abundances of MNPs could be calculated. In addition, A-XRD analysis was carried out on macroscopic amounts (mg scale) of the samples and its results are therefore representative of the whole material. Using the information derived from A-XRD data for each phase (MNP diameter in nm and a in Å), we calculated first the volume of the MNP , supposed to be roughly spherical and to possess the fcc lattice, and then the number of atoms per MNP . We also calculated the relative numbers of MNP belonging to A, B, and C , which should be proportional to the volume fractions of the respective phases, upon dividing the relative areas of the deconvoluted 111 peaks by VMNP. These will be hereafter referred to as the “volume adjusted populations” (VAPs). From these values and from the atomic composition of each phase, the relative numbers of gold and palladium atoms in the two specimens were easily achieved as . This provided two values (one for each edge) of the atomic (molar) ratio between palladium and gold for P50 and P75, which are reported in Table 2. The values of NPd/NAu from the palladium edge and the gold edge of P50 are in good to excellent agreement with the experimental value of 1.85 mol·mol−1. For P75, the agreement of the single values is not as good, but the average, 5.10, is not far from the 5.56 value obtained from the metal analysis. We can therefore conclude that the A-XRD analysis and this treatment of its data catches, at least semi-quantitatively, the changes in the morphology (size) and composition of the MNPs of these bimetallic systems as the Pd/Au ratio is varied.
The same conclusion can be drawn with a similar approach but taking a different point of view. In fact, the population of the phases can easily be adjusted to match the experimental overall atomic (molar) Pd/Au ratio, while keeping at each edge the same values of D and a reported in Table 1 for each phase. These will be hereafter referred to as the “metal-ratio adjusted populations” (MAPs). With the exception of the data from the Pd edge of P50, this adjustment requires a large relative change in the population of the phase A, a small one, if any, in the population of phase B, and an almost negligible one in the population of phase C (Table 3). This is not unexpected, because phases A and C contain, by far and large, the smallest and the largest number of MNPs. It can also be appreciated that for P50 the NPd/NAu value is much less sensitive to the population adjustment in comparison with P75. This and the large difference in the NPd/NAu values of P75 at the Pd and the Au edges (Table 2, line 6) probably arise by the high degree of segregation of the metals in this specimen. Whereas gold is comparatively more evenly distributed among the phases in P50, in P75, an estimated 75% to 85% of all the gold atoms are concentrated in phase A.
Table 3.
MPNs populations of phases A, B, and C of P50 and P75 adjusted to the experimental atomic (molar) Pd/Au ratios keeping the same values of a, D, and χAu as reported in Table 1 (see the text for the meaning of VMNP, NMNP, PMNP, NAu, and NPd).
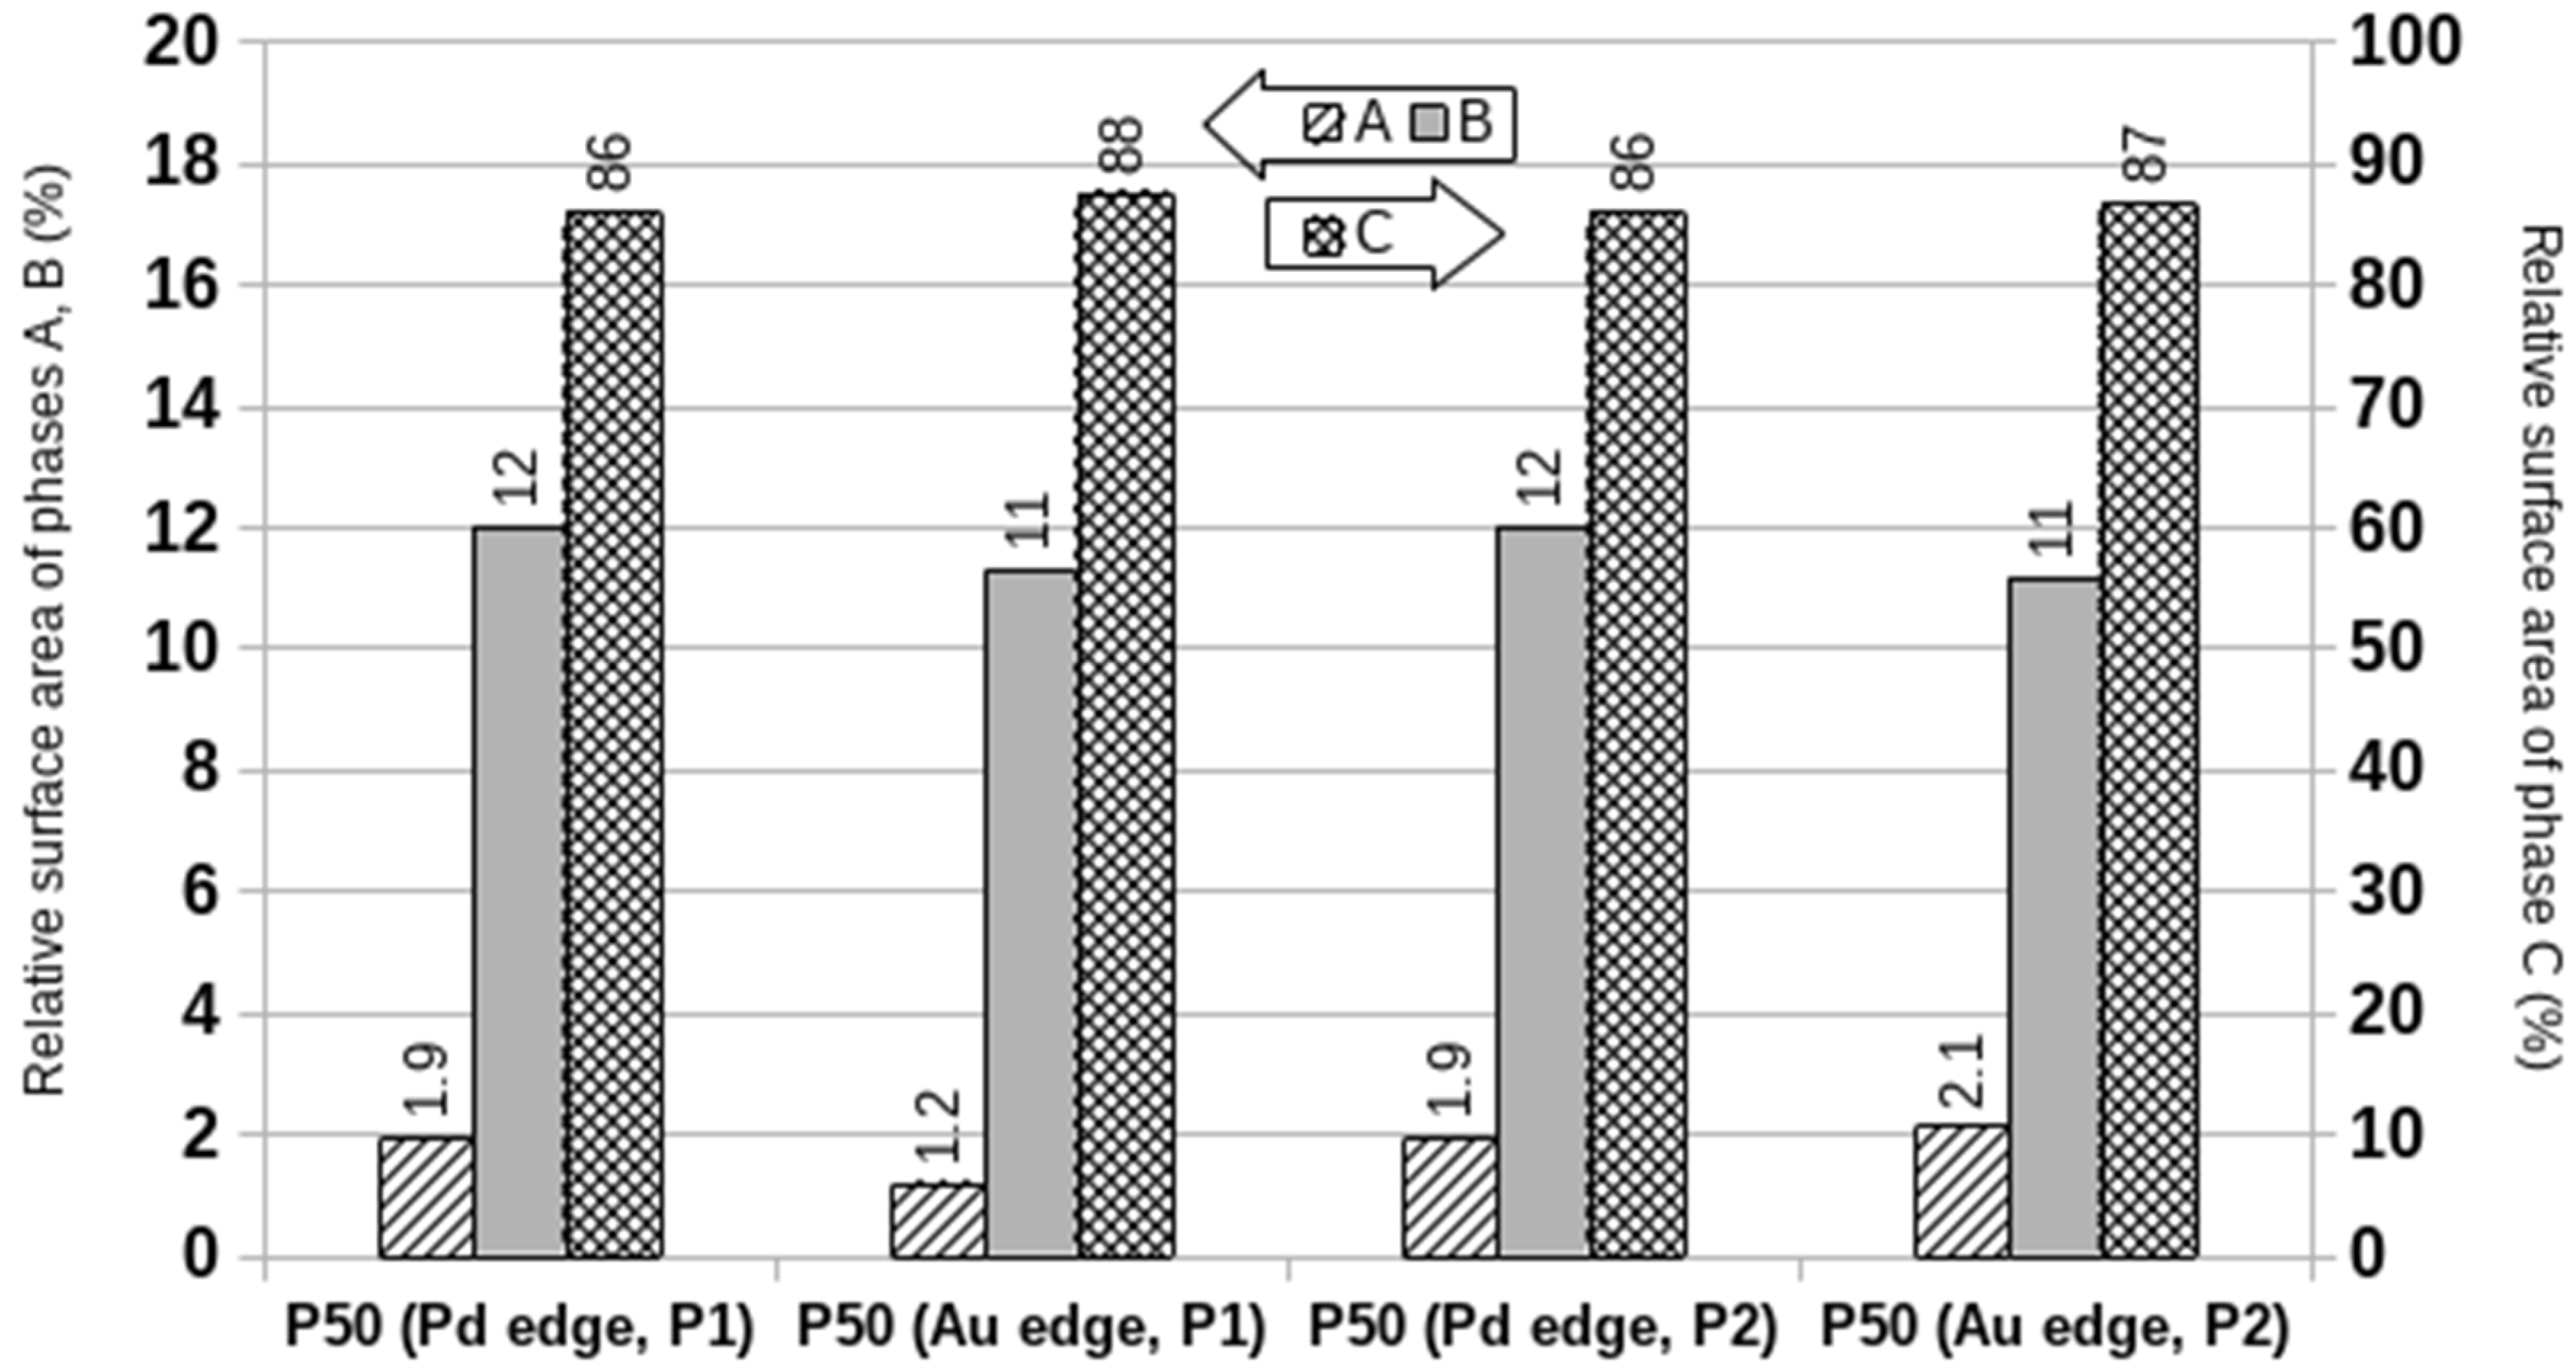
The above results show that a reliable estimate of the population of the phases and of the composition and size of their MNPs can be achieved with A-XRD analysis. This forms the basis to evaluate the relative contribution of each phase to the metal surface, which might be relevant to the catalytic behavior of these materials. Figure 4 and Figure 5 illustrate the relative surface area of the nanostructured metallic phases. It can be appreciated that for both P50 and P75, the surface distribution among the phases turned out to be the same (in spite of some discrepancies for phase A), whatever starting set of data (Pd or Au edge, VAPs, or MAPs) were employed.

Figure 4.
Relative surface areas respectively exposed by phases A, B (left vertical axis), and C (right vertical axis) in P50.
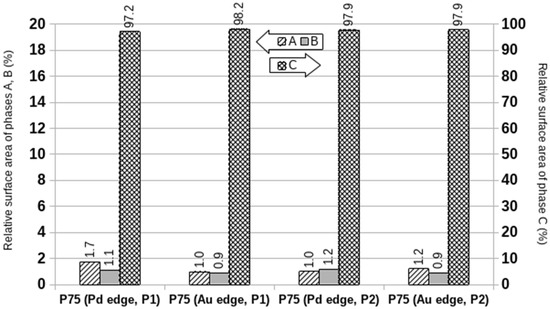
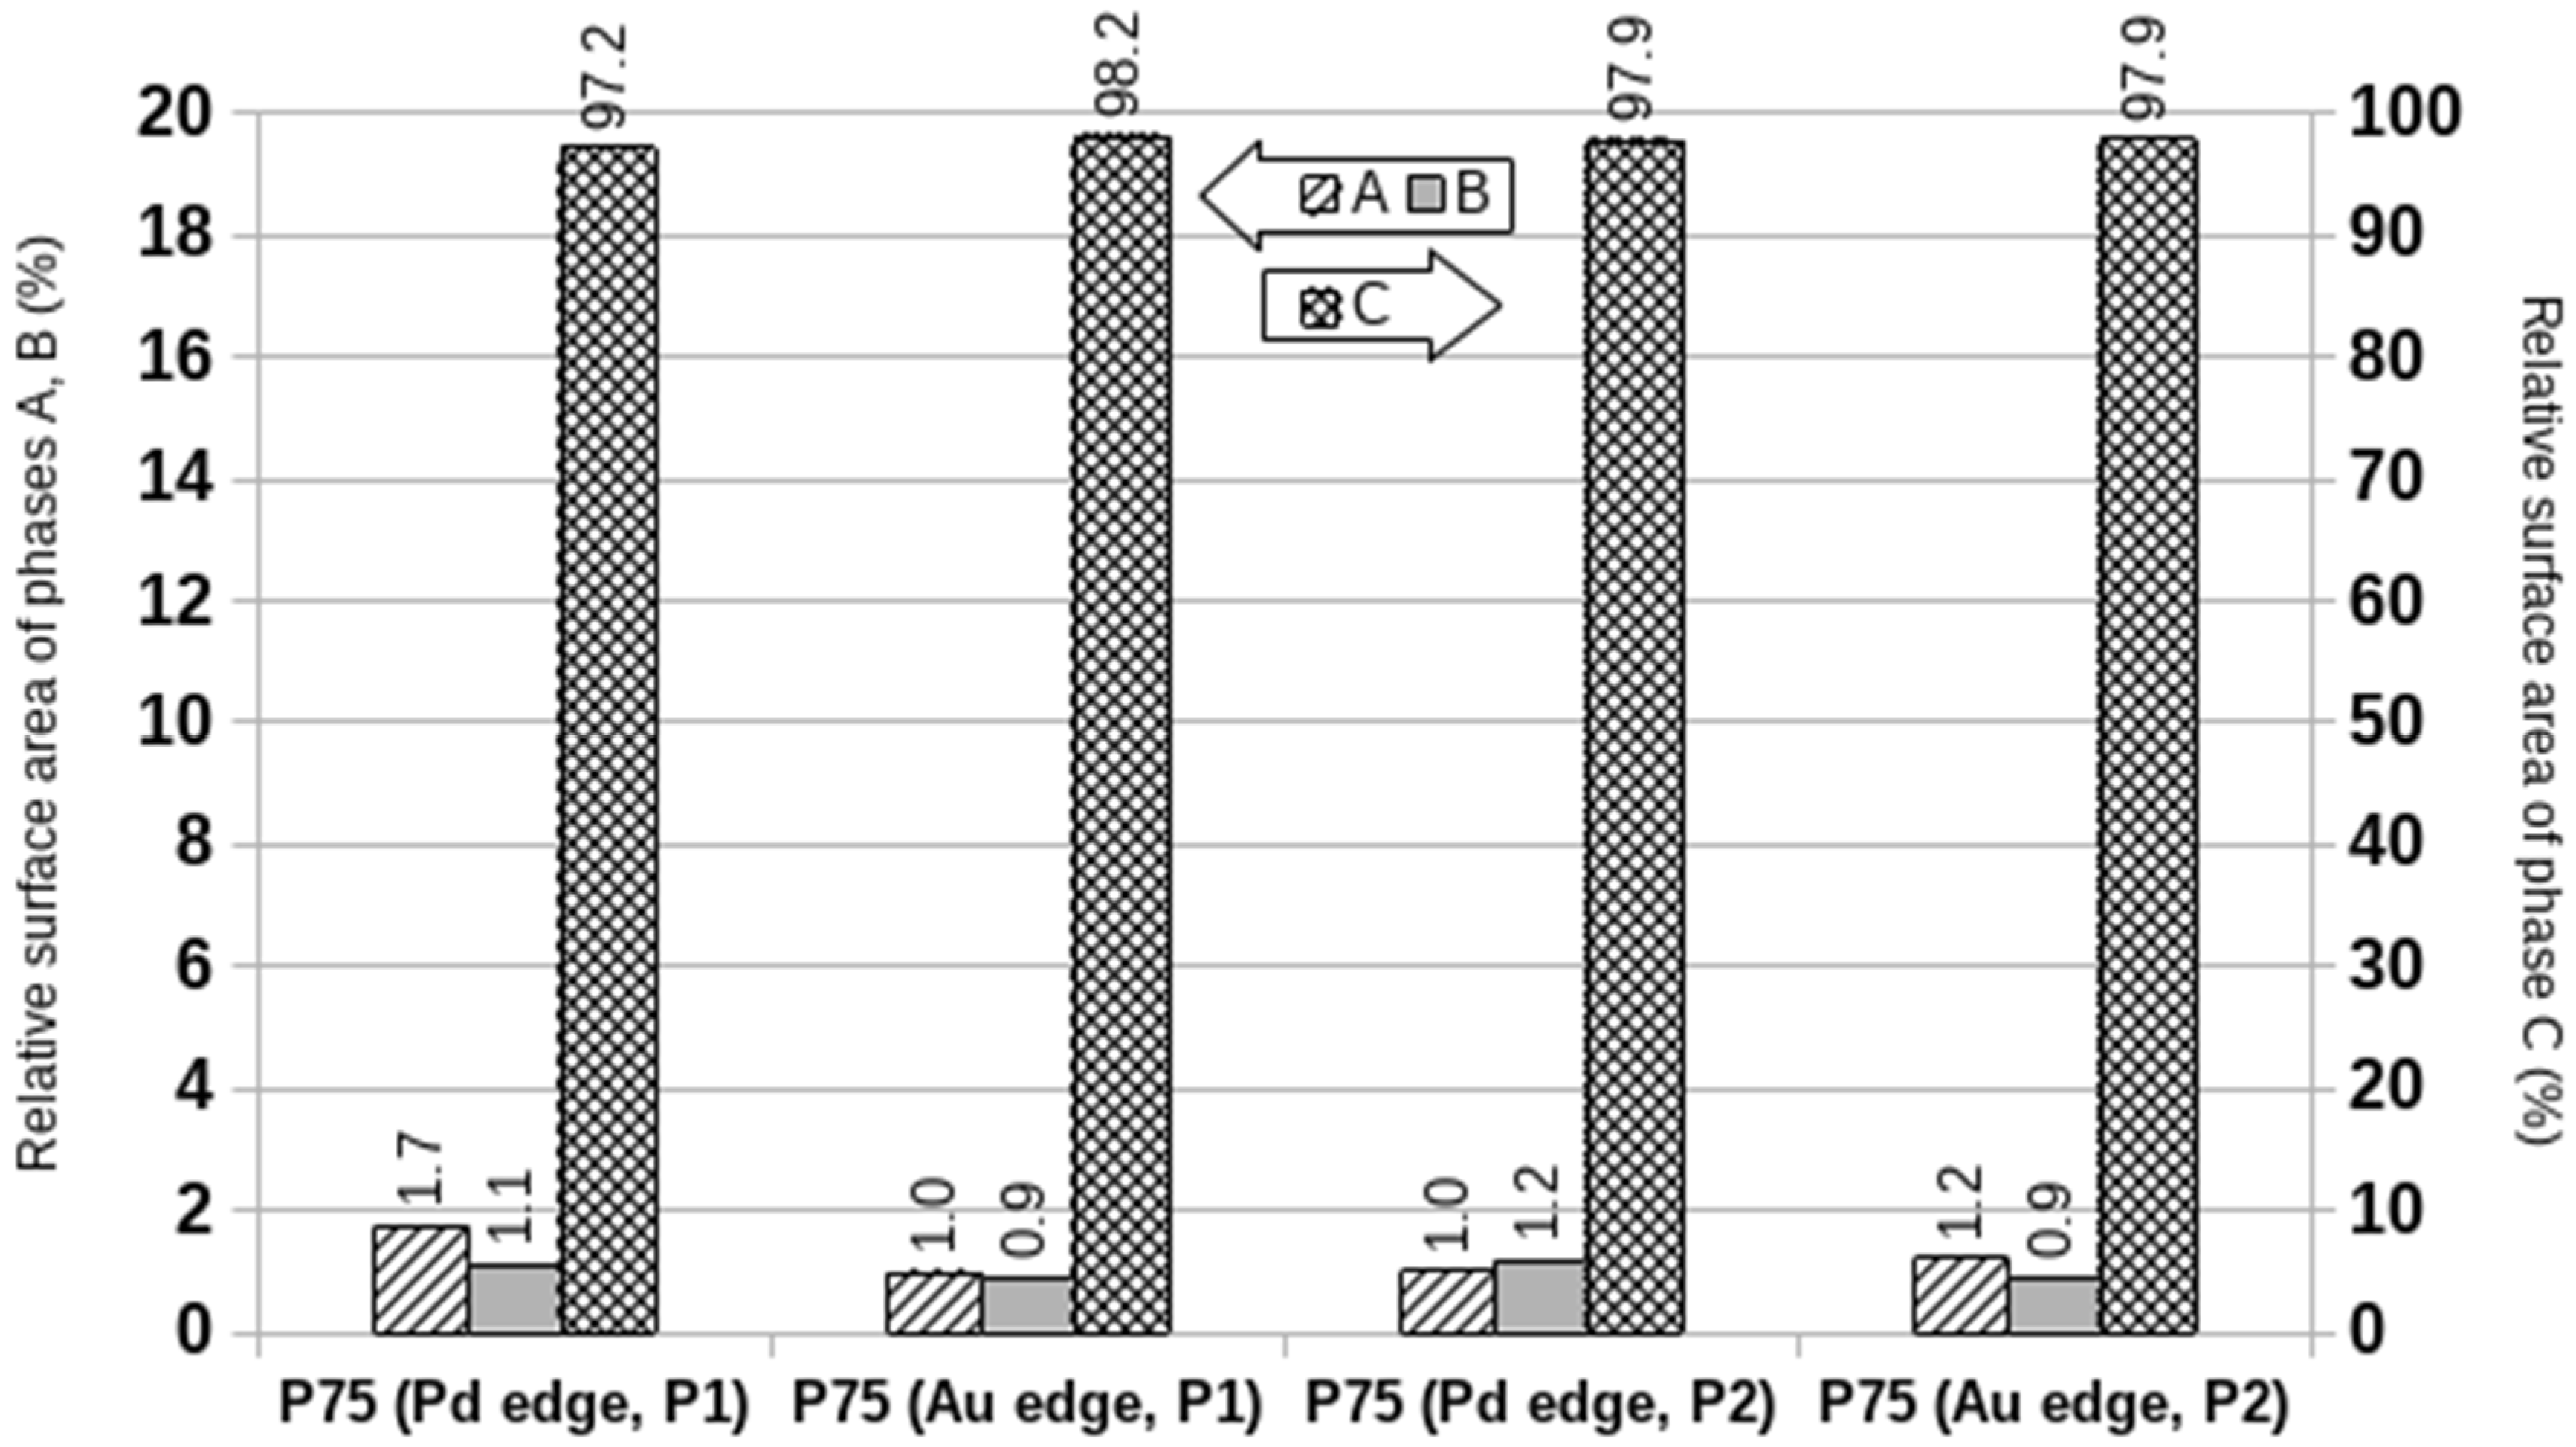
Figure 5.
Relative surface areas respectively exposed by phases A, B (left vertical axis), and C (right vertical axis) in P75.
The most remarkable difference between the surface distributions of P50 and P75 was observed in the respective phases B. Although this phase contains more gold in P50 (Pd/Au ≈ 0.20) than in P75 (Pd/Au ≈ 0.50), it features the highest degree of metal intermixing. The larger contribution of phase B to the metal surface area of P50 is the result of the smaller size of the MNPs (DP50 ≈ 3.2 nm; DP75 ≈ 5.6 nm) and of their higher population in this material (PP50 ≈ 1.8–2 × 10⁴ ppm; PP75 ≈ 3.4–3.8 × 10² ppm). It should also be appreciated that the decrease of the relative surface area of phase B from P50 to P75 occurred with the increase of the relative surface area of phase C. The Pd/Au ratio in phase C of P75 is close to 103 as compared with ca 10 in P50. All these circumstances imply that the intermixing of the two metals is strongly enhanced on going from P75 to P50.
The DS reaction has been attracting the interest of many research groups for years as its effective implementation would be a real breakthrough from the environmental point of view. In this connection, bimetallic gold-palladium catalysts are among the best ones, because of their improved performance in comparison with mono-metallic palladium catalysts. The well-known promoting effect of gold [45,46,47] was confirmed by our data on the catalytic productivity of P50 and P75, which was, respectively, 109 and 97 mmolH2O2/molH2, both better than a related mono-metallic Pd catalyst (64 mmolH2O2/molH2). This effect was attributed to the formation of gold-palladium nano-alloyed materials. Our catalytic data show that the gold promotion was more effective in P50 than in P75. In the first approximation, this can simply be attributed to the decrease of the Pd/Au atomic (molar) ratio from 5.56 (P75) to 1.84 (P50). This lead to a relatively small increase of the population of phase A, but the features of its MNPs (large size, small population, little relative surface area, gold segregation) support the hypothesis that it was of negligible relevance, if any, to catalysis. Accordingly, only phases B and C were active in both P75 and P50. On going from the former to the latter, they were both enriched in gold, and in P50, the contribution of phase B to the metal surface area underwent a 10-fold increase. This could be the cause of the higher productivity of P50, but we cannot rule out at the moment that it could be brought about by the enrichment in gold of phase C, which in P50, still represents more than 85% of the metal surface.
Although no conclusive evidence on the causes of the higher productivity of P50 in the DS were provided from the A-XRD characterization of P75 and P50, its level of insight is hard to achieve with other techniques. In this connection, the variation of the composition of Au-Pd MNPs with their size had already been observed, although only qualitatively, in nano-alloyed bimetallic catalysts supported on carbon. Whereas the largest MNPs were the richest in palladium in samples prepared by sol immobilization [44], the opposite situation was found in materials prepared by impregnation [48]. The atomic Au-Pd ratio as a function of MNPs was quantitatively assessed with TEM-EDX analysis in a bimetallic impregnated catalyst supported on a mesoporous ordered carbon [49]. However, it was impossible to probe MNPs smaller than 5 nm so that no direct quantitative information on the smallest and expectedly more active nanoparticles could be gathered and this prevented a full characterization of the best reported catalyst, which has more than 90% MNPs smaller than 4 nm. Moreover, TEM-EDX analysis can be generally carried out on relatively small MNPs populations, which raises the problem of the representativeness of its results. This problem has been partially overcome by the introduction of a semi-automated HAADF-STEM, which allegedly allows the characterization of several hundreds of MNPs in a short time [50]. Although this method is an improvement in comparison with single particle EDX analysis, it was proved effective for MNPs as large as ca 8 nm and the number of probed MNPs was still below 103. We propose that, by contrast, A-XRD analysis allows milligram amounts of P75 and P50 to be probed, providing complementary and statistically representative details on the average sample crystallographic phase composition. This approach noticeably represents an original example of quantitative characterization providing at the same time, structural, morphological, and analytical data of macroscopic, hence fully representative, samples of bi-metallic systems with a relatively low metal content and including MNPs as small as 1 nm.
3. Conclusions
In conclusion, here, we reported the first investigation where the composition of different families of bimetallic MNPs was determined in DS catalysts as a function of their size distribution down to 1 nm, at overall metal contents lower than previously reported. This was made possible by the ability of A-XRD to separate the contributions of different nanostructured phases and not to reduce the representation of each material to a single average, as it is often the case with more standard laboratory techniques. Moreover, the results of the A-XRD rest on the analysis of large collections of particles, and, differently from techniques based on single particle analysis, they are much more representative of the whole material. In addition, our findings provide, in an unprecedented way, further support to the concept that the formation of Au/Pd alloys is the cause of the gold promotion of DS reaction catalysts.
Supplementary Materials
The following are available online at https://www.mdpi.com/2076-3417/9/15/2959/s1, Figure S1: Representative TEM images of P50 (left) and P75 (right) samples. Both the samples depict bimodal distribution with small (1–2 nm) and few large (10–20 nm) particles. The NPs appear well crystallized in fcc structure. The lower panel reports the HREM for the two specimens taken at 1M and 600k, respectively. Figure S2: TEM images of P75 specimen. The left side is a low magnification micrograph while the right side is the corresponding High Resolution image; the left and the right micrographs are taken at a magnification of 60k and 800k respectively. The multi-twinned structure of the biggest particle (red box) present in the low-resolution image is evident from HREM image showing lattice fringes belonging to different crystalline domains.
Author Contributions
Conceptualization, P.C. (Paolo Centomo), P.C. (Patrizia Canton) and M.Z.; Data curation, P.C. (Paolo Centomo), P.C. (Patrizia Canton), C.M. and M.Z.; Funding acquisition, M.Z.; Investigation, P.C. (Paolo Centomo), P.C. (Patrizia Canton), C.B. and C.M.; Methodology, P.C. (Paolo Centomo) and P.C. (Patrizia Canton); Writing—original draft, P.C. (Paolo Centomo), P.C. (Patrizia Canton) and M.Z.; Writing—review & editing, C.M.
Conflicts of Interest
The authors declare no conflict of interest.
References
- Schmid, G. (Ed.) Nanoparticles: From Theory to Application, 2nd ed.; Completely Revised and Updated Edition; Wiley-VCH: Hoboken, NJ, USA, 2010; ISBN 978-3-527-32589-4. [Google Scholar]
- Bönnemann, H.; Nagabhushana, K.S. Metal nanoclusters: Synthesis and strategies for their size control. In Metal Nanoclusters in Catalysis and Materials Science; Corain, B., Schmid, G., Toshima, N., Eds.; Elsevier: Amsterdam, The Netherlands, 2008; pp. 21–48. ISBN 978-0-444-53057-8. [Google Scholar]
- Zecca, M.; Centomo, P.; Corain, B. Metal nanoclusters supported on cross-linked functional polymers: A class of emerging metal catalysts. In Metal Nanoclusters in Catalysis and Materials Science; Corain, B., Schmid, G., Toshima, N., Eds.; Elsevier: Amsterdam, The Netherlands, 2008; pp. 201–232. ISBN 978-0-444-53057-8. [Google Scholar]
- Corain, B.; Jerabek, K.; Centomo, P.; Canton, P. Generation of size-controlled pd0 nanoclusters inside nanoporous domains of gel-type resins: Diverse and convergent evidence that supports a strategy of template-controlled synthesis. Angew. Chem. Int. Ed. 2004, 43, 959–962. [Google Scholar] [CrossRef] [PubMed]
- Corain, B.; Burato, C.; Centomo, P.; Lora, S.; Meyer-Zaika, W.; Schmid, G. Generation of size-controlled gold(0) and palladium(0) nanoclusters inside the nanoporous domains of gel-type functional resins: Part I: Synthetic aspects and first catalytic data in the liquid phase. J. Mol. Catal. A Chem. 2005, 225, 189–195. [Google Scholar] [CrossRef]
- Centomo, P.; Canton, P.; Ferroni, M.; Zecca, M. Template controlled synthesis of monometallic zerovalent metal nanoclusters inside cross-linked polymer frameworks: The effect of a single matrix on the size of different metal nanoparticles. New J. Chem. 2010, 34, 2956. [Google Scholar] [CrossRef]
- Burato, C.; Centomo, P.; Pace, G.; Favaro, M.; Prati, L.; Corain, B. Generation of size-controlled palladium(0) and gold(0) nanoclusters inside the nanoporous domains of gel-type functional resins: Part II: Prospects for oxidation catalysis in the liquid phase. J. Mol. Catal. A Chem. 2005, 238, 26–34. [Google Scholar] [CrossRef]
- Centomo, P.; Jeřábek, K.; Canova, D.; Zoleo, A.; Maniero, A.L.; Sassi, A.; Canton, P.; Corain, B.; Zecca, M. Highly hydrophilic copolymers of N,N-Dimethylacrylamide, Acrylamido-2-methylpropanesulfonic acid, and ethylenedimethacrylate: Nanoscale morphology in the Swollen State and use as exotemplates for synthesis of nanostructured ferric oxide. Chem. Eur. J. 2012, 18, 6632–6643. [Google Scholar] [CrossRef] [PubMed]
- Corain, B.; Zecca, M.; Canton, P.; Centomo, P. Synthesis and catalytic activity of metal nanoclusters inside functional resins: An endeavour lasting 15 years. Philos. Trans. Soc. A 2010, 368, 1495–1507. [Google Scholar] [CrossRef] [PubMed]
- Biasi, P.; Mikkola, J.-P.; Sterchele, S.; Salmi, T.; Gemo, N.; Shchukarev, A.; Centomo, P.; Zecca, M.; Canu, P.; Rautio, A.-R.; et al. Revealing the role of bromide in the H2O2 direct synthesis with the catalyst wet pretreatment method (CWPM). AIChE J. 2017, 63, 32–42. [Google Scholar] [CrossRef]
- Sterchele, S.; Biasi, P.; Centomo, P.; Campestrini, S.; Shchukarev, A.; Rautio, A.-R.; Mikkola, J.-P.; Salmi, T.; Zecca, M. The effect of the metal precursor-reduction with hydrogen on a library of bimetallic Pd-Au and Pd-Pt catalysts for the direct synthesis of H2O2. Catal. Today 2015, 248, 40–47. [Google Scholar] [CrossRef]
- Centomo, P.; Zecca, M.; Di’Noto, V.; Lavina, S.; Bombi, G.G.; Nodari, L.; Salviulo, G.; Ingoglia, R.; Milone, C.; Galvagno, S.; et al. Characterization of synthetic iron oxides and their performance as support for au catalysts. ChemCatChem 2010, 2, 1143–1149. [Google Scholar] [CrossRef]
- Centomo, P.; Zecca, M.; Zoleo, A.; Maniero, A.L.; Canton, P.; Jeřábek, K.; Corain, B. Cross-linked polyvinyl polymers versus polyureas as designed supports for catalytically active M0 nanoclusters. Phys. Chem. Chem. Phys. 2009, 11, 4068–4076. [Google Scholar] [CrossRef]
- Frison, F.; Dalla Valle, C.; Evangelisti, C.; Centomo, P.; Zecca, M. Direct synthesis of hydrogen peroxide under semi-batch conditions over un-promoted palladium catalysts supported by ion-exchange sulfonated resins: Effects of the support morphology. Catalysts 2019, 9, 124. [Google Scholar] [CrossRef]
- Sterchele, S.; Centomo, P.; Zecca, M.; Hanková, L.; Jeřábek, K. Dry- and swollen-state morphology of novel high surface area polymers. Microporous Mesoporous Mater. 2014, 185, 26–29. [Google Scholar] [CrossRef]
- Toshima, N.; Yan, H.; Yukihide, S. Recent progress in bimetallic nanoparticles: Their preparation, structures and functions. In Metal Nanoclusters in Catalysis and Materials Science; Corain, B., Schmid, G., Toshima, N., Eds.; Elsevier: Amsterdam, The Netherlands, 2008; pp. 49–75. ISBN 978-0-444-53057-8. [Google Scholar]
- Alayoglu, S.; Nilekar, A.U.; Mavrikakis, M.; Eichhorn, B. Ru–Pt core–shell nanoparticles for preferential oxidation of carbon monoxide in hydrogen. Nat. Mater. 2008, 7, 333–338. [Google Scholar] [CrossRef] [PubMed]
- Zhang, H.; Watanabe, T.; Okumura, M.; Haruta, M.; Toshima, N. Catalytically highly active top gold atom on palladium nanocluster. Nat. Mater. 2012, 11, 49–52. [Google Scholar] [CrossRef] [PubMed]
- Toshima, N. Core/shell-structured bimetallic nanocluster catalysts for visible-light-induced electron transfer. Pure Appl. Chem. 2009, 72, 317–325. [Google Scholar] [CrossRef]
- Guczi, L.; Beck, A.; Horváth, A.; Koppány, Z.; Stefler, G.; Frey, K.; Sajó, I.; Geszti, O.; Bazin, D.; Lynch, J. AuPd bimetallic nanoparticles on TiO2: XRD, TEM, in situ EXAFS studies and catalytic activity in CO oxidation. J. Mol. Catal. A Chem. 2003, 204–205, 545–552. [Google Scholar] [CrossRef]
- Toshima, N.; Shiraishi, Y.; Teranishi, T.; Miyake, M.; Tominaga, T.; Watanabe, H.; Brijoux, W.; Bönnemann, H.; Schmid, G. Various ligand-stabilized metal nanoclusters as homogeneous and heterogeneous catalysts in the liquid phase. Appl. Organomet. Chem. 2001, 15, 178–196. [Google Scholar] [CrossRef]
- Bronstein, L.M.; Chernyshov, D.M.; Volkov, I.O.; Ezernitskaya, M.G.; Valetsky, P.M.; Matveeva, V.G.; Sulman, E.M. Structure and properties of bimetallic colloids formed in Polystyrene-block-Poly-4-vinylpyridine micelles: Catalytic behavior in selective hydrogenation of dehydrolinalool. J. Catal. 2000, 196, 302–314. [Google Scholar] [CrossRef]
- Dimitratos, N.; Lopez-Sanchez, J.A.; Lennon, D.; Porta, F.; Prati, L.; Villa, A. Effect of particle size on monometallic and bimetallic (Au,Pd)/C on the liquid phase oxidation of glycerol. Catal. Lett. 2006, 108, 147–153. [Google Scholar] [CrossRef]
- Edwards, J.K.; Solsona, B.; Ntainjua, N.E.; Carley, A.F.; Herzing, A.A.; Kiely, C.J.; Hutchings, G.J. Switching off hydrogen peroxide hydrogenation in the direct synthesis process. Science 2009, 323, 1037–1041. [Google Scholar] [CrossRef]
- Liu, H.B.; Pal, U.; Medina, A.; Maldonado, C.; Ascencio, J.A. Structural incoherency and structure reversal in bimetallic Au-Pd nanoclusters. Phys. Rev. B 2005, 71, 075403. [Google Scholar] [CrossRef]
- Edwards, J.K.; Carley, A.F.; Herzing, A.A.; Kiely, C.J.; Hutchings, G.J. Direct synthesis of hydrogen peroxide from H2 and O2 using supported Au–Pd catalysts. Faraday Discuss. 2008, 138, 225–239. [Google Scholar] [CrossRef] [PubMed]
- Ferrer, D.; Torres-Castro, A.; Gao, X.; Sepúlveda-Guzmán, S.; Ortiz-Méndez, U.; José-Yacamán, M. Three-layer core/shell structure in Au−Pd bimetallic nanoparticles. Nano Lett. 2007, 7, 1701–1705. [Google Scholar] [CrossRef] [PubMed]
- Blanco-Brieva, G.; Cano-Serrano, E.; Campos-Martin, J.M.; Fierro, J.L.G. Direct synthesis of hydrogen peroxide solution with palladium-loaded sulfonic acid polystyrene resins. Chem. Commun. 2004, 1184–1185. [Google Scholar] [CrossRef]
- Sterchele, S.; Biasi, P.; Centomo, P.; Shchukarev, A.; Kordás, K.; Rautio, A.-R.; Mikkola, J.-P.; Salmi, T.; Canton, P.; Zecca, M. Influence of metal precursors and reduction protocols on the chloride-free preparation of catalysts for the direct synthesis of hydrogen peroxide without selectivity enhancers. ChemCatChem 2016, 8, 1564–1574. [Google Scholar] [CrossRef]
- Canton, P.; Meneghini, C.; Riello, P.; Balerna, A.; Benedetti, A. Thermal evolution of carbon-supported Pd nanoparticles studied by time-resolved X-ray diffraction. J. Phys. Chem. B 2001, 105, 8088–8091. [Google Scholar] [CrossRef]
- Mariscal, M.M.; Mayoral, A.; Olmos-Asar, A.J.; Magen, C.; Mejía-Rosales, S.; Pérez-Tijerina, E.; José-Yacamán, M. Nanoalloying in real time. A high resolution STEM and computer simulation study. Nanoscale 2011, 3, 5013–5019. [Google Scholar] [CrossRef]
- Materlik, G.; Sparks, C.J.; Fischer, K. Resonant Anomalous X-ray Scattering: Theory and Applications; Elsevier: Amsterdam, The Netherlands, 1994; ISBN 978-0-444-82025-9. [Google Scholar]
- Meneghini, C.; Mobilio, S.; Lusvarghi, L.; Bondioli, F.; Ferrari, A.M.; Manfredini, T.; Siligardi, C. The structure of ZrO2 phases and devitrification processes in a Ca–Zr–Si–O-based glass ceramic: A combined a-XRD and XAS study. J. Appl. Cryst. 2004, 37, 890–900. [Google Scholar] [CrossRef]
- Petkov, V.; Wanjala, B.N.; Loukrakpam, R.; Luo, J.; Yang, L.; Zhong, C.-J.; Shastri, S. Pt–Au Alloying at the Nanoscale. Nano Lett. 2012, 12, 4289–4299. [Google Scholar] [CrossRef]
- Shmueli, U. International Tables for Crystallography, Volume B: Reciprocal Space; Springer Science & Business Media: Berlin, Germany, 2008; ISBN 978-1-4020-8205-4. [Google Scholar]
- Canton, P.; Meneghini, C.; Riello, P.; Benedetti, A. X-ray diffraction and scattering. In In-Situ Spectroscopy of Catalysts; Weckhuysen, B.M., Ed.; American Scientific Publishers: Valencia, CA, USA, 2004; ISBN 978-1-58883-026-5. [Google Scholar]
- Georgopoulos, P.; Cohen, J.B. Study of supported platinum catalysts by anomalous scattering. J. Catal. 1985, 92, 211–215. [Google Scholar] [CrossRef]
- Balerna, A.; Liotta, L.; Longo, A.; Martorana, A.; Meneghini, C.; Mobilio, S.; Pipitone, G. Structural characterization of pumice-supported silver-palladium metal clusters by means of XAFS and AWAXS. Eur. Phys. J. D 1999, 7, 89–97. [Google Scholar] [CrossRef]
- Pascarelli, S.; Boscherini, F.; D’Acapito, F.; Hrdy, J.; Meneghini, C.; Mobilio, S. X-ray optics of a dynamical sagittal-focusing monochromator on the GILDA beamline at the ESRF. J. Synchrotron Radiat. 1996, 3, 147–155. [Google Scholar] [CrossRef] [PubMed]
- Burato, C.; Campestrini, S.; Han, Y.-F.; Canton, P.; Centomo, P.; Canu, P.; Corain, B. Chemoselective and re-usable heterogeneous catalysts for the direct synthesis of hydrogen peroxide in the liquid phase under non-explosive conditions and in the absence of chemoselectivity enhancers. Appl. Catal. A Gen. 2009, 358, 224–231. [Google Scholar] [CrossRef]
- Meneghini, C.; Artioli, G.; Balerna, A.; Gualtieri, A.F.; Norby, P.; Mobilio, S. Multipurpose imaging-plate camera for in situ powder XRD at the GILDA beamline. J. Synchrotron Radiat. 2001, 8, 1162–1166. [Google Scholar] [CrossRef]
- Kan, C.; Cai, W.; Li, C.; Zhang, L.; Hofmeister, H. Ultrasonic synthesis and optical properties of Au/Pd bimetallic nanoparticles in ethylene glycol. J. Phys. D Appl. Phys. 2003, 36, 1609–1614. [Google Scholar] [CrossRef]
- Fagherazzi, G.; Canton, P.; Riello, P.; Pernicone, N.; Pinna, F.; Battagliarin, M. Nanostructural features of Pd/C catalysts investigated by physical methods: A reference for chemisorption analysis. Langmuir 2000, 16, 4539–4546. [Google Scholar] [CrossRef]
- Pritchard, J.; Kesavan, L.; Piccinini, M.; He, Q.; Tiruvalam, R.; Dimitratos, N.; Lopez-Sanchez, J.A.; Carley, A.F.; Edwards, J.K.; Kiely, C.J.; et al. Direct synthesis of hydrogen peroxide and benzyl alcohol oxidation using Au−Pd catalysts prepared by sol immobilization. Langmuir 2010, 26, 16568–16577. [Google Scholar] [CrossRef]
- Campos-Martin, J.M.; Blanco-Brieva, G.; Fierro, J.L.G. Hydrogen peroxide synthesis: An outlook beyond the anthraquinone process. Angew. Chem. Int. Ed. 2006, 45, 6962–6984. [Google Scholar] [CrossRef]
- Samanta, C. Direct synthesis of hydrogen peroxide from hydrogen and oxygen: An overview of recent developments in the process. Appl. Catal. A Gen. 2008, 350, 133–149. [Google Scholar] [CrossRef]
- Lewis, R.J.; Hutchings, G.J. Recent advances in the direct synthesis of H2O2. ChemCatChem 2019, 11, 298–308. [Google Scholar] [CrossRef]
- Herzing, A.; Watanabe, M.; Edwards, J.K.; Conte, M.; Tang, Z.-R.; Hutchings, G.J.; Kiely, C.J. Energy dispersive X-ray spectroscopy of bimetallic nanoparticles in an aberration corrected scanning transmission electron microscope. Faraday Discuss. 2008, 138, 337–351. [Google Scholar] [CrossRef] [PubMed]
- García, T.; Murillo, R.; Agouram, S.; Dejoz, A.; Lázaro, M.J.; Torrente-Murciano, L.; Solsona, B. Highly dispersed encapsulated AuPd nanoparticles on ordered mesoporous carbons for the direct synthesis of H2O2 from molecular oxygen and hydrogen. Chem. Commun. 2012, 48, 5316–5318. [Google Scholar] [CrossRef] [PubMed]
- Epicier, T.; Sato, K.; Tournus, F.; Konno, T. Chemical composition dispersion in bi-metallic nanoparticles: Semi-automated analysis using HAADF-STEM. J. Nanopart. Res. 2012, 14, 1106. [Google Scholar] [CrossRef]
© 2019 by the authors. Licensee MDPI, Basel, Switzerland. This article is an open access article distributed under the terms and conditions of the Creative Commons Attribution (CC BY) license (http://creativecommons.org/licenses/by/4.0/).