Article

Carbon Spheres as CO2 Sorbents

1
Institute of Chemical and Environment Engineering, Faculty of Chemical Technology and Engineering, West Pomeranian University of Technology in Szczecin, Pulaskiego 10, 70-322 Szczecin, Poland
2
Engineering Faculty, Chemistry Department, Foothill College, 12345 El Monte Road, Los Altos Hills, CA 94022, USA
*
Author to whom correspondence should be addressed.
Appl. Sci. 2019, 9(16), 3349; https://doi.org/10.3390/app9163349
Submission received: 27 June 2019 / Revised: 5 August 2019 / Accepted: 12 August 2019 / Published: 15 August 2019

Abstract

:
Microporous nanocarbon spheres were prepared by using a microwave assisted solvothermal method. To improve the carbon dioxide adsorption properties, potassium oxalate monohydrate and ethylene diamine (EDA) were employed, and the influence of carbonization temperature on adsorption properties was investigated. For nanocarbon spheres containing not only activator, but also EDA, an increase in the carbonization temperature from 600 °C to 800 °C resulted in an increase of the specific surface area of nearly 300% (from 439 to 1614 m2/g) and an increase of the CO2 adsorption at 0 °C and 1 bar (from 3.51 to 6.21 mmol/g).

1. Introduction

The global economy requires a great amount of energy, which is produced primarily by the combustion of fossil fuels. Carbon dioxide emissions are a significant negative side-effect of this activity. Transportation also requires a great amount of petroleum and is responsible for significant emissions of greenhouse gases [1,2]. The cumulative emission of CO2 strongly contributes to climate change and is the greatest single contributor to the greenhouse effect [3,4]. The average concentration of CO2 in the earth’s atmosphere in 2018 was 407 ppm, which is about 40% higher than in the preindustrial age [5]. The effort to develop technologies that will reduce CO2 emissions is very important for both the global economy and the environment.
Recently, methods of CO2 capture from flue gas have been based on absorption into liquids (e.g., amines [6] or methanol [7]). These technologies are energy intensive and not environmentally sound. Solid sorbents offer an alternative solution. There are a number of criteria that must be met for a successful sorbent material, namely: high selectivity and adsorption capacity for CO2, fast adsorption/desorption kinetics, efficient regeneration of sorbents, and low cost [8].
In recent years, a number of materials have been investigated as solid state adsorbents for CO2, such as: zeolites [9], silica [10], porous polymer materials [11], metal organic frameworks [12], and carbon materials [13,14,15,16]. The most efficient for CO2 adsorption are carbon materials, which exhibit a high surface area, large porous volume, chemical stability, affinity for carbon dioxide, low cost, and the possibility of modification with heteroatoms [17]. The weak side of carbon sorbents is their poor selectivity.
The application of carbon materials for CO2 uptake has been widely investigated. There are many sources of carbon that can be used for the production of activated carbon: polymers, biomass, or resins. Some examples are shown in Table 1. Potassium compounds, namely potassium hydroxide or potassium oxalate, are most often used as chemical activators. Special attention should be paid to resins. Gradual growth of the polymer chain allows incorporating modificators into the carbon matrix. Homogeneously distributed activator can improve not only the surface area of the material (impregnation), but its whole volume. A resorcinol–formaldehyde resin mixture could be a suitable carbon source for CO2 adsorption.
According to the results presented in Table 1, resins are very promising as a carbon source to produce solid sorbents for carbon dioxide capture.
Among nanocarbon materials, spherical structures have been widely studied. The most popular method to obtain porous nanocarbon spheres is the method of Stöber, using resins as a carbon source. The application of this method to produce carbon spheres was described in the work of Liu et al. [26], where the source of carbon was a resorcinol–formaldehyde resin. Thanks to the development of the Stöber method, researchers discovered a simple method to produce polymer beads. The product was in the form of spherical regular particles. Since then, the phenol derivatives were widely used as a carbon source [27,28]. In work by Zhao and co-workers [28], using 3-aminophenol as a precursor, highly monodisperse material were obtained. They also proved that changing different parameters allowed for tuning spherical size in a very broad range.
To enhance the surface area and porous volume, various processes of activation are employed, with two primary methods to activate carbon materials. First, physical activation carried out through carbonization in the presence of proper gases [29]. Second, chemical activation is induced by the addition of a strong base, i.e., potassium oxalate [19], potassium hydroxide [20,30,31], and potassium carbonate [32]. In the work of Choma et al. [18], chemical activation with potassium oxalate resulted in a large increase in the surface area of carbon materials (from 680 m2/g to 1490 m2/g) and an increase of CO2 uptake from 3.03 mmol/g to 7.67 mmol/g in 0 °C at 1 atm. This example showed how modification with potassium oxalate can significantly enhance specific surface area and CO2 adsorption of carbon spheres.
In order to improve synthesis conditions of carbon nanospheres, microwave assisted solvothermal reactor has been used [33,34]. Performing the reaction in a common autoclave takes a significant amount of time, often several hours, while the reaction in microwave assisted solvothermal reactor is very fast, about 15 min. The temperature gradient using a microwave in the reactor volume is very low and can be negligible. The microwave’s influence on the behavior of polar solvents in the reaction is significant, and volume nucleation points are created rapidly.
In this work, the influence of the concentration of activator, potassium oxalate, carbonization temperature, and influence of ethylene diamine (EDA) on the physical properties and adsorption of carbon dioxide were investigated.
Ludwinowicz and Jaroniec [19] performed a simple one-pot synthesis of carbon spheres and obtained very good CO2 adsorption values. In this work, simple autoclave was replaced by microwave assisted solvothermal reactor. The use of such a reactor enabled a significantly shortened reaction time. Heating with microwaves avoids a variance in the temperature profile in the reactor volume, no local overheating, and the products obtained are of very good quality, with uniform shape and size of the produced particles.
Previous research obtained in this research community has been promising [33,34]. In the present work, we describe more in depth research on the influence of modificator and carbonization temperature on surface area, porosity, and carbon dioxide adsorption.

2. Experimental

2.1. Sample Preparation

The samples were synthesized as follows: First, an aqueous–alcohol solution consisting of 60 mL distilled water and 24 mL ethanol was prepared by mixing at an ambient temperature. Subsequently, 0.60 g of resorcinol and 0.30 mL of ammonium hydroxide (25 wt.%) was added to the mixture under continuous stirring for 10 min. After dissolving of the resorcinol, the proper amount of potassium oxalate was added and the mixture was stirred for 30 min. The weight ratio potassium: carbon was 7:1 and 9:1. For samples modified with EDA, 0.3 mL of EDA was added. Next, 0.9 mL of 37 wt.% formaldehyde was dropped into the solution and kept under magnetic stirring for 24 h. Afterwards, the solution was treated in a solvothermal microwave reactor ERTEC MAGNUM II (pressure 2 MPa, time—15 min). The resulting materials were dried at 80 °C for 48 h. The carbonization of the carbon nanospheres was performed in argon atmosphere at 350 °C for 2 h with a heating rate of 1 °C/min, then the temperature was raised to 600 °C, 700 °C, or 800 °C with the same heating rate and also for 2 h. The materials obtained were washed two times with 200 mL of distilled water and dried at 80 °C for 48 h.

2.2. Characterization

The morphology of the produced samples was determined using a Hitachi SU8020 Ultra-High Resolution Field Emission Scanning Electron Microscope (FE-SEM).
The density of the materials was determined using a helium pycnometer Micro-Ultrapyc 1200e.
The chemical composition of the samples’ surface was studied by X-ray Photoelectron Spectroscopy (XPS). The measurements were conducted using Mg Ka (hν = 1253.6 eV) radiation in a Prevac (Poland) system equipped with a Scienta (Sweden) SES 2002 electron energy analyzer operating with constant transmission energy (Ep = 50 eV). The analysis chamber was evacuated to a pressure below 1∙10−9 mbar. A powdered sample of the material was placed on a stainless steel sample holder.
Thermal stability of the produced materials was investigated using Thermal Gravimetric Analysis (TGA). The thermogravimetric measurements were carried out with the use of STA 449 C thermobalance (Netzsch Company, Germany). Approximately 10 mg of the sample was heated at 10 °C/min to 950 °C under air atmosphere.
To determine textural properties of the carbon spheres, the low temperature physical adsorption of nitrogen was carried out at −196 °C using the Quadrasorb volumetric apparatus (Quantachrome Instruments). Carbon dioxide uptake was gathered at temperature 0 °C and 25 °C using the same apparatus.

3. Results and Discussion

3.1. Samples’ Morphology

The morphology of the carbon spheres was studied using Scanning Electron Microscopy (SEM). The SEM images of the samples carbonized in 700 °C are shown in Figure 1. For the material without modification (Figure 1a), small, monodisperse spheres were obtained. The average diameter of the carbon spheres was determined by SEM to be about 400 nm. For the material prepared by the addition of the activator (potassium oxalate, Figure 1b), two classes of spheres were observed: smaller spheres, about 500 nm in diameter, and larger, about 2–3 µm. The large difference in the diameter of the spheres was the result of the addition of potassium oxalate. The resorcinol–formaldehyde spheres were influenced by the oxalate moieties, and thus larger spheres were formed. However, there was a fraction of the smaller spheres, where oxalate moieties were likely less present. The higher concentration of potassium oxalate (Figure 1c) resulted in higher saturation of the solution. The spheres containing more potassium oxalate were larger. Nonetheless, there was a large amount of small spheres, which did not contain oxalate moieties. Thus, a large amount of carbon material was not modified.
For the material modified with EDA only (Figure 1d), the monodispersity of the spheres was kept, however larger spheres (diameter ca. 800 nm) were formed. The larger diameter and the monodispersity of the spheres are evidence that EDA was well dispersed in the whole volume, and so, all carbon spheres contained EDA. In the case of the material modified with both EDA and potassium oxalate (Figure 1e), the influence of both modifiers can be noticed. The average diameter of the spheres was larger and the spheres were more uniform. EDA provided better dispersion of potassium oxalate in the reaction volume, thus potassium ions were present in a higher amount of the spheres. In the end, a much bigger specific surface area value was reached.
The size distribution of the produced particles was evaluated from the SEM images using the ImageJ software tool and is illustrated in Figure 2a–e. The quantity of spheres taken into account was 50 for every kind of the sample.
The results for the reference sample are given in Figure 2a. RF 700 exhibited the highest monodispersity among all the samples. The diameter of the spheres was about 600 nm.
The modification of carbon materials with the lower content of potassium oxalate resulted in higher variation in the spheres’ size distribution. A considerable amount of produced spheres had a diameter from 300 to 1000 nm, as shown in Figure 2b. With the increase of the carbonization temperature, the formation of larger spheres (about 2000 nm) was observed. For the material carbonized at 600 °C, the majority of spheres were about 500 nm, whereas on the other hand for the sample carbonized at 800 °C, this value shifted to about 700 nm.
Comparing the samples with different amounts of activator, the strong influence of the activator concentration on the spheres’ size was noticed. Higher activator content in the samples resulted in the widest size distribution (Figure 2c). Moreover, the large spheres of diameter over 2000 nm were formed.
The size distribution of the samples modified with EDA only is presented in Figure 2d. Compared to the samples modified with potassium oxalate, the highest monodispersity of the spheres was gained. Nonetheless, increasing the carbonization temperature caused the distribution to be broader.
As can be seen in Figure 2e, the application of both the modificators limited the production of the large spheres (over 2000 nm). Unlike previous distributions, by increasing the carbonization temperature, the shift of distribution towards smaller spheres was noticed.

3.2. Surface Chemistry

The surface composition of materials was analyzed by X-ray Photoelectron Spectroscopy (XPS). The survey spectra acquired for all analyzed samples are shown in Figure 3. The evaluation of the elemental composition of the surface of all samples is presented in Table 2. In all samples, carbon and oxygen was present, and potassium was observed in samples prepared with potassium oxalate.
The highest carbon content was observed for the pure carbon material (RF_700); oxygen constitutes only 3% of the surface atoms. The surface of the samples prepared with EDA only also contained a relatively small number of oxygen atoms (approximately 4%), however those surfaces also contained about 4% of nitrogen atoms. The presence of potassium in the internal structure of the material is associated with an increased concentration of oxygen atoms. The more potassium observed in the material, the higher the concentration of oxygen observed, as residual potassium atoms were bound with oxygen. In general, when the carbonization temperature was increased to 800 °C, this resulted in a lower oxygen concentration than that observed for samples carbonized at 600 °C. There is noticeably more potassium retained on the surface of the samples modified by both potassium oxalate and EDA in comparison to materials modified by potassium oxalate only. A possible explanation for this is that a reaction of potassium with amine groups occurred.
The analysis of high-resolution XPS data brings a more detailed view of the chemistry of the surface of the studied materials. In Figure 4, the spectral region of binding energy between 280 eV and 300 eV is displayed for two samples of carbon spheres obtained with the weight ratio potassium: carbon of 9:1 (RF_9_1_600 and RF_9_1_800). This region contains the spectrum components originating from C 1s and K 2p electrons. The peak maximum of K 2p3/2 is located at 293 eV and it is accompanied with a K 2p1/2 spin-orbit component at 295 eV. The peak maximum of XPS C 1s spectrum is located at 284.4 eV. This energy is characteristic for highly graphitized carbon materials. However, a distinctive shoulder at about 288 eV is present in the spectrum for both samples, though more prominent on the sample carbonized at 600 °C. This position is usually ascribed to the general group of carbon moieties containing O–C=O bindings. The intensity of the spectra is normalized in respect to the intensity of the main peak of carbon. It can be pointed out that the relative intensity of lines corresponding with potassium atoms as well as carbon atoms in O–C=O bindings decreases in comparison to C–C bonds, reflected by XPS C 1s peak at 284.4 eV. This shows that increased carbonization temperature results in a partial depletion of potassium atoms from the surface as well as a decomposition of a part of C–O bonds. This corresponds well with the quantitative analysis described above. Similar observations are also valid for samples with a lower potassium:carbon ratio.
Slightly different behaviour of the surface species is observed for samples prepared with EDA. In Figure 5, the spectral region of the binding energy between 280 eV and 300 eV is displayed for two samples of carbon spheres obtained with the weight ratio potassium:carbon of 7:1 with the addition of EDA (RF_7_1_EDA600 and RF_7_1_EDA800). The position of the K 2p peaks is identical to samples without EDA admixture, indicating that the chemical state of potassium atoms is not changed by EDA presence during the preparation stage. However, the peak maximum of the C 1s line for sample RF_7_1_EDA600 is located at 284.6 eV, which is characteristic for C–C bonding in aliphatic sp3 bonds or non-graphitic amorphous carbon. For the sample carbonized at 800 °C, the respective peak maximum of C 1s line is shifted to 284.4 eV. Similar to the samples prepared without EDA, this peak position is assigned to C–C bonds in graphitized carbon material. It is worth noting that the relative intensity of K 2p lines for 600 °C and 800 °C of carbonization is only slightly changed.

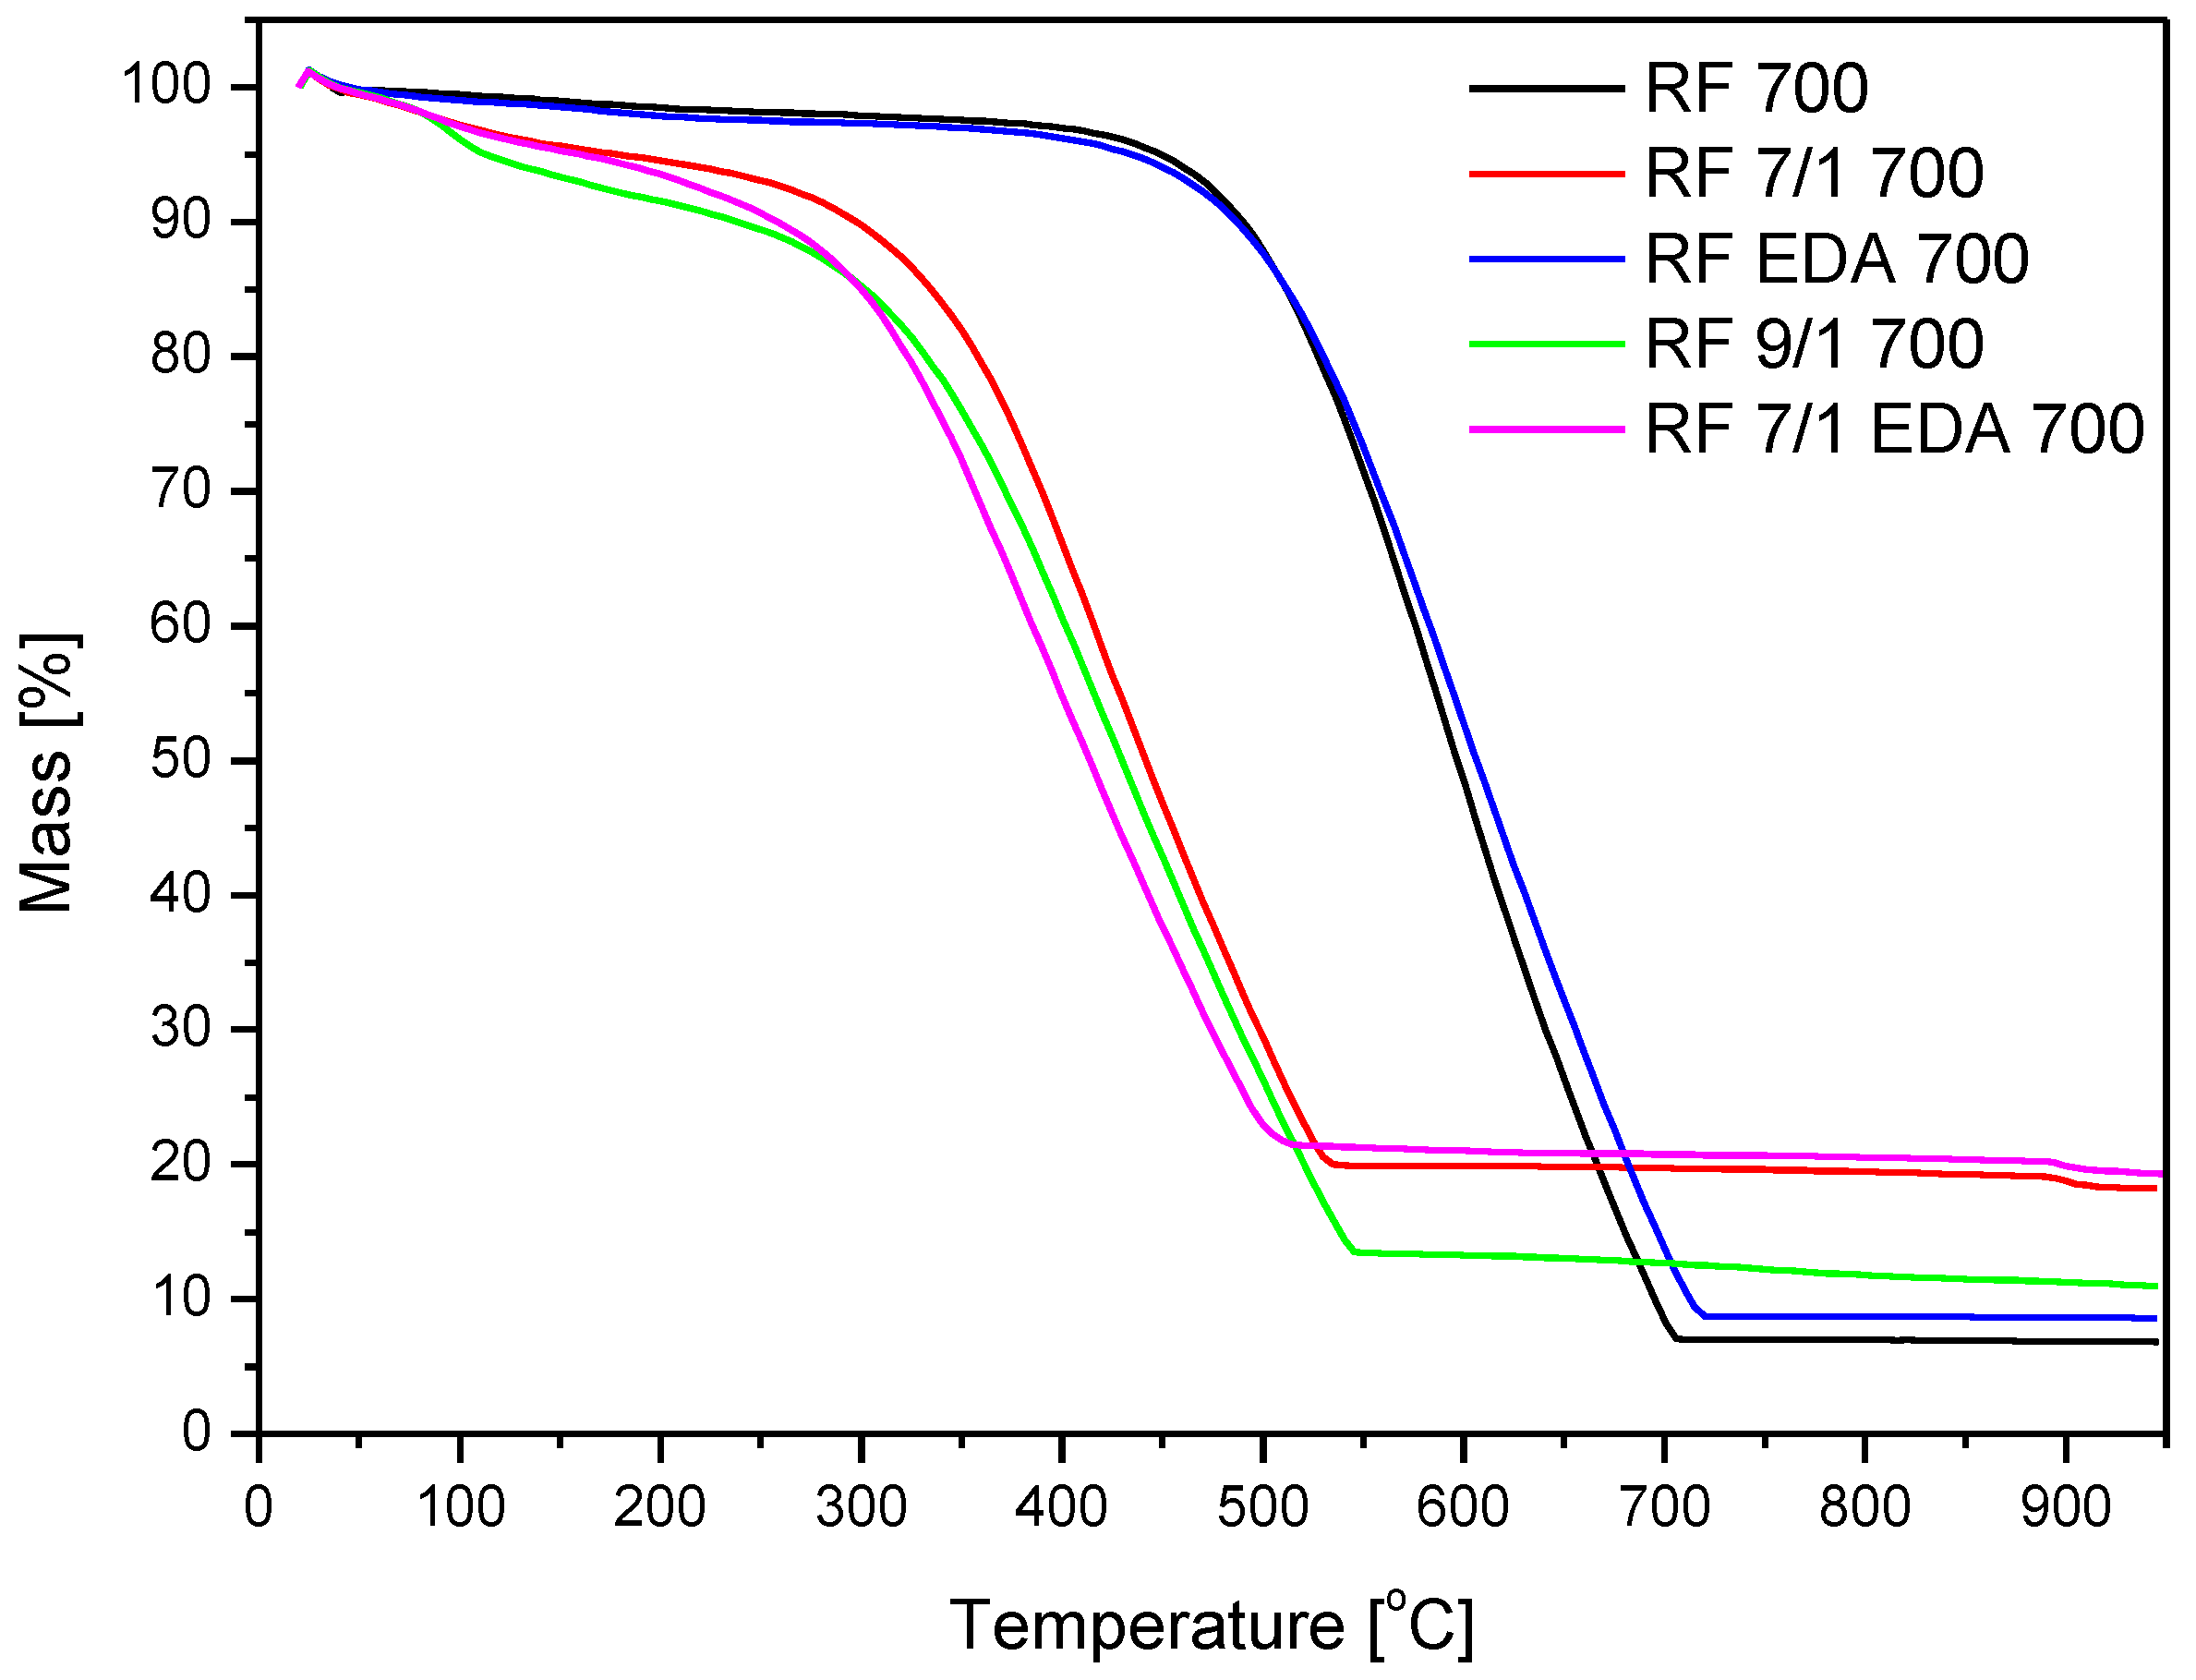
3.3. Thermogravimetric Analysis

In order to investigate the thermal stability of the samples, thermogravimetric measurements were performed. The results of the TGA studies are shown in Figure 6 and Table 3. The reference sample began to lose mass at about 364 °C. This can be explained by the decomposition of the functional groups. Further, the decomposition of the carbon matrix occurred.
Compared with the non-modified sample RF 700, the addition of the EDA alone did not affect the thermal stability of the sample. On the contrary, the addition of potassium oxalate led to a significant decrease of the thermal stability. All samples containing potassium oxalate were characterized by a lower decomposition temperature. Potassium ions are attracted to polar water molecules, thus the addition of potassium to the carbon matrix resulted in higher hydrophilicity of the material. The mass loss began at 100–150 °C because of the removal of water molecules. Due to mobile energized potassium ions, the depleted carbon matrix is less resistant to thermal decomposition (start of decomposition was detected at about 180 °C).
The thermal stability of the sample with the addition of both modificators was similar to that modified with potassium oxalate only.

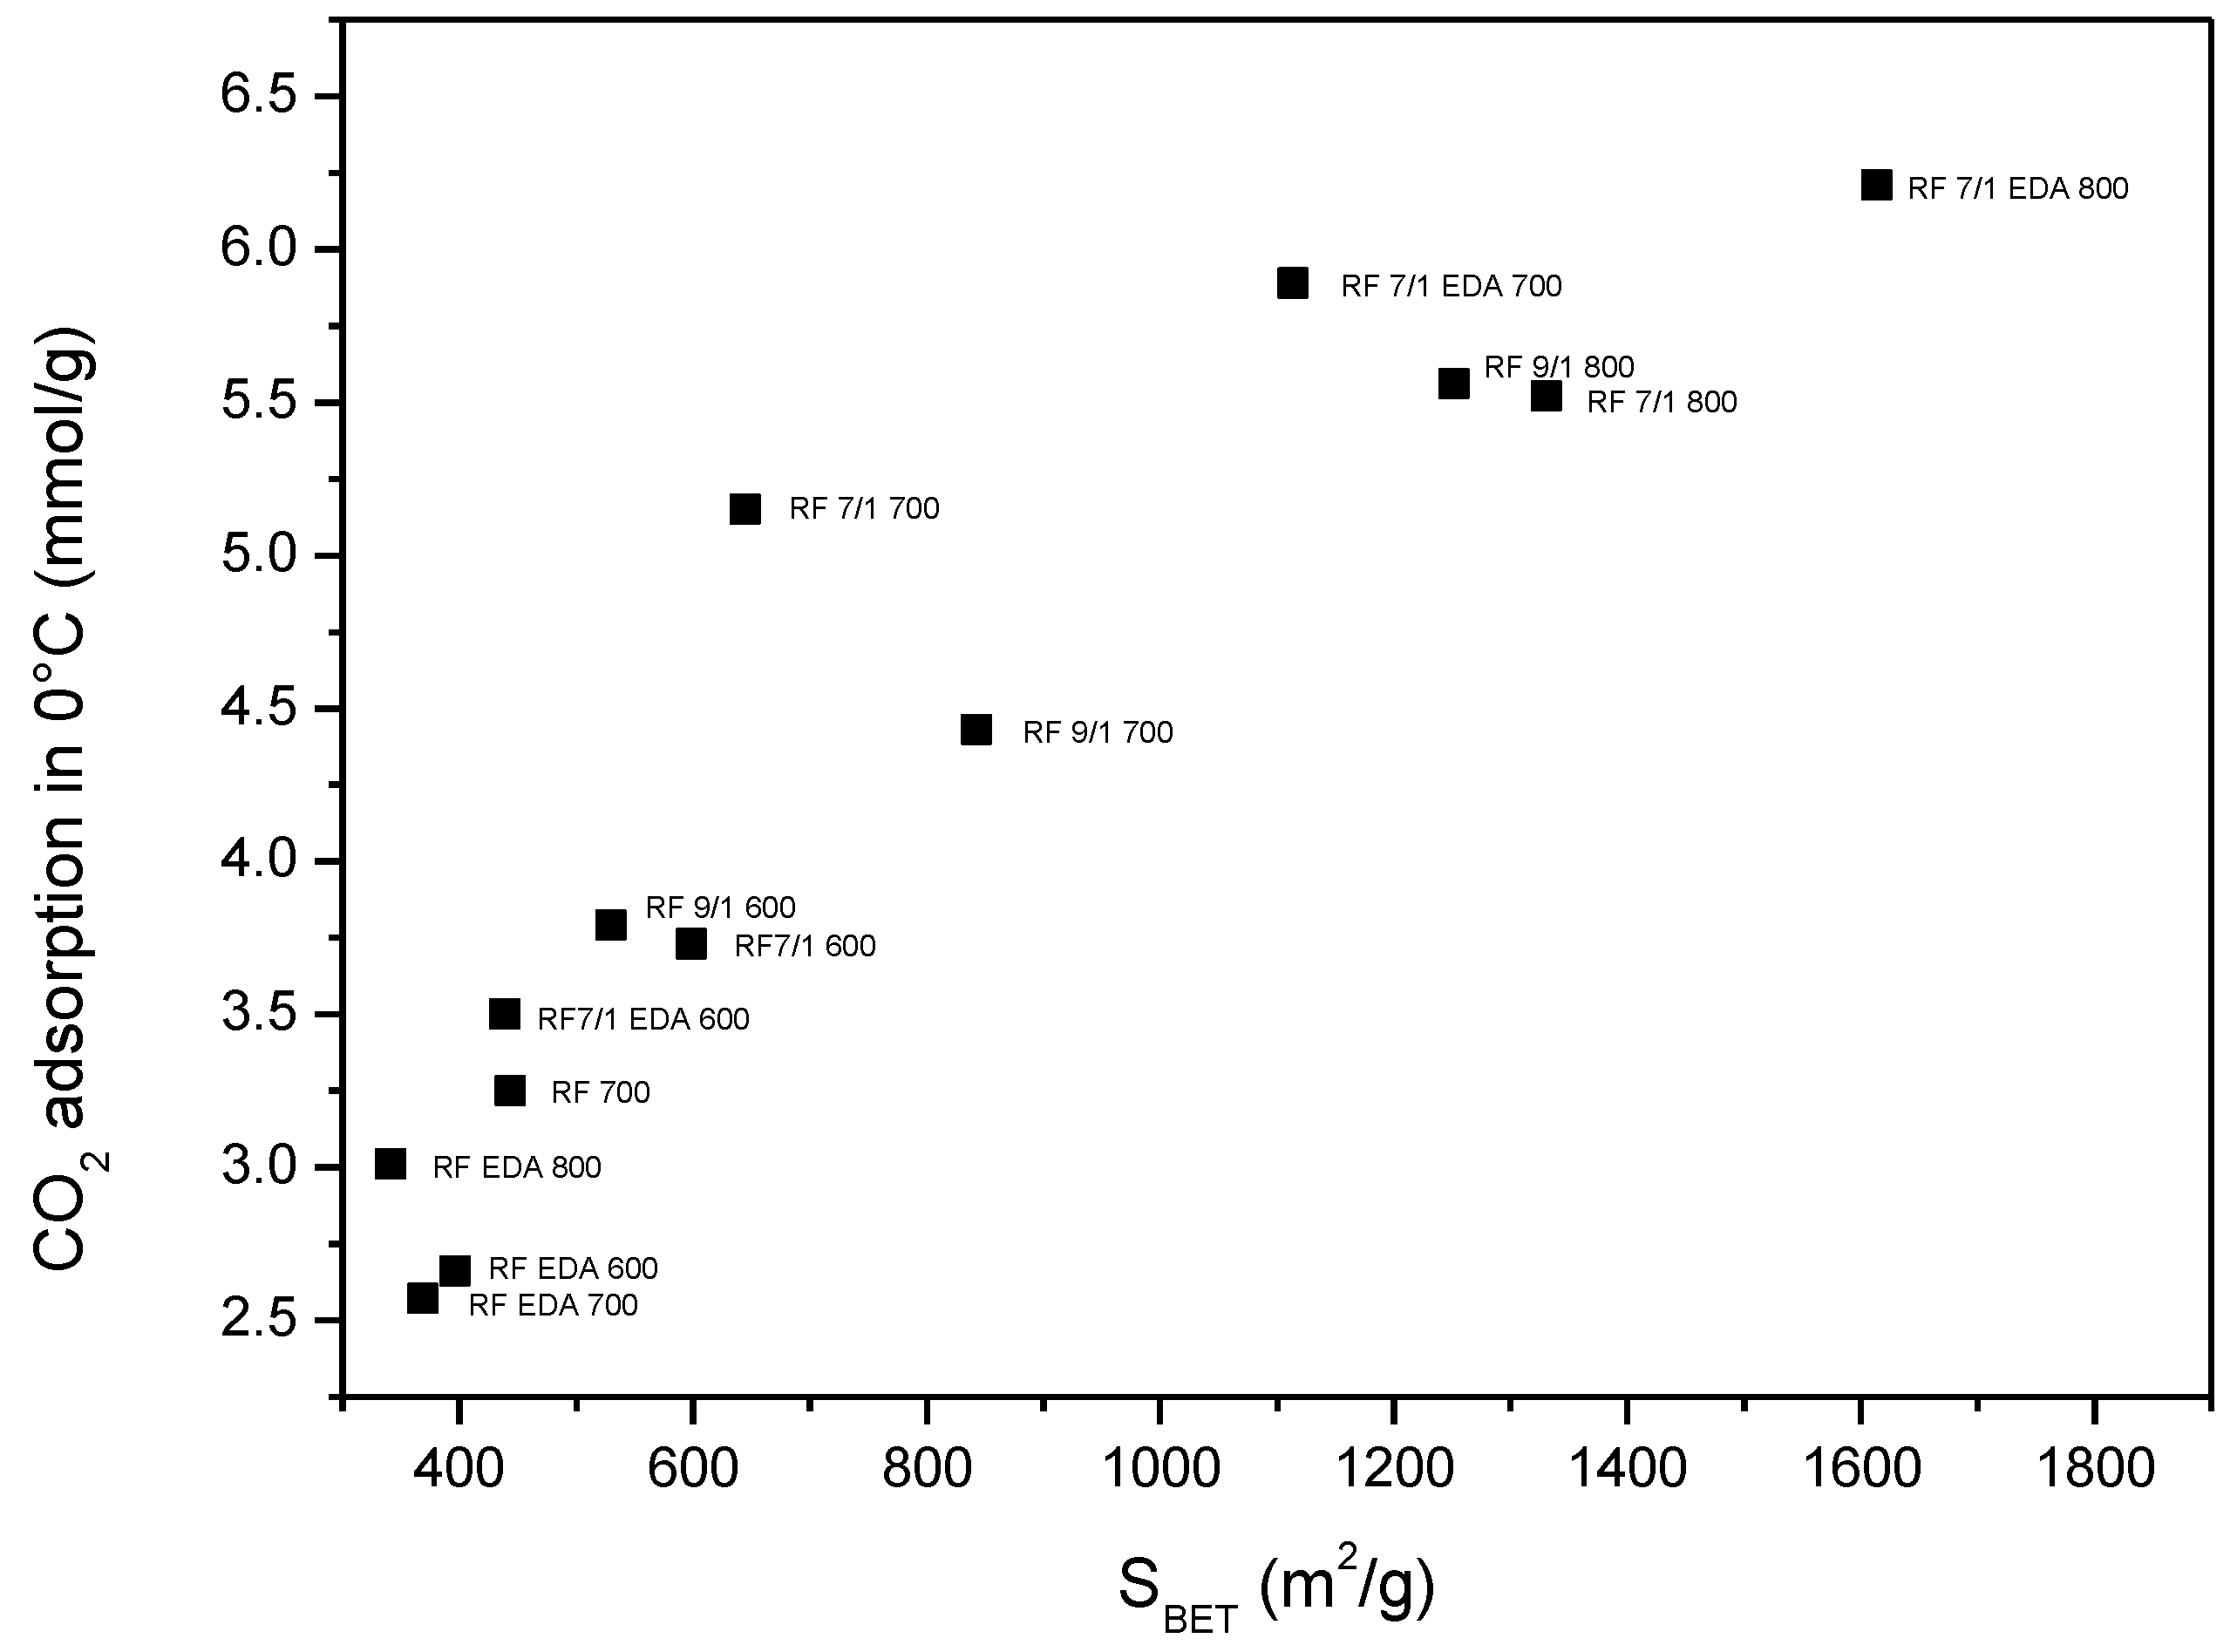
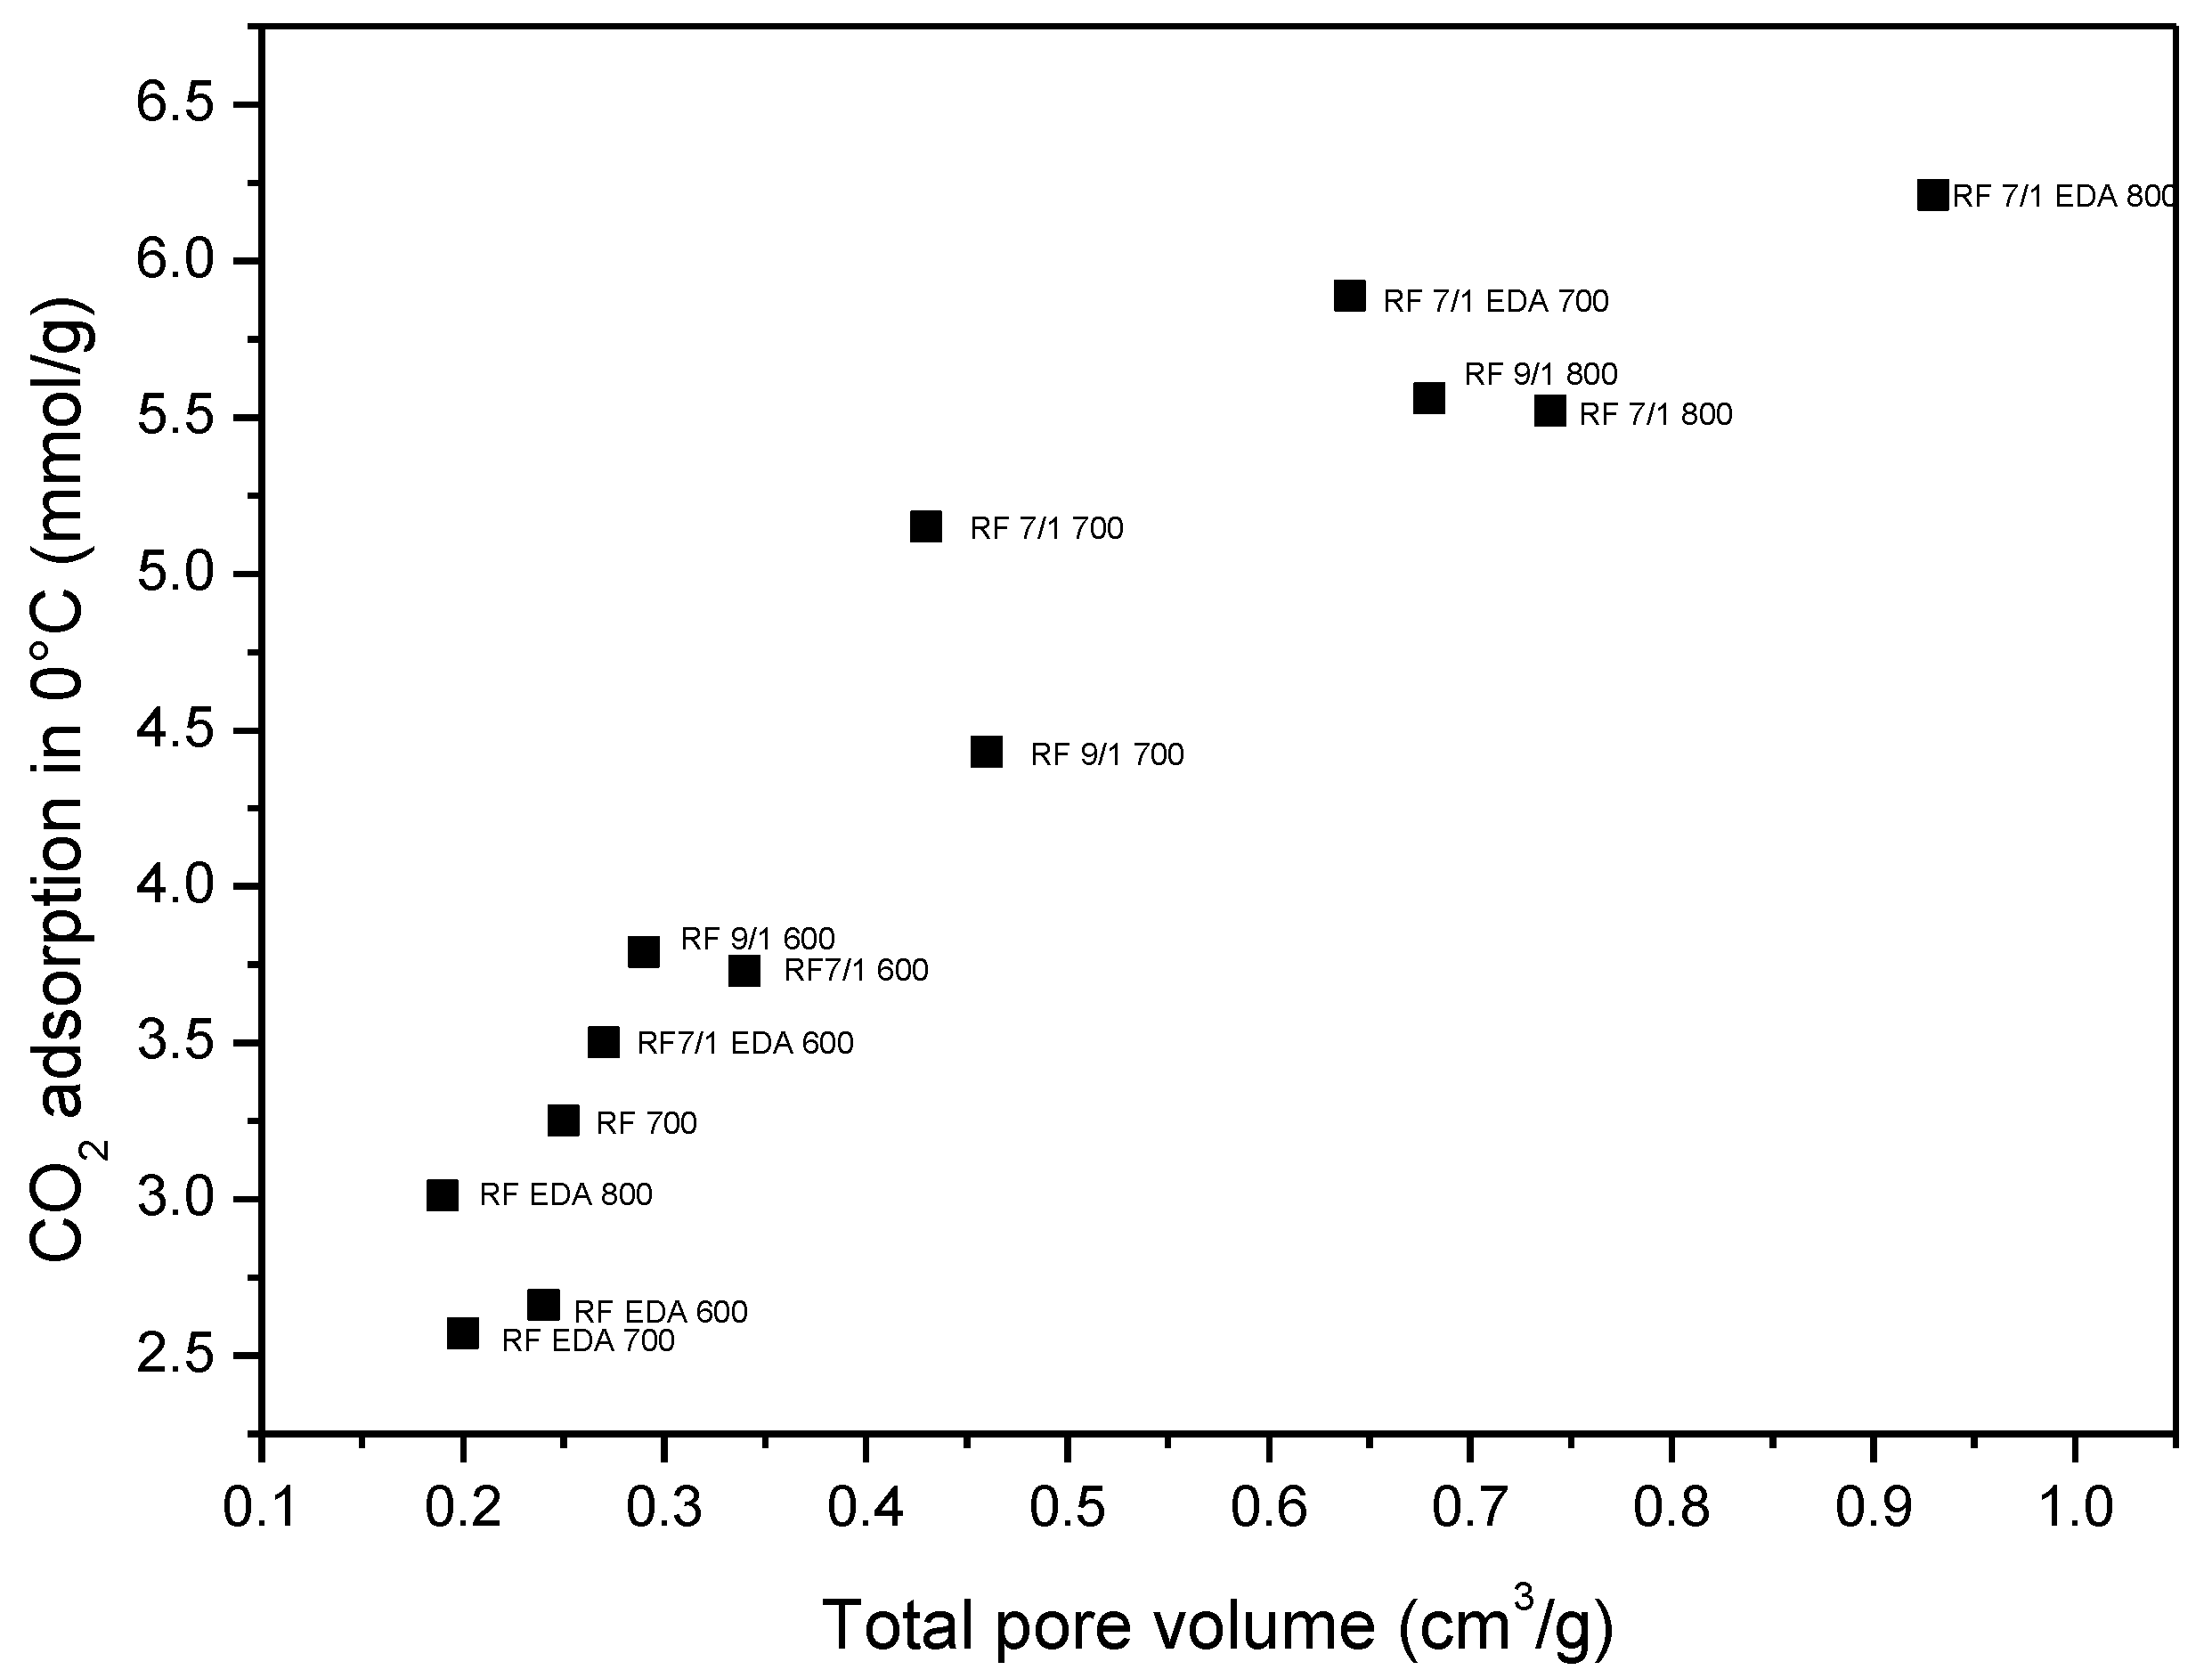
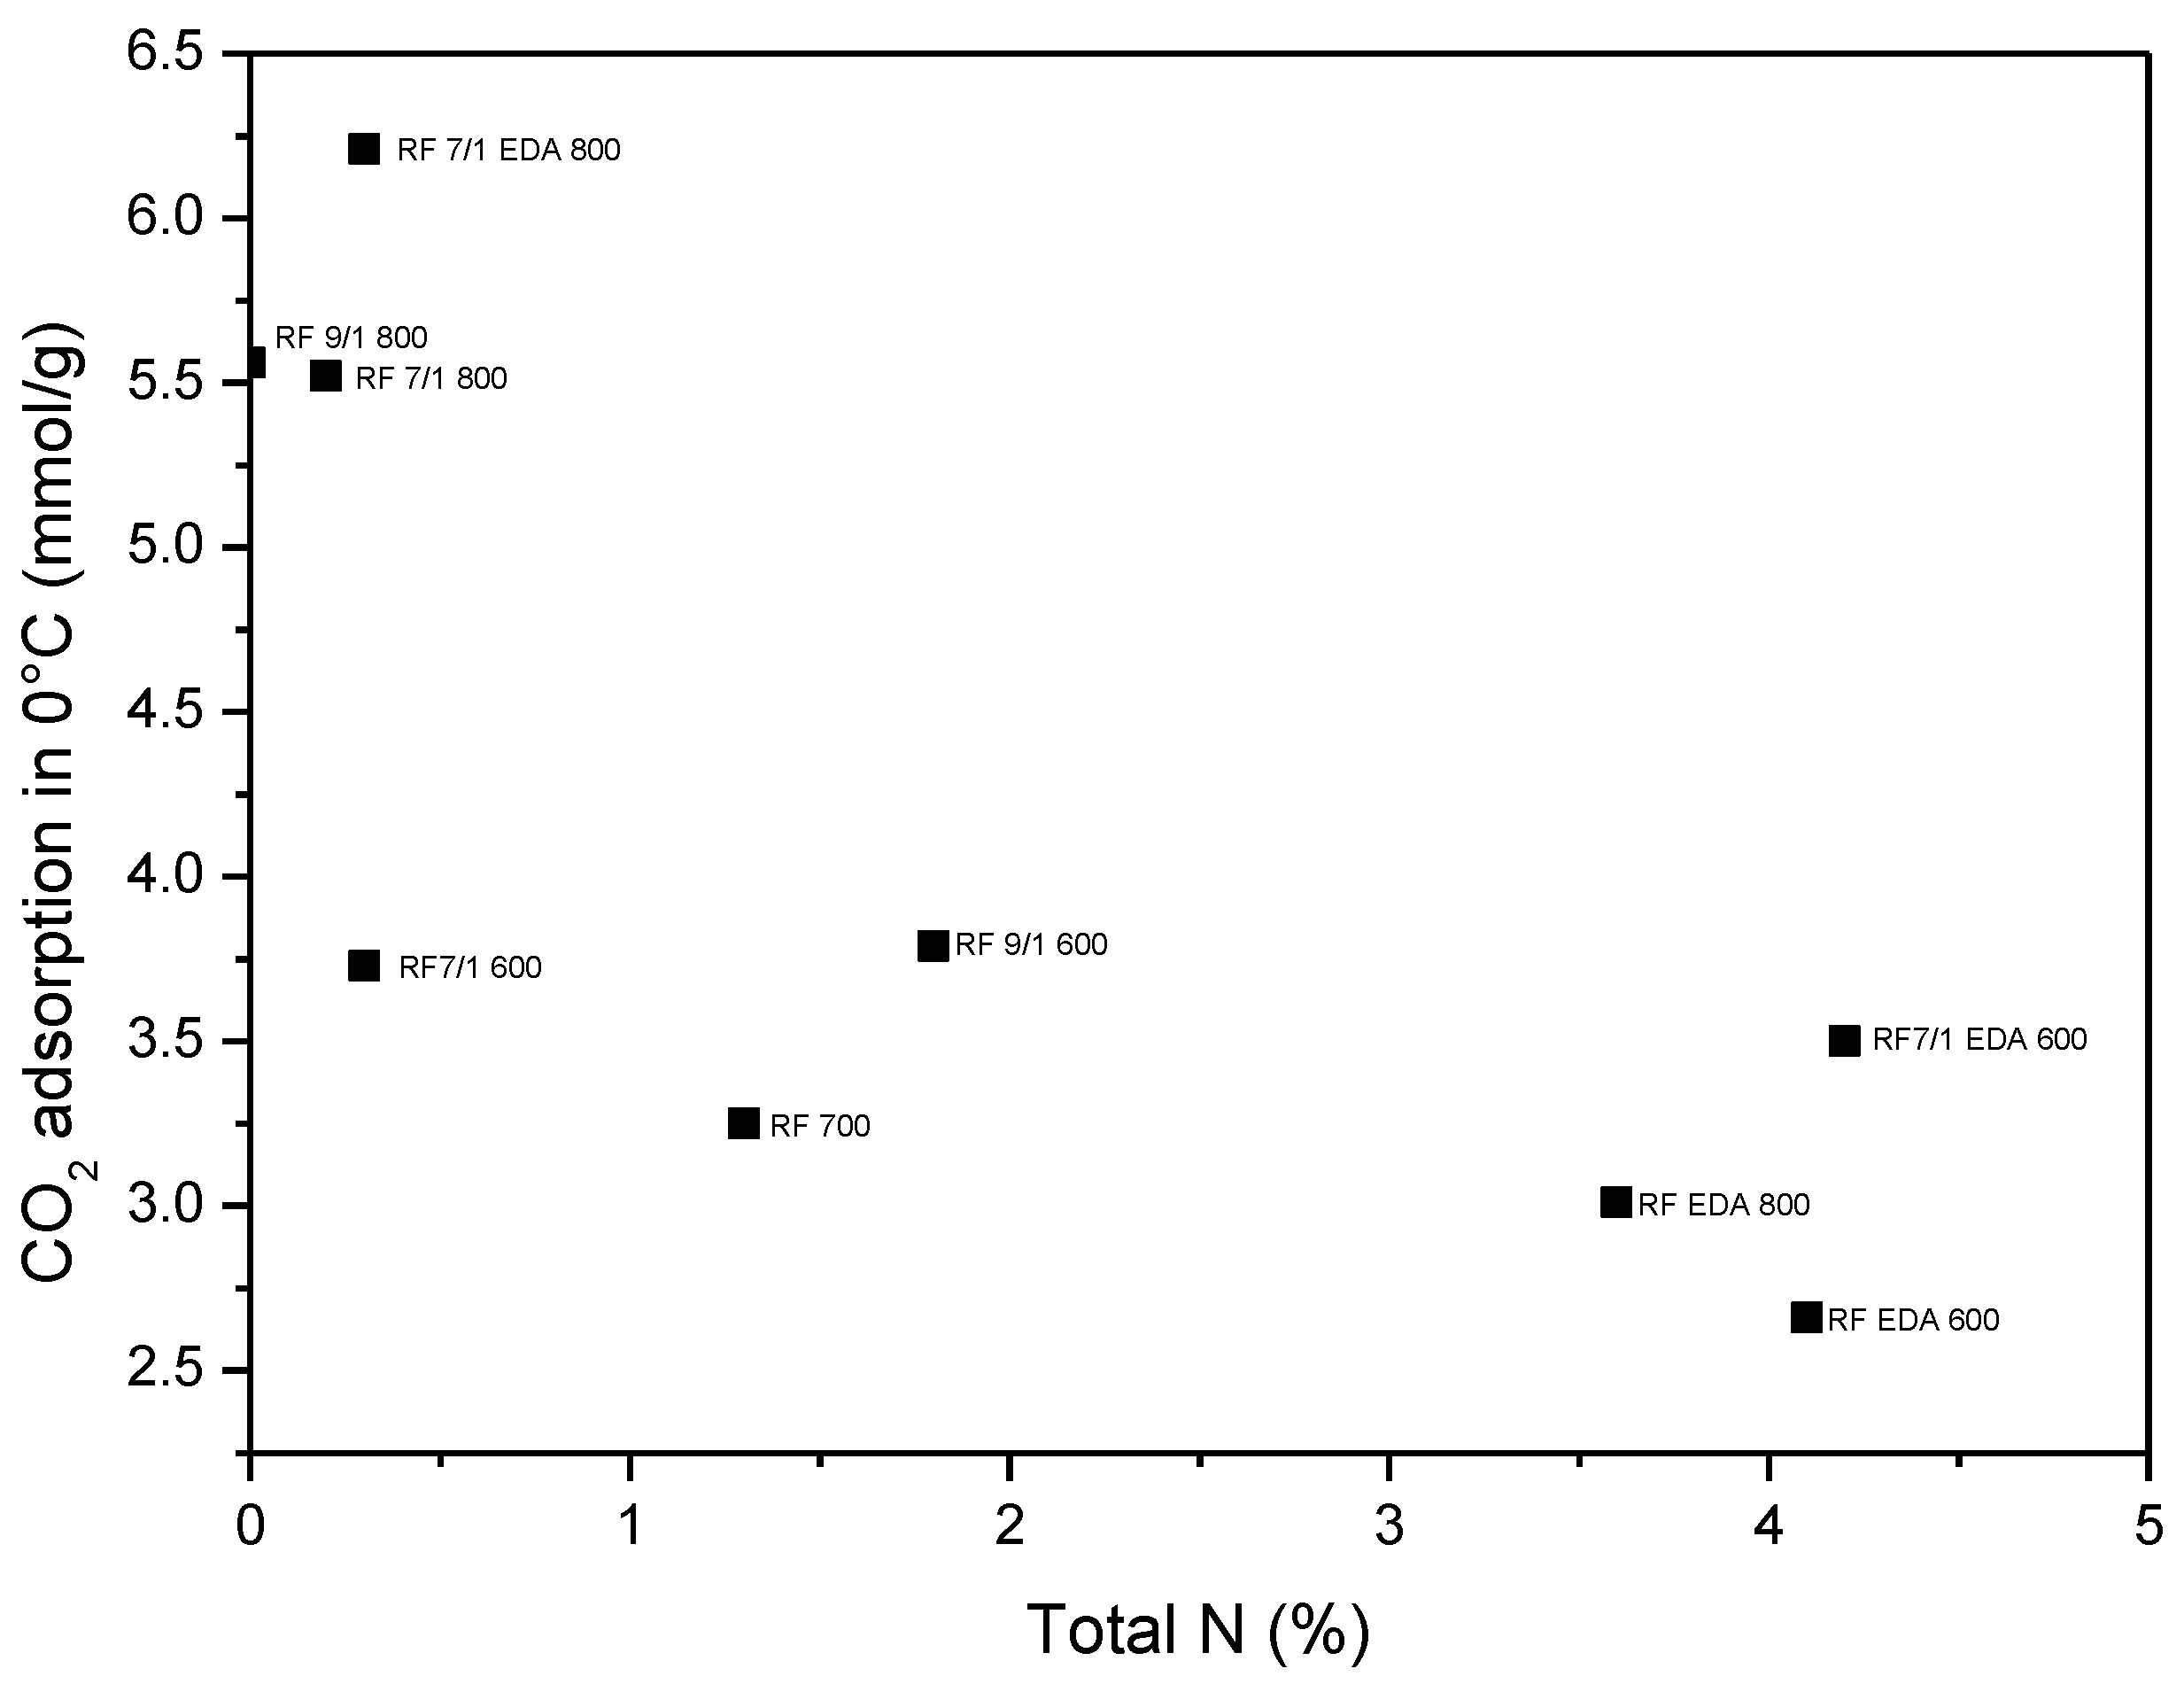
3.4. Adsorption Studies

According to the low-temperature nitrogen adsorption–desorption studies, for samples modified with oxalate only, the increase of carbonization temperature resulted in a higher volume of adsorbed nitrogen. The opposite effect was observed for samples modified with EDA only. The addition of both modificators gave a similar result to the use of oxalate only.
Some examples of low-temperature nitrogen adsorption isotherms are shown in Figure 7.
The isotherms are of type Ia [35], characteristic for microporous materials, however a slight increase of adsorbed nitrogen volume at the highest P/P0 can be attributed to the presence of macropores (type II). Spheres, modified with EDA only, adsorbed the lowest nitrogen volume. Modification with potassium oxalate resulted in higher nitrogen adsorption, slightly increasing with dopant concentration. The highest amount of nitrogen was adsorbed in the sample modified with both potassium oxalate and EDA.
Physico-chemical properties of the samples were measured, and the results are shown in Table 4. In almost all cases, except samples modified with EDA only, an increase in carbonization temperature resulted in an increase of the samples’ density, specific surface area, total pore volume, and CO2 adsorption. An unusual increase in density, simultaneously with an increase in surface area and porosity can be explained by the decomposition of modificators and removal of gaseous decomposition products. The same phenomenon was reported for activated carbon produced from palm shell and modified with potassium carbonate [36] or phosphoric acid [37].
An extremely high increase in specific surface area and CO2 adsorption was observed for the samples modified with both potassium oxalate and EDA. In contrast, samples without potassium oxalate carbonized at higher temperatures did not exhibit larger surface area, and a lower amount of CO2 was adsorbed (because of a lower microporosity). However, a higher concentration of the activator did not improve the specific surface area. Due to the higher saturation of the mixture, bigger spheres were formed, but oxalate moieties were not well dispersed within the volume of the sample (as shown before in SEM images).
For adsorption of carbon dioxide, the presence of the micropores below 1 nm is considered to be most important, and the pore size distribution in this area was calculated from CO2 adsorption at 0 °C and is shown in Figure 8.
In the research paper [21], doping of the carbon spheres with EDA was described. Increasing the EDA ratio (from 0.2 mL to 0.8 mL for 0.4 g of resorcinol) led to an improvement of specific surface area and CO2 uptake at 25 °C. The work of Sibera et al. [34] also reported a positive effect of a higher concentration of EDA as a modificator, improving the CO2 uptake. In the present paper, more detailed studies on the influence of carbonization temperature on samples modified with EDA were performed.
The samples modified with EDA showed much lower surface areas and CO2 adsorption than the reference sample RF 700. A higher carbonization temperature resulted in lower surface area (Table 4) and lower total pore volume, but an increase of the CO2 uptake was observed. This observation can be explained by higher micropore volume, below 0.4 nm for the sample RF EDA 800 (Figure 8). At elevated temperatures, carbon spheres have a tendency to aggregate, thus the effective surface area decreased. Density measurements proved the increase of density (from 1.59 g/cm3 for RF EDA 600 to 1.72 g/cm3 for RF EDA 800). In contrast, an increase in the carbonization temperature increased the volume of the pores below 0.4 nm (Figure 8) and consequently the CO2 adsorption capacity.
Significant differences were noticed for the samples modified with potassium oxalate. In the paper [19], Ludwinowicz and Jaroniec applied three potassium oxalate concentrations, with a K:C ratio of 3:1, 5:1, and 7:1. The growth in surface area (460 m2/g for pure material and 2130 m2/g for the highest concentration potassium oxalate) and CO2 adsorption (2.8 mmol/g for pure material and 6.6 mmol/g for the highest concentration potassium oxalate) was observed. In order to investigate the influence of the activator concentration on the physico-chemical properties of the spheres, we employed a higher concentration of potassium oxalate monohydrate (weight ratio K:C = 9:1). The specific surface area values were similar to the values for samples with a lower activator concentration. A significant difference in CO2 uptake at 0 °C and 25 °C was observed for sample RF 9/1 carbonized at 800 °C.
The microporosity of these samples carbonized in 700 °C is given in Figure 9. The sample RF 700, compared to the samples modified with potassium oxalate, had the lowest specific surface area. This was caused by a lack of energized potassium ions to interact with the carbon matrix and a lack of carbon dioxide released in the result of decomposition of potassium oxalate, creating porosity. For the sample RF 7/1 700, modified with the lower amount of activator, a significant increase of the microporosity in the range of width from 0.3 to 0.7 nm was observed. Application of the higher concentration of the activator in the sample RF 9/1 700 improved the specific surface area, but the lower amount of adsorbed CO2 was noticed, which was in agreement with the lower volume of pores below 0.7 nm, as shown in Figure 9. The highest values of the specific surface area and CO2 adsorption were obtained for the samples modified with potassium oxalate and EDA simultaneously. Energized potassium ions penetrated the nanocarbon material, but on the other hand, EDA improved the basicity of the material and distribution of the oxalate moieties throughout the nanocarbon sphere. For the sample RF 7/1 + EDA 700, the value of the specific surface area was twice as high as the sample modified with potassium oxalate only, but the CO2 adsorption was only slightly higher. The microporosities of both samples with a diameter of 0.7 nm were comparable. The sample RF 7/1 + EDA 700 had a higher volume of pores from 0.7 to 0.9 nm, however this feature did not improve the CO2 adsorption significantly. Despite the higher value of the specific surface area of the sample carbonized in 800 °C (500 m2), the CO2 uptake at 0 °C was only slightly better, however at 25 °C, a decrease of the adsorbed value for the sample RF 7/1 + EDA 700 was observed.
The adsorption capacity values of all samples are presented in Figure 10. The samples carbonized in 600 °C were more resistant to a decrease in CO2 adsorption at the higher adsorption temperature. Mostly, the increase of carbonization temperature led to higher surface area and CO2 adsorption, but a significant decrease of the adsorbed values of CO2 at 25 °C compared to 0 °C was observed.

4. Discussion

The modificators played a double role in this reaction system: first creating more porosity and second, giving a basic chemical character to the produced material.
In our previous paper [33], chemical activation of carbon spheres using a similar amount of potassium oxalate monohydrate was achieved. In the case of the materials prepared with potassium oxalate monohydrate, two activation mechanisms can be distinguished. First, potassium ions penetrate the carbon material and a high porosity material was formed [38]. The effect of a higher carbonization temperature resulted in more energetic potassium ions migrating into the nanocarbon spheres. Second, decomposition of potassium oxalate monohydrate at about 570 °C resulted in the release of CO2, which would help remove pyrolyzed volatile products from the carbon matrix and could also prevent an aggressive pore widening process, leading to better microporosity [39,40]. Potassium oxalate decomposes to release carbon dioxide and to form potassium carbonate. The latter decomposed above 700 °C, also with the release of carbon dioxide, and then, an increase of carbonization temperature from 700 to 800 °C resulted in an increase in specific surface area by over 100%, from 645 to 1331 m2/g (Table 4). Nonetheless, the CO2 adsorption values were only slightly enhanced (from 5.15 to 5.52 mmol/g at 0 °C).
EDA also decomposes at elevated temperatures, with the release of ammonia, carbon dioxide, carbon monoxide, nitrogen oxides, and/or volatile amines. However, the release of the gaseous decomposition products did not result in an increase of the porosity of the material. Thus, the use of EDA alone did not change the physical properties of the material.
The best results were obtained when both activators were applied. We posit that EDA reacted with potassium oxalate, forming the chelates, which improved the homogeneous distribution of potassium within the sample volume. This can be explained by the trapping of migrating potassium ions by amine groups. The ability of EDA to form chelates with metals (“amino acid metals”) is well known. Half of EDA produced by the Dow Chemical Company [41] is used as a chelating agent, forming complexes with certain metal ions to prevent the ions from interfering with processing or to promote buffering, concentration, separation, or transport.
Carbonization at high temperatures caused decomposition of both modificators and of the formed chelates, nevertheless some potassium remained in the samples and had a positive effect on the adsorption properties towards carbon dioxide, increasing surface basicity.
Potassium can form carbides with carbon. According to the literature [42], there is a possibility of the formation of the following potassium carbides: KC8, KC16, KC24, KC32, KC48, and KC60. These carbides have graphite-like lattices in which the metal atoms are situated between the layers of carbon atoms. The metal atoms are located at the centers of the carbon hexagons.
Relevance of the presence of pores below 1 nm in the matter of CO2 adsorption has been widely documented [43,44]. Presser and coworkers [45] claimed that under atmospheric pressure, the contribution of the pores below 0.8 nm to the CO2 adsorption was the most significant. Pore size distributions of the modified samples showed that use of chemical activator was necessary, i.e., potassium oxalate monohydrate was responsible for the creation of micropores beneath 0.4 nm.
Activation with potassium led to the creation of irregularities on the surface of carbon materials [46].
Gadkaree and Jaroniec [47] investigated pore structure development in carbon materials produced from resins. They fabricated two types of carbon honeycomb structures: standard type A, which involved phenolic resin as the liquid precursor, and type B, which involved the same phenolic resin but containing cobalt acetate dissolved at 1 wt.%. Both kinds of samples were carbonized in nitrogen at a high temperature and then activated in CO2. For samples of type A, only micropores (no mesopores at all) were formed and their volume increased as a result of the deepening of pores formed during carbonization. No pore broadening was observed for these samples. The introduction of a metallic catalyst (cobalt) in the precursor resin changed the pore structure dramatically (samples B). The pore structure on carbonization remained the same as that of the carbon without the catalyst (samples A). The difference between type A and B appeared upon activation. A bimodal pore size distribution was observed for samples B. Despite micropores of the same size range as in samples A, large meso and macropores were formed in samples B. In both kinds of samples, A and B, the micropore volume increase took place because of pore deepening, rather than pore broadening.
According to Casso et al. [48], the adsorption in pores depended on the applied pressure. With an increase of adsorption pressure, bigger and bigger pores govern the adsorption, nonetheless researchers state that at the atmospheric pressure, adsorption is contributed to by the narrow micropores (below 0.6 nm) with high adsorption potential. To use the whole adsorption potential of bigger micropores, higher fugacity of adsorbent is required. Hence, the higher pressure must be applied.
Investigation of Chen et al. [49] showed that the adsorption of CO2 molecules in the 0.3 nm slit pores, due to the similar size of CO2 molecules, was very poor. In contrast, the highest CO2 adsorption was noticed in the 0.4 nm pores. Furthermore, strong decrease of the stabilization energy of CO2 molecules in pores larger than 0.4 nm was noticed. With an increase of pore size, the interactions between CO2 molecules and carbon pores were more and more weak.
To summarize, the presence of micropores below 0.7 nm is one of the essential traits for a good CO2 adsorbent. Comparing the samples modified with potassium oxalate, the 7:1 weight ratio is an optimum one value, and there is no benefit to employ more.
According to the analysis of the obtained results, the adsorption properties of nanocarbon materials towards carbon dioxide increased with both increasing specific surface area and porosity (Figure 11 and Figure 12).
The presence of potassium on the surface of the samples had a positive effect on the CO2 adsorption (Figure 13), however the presence of surface oxygen had no apparent effect on adsorption. Surprisingly, the presence of surface nitrogen decreased the ability to adsorb carbon dioxide (Figure 14).

5. Conclusions

Highly porous nanocarbon materials for CO2 adsorption were produced through a novel synthesis method using a microwave assisted solvothermal reactor and varying the concentration of key reactants and modifactors. Replacement of an autoclave by a microwave assisted solvothermal reactor resulted in a significant shortening of reaction time (from several hours to minutes) and very good quality of the obtained product (uniform shape and narrow size distribution).
Using potassium oxalate monohydrate as an activator agent resulted in a high volume of micropores in the material, which are responsible for CO2 adsorption at atmospheric pressure. EDA by itself did not improve the physicochemical properties of the carbon material, as shown in CO2 uptake. However, use of both modificators led to the formation of a highly microporous material exhibiting both large specific surface areas and high CO2 uptake. It is thus concluded that surface morphology (microporosity) and surface chemistry, especially an amine promotor, lead to the best CO2 adsorption profile. Further, the differences between low temperature CO2 adsorption (0 °C), where physisorption dominates, and higher temperature adsorption, where chemisorption is more dominant, highlights the importance of surface chemical engineering of nanocarbon materials and, additionally, the importance of surface analysis in process development and optimization using both carbonization and modificators.

Author Contributions

Investigation, P.S., D.S., D.M. and R.J.W.; Methodology, R.D.C.; Supervision, U.N.; Writing—original draft, P.S. and U.N.; Writing—review & editing, R.D.C.

Funding

This research was partially funded by the Polish-Norwegian Research Programme operated by the National Centre for Research and Development under the Norwegian Financial Mechanism 2009–2014 in the frame of Project Contract No. Pol-Nor/237761/98.

Conflicts of Interest

The authors declare no conflict of interest

References

  1. Attahiru, Y.B.; Aziz, M.M.A.; Kassim, K.A.; Shahid, S.; Wan Abu Bakar, W.A.; NSashruddin, T.F.; Rahman, F.A.; Ahamed, M.I. A review on green economy and development of green roads and highways using carbon neutral materials. Renew. Sus. Energy Rev. 2019, 101, 600–613. [Google Scholar] [CrossRef]
  2. Zhang, L.L.; Long, R.Y.; Chen, H.; Geng, J.C. A review of China’s road traffic carbon emissions. J. Clean. Prod. 2019, 207, 569–581. [Google Scholar] [CrossRef]
  3. Zhu, X.; Baran, S.; Cel, W.; Cao, Y. Sustainable approach to mitigation of CO2 emission. Ecol. Chem. Eng. S 2015, 21, 617–622. [Google Scholar] [CrossRef]
  4. D’Alessandro, D.M.; Smit, B.; Long, J.R. Carbon dioxide capture: Prospects for new materials. Angew. Chem. Int. Ed. 2010, 49, 6058–6082. [Google Scholar] [CrossRef] [PubMed]
  5. OECD/IEA. CO2 Emissions From Fuel Combustion Highlights (2017 Edition); OECD/IEA: Paris, France. Available online: www.iea.org (accessed on 15 April 2019).
  6. Luis, P. Use of monoethanolamine (MEA) for CO2 capture in a global scenario: Consequences and alternatives. Desalination 2016, 380, 93–99. [Google Scholar] [CrossRef]
  7. Sema, T.; Naami, A.; Usubharatana, P.; Wang, X.; Gao, R.; Liang, Z.; Idem, R.; Tontiwachwuthikul, P. Mass transfer of CO2 absorption in hybrid MEA-methanol solvents in packed column. Energy Proc. 2013, 37, 883–889. [Google Scholar] [CrossRef]
  8. Samanta, A.; Zhao, A.; Shimizu, G.K.H.; Sarkar, P.; Gupta, R. Post-combustion CO2 capture using solid sorbents: A review. Ind. Eng. Chem. Res. 2012, 51, 1438–1463. [Google Scholar] [CrossRef]
  9. Hauchhum, L.; Mahanta, P. Carbon dioxide adsorption on zeolites and activated carbon by pressure swing adsorption in a fixed bed. Int. J. Energy Environ. Eng. 2014, 5, 349–356. [Google Scholar] [CrossRef] [Green Version]
  10. Lu, C.; Bai, H.; Su, F.; Chen, W.; Hwang, J.F.; Lee, H.-H. Adsorption of Carbon Dioxide from Gas Streams via Mesoporous Spherical-Silica Particles. J. Air Waste Manag. Assoc. 2010, 60, 489–496. [Google Scholar] [CrossRef]
  11. Lu, W.; Sculley, J.P.; Yuan, D.; Krishna, R.; Wei, Z.; Zhou, H.C. Polyamine-tethered porous polymer networks for carbon dioxide capture from flue gas. Angew. Chem. Int. Ed. 2012, 51, 7480–7484. [Google Scholar] [CrossRef]
  12. Li, J.R.; Ma, Y.; McCarthy, M.C.; Sculley, J.; Yu, J.; Jeong, H.K.; Balbuena, P.B.; Zhou, H.C. Carbon dioxide capture-related gas adsorption and separation in metal-organic frameworks. Coord. Chem. Rev. 2011, 255, 1791–1823. [Google Scholar] [CrossRef]
  13. Gui, M.M.; Yap, Y.X.; Chai, S.P.; Mohamed, A.R. Multi-walled carbon nanotubes modified with (3-aminopropyl)triethoxysilane for effective carbon dioxide adsorption. Int. J. Green. Gas Control 2013, 14, 65–73. [Google Scholar] [CrossRef]
  14. Sevilla, M.; Fuertes, A.B. A general and facile synthesis strategy towards highly porous carbons: Carbonization of organic salts. J. Mater. Chem. A 2013, 1, 13738. [Google Scholar] [CrossRef]
  15. Xu, B.; Zheng, D.; Jia, M.; Cao, G.; Yang, Y. Nitrogen-doped porous carbon simply prepared by pyrolyzing a nitrogen-containing organic salt for supercapacitors. Electrochim. Acta 2013, 98, 176–182. [Google Scholar] [CrossRef]
  16. Zhang, X.; Li, W.; Lu, A. Designed porous carbon materials for efficient CO2 adsorption and separation. New Carbon Mater. 2015, 30, 481–501. [Google Scholar] [CrossRef]
  17. Wang, R.; Lang, J.; Yan, X. Effect of surface area and heteroatom of porous carbon materials on electrochemical capacitance in aqueous and organic electrolytes. Sci. China Chem. 2014, 57, 1570–1578. [Google Scholar] [CrossRef]
  18. Choma, J.; Kloske, M.; Dziura, A.; Stachurska, K.; Jaroniec, M. Preparation and Studies of Adsorption Properties of Microporous Carbon Spheres. Eng. Prot. Environ. 2016, 19, 169–182. [Google Scholar] [CrossRef]
  19. Ludwinowicz, J.; Jaroniec, M. Potassium salt-assisted synthesis of highly microporous carbon spheres for CO2 adsorption. Carbon 2015, 82, 297–303. [Google Scholar] [CrossRef]
  20. Wang, X.; Zhou, J.; Xing, W.; Liu, B.; Zhang, J.; Lin, H.; Cui, H.; Zhuo, S. Resorcinol–formaldehyde resin-based porous carbon spheres with high CO2 capture capacities. J. Energy Chem. 2017, 26, 1007–1013. [Google Scholar] [CrossRef]
  21. Wickramaratne, N.P.; Xu, J.; Wang, M.; Zhu, L.; Dai, L.; Jaroniec, M. Nitrogen enriched porous carbon spheres: Attractive materials for supercapacitor L. electrodes and CO2 adsorption. Chem. Mater. 2014, 26, 2820–2828. [Google Scholar] [CrossRef]
  22. Sevilla, M.; Fuertes, A.B. CO2 adsorption by activated templated carbons. J. Colloid Interface Sci. 2012, 366, 147–154. [Google Scholar] [CrossRef] [PubMed]
  23. Chiang, Y.-C.; Yeh, C.-Y.; Weng, C.-H. Carbon Dioxide Adsorption on Porous and Functionalized Activated Carbon Fibers. Appl. Sci. 2019, 9, 1977. [Google Scholar] [CrossRef]
  24. Li, Y.; Xu, R.; Wang, B.; Wei, J.; Wang, L.; Shen, M.; Yang, J. Enhanced N-doped Porous Carbon Derived from KOH-Activated Waste Wool: A Promising Material for Selective Adsorption of CO2/CH4 and CH4/N2. Nanomaterials 2019, 9, 266. [Google Scholar] [CrossRef] [PubMed]
  25. Sevilla, M.; Fuertes, A.B. Sustainable porous carbons with a superior performance for CO2 capture. Energy Environ. Sci. 2011, 4, 1765–1771. [Google Scholar] [CrossRef]
  26. Liu, J.; Qiao, S.Z.; Liu, H.; Chen, J.; Orpe, A.; Zhao, D.; Lu, G.Q. Extension of the Stöber method to the preparation of monodisperse resorcinol-formaldehyde resin polymer and carbon spheres. Angew. Chem. Int. Ed. 2011, 50, 5947–5951. [Google Scholar] [CrossRef] [PubMed]
  27. Tian, H.; Liu, J.; O’Donnell, K.; Liu, T.; Liu, X.; Yan, Z.; Liu, S.; Jaroniec, M. Revisiting the Stöber method: Design of nitrogen-doped porous carbon spheres from molecular precursors of different chemical structures. J. Colloid Interface Sci. 2016, 476, 55–61. [Google Scholar] [CrossRef] [PubMed]
  28. Zhao, J.; Niu, W.; Zhang, L.; Cai, H.; Han, M.; Yuan, Y.; Majeed, S.; Anjum, S.; Xu, G. A template-free and surfactant-free method for high-yield synthesis of highly monodisperse 3-aminophenol-formaldehyde resin and carbon nano/microspheres. Macromolecules 2013, 46, 140–145. [Google Scholar] [CrossRef]
  29. Wickramaratne, N.P.; Jaroniec, M. Activated carbon spheres for CO2 adsorption. ACS Appl. Mater. Interfaces 2013, 5, 1849–1855. [Google Scholar] [CrossRef] [PubMed]
  30. Pari, G.; Darmawan, S.; Prihandoko, B. Porous Carbon Spheres from Hydrothermal Carbonization and KOH Activation on Cassava and Tapioca Flour Raw Material. Procedia Environ. Sci. 2014, 20, 342–351. [Google Scholar] [CrossRef] [Green Version]
  31. Wickramaratne, N.P.; Jaroniec, M. Importance of small micropores in CO2 capture by phenolic resin-based activated carbon spheres. J. Mater. Chem. A 2013, 1, 112–116. [Google Scholar] [CrossRef]
  32. Okunev, A.G.; Sharonov, V.E.; Aristov, Y.I.; Parmon, V.N. Sorption of carbon dioxide from wet gases by K2CO3-in-porous matrix: Influence of the matrix nature. React. Kinet. Catal. Lett. 2000, 71, 355–362. [Google Scholar] [CrossRef]
  33. Sibera, D.; Narkiewicz, U.; Kapica, J.; Serafin, J.; Michalkiewicz, B.; Wróbel, R.J.; Morawski, A.W. Preparation and characterisation of carbon spheres for carbon dioxide capture. J. Por. Mater. 2019, 26, 19–27. [Google Scholar] [CrossRef]
  34. Sibera, D.; Sreńscek-Nazzal, J.; Morawski, W.A.; Michalkiewicz, B.; Serafin, J.; Wróbel, R.J.; Narkiewicz, U. Microporous carbon spheres modified with EDA used as carbon dioxide sorbents. Adv. Mat. Lett. 2018, 9, 432–435. [Google Scholar] [CrossRef]
  35. Thommes, M.; Kaneko, K.; Neimark, A.V.; Olivier, J.P.; Rodriguez-Reinoso, F.; Rouquerol, J.; Sing, K.S.W. Physisorption of gases, with special reference to the evaluation of surface area and pore size distribution (IUPAC Technical Report). Pure Appl. Chem. 2015, 87, 1051–1069. [Google Scholar] [CrossRef] [Green Version]
  36. Adinata, D.; Daud, W.M.A.W.; Aroua, M.K. Preparation and characterization of activated carbon from palm shell by chemical activation with K2CO3. Bioresour. Technol. 2007, 98, 145–149. [Google Scholar] [CrossRef]
  37. Guo, J.; Lua, A.C. Textural and chemical properties of adsorbent prepared from palm shell by phosphoric acid activation. Mater. Chem. Phys. 2003, 80, 114–119. [Google Scholar] [CrossRef]
  38. Musa, M.S.; Sanagi, M.M.; Nur, H.; Wan Ibrahim, W.A. Understanding pore formation and structural deformation in carbon spheres during KOH activation. Sains Malays 2015, 44, 613–618. [Google Scholar] [CrossRef]
  39. Chen, Y.D.; Chen, W.Q.; Huang, B.; Huang, M.J. Process optimization of K2C2O4-activated carbon from kenaf core using Box-Behnken design. Chem. Eng. Res. Des. 2013, 91, 1783–1789. [Google Scholar] [CrossRef]
  40. Mohamed, M.A.; Galwey, A.K.; Halawy, S.A. The activities of some metal oxides in promoting the thermal decomposition of potassium oxalate. Thermochim. Acta 2002, 387, 63–74. [Google Scholar] [CrossRef]
  41. The Dow Chemical Company. Product Safety Assessment. DOWTM Ethylenediamine, Form No. 233-00318-MM-0515X; The Dow Chemical Company: Midland, MI, USA, 2015. [Google Scholar]
  42. Ya, T. Kosolapova, Carbides, Properties, Production, and Applications; Plenum Press: New York, NY, USA; London, UK, 1971. [Google Scholar]
  43. Hu, X.; Radosz, M.; Cychosz, K.A.; Thommes, M. CO2-filling capacity and selectivity of carbon nanopores: Synthesis, texture, and pore-size distribution from quenched-solid density functional theory (QSDFT). Environ. Sci. Technol. 2011, 45, 7068–7074. [Google Scholar] [CrossRef]
  44. Yin, G.; Liu, Z.; Liu, Q.; Wu, W. The role of different properties of activated carbon in CO2 adsorption. Chem. Eng. J. 2013, 230, 133–140. [Google Scholar] [CrossRef]
  45. Presser, V.; McDonough, J.; Yeon, S.H.; Gogotsi, Y. Effect of pore size on carbon dioxide sorption by carbide derived carbon. Energy Environ. Sci. 2011, 4, 3059–3066. [Google Scholar] [CrossRef]
  46. Lee, S.Y.; Park, S.J. Determination of the optimal pore size for improved CO2 adsorption in activated carbon fibers. J. Coll. Interf. Sci. 2013, 389, 230–235. [Google Scholar] [CrossRef] [PubMed]
  47. Gadkaree, K.P.; Jaroniec, M. Pore structure development in activated carbon honeycombs. Carbon 2000, 38, 983–993. [Google Scholar] [CrossRef]
  48. Casco, M.E.; Martínez-Escandell, M.J.; Silvestre-Albero, J.F.; Rodríguez-Reinoso, J.F. Effect of the porous structure in carbon materials for CO2 capture at atmospheric and high-pressure. Carbon 2014, 67, 230–235. [Google Scholar] [CrossRef] [Green Version]
  49. Chen, L.; Watanabe, T.; Kanoh, H.; Hata, K.; Ohba, T. Cooperative CO2 adsorption promotes high CO2 adsorption density over wide optimal nanopore range. Adsorpt. Sci. Technol. 2018, 36, 625–639. [Google Scholar] [CrossRef]
Figure 1. Scanning Electron Microscopy (SEM) images of the spheres: (a) without modification; (b) with activator concentration 7/1; (c) with activator concentration 9/1; (d) with ethylene diamine (EDA) modification; (e) with activator concentration 7/1 and EDA modification.
Applsci 09 03349 g001
Figure 2. (a) Size distribution of the reference sample. (b) Size distributions of the samples with lower activator content (7/1). (c) Size distribution of the samples with higher content of the activator (9/1). (d) Size distribution of the samples modified with EDA only. (e) Size distribution of the samples modified with EDA and activator.
Applsci 09 03349 g002aApplsci 09 03349 g002bApplsci 09 03349 g002c
Figure 3. X-ray Photoelectron Spectroscopy (XPS) survey spectra.
Applsci 09 03349 g003
Figure 4. X-ray photoelectron spectrum of C 1s and K 2p regions for samples prepared with potassium oxalate with a potassium:carbon ratio of 9:1.
Applsci 09 03349 g004
Figure 5. X-ray photoelectron spectrum of C 1s and K 2p regions for samples prepared with potassium oxalate with a potassium:carbon ratio of 7:1 with the addition of EDA.
Applsci 09 03349 g005
Figure 6. Results of thermogravimetric studies (heating in air).
Applsci 09 03349 g006
Figure 7. Low-temperature nitrogen adsorption isotherms of carbon spheres modified with potassium oxalate and/or with EDA.
Applsci 09 03349 g007
Figure 8. PSD (Pore Size Distribution) calculated from CO2 adsorption at 0 °C for the samples modified with EDA only.
Applsci 09 03349 g008
Figure 9. PSD calculated from CO2 adsorption at 0 °C for the samples carbonized at 700 °C.
Applsci 09 03349 g009
Figure 10. CO2 adsorption values of the tested samples.
Applsci 09 03349 g010
Figure 11. Relation between specific surface area and CO2 uptake at 0 °C.
Applsci 09 03349 g011
Figure 12. Relation between the total pore volume of the samples and CO2 uptake at 0 °C.
Applsci 09 03349 g012
Figure 13. Relation between the surface concentration of potassium and CO2 uptake at 0 °C.
Applsci 09 03349 g013
Figure 14. Relation between the surface concentration of nitrogen and CO2 uptake at 0 °C.
Applsci 09 03349 g014
Table 1. Comparison of CO2 uptakes on various carbon adsorbents.
Carbon SourceActivatorCO2 Adsorption 0 °C [mmol/g] 1 barCO2 Adsorption 25 °C [mmol/g] 1 barReference
Resorcinol–formaldehyde resinK2C2O47.674.95[18]
Resorcinol–formaldehyde resinK2C2O46.6-[19]
Resorcinol–formaldehyde resinKOH7.344.83[20]
Resorcinol–formaldehyde resin/EDAEDA; CO26.24.1[21]
Furfuryl alcoholKOH5.83.3[22]
PolyacrylonitryleKOH-2.74[23]
Waste woolKOH3.732.81[24]
StarchKOH6.64.3[25]
Table 2. Elemental composition of the surface of the samples.
SampleCONK
at. %
RF_700963~1-
RF_7_1_6008811<1~1
RF_7_1_800927<1~1
RF_7_1_EDA6008783~2
RF_7_1_EDA800889<1~3
RF_9_1_6007618~2~4
RF_9_1_8008511<1~3
RF_EDA600924~4-
RF_EDA800933~4-
Table 3. Results of the thermogravimetric studies.
SampleStart of Mass Loss (°C)Max of Mass Loss (°C)End of Mass Loss (°C)Residue (%)
RF 7003646007127.03
RF 7/1 60018142054716.71
RF 7/1 70018142054720
RF 7/1 80018143257314.53
RF + EDA 7003645897288.6
RF 7/1 + EDA 70014939151921
Table 4. Physico-chemical properties of the obtained samples.
SampleDensity (g/cm3)SBET (m2/g)Total Pore Volume (cm3/g)CO2 Adsorption at 0 °C (mmol/g)CO2 Adsorption at 25 °C (mmol/g)
RF 7001.794440.253.252.43
RF 7/1 6001.685990.343.733.41
RF 7/1 7001.976450.435.153.67
RF 7/1 8002.2613310.745.523.96
RF 9/1 6001.755300.293.793.20
RF 9/1 7001.808430.464.433.74
RF 9/1 8001.9512520.685.563.87
RF EDA 6001.593960.242.661.94
RF EDA 7001.673690.202.572.01
RF EDA 8001.723410.193.012.28
RF 7/1 EDA 6001.624390.273.502.51
RF 7/1 EDA 7001.7411140.645.894.60
RF 7/1 EDA 8001.9916140.936.214.02

