Article

Fertilization Mapping Based on the Soil Properties of Paddy Fields in Korea

1
Department of Bioindustrial Machinery Engineering, Jeonbuk National University, Jeonju 54896, Republic of Korea
2
Institute of Agricultural Machinery ICT Convergence, Jeonbuk National University, Jeonju 54896, Republic of Korea
*
Author to whom correspondence should be addressed.
Agriculture 2023, 13(11), 2049; https://doi.org/10.3390/agriculture13112049
Submission received: 4 October 2023 / Revised: 19 October 2023 / Accepted: 23 October 2023 / Published: 26 October 2023
(This article belongs to the Special Issue Soil Mechanical Systems and Related Farming Machinery)

Abstract

:
The purpose of this study was to construct a map of expected fertilization rates for nitrogen (N) and phosphorus (P2O5) based on measurements of components in soil samples and to identify the spatial variabilities of four lots of a salt-affected paddy field in Korea. Four salt-affected paddy field lots in Korea were divided into 30 sectors for collecting soil samples. They were then analyzed for soil organic matter (SOM), silicon dioxide (SiO2), total nitrogen (TN), and available phosphorus (Av.P2O5) in accordance with international standards. Expected fertilization rates of N and P2O5 were developed as prescription standards for the application of fertilizer to paddy fields. They were derived using a model of the fertilization rates of N and P2O5. To determine the presence of spatial correlation and continuity in the given fields, a spherical variogram was used. Based on the spherical model with the application of a regular kriging interpolation, maps of the contents of TN and Av.P2O5 as well as the expected fertilization rates of N and P2O5 at each sector of 1 × 1 m2 were developed. The expected fertilization rate of N at each sector appeared in the range of min. 10.0 g to max. 25.7 g, while that of P2O5 appeared in the range of min. 0.68 g to max. 8.46 g.

1. Introduction

Soil is regarded as an essential element for agriculture. It not only provides necessary nutrients and moisture needed for the growth of crops but also provides a stable foundation for the habitat. To produce agricultural products of good quality through an improvement in productivity and in the quality of crops, a sustainable management of soil is essential [1,2,3].
Fertilizer for soil is an important element that affects the growth of crops. It consists of nitrogen, phosphorus, potassium, and so on. Some farmers tend to exceed the level of reasonable fertilization rates needed for the growth of crops to maximize the yield of crops [4]. Conventional fertilization with excess manuring disturbs sustainable agriculture. An excess supply of nitrogen results in an exceeded reasonable level of nutrient needed for the growth of crops and reduces the resistance of crops against insect pests. Furthermore, it accelerates the acidification of the soil, leading to soil contamination [5]. An excess supply of phosphorus could disturb the absorption of nutrients by crops, reduce the level of the pH of the soil, and bring about eutrophication of the soil by creating an insoluble compound bound with either aluminum or iron. Excessive application of fertilizer could create various environmental problems, such as salt accumulation, overnutrition, accumulation of heavy metal and nitrate in the soil, and so on, resulting in adverse effects such as deteriorated growth of crops and consequential decrease in productivity [6]. Thus, the physicochemical properties of soils need to be considered for sustainable management of soil.
On the other hand, due to the geographical characteristics of Korea, the country is surrounded by the sea on three sides, and more than 66% of the country’s land area is covered by mountains and lakes, leaving only about 26% of the land area available for agriculture. Therefore, reclamation projects were carried out to maximize land use and develop agricultural areas [7]. Reclamation refers to the conversion of water surfaces such as oceans, rivers, and lakes into arable land. About 81% of the reclaimed land in Korea is used for paddies, and about 21.9% of it is used as salt-affected paddies [8]. “Salt-affected paddy” refers to soil that has been recently reclaimed and has a high salt concentration. Compared to normal soils, salt-affected paddy soil has a lower fertility and a higher salt concentration, which reduces the availability of moisture to crops and can lead to an imbalance of nutrients needed for crop growth. In addition, salt-affected paddy soils have poorly developed soil structure, resulting in poor particle cohesion and low water-holding capacity [9]. Therefore, soil management technology that improves crop quality and yield while considering the chemical and physical properties of the soil is required [10], and sustainable agriculture and high-quality crop production are possible through proper fertilizer input [11].
Precision agriculture is a term describing the agricultural approach to maximize the level of productivity and quality by minimizing the input of resources such as water, fertilizer, manpower, and so on. It is also a term describing the technique to control the specified space of each site for the stable growth of crops [12]. Accordingly, a decision support system that takes spatial and temporal variabilities into account can be provided to keep reasonable levels of harvest and quality of crops. This could realize a safe production system in terms of the environment [13]. A technology that is capable of reducing uneven effects on crop growth is needed, utilizing the efficient processing of information of varying soil properties in the spaces of each lot of a field [14]. Variable rate technology has been introduced to solve such a problem. It could control the fertilization rate by considering spatial variabilities of corresponding factors in soils. To apply variable rate technology effectively, the identification of soil properties by considering spatial variabilities in the soil is essential [15].
To solve potential economic and environmental problems due to an excessive or deficient input of soil fertilizer, the development of a map of soils to design the application of variable rate technology is essential [16]. After developing a spatial statistics model of soil properties, a map of soil properties can be created by applying the spatial statistics model to a geographical database [17]. Rabi [18] has reported that unsampled data could be estimated using kriging interpolation in a variogram model developed based on sample data of soil collected at each site. Zhang and Kovacs [19] have developed a map of predicted soil components by employing sensor data applied to a spatial statistics model. Diacano and Castrignano [20] have applied variable rate technology to each location by employing a developed map of soil components. Aggelopoulou and Pateras [21] have developed a map of nitrogen content in soil through collected samples of soil, applied the fertilization of nitrogenous fertilizer to each lot, and reduced the fertilization rate of nitrogenous fertilizer by approximately 38%. Hong and Kim [22] have introduced variable rate technology to rice and reduced the fertilization rate by approximately 32% compared to conventional fertilization. The map of soil components can be utilized as an important tool for producing crops of uniform quality by taking spatial variability of soil into account.
Identification of soil composition is essential for soil mapping for variable rate technology. However, there is currently no active research on salt-affected paddies in Korea, and it is time to conduct research on salt-affected paddy soil for the realization of precise agriculture.
The purpose of this study is to analyze the soil composition of salt-affected paddies in Korea and to develop a variable rate technology application map for nitrogen and phosphate fertilizers. The specific objectives are as follows.
  • Collect soil samples from salt-affected paddies in South Korea and characterize the soil composition.
  • Derive expected nitrogen and phosphate rates based on the analyzed chemical composition.
  • Create a map of the total nitrogen and available phosphorus content of salt-affected paddies and a map of the expected nitrogen and phosphorus rates for variable rate technology through a variogram and kriging.

2. Materials and Methods

2.1. Analysis of Soil Components and Model of Fertilization Rate

The soil samples used in this study were collected from four places of a salt-affected paddy field (126°52′28″ E, 37°05′09″ N and 3 m elevation) in Suchon-ri, Jangan-myeon, Hwaseong-si, Gyeonggi-do Province in Korea during the period from 19 April 2022 to 23 April 2022 (Figure 1). Temperature and humidity in the ambient environment were 15.1 °C and 45%, respectively. The soil texture was silty clay. Silty clay is grayish in color, soft in texture, and abundant in organic matter, with a clay content of more than 50%, and is mainly distributed in ocean current areas. For the sampling of soils, the paddy field was divided into 30 sectors. The size of each sector was set as 11 × 9 m, 13 × 8 m, 13 × 9 m, and 13 × 9 m, respectively. A dedicated “Soil Sampler (Edelman Auger, Eijkelkamp, The Netherlands)” was used for the sampling of soils. A depth of 5 cm of surface soil was removed for sampling soils. A total of 120 soil samples were collected from the plough layer with a depth of 15 cm. Five samples were collected from each sector. Collected samples were mixed into a single lump to minimize potential deviations in the compositions of components in the soil sample.
The collected samples of the soil were forwarded to the “Center of Soil Verification” in the “Korea Agriculture Technology Promotion Agency” for analysis of the components in the soil samples. The “Manual of analysis procedures for comprehensive test lab [23]” and the “Method for Chemical Analysis of Soils [24]” of the “Rural Development Administration” in Korea were employed for analyses of soil organic matter (SOM), silicon dioxide (SiO2), total nitrogen (TN), available phosphorus (Av.P2O5), and so on in the soil samples. The soil samples were pulverized finely and sifted through a 0.5 mm screen. The components of SOM, SiO2, Av.P2O5, and TN in the soil samples were then analyzed by utilizing the Tyurin method, the method of stationary fresh water incubation, the Lancaster method, and the Dumas method, respectively.
The Tyurin method is an externally heated method of analysis, in which the soil sample is finely ground and sieved through a 0.5 mm sieve, and then 0.3 g of the homogenized soil sample and 10 mL of 0.4 N potassium dichromate sulfate-mixed solution are added to a 250 mL glass triangular flask. In our study, the mixture was then heated on a heating plate at 200 °C and boiled for 5 min from the beginning of bubbling, then removed from the heating plate; the potassium dichromate sulfate mixture was washed with distilled water, and about 5 mL of 85% phosphoric acid (H3PO4) and 5–6 drops of the indicator diphenylamine solution were added. Then, it was titrated with 0.2 M ferric ammonium sulfate solution, and the end point was measured when the color of the solution changed from black-brown to indigo-blue to green.
The fresh water constant temperature method was performed by placing 10 g of air- dried fine earth into a 100 mL centrifuge tube, shaking it in 60 mL of distilled water, removing the air, and sealing it. After that, it was placed in a thermostat at 40 °C for 7 days, and the supernatant was filtered through filter paper No. 6. Then, 10 mL of the filtered supernatant was placed in a test tube; 0.25 M HCl solution and 5 mL of ammonium molybdate solution were added; and 10 mL of sodium sulfite solution was added after standing for about 3 min. The treated supernatant was measured at an absorbance of 700 nm after about 10 min of incubation.
The Lancaster method was carried out by placing 5 g of air-dried fine earth in a triangular flask, dissolving 400 mL of HOAC and 300 mL of 10 M lactic acid in 6 L of distilled water, then adding 22.2 g of NH4F, 133.3 g of ammonium sulfate, and 170 g of NaOH. Then, 20 mL of leachate adjusted to pH 4.25 by adding distilled water was added, shaken for 10 min, and filtered through No. 2 filter paper. Color development and determination were performed by the molybdenum (MO) method with ascorbic acid and the MO method with 1-amino-2-naphtol-4-sulfonic acid.
The Dumas method is a method for quantifying N2O by reducing it to N2 and measuring the volume of N2 gas. The soil sample is oxidized by heating CuO to a high temperature of more than 600 °C; the resulting combustion gas is reduced to N2 gas by contact with pure CO2 and hot Cu, and CO is converted to CO2 by contacting CuO again. The N2–CO2 mixture is passed through a nitrometer in a concentrated alkaline solution, and after the CO2 is captured, the volume of N2 gas is measured to quantify the nitrogen content.
The model of fertilization rate for N and P2O5, which was developed as a fertilization standard of rice [25], was also used for the analysis. The fertilization rate of N corresponds to the components of the soil of SOM and SiO2. It can be calculated through Formula (1), whereas the fertilization rate of P2O5 corresponds to the soil component of Av.P2O5. It can be calculated by using Formula (2). Formulas (3) and (4) are transformations wherein a unit area of 10a is converted into 1 m2 to be compatible with the scale of the lot.
N(kg/10a) = 9.05 − 0.108 × OM + 0.020 × SiO2
P2O5 (kg/10a) = (100 − Av.P2O5) × 0.1
N(kg/m2) = (9.05 − 0.108 × OM + 0.020 × SiO2) × 0.001
P2O5 (kg/m2) = (100 − Av.P2O5) × 0.1 × 0.001
where N is nitrogen (kg/10a); OM is organic matter (g/kg); SiO2 is silicon dioxide (mg/kg); P2O5 is phosphorus (kg/10a); and Av.P2O5 is available phosphorus (100 mg/kg).

2.2. Spatial Statistics Model

A variogram generally uses measured data to predict unknown data, to determine the presence of correlation and continuity between data, and to estimate the interdependent distance between data [26,27]. “Correlation” and “variance” are measures to determine the presence of correlation between data. Autocorrelation represents a correlation between different variables at the point of measurement, given that only one datum is known at each point. Thus, it was regarded that it could be employed as a quantitative measure [28,29]. According to Lee and Jung [28], the autocovariance that expresses the quantitative measure of interrelationship between data points, which are distant from the point of specified data, is used. Autocovariance increases in accordance with decreasing distance between two data points. Therefore, it decreases in accordance with increasing distance between two data points [30]. In general, the semivariogram, which is half (1/2) of the variogram, is used. It provides the correlation length (range), threshold (sill), and nugget, which are necessary information for the kriging interpolation (Figure 2). Correlation length refers to the maximum distance of separation that represents the correlation between data points, whereas the threshold indicates the degree of variance of data. The nugget represents a constant value at the separation distance of 0. The selection of the model of the variogram is very important since the identified spatial correlation obtained through using the variogram would validate continuity in the interpolation of spatial data. Thus, the spherical model, which could be employed as an excellent one to determine the spatial variability and continuity of the soil, was used.
In this study, a regular kriging interpolation was applied to develop a soil map of the expected N and P2O5 fertilization amount suitable for salt-affected paddies, and the mentioned variogram and regular kriging interpolation were performed through Surfer ver. 22 (Golden Software, Golden, CO, USA).
Kriging interpolation renders expected differences between actual and estimated values to be 0 by using the BLUE (best linear unbiased estimator) of the minimum variance for the periphery or zone of given data in an arbitrary spatial space. Simultaneously, it renders dispersion of difference as minimized. A spherical model renders the tangential line at the point of 0 separation distance to intersect the threshold at the point of 2/3 of the correlation length, thereby enabling the derivation of threshold and correlation length.

3. Results and Discussion

3.1. Derivation of Expected Fertilization Rates Accordant with Soil Components

Table 1 presents the soil properties of collected soil samples from each field. Mean and standard deviation of the SOM of the entire field were 20.6 g/kg and 4.482 g/kg, respectively. Those of SiO2 were 471.6 mg/kg and 72.80 mg/kg, respectively. Mean and standard deviation of Av.P2O5 were 44.24 mg/kg and 12.73 mg/kg, respectively. Those of TN were 0.12% and 0.02%, respectively. There were approximately less than 15% of differences compared to the average of the entire field in the statistics of SOM, SiO2, and Av.P2O5. TN showed a difference of less than 20% compared to the average of the entire field. However, the SOM and Av.P2O5 in Field 2 and Field 4 exhibited respective values higher than the average of the entire field. In the case of SOM, its value in Field 2 was approximately 24% higher than the average of the entire field, while that of Field 4 was approximately 19% lower than the average of the entire field. With regard to Av.P2O5, the value of Field 2 was approximately 19% lower than the average of the entire field, while the value of Field 4 was approximately 37% higher than the average of the entire field. Such variability of the chemical components in the soils of each field was due to environmental factors comprising climate conditions, soil management approaches, and so on. According to Park [31], the variability in the chemical composition of soil could be created by various environmental factors such as the properties of specific soils, the size of the land area, and functions of time factors, consistent with the results of the analysis of soil components in the present study.
Fertilization rates for N and P2O5 were derived by using Formulas (3) and (4) (Table 2, Figure 3 and Figure 4) to alleviate variability in soil composition and to obtain a reasonable fertilization rate for each field. According to the fertilization standards for crops in Korea, the optimal nitrogen fertilization rate is 11 to 18 kg/10a, and the optimal phosphorus fertilization rate is 4.5 kg/10a. Derivation of the expected fertilization rate of N for each sector used both SOM and SiO2, while the derivation of the expected fertilization rate of P2O5 used Av.P2O5. Mean expected fertilization rates of N for Fields 1–4 were 15.9 kg/10a, 15.1 kg/10a, 16.8 kg/10a, and 17.4 kg/10a, respectively, while those of P2O5 were 6.1 kg/10a, 6.4 kg/10a, 5.7 kg/10a, and 4.3 kg/10a, respectively. The predicted fertilization rate of N exhibited a difference of less than 20% compared to the average of each field. The expected fertilization rate of N for Fields 3 and 4 should be set higher than those of Fields 1 and 2 (Figure 3). The difference in fertilization rate of P2O5 was insignificant except for that of Field 4.

3.2. Spatial Statistics Analysis of Expected Fertilization Rate to Develop a Map of Variable Fertilization

The spherical model of the variogram was employed to construct a map of the variable fertilization of the expected fertilization rate of N and P2O5 for each field. The threshold (sill) and correlation length (range) of TN, Av.P2O5, N, and P2O5 are as presented in Table 3. Figure 5 represents the spherical model of the variogram of N and P2O5. The N fertilizer for Field 4 and the P2O5 fertilizer for Fields 2 and 3 exhibit a trend of larger spatial variability compared to those of other fields; the value of N fertilizer for Field 4 appeared as 43.26 m, which was higher than 20.43 m and 27.54 m for Fields 2 and 3. Contrarily, a higher value of the sill and a lower value of the range, compared to those of other fields, appeared in the cases of N fertilizer and Av.P2O5 fertilizer for Field 2. This was attributed to the lower spatial dependence of N fertilizer and Av.P2O5 fertilizer for Field 2 compared to the higher spatial variability in the given space.

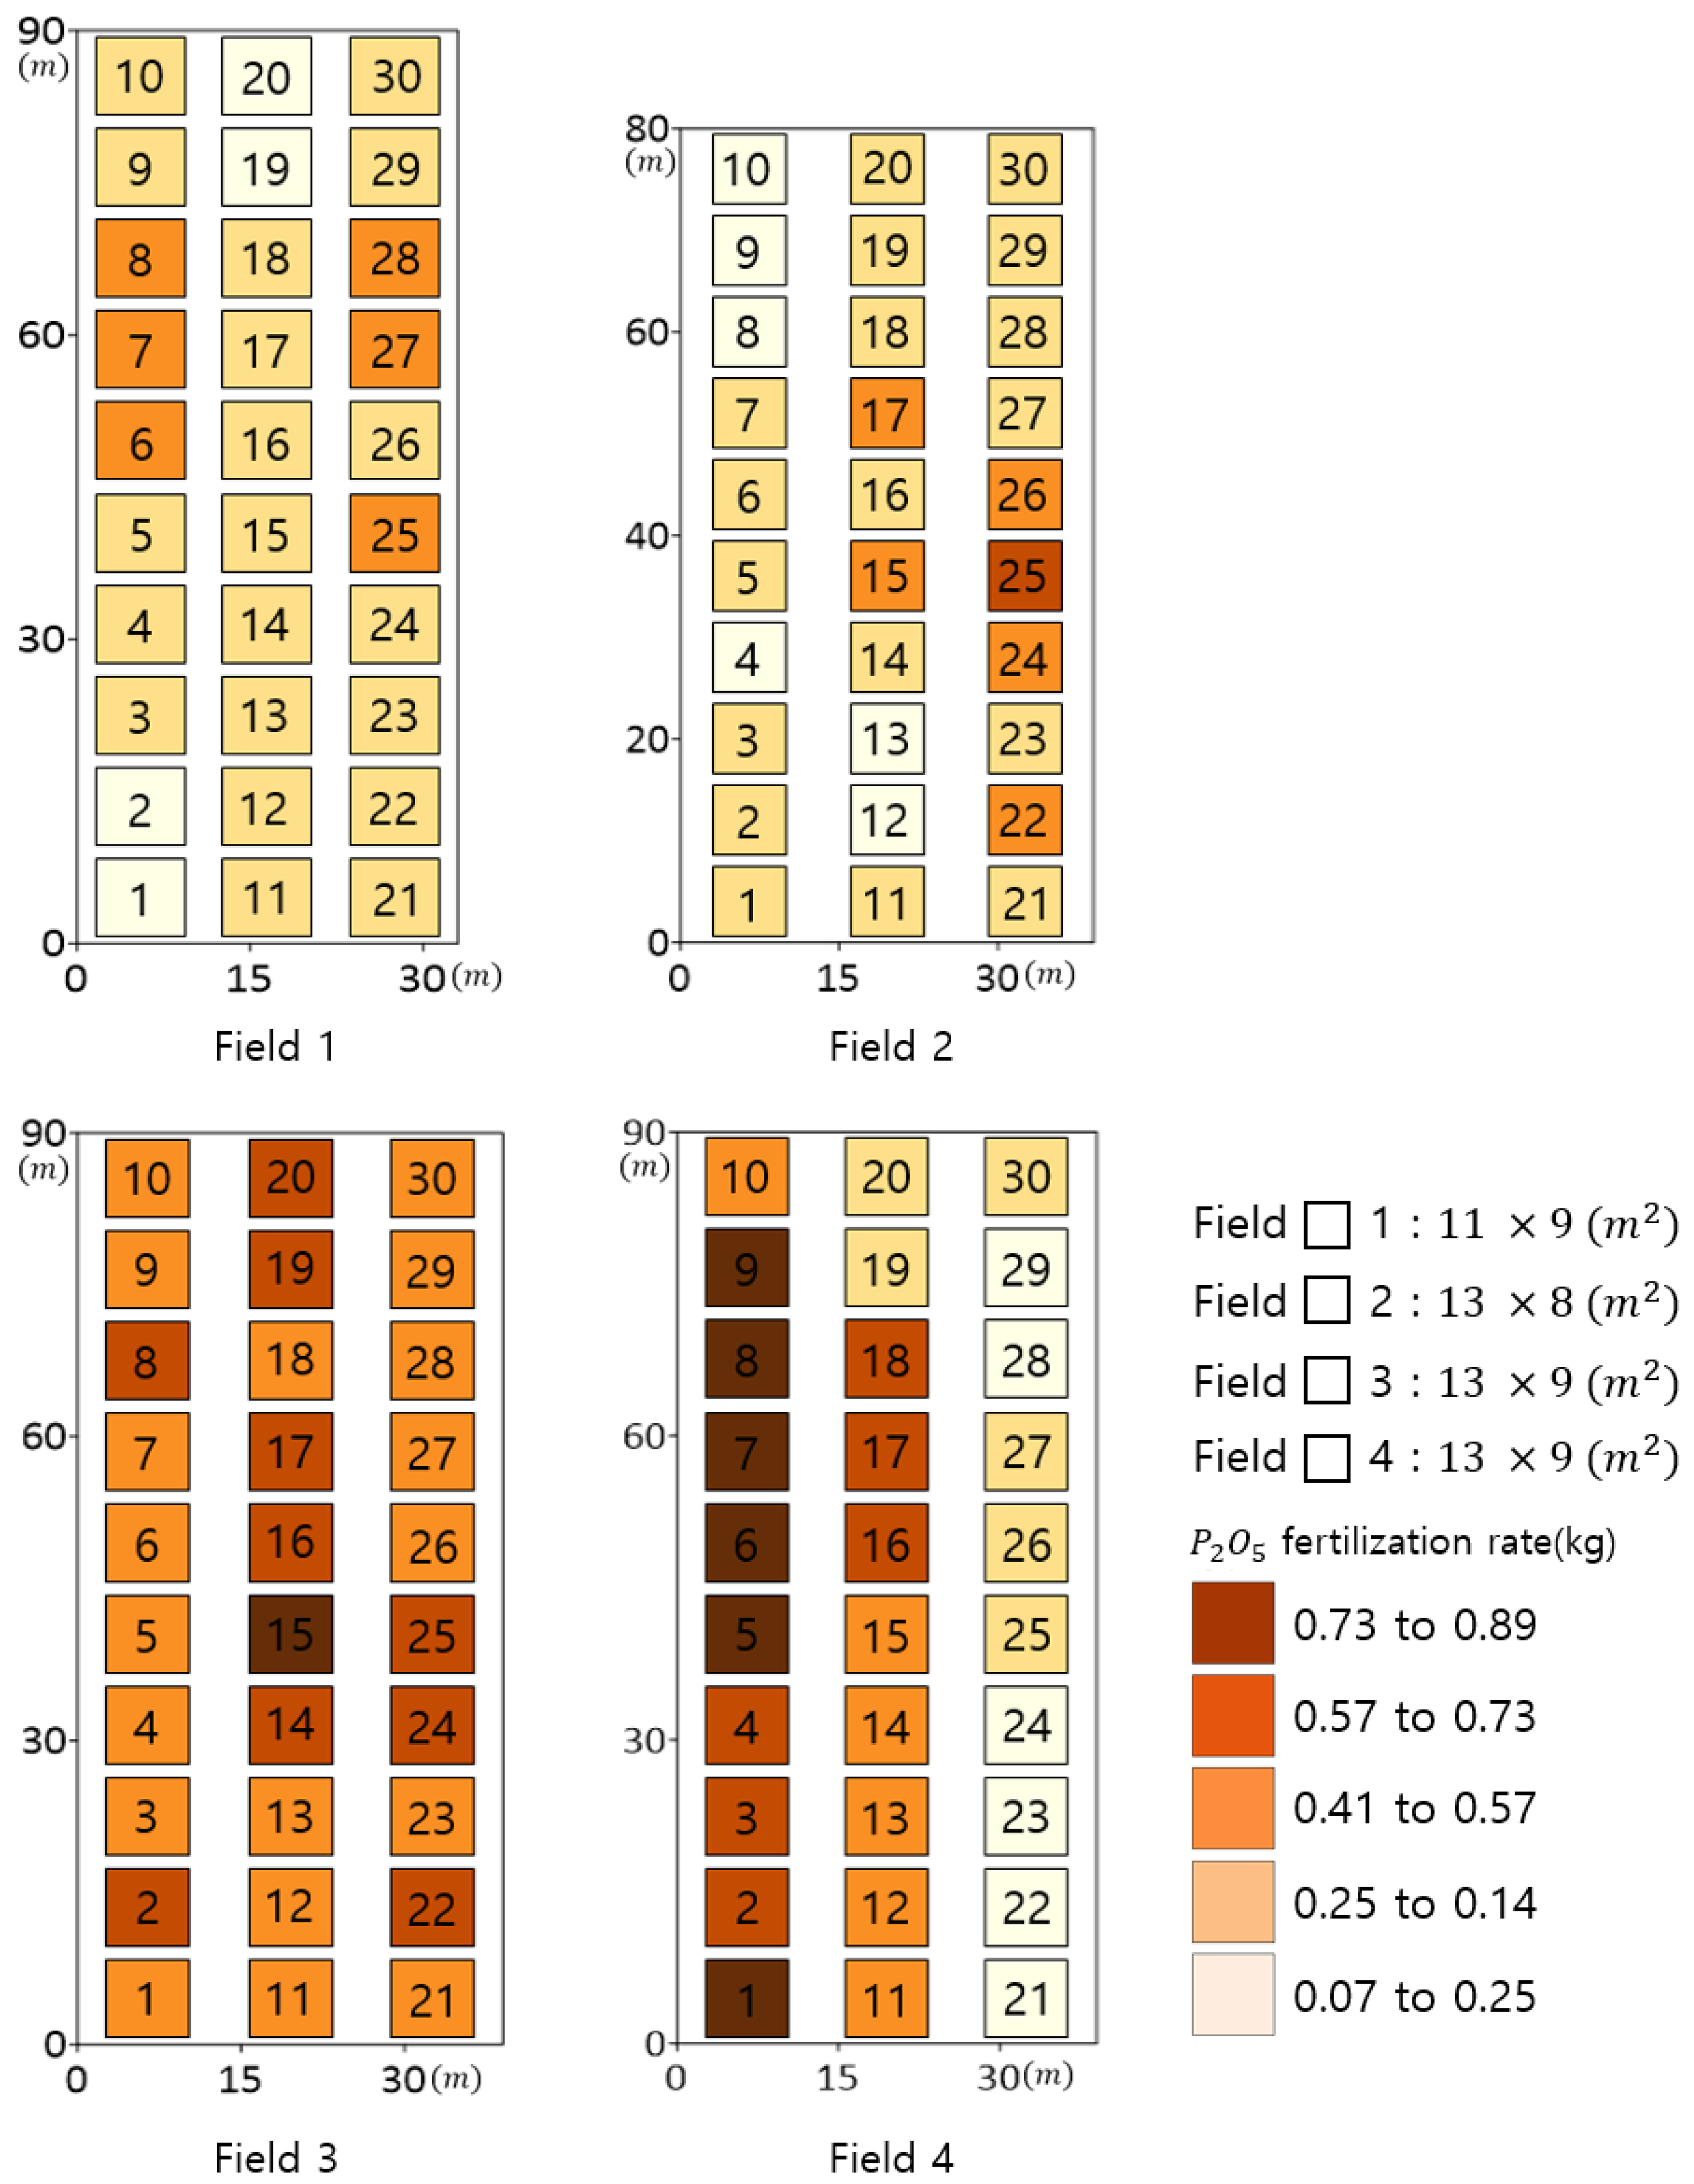
3.3. Map of Variable Fertilization Developed by the Application of Interpolation

A map of soil components was developed by employing the regular kriging interpolation, the known spatial statistics technique, based on the spherical variogram model to obtain variable fertilization rates suitable for rice in the paddy fields of Korea. The soil map is divided into ( 1 × 1 m2), taking into account the speed and working radius of the developing variable rate fertilizer applicator for accurate and precise variable rate fertilization. The expected fertilization map can show the appropriate fertilization amount for each compartment in the field (Figure 6 and Figure 7). Figure 6 represents the map illustrating the predicted fertilization rate of TN (upper end of Figure 6) and N (lower end of Figure 6) in the soil for each field. Figure 7 represents the map illustrating the predicted fertilization rate of Av.P2O5 (upper end of Figure 7) and P2O5 (lower end of Figure 7) in soils for each field. In the map, the parts that correspond to less content or less predicted fertilization rate are painted in white color, and by way of contrast, the parts corresponding to more content or more predicted fertilization rate are painted in either green or orange color. In the case of the fertilization rate of N, the predicted fertilization rate per unit sector ( 1 × 1 m2) appeared as 12 g to 26 g for Field 1 and Field 2 and 10.0 g to 21.7 g for Fields 3 and 4. With regard to the case of the fertilization rate of Av.P2O5, the predicted fertilization rate per unit sector ( 1 × 1 m2) appeared as 5.15 g to 7.27 g for Field 1, 3.07 g to 8.46 g for Field 2, 3.16 g to 6.83 g for Field 3, and 0.68 g to 5.21 g for Field 4. The trends in the maps of the Av.P2O5 content and predicted fertilization rate of P2O5 in the soil for each field appeared oppositely (Figure 7). And the maps of the TN content and predicted fertilization rate of N in the soil for each field appeared with partially contrasting trends. This was attributed to the difference in the content levels of the SOM and SiO2. It appears that with the utilization of the expected fertilization maps (N and P2O5) in the development of the variable rate fertilizer applicator, more precise variable rate fertilization will be achievable in the future. This is believed to enable environmentally friendly and sustainable agriculture, specifically, precision farming, by minimizing the input of fertilizer and increasing crop yields. Thus, it is presumable that the minimization of the input of fertilizer and the increase in production of crops would be enabled by utilizing the map of the predicted fertilization rate (of N and P2O5) in a way of realizing an environmentally friendly and sustainable agriculture, precision agriculture.

4. Conclusions

The present paper intended to develop a map of the expected fertilization rate of N and P2O5 through the measurement of chemical components and the identification of spatial variability in soil samples collected from four lots of a paddy field in Korea. The paddy field was divided into 30 lots for the sampling of soils collected for the analysis. SOM, SiO2, and Av.P2O5 manifested differences of less than 15% compared to the overall average of the field, while the TN exhibited a difference of less than 20% from the overall average of the field.
According to the prescription standard of fertilization for each crop based on chemical components comprising SOM, SiO2, and Av.P2O5, the modeling for the expected fertilization rate of N and P2O5 was carried out, from which the predicted average of the fertilization rate of N and P2O5 per each lot appeared as 1.78 kg and 0.60 kg, respectively. The spherical model was employed to develop a map of soil components for the application of variable fertilization suitable for crops in Korean paddy fields. In addition, the map of the expected fertilization rate of N and P2O5 was developed through the application of regular kriging interpolation based on the spherical model for which the total field was divided into sectors of 1 × 1 m2 to achieve precise variable fertilization. The predicted fertilization rate of N for each lot in the entire field appeared in the range from min. 10.0 g to max. 25.7 g, whereas that of P2O5 appeared in the range from min. 0.68 g to max. 8.46 g. The map of the predicted fertilization rate of N exhibited a trend partially contrasting with the map of the predicted fertilization rate of TN, whereas the map of the predicted fertilization rate of P2O5 manifested a fully contrasting trend with the map of Av.P2O5 content. This kind of map of the predicted fertilization rate can minimize the input of resources by enabling a reasonable application of N and P2O5 necessary for crops. The map of the expected fertilization rate of P2O5 and N developed in the present study needs to be validated through verifying the actual yield and evaluating the quality of rice resulting from its use.

Author Contributions

Methodology, S.-M.K.; Validation, D.-C.K.; Formal analysis, J.W.; Writing—original draft, J.S.; Writing—review and editing, Y.C. All authors have read and agreed to the published version of the manuscript.

Funding

This research was supported by the Rural Development Administration of Korea (PJ01710005) and the National Institute of Agriculture, Forestry, and Food Technology Planning and Evaluation (RS-2023-00236201).

Institutional Review Board Statement

Not applicable.

Data Availability Statement

Not applicable.

Conflicts of Interest

The authors declare no conflict of interest.

References

  1. Kim, D. Development and Accuracy Evaluation of Field Soil Temperature Prediction Model by Depth Using Artificial Intelligence and Meteorological Parameters. Master’s thesis, The Seoul National University, Seoul, Republic of Korea, 2002. [Google Scholar]
  2. Passioura, J. Soil conditions and plant growth. Plant Cell Environ. 2002, 25, 311–318. [Google Scholar] [CrossRef] [PubMed]
  3. Tahat, M.M.; Alananbeh, K.M.; Othman, Y.A.; Leskovar, D.I. Soil health and sustainable agriculture. Sustainability 2020, 12, 4859. [Google Scholar] [CrossRef]
  4. Lemaire, G.; Gastal, F. N uptake and distribution in plant canopies. In Diagnosis of the Nitrogen Status in Crops; Springer: Berlin/Heidelberg, Germany, 1997; pp. 3–43. [Google Scholar]
  5. Wei, W.; Yang, M.; Liu, Y.; Huang, H.; Ye, C.; Zheng, J.; Guo, C.; Hao, M.; He, X.; Zhu, S. Fertilizer N application rate impacts plant-soil feedback in a sanqi production system. Sci. Total Environ. 2018, 633, 796–807. [Google Scholar] [CrossRef] [PubMed]
  6. Savci, S. An agricultural pollutant: Chemical fertilizer. Int. J. Environ. Sci. Dev. 2012, 3, 73. [Google Scholar] [CrossRef]
  7. Jeong, K.S. Sihwa Construction Project. J. Korean Water Resour. Assoc. 1996, 29, 106–115. [Google Scholar]
  8. Kim, H.; Kim, S.; Lee, D. The effects of irrigation water salinity levels on growth of rice by growth stage. J. Korean Soc. Agric. Eng. 2019, 2019, 73. [Google Scholar]
  9. Lee, S.H.; Yoo, S.H.; Seol, S.I. Assessment of Salt Damage for Upland-Crops in Dae-Ho Reclaimed Soil. J. Korean Environ. Agric. 2000, 19, 358–363. [Google Scholar]
  10. Monzon, J.P.; Calviño, P.; Sadras, V.O.; Zubiaurre, J.; Andrade, F.H. Precision agriculture based on crop physiological principles improves whole-farm yield and profit: A case study. Eur. J. Agron. 2018, 99, 62–71. [Google Scholar] [CrossRef]
  11. Khuang, T.; Huan, T.; Hach, C. Study on fertilizer rates for getting maximum grain yield and profitability of rice production. Omonrice 2008, 16, 93–99. [Google Scholar]
  12. Stafford, J.V. Essential technology for precision agriculture. In Proceedings of the Third International Conference on Precision Agriculture, Minneapolis, MN, USA, 23–26 June 1996; Wiley Online Library: New York, NY, USA; pp. 593–604. [Google Scholar]
  13. Van Rees, H.; McClelland, T.; Hochman, Z.; Carberry, P.; Hunt, J.; Huth, N.; Holzworth, D. Leading farmers in South East Australia have closed the exploitable wheat yield gap: Prospects for further improvement. Field Crops Res. 2014, 164, 1–11. [Google Scholar] [CrossRef]
  14. Cho, S.I.; Chang, Y.C.; Yeo, W.Y. Construction of a Spatioal Database for Realizing Precision Farming. J. Biosyst. Eng. 2002, 27, 161–172. [Google Scholar]
  15. Sawyer, J.E. Concepts of variable rate technology with considerations for fertilizer application. J. Prod. Agric. 1994, 7, 195–201. [Google Scholar] [CrossRef]
  16. Fu, W.; Tunney, H.; Zhang, C. Spatial variation of soil nutrients in a dairy farm and its implications for site-specific fertilizer application. Soil Tillage Res. 2010, 106, 185–193. [Google Scholar] [CrossRef]
  17. Scull, P.; Franklin, J.; Chadwick, O.A.; McArthur, D. Predictive soil mapping: A review. Prog. Phys. Geogr. 2003, 27, 171–197. [Google Scholar] [CrossRef]
  18. Sahoo, R.N. Geostatistics in Geoinformatics for Managing Spatial Variability; Indian Agricultural Research Institute: Pusa, India, 2003. [Google Scholar]
  19. Zhang, C.; Kovacs, J.M. The application of small unmanned aerial systems for precision agriculture: A review. Precis. Agric. 2012, 13, 693–712. [Google Scholar] [CrossRef]
  20. Diacono, M.; Castrignanò, A.; Troccoli, A.; De Benedetto, D.; Basso, B.; Rubino, P. Spatial and temporal variability of wheat grain yield and quality in a Mediterranean environment: A multivariate geostatistical approach. Field Crops Res. 2012, 131, 49–62. [Google Scholar] [CrossRef]
  21. Aggelopoulou, K.; Pateras, D.; Fountas, S.; Gemtos, T.; Nanos, G. Soil spatial variability and site-specific fertilization maps in an apple orchard. Precis. Agric. 2011, 12, 118–129. [Google Scholar] [CrossRef]
  22. Hong, Y.; Kim, G.; Kim, S.; Kang, T. Development of a soil sensor-based variable rate fertilizer applicator. In Proceedings of the KSAM 2013 Spring Conference, Jeju, Republic of Korea, 31 October–1 November 2013; Volume 18, pp. 139–140. [Google Scholar]
  23. NAAS. Manual of Analysis Procedures for Comprehensive Test Lab; National Academy of Agricultural Science, Rural Development Administration: Suwon-si, Republic of Korea, 2017. [Google Scholar]
  24. NAAS. Methods of Soil Chemical Analysis; National Academy of Agricultural Science, Rural Development Administration: Suwon-si, Republic of Korea, 2010. [Google Scholar]
  25. NASS. Fertilization Standard of Crops; National Academy of Agricultural Science, Rural Development Administration: Suwon-si, Republic of Korea, 2017. [Google Scholar]
  26. Ver Hoef, J.M.; Cressie, N. Multivariable spatial prediction. Math. Geol. 1993, 25, 219–240. [Google Scholar] [CrossRef]
  27. Yang, F.-g.; Cao, S.-y.; Liu, X.-n.; Yang, K.-j. Design of groundwater level monitoring network with ordinary kriging. J. Hydrodyn. 2008, 20, 339–346. [Google Scholar] [CrossRef]
  28. Lee, K.S.; Lee, D.H.; Jung, I.K.; Chung, S.O.; Sudduth, K.A. Sampling and calibration requirements for optical reflectance soil property sensors for Korean paddy soils. J. Biosyst. Eng. 2008, 33, 260–268. [Google Scholar]
  29. Gringarten, E.; Deutsch, C.V. Teacher’s aide variogram interpretation and modeling. Math. Geol. 2001, 33, 507–534. [Google Scholar] [CrossRef]
  30. Hwang, S.H.; Ham, D.H. Evaluation of spatial downscaling methods for enhancement of spatial precipitation estimation. J. Korean Soc. Hazard Mitig. 2013, 13, 149–164. [Google Scholar] [CrossRef]
  31. Park, N.-W. Integration of categorical data using multivariate kriging for spatial Interpolation of ground survey data. Spat. Inf. Res. 2011, 19, 81–89. [Google Scholar]
Figure 1. Location of soil sampling point in Hwaseong–si, Gyeonggi–do, Republic of Korea. All fields were divided into 30 sections. Each number was a soil sampling number.
Agriculture 13 02049 g001
Figure 2. Sill, range, and nugget on variogram.
Agriculture 13 02049 g002
Figure 3. Expected N fertilization rate by section. All fields were divided into 30 sections. Each section size of field 1 to 4 was 11 × 9, 13 × 8, 13 × 9, and 13 × 9 m2, respectively.
Agriculture 13 02049 g003
Figure 4. Expected P2O5 fertilization rate by section. All fields were divided into 30 sections. Each section size of field 1 to 4 was 11 × 9, 13 × 8, 13 × 9, and 13 × 9 m2, respectively.
Agriculture 13 02049 g004
Figure 5. Variogram of N and P2O5 using spherical model. The blue and gray lines mean the spherical model and measured data, respectively.
Agriculture 13 02049 g005
Figure 6. Mapping of TN content in soil and estimated N fertilization rate. Each square color represents the appropriate N fertilization rate for a 1 m2 divided field.
Agriculture 13 02049 g006
Figure 7. Mapping of Av.P2O5 content in soil and estimated P2O5 fertilization rate. Each square color represents the appropriate P2O5 fertilization rate for a 1 m2 divided field.
Agriculture 13 02049 g007
Table 1. Soil properties of collected soil samples.
Min.25%Median75%Max.Mean* S.D.
All Fields
(n = 120)
SOM [g/kg]11.3716.8919.9624.3331.2920.604.48
SiO2 [mg/kg]300.88414.60466.04524.30637.40471.6072.80
Total Nitrogen [%]0.060.100.120.140.190.120.02
Av.P2O5 [mg/kg]15.3935.2041.8452.3575.4344.2412.73
Field 1
(n = 30)
SOM [g/kg]11.3716.7421.9823.6829.9120.904.38
SiO2 [mg/kg]300.88410.51450.74509.21629.48456.0070.47
Total Nitrogen [%]0.060.100.130.150.190.130.03
Av.P2O5 [mg/kg]28.5833.8037.8142.6748.6438.105.72
Field 2
(n = 30)
SOM [g/kg]20.4324.3325.9027.3931.2925.503.09
SiO2 [mg/kg]327.74387.23421.58481.50565.71437.4068.03
Total Nitrogen [%]0.110.130.140.150.170.140.02
Av.P2O5 [mg/kg]15.3929.3135.6141.7448.7835.709.63
Field 3
(n = 30)
SOM [g/kg]15.2517.2119.0521.0824.7419.202.47
SiO2 [mg/kg]409.49442.02474.28533.05637.40488.5052.92
Total Nitrogen [%]0.90.100.110.120.150.110.01
Av.P2O5 [mg/kg]32.4336.5441.5447.6560.2342.708.00
Field 4
(n = 30)
SOM [g/kg]11.5815.3916.7118.5321.9816.802.39
SiO2 [mg/kg]375.14438.22505.41571.92696.36504.6080.42
Total Nitrogen [%]0.080.090.100.120.140.100.01
Av.P2O5 [mg/kg]48.3654.7858.5364.7575.4360.609.06
* S.D. = Standard Deviation.
Table 2. Means and standard deviations (SD) of expected fertilizer.
All Fields Field 1Field 2Field 3Field 4
Mean
(n = 120)
SD
(n = 120)
Mean
(n = 30)
SD
(n = 30)
Mean
(n = 30)
SD
(n = 30)
Mean
(n = 30)
SD
(n = 30)
Mean
(n = 30)
SD
(n = 30)
Nitrogen fertilizer
[kg/10a]
16.30.2715.90.1515.10.1716.80.1217.40.12
P2O5 fertilizer
[kg/10a]
5.60.126.10.066.40.105.70.094.30.11
Table 3. Sill and range for soil properties and expected fertilizer using variogram.
Field 1Field 2Field 3Field 4
Sill
(m)
Range
(m)
Sill
(m)
Range
(m)
Sill
(m)
Range
(m)
Sill
(m)
Range
(m)
Soil
properties
TN
in soil (%)
0.0051276.600.0009124.000.0006220.000.0008182.90
Av.P2O5
in soil (mg/kg)
33.3236.3189.0127.0810099.9066.2630.85
Expected
fertilizer
N fertilizer
(kg/Sector *)
0.019928.420.022020.430.018927.540.061443.26
P2O5 fertilizer
(kg/Sector *)
0.003336.310.010431.190.011273.680.008826.13
Sector * = Division of the entire field into 30 (Each sector size of fields 1–4 is 99 m2, 104 m2, 127 m2, and 127 m2).
Disclaimer/Publisher’s Note: The statements, opinions and data contained in all publications are solely those of the individual author(s) and contributor(s) and not of MDPI and/or the editor(s). MDPI and/or the editor(s) disclaim responsibility for any injury to people or property resulting from any ideas, methods, instructions or products referred to in the content.

