Article

Effect of Iron Content on the Pitting Corrosion Behavior of Laser-Cladded Ni-Cr-Mo Alloy Coating in a Simulated Seawater Environment

Key Laboratory of Power Station Energy Transfer Conversion and System of Ministry of Education, North China Electric Power University, Beijing 102206, China
*
Author to whom correspondence should be addressed.
Coatings 2024, 14(4), 459; https://doi.org/10.3390/coatings14040459
Submission received: 8 March 2024 / Revised: 27 March 2024 / Accepted: 3 April 2024 / Published: 10 April 2024

Abstract

:
In order to study the effect of iron content on the pitting corrosion behavior of a Ni-Cr-Mo alloy coating in a simulated seawater environment, a Ni-Cr-Mo-xFe (x = 0, 5, 10, 15, 20, 25) alloy coating was prepared through laser cladding technology. These coatings primarily consist of a γ-Ni solid solution phase, with observable iron segregation in the interdendritic regions when the iron content reaches 25 wt%. After 42 days of salt spray corrosion, it was found that pitting began to appear on the surface when the iron content in the coating increased to 10 wt%. The results of electrochemical behavior revealed that the coatings with iron contents in a range of 10–25 wt% exhibited metastable pitting characteristics, and the impedance modulus decreased with the increase in iron content. Pitting corrosion occurs due to selective corrosion of the dendritic regions. When the iron content exceeds 10 wt%, the accumulation of iron in the outer layer of the passivation film would lead to an excess of cationic vacancies, and the stability of the passive film is then reduced. This study provides a reference for the control of the iron content in a Ni-Cr-Mo alloy coating when applied in marine environments.

1. Introduction

As an emerging surface modification technology, laser cladding technology has been widely recognized and applied in the fields of the petrochemical industry and power equipment [1,2,3,4]. The laser-cladded Ni-Cr-Mo alloy coating is widely used in marine engineering and ships due to its excellent corrosion resistance [5,6,7,8,9] to various forms of corrosion. The composition of alloying elements [10,11,12,13] plays a pivotal role in shaping the microstructure and corrosion properties of the coating, with particular emphasis on Ni, Cr, and Mo. The inclusion of Ni and Cr facilitates the development of a dense passive film [14], comprising NiO and Cr2O3 oxides. Furthermore, the incorporation of Mo improves the stability of the passive film and enhances pitting corrosion resistance by facilitating rapid repassivation. As the alloy coating prepared on marine engineering equipment using laser cladding technology tends to become thinner, iron from the base steel matrix inevitably diffuses into the Ni-Cr-Mo alloy coating [15], leading to a reduction in the content of alloying elements within the coating due to the high mutual solubility among Fe, Ni, and Cr, subsequently affecting its properties. Due to the absence of a standardized process for laser cladding technology, there is currently no unified standard for controlling the iron content in the coating. Ni-Cr-Mo alloy powder typically used for laser cladding contains a certain percentage of Fe, indicating that a certain amount of iron can be contained in the coating. Moreover, commercial alloy materials offer a wide range of Fe content in Ni-Cr-Mo alloys [16], such as Hastelloy C22 and Inconel 625 alloy. Notably, research by Gittos M. F. has documented that the diffusion of Fe into Ni-Cr-Mo overlays leads to a reduction in pitting resistance. These findings emphasize that, for achieving optimal performance, it is advisable to maintain the iron content below 5 wt% [17]. Consequently, the API 6A standard prescribes a limitation on the Fe content within welds to 5 wt% for applications within the petroleum industry. Within the context of laser cladding, the dilution rate of iron in the coating can be regulated through adjustments in laser cladding parameters. However, it is important to note that there is currently no established standard or definitive reference delineating the acceptable range for controlling the iron content.
The influence and role of iron have garnered significant attention in scientific research and engineering applications. In certain nickel–iron (Ni-Fe) alloys, the Fe content has been increased to as high as 30 wt% for reasons of cost-effectiveness and ease of workability [18]. However, this increase in Fe content unavoidably leads to a decrease in corrosion resistance. Davis [19] conducted research with the addition of iron to nickel-based alloys from an economic perspective and discovered that higher iron content rendered the Ni-based alloy more susceptible to corrosive ion attacks. Various studies have explored the impact of Fe content on the high-temperature corrosion of Ni-Cr alloys [20,21]. It was found that elevated Fe content promoted the formation of intergranular Cr-rich carbides. Conversely, Hemmati et al. [22] observed that increasing the dilution of Fe content in Ni-Cr-B-Si-C cladding coatings, up to over 40 wt%, entirely suppressed the precipitation of primary Cr borides. Khayat’s research [23] revealed that the addition of just 1 wt% Fe led to smaller grain sizes and a higher prevalence of equiaxed grains in laser-based directed energy deposition of Inconel 625. Moreover, Moskal [24] analyzed the influence of iron from the substrate metal on the microstructural characteristics of laser-cladded NiCrAlY coatings. Iron content not only altered the microstructure but also had a pronounced impact on corrosion behavior. Lourenço et al. [25] conducted a specific investigation into the effect of Fe content on the microstructure and electrochemical behavior of Inconel 625 prepared by arc melting. They found that the corrosion resistance of Inconel 625 improved significantly when adding 10 and 15 wt% Fe, in contrast to adding Fe in the 2–5 wt% range, due to the absence of the metal monocarbides (MC) phase. Furthermore, Gao et al. [26] delved into the influence of Fe content ranging from 0 to 25 wt% on the microstructure and corrosion resistance of Ni60 coatings produced via laser cladding. Their findings revealed that the addition of 25 wt% Fe to Ni60AA resulted in the formation of γ-FCC/(Cr, Fe)7C3 eutectics, which led to excellent corrosion resistance, nearly comparable to the alloy without Fe addition. It can be seen that for different alloy coatings, the effect of increased iron content on the corrosion resistance of the coating is different.
In previous research, numerous scholars extensively examined the impact of iron content on both microstructure and corrosion resistance. However, there is a lack of research on the effect of the iron dilution rate on the pitting corrosion resistance of the laser-cladded Ni-Cr-Mo alloy coating. However, there is a lack of research on the effect of the iron dilution rate on the pitting corrosion resistance of the laser-cladded Ni-Cr-Mo alloy coating. It is commonly understood that the exceptional corrosion resistance of the Ni-Cr-Mo alloy coating in corrosive environments stems from the presence of a protective passive film on their surface. In marine environments, the presence of a significant amount of corrosive chloride ions (Cl), with their small radius and high diffusion rate, can hinder the formation of passive films. The passive films are prone to breakdown in a marine environment, which can expedite the dissolution of the substrate. Consequently, the breakdown of the passive film and its associated pitting corrosion behavior are factors of considerable significance. When the iron content within the Ni-Cr-Mo alloy coating surpasses a certain threshold, it tends to increase the likelihood of pitting corrosion, leading to localized breaches in the passive film. This, in turn, results in a reduction in the pitting resistance of the coating. From an alternate perspective, a specific quantity of iron can facilitate the formation of protective iron oxides or hydroxides with a porous structure on the surface of stainless steel [27,28,29,30]. Furthermore, these iron compounds can exhibit stability in alkaline solutions [31] when serving as the outer layer of the passive film. This suggests that iron plays a pivotal role in the electrochemical behavior of the passive film [32].
This study aims to reveal the relationship between the Fe content, pitting corrosion behavior, and chemical state of the passive film formed on Ni-Cr-Mo-Fe coatings in a simulated marine environment. The research involves an analysis of the coating’s structure and elemental distribution under varying iron concentrations, conducted through X-ray diffraction, scanning electron microscopy, and energy spectrometry. Furthermore, the pitting corrosion behavior is explored through observations and analyses of corrosion morphology during neutral salt fog tests and ferric chloride immersion tests. The electrochemical characteristics of the coating are assessed via kinetic potential polarization curves, impedance spectra, and Mott–Schottky analysis. The composition of the passive film is examined using X-ray photoelectron spectroscopy (XPS). Ultimately, this study discusses the pitting corrosion behavior of the coating and the impact of iron content on the passive film. The rate of iron dilution emerges as a critical factor influencing the corrosion resistance of laser-cladded coatings, underscoring the significance of controlling iron dilution during the laser cladding process. The insights derived from this research concerning the effect of iron content on coating properties can offer valuable guidance for the design and optimization of such coatings.

2. Materials and Methods

2.1. Material and Specimen Preparation

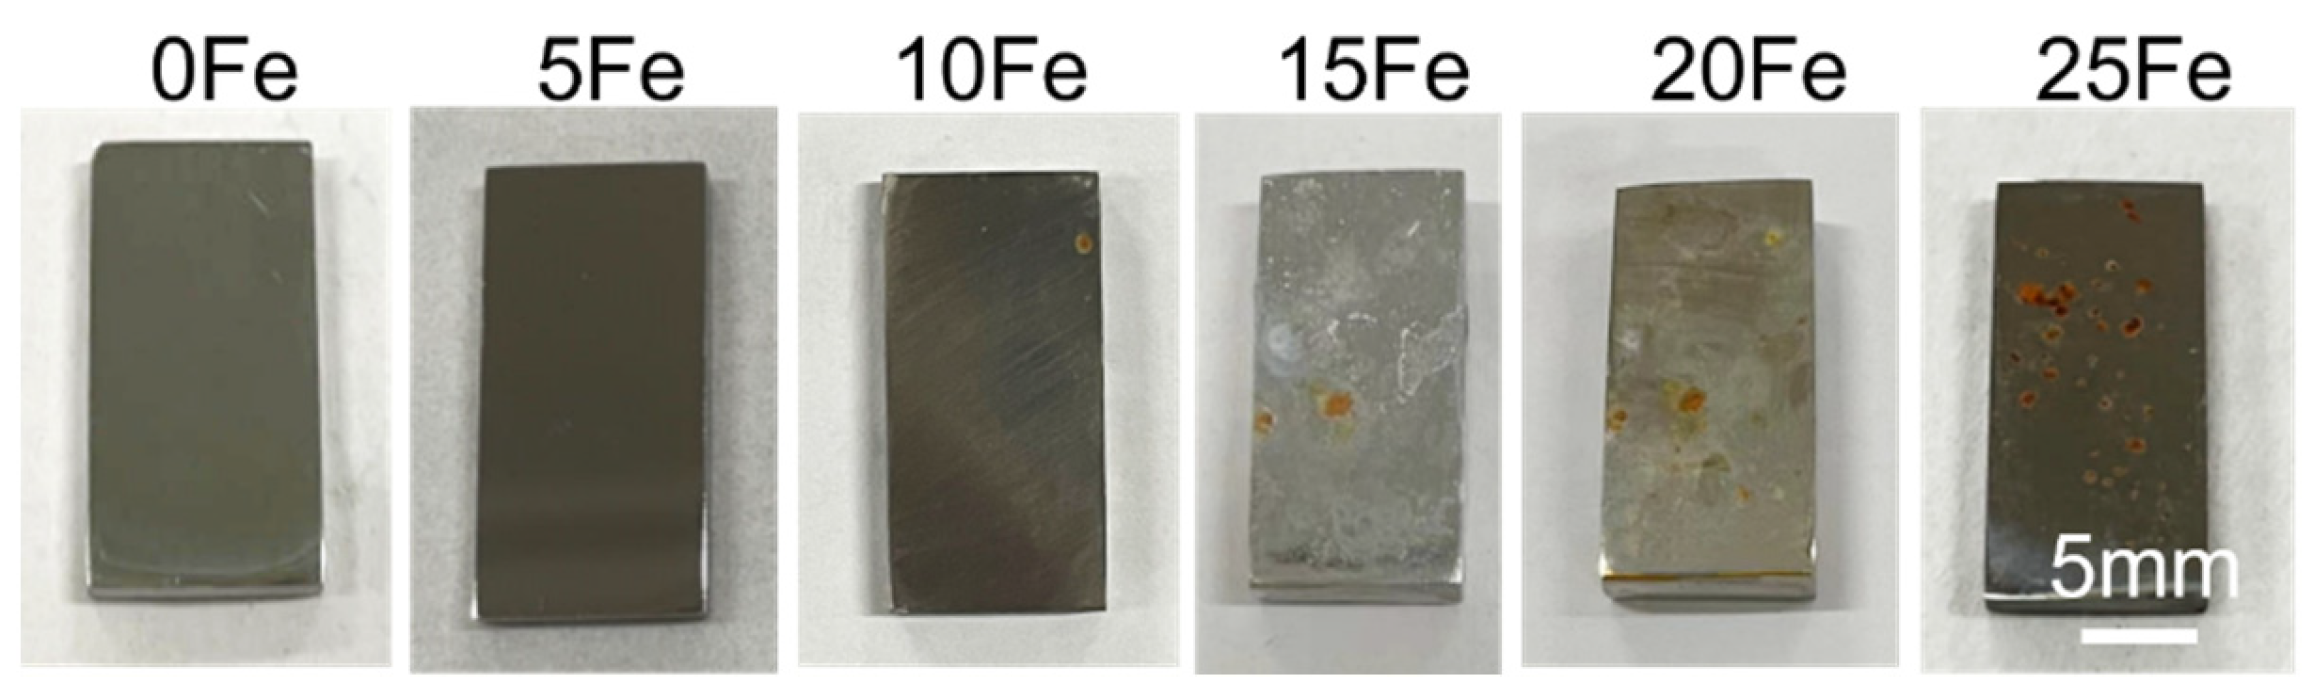
In this study, a self-developed Ni-Cr-Mo alloy powder was employed to examine the impact of iron content on the corrosion resistance of coatings used in offshore wind power structural steel. To achieve this, Ni-Cr-Mo alloy powder was mixed in various proportions with pure Fe powder (5 wt%, 10 wt%, 15 wt%, 20 wt%, 25 wt%) and subsequently utilized in the fabrication of coatings through laser cladding technology. The chemical compositions of the powder were determined using the NitonTM XL2 XRF Analyzer (Thermo Fisher Scientific, Waltham, MA, USA), and the results along with their identification codes are presented in 
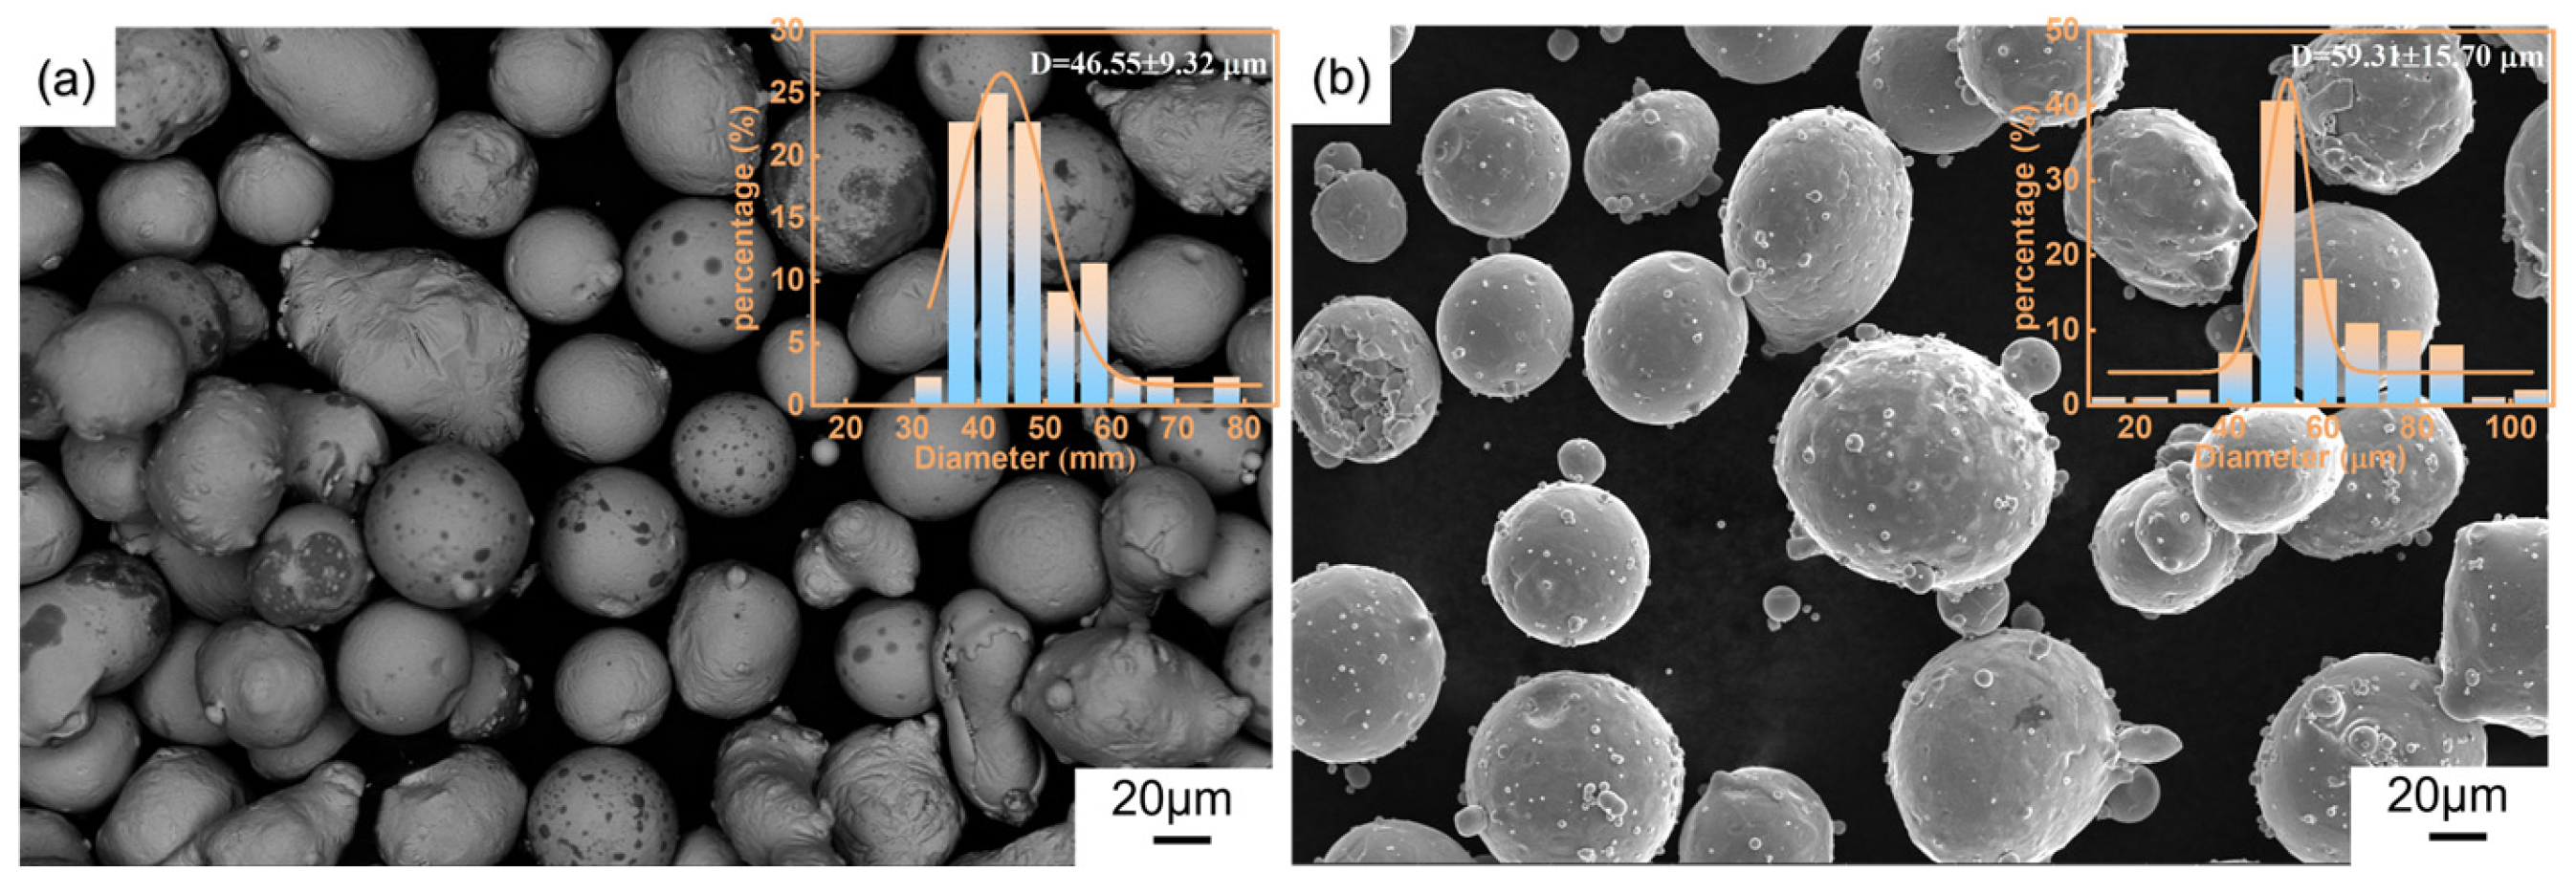
Table 1. The size and morphology of both the Ni-Cr-Mo alloy powder and Fe powder can be observed in 
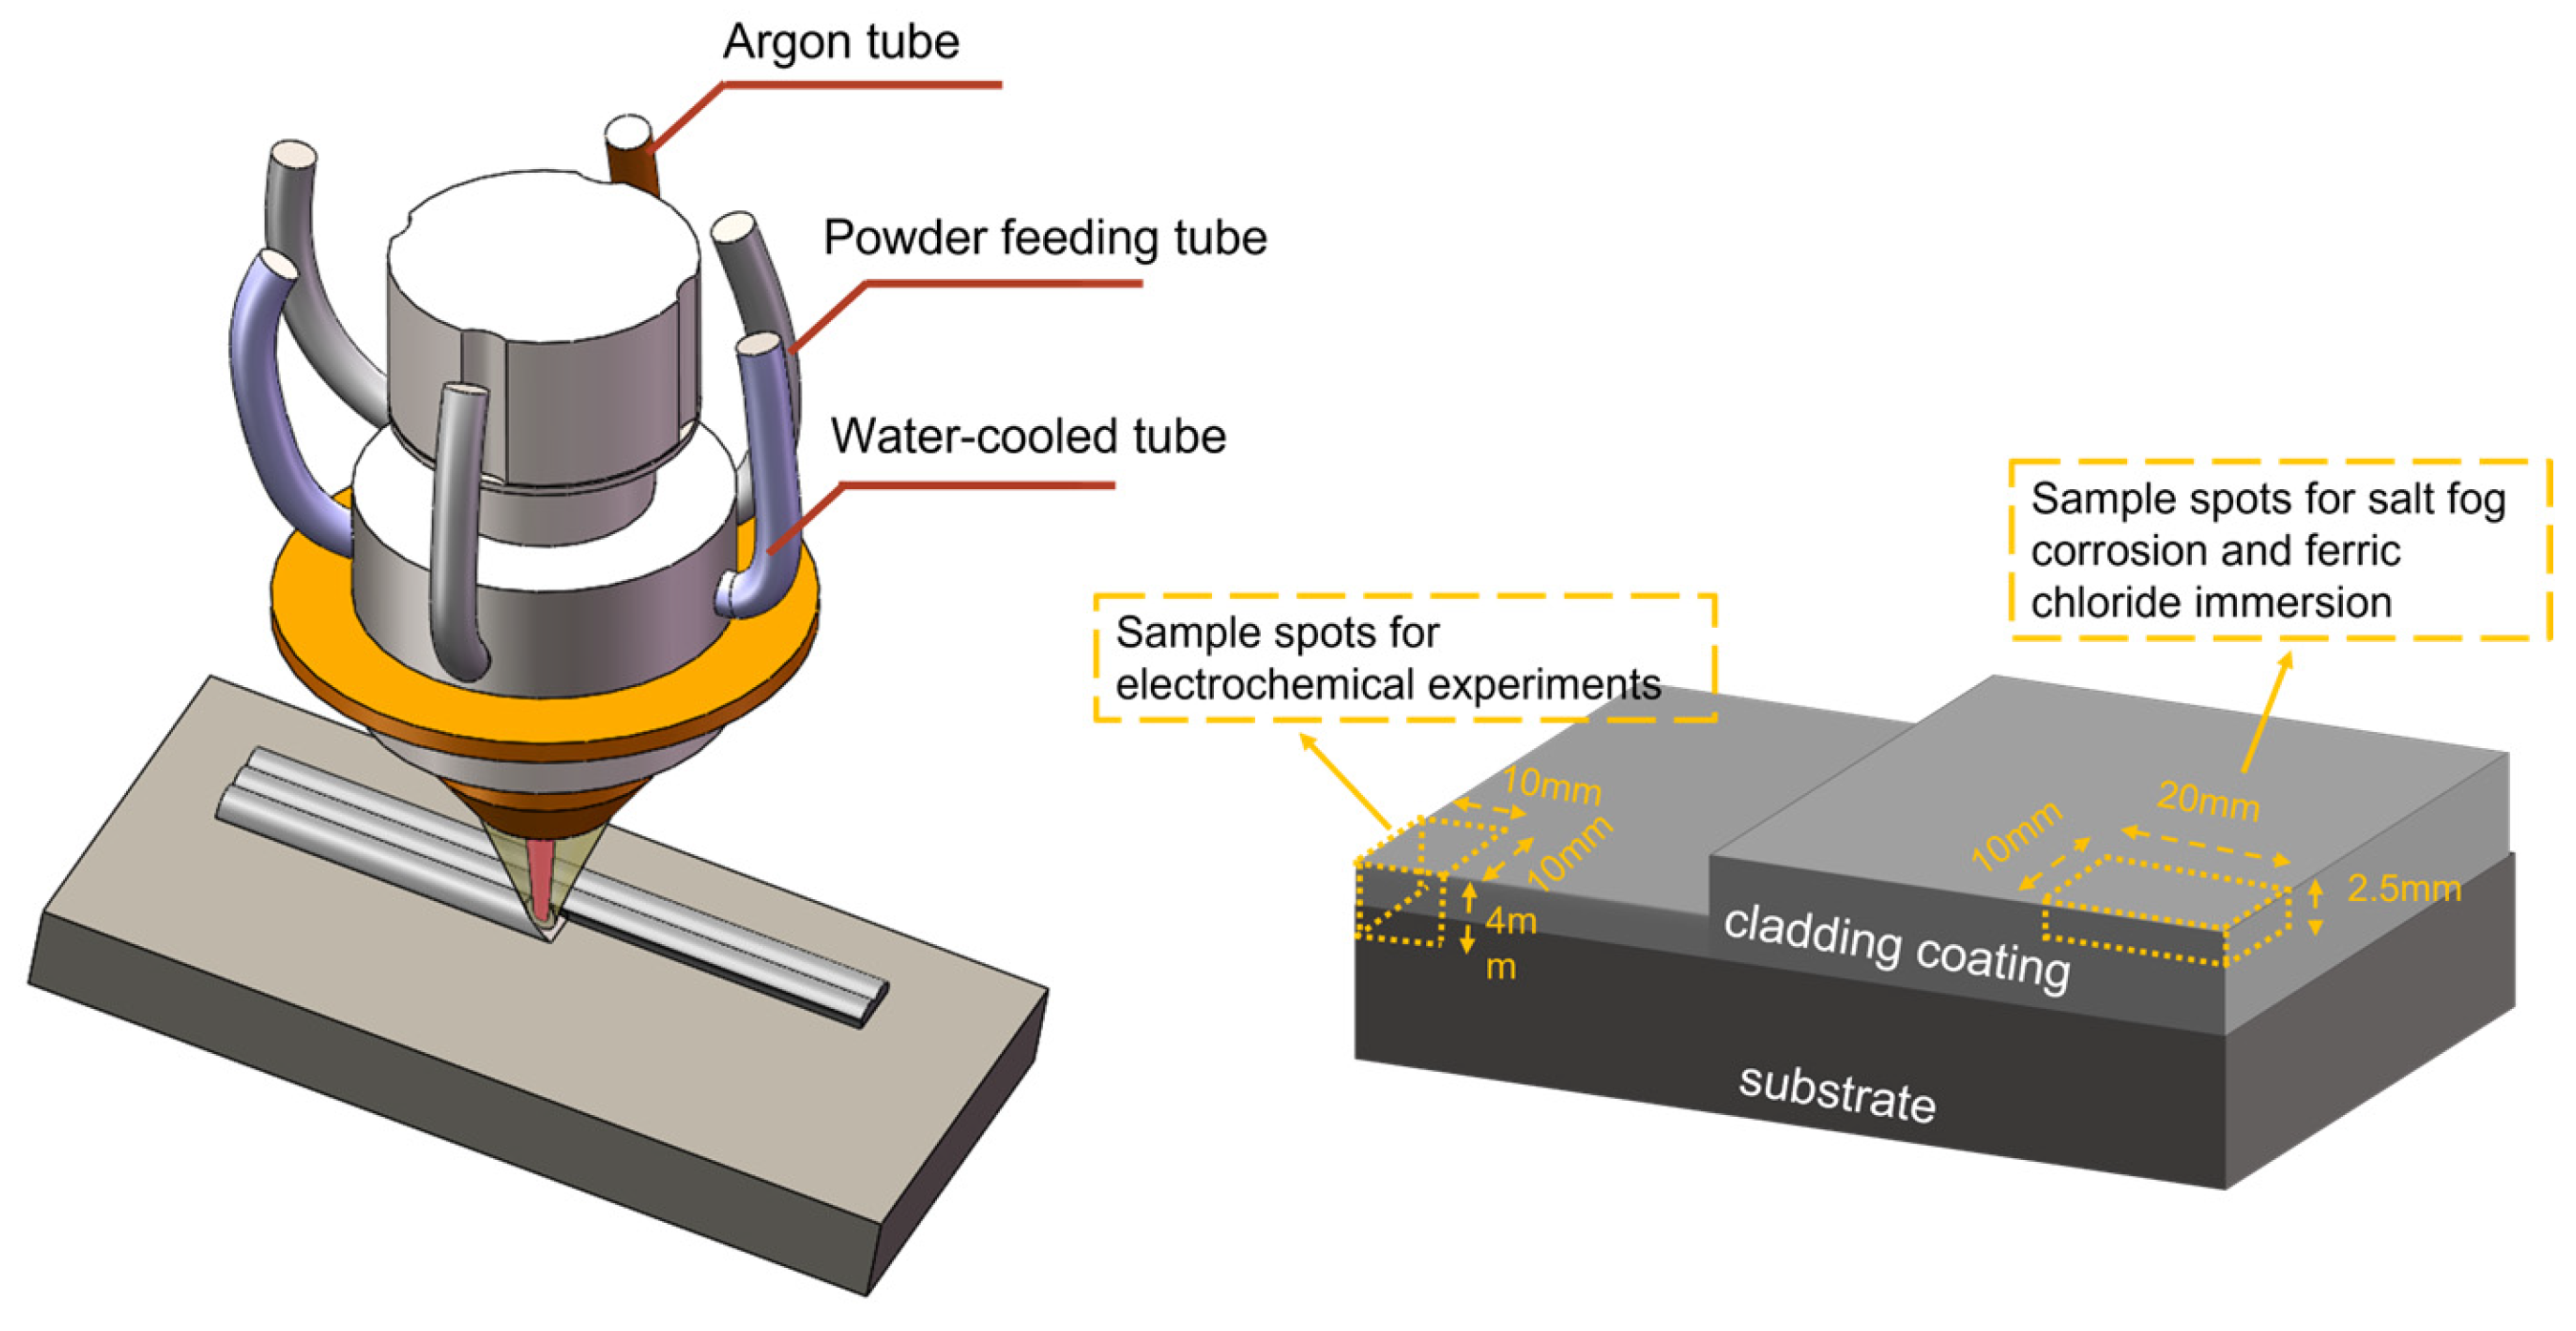
Figure 1, with the mean diameter of the Ni-Cr-Mo alloy powder measuring 46.55 ± 9.32 μm and the Fe powder averaging 59.31 ± 15.70 μm in diameter. The laser-cladded coating was fabricated on the surface of the Q345 steel by a fiber laser system (zKzM-RF-3000, Xi’an, China) with a power of 3 kW. Laser power was 2.2 kW, laser scanning rate was 12 cm/s, overlap ratio was 60%, powder feeding rate was 1.8 kg/h, and argon gas velocity was 15 mL/min. The laser-cladded coatings prepared in multiple layers were cut by Wire-cut Electrical Discharge Machining (WEDM) and processed, as shown in Figure 2, with different thicknesses. The laser-cladded coatings used for electrochemical testing were cut to 10 mm × 10 mm × 4 mm and then mounted in epoxy resin for corrosion test with an exposure area of 1.0 cm2. The sample used for salt fog corrosion and immersion testing was cut to 10 mm × 20 mm × 2.5 mm. The work surface of the specimens was meticulously polished using diamond paste, following a sequence of grinding steps up to 2000 grits with SiC abrasive papers. Finally, the samples were subjected to ultrasonic cleaning in acetone and subsequently dried in preparation for testing. The thickness of the coatings used in electrochemical experiments, following surface treatment, averaged approximately 1600 μm.

2.2. Microstructure and Morphology Analysis

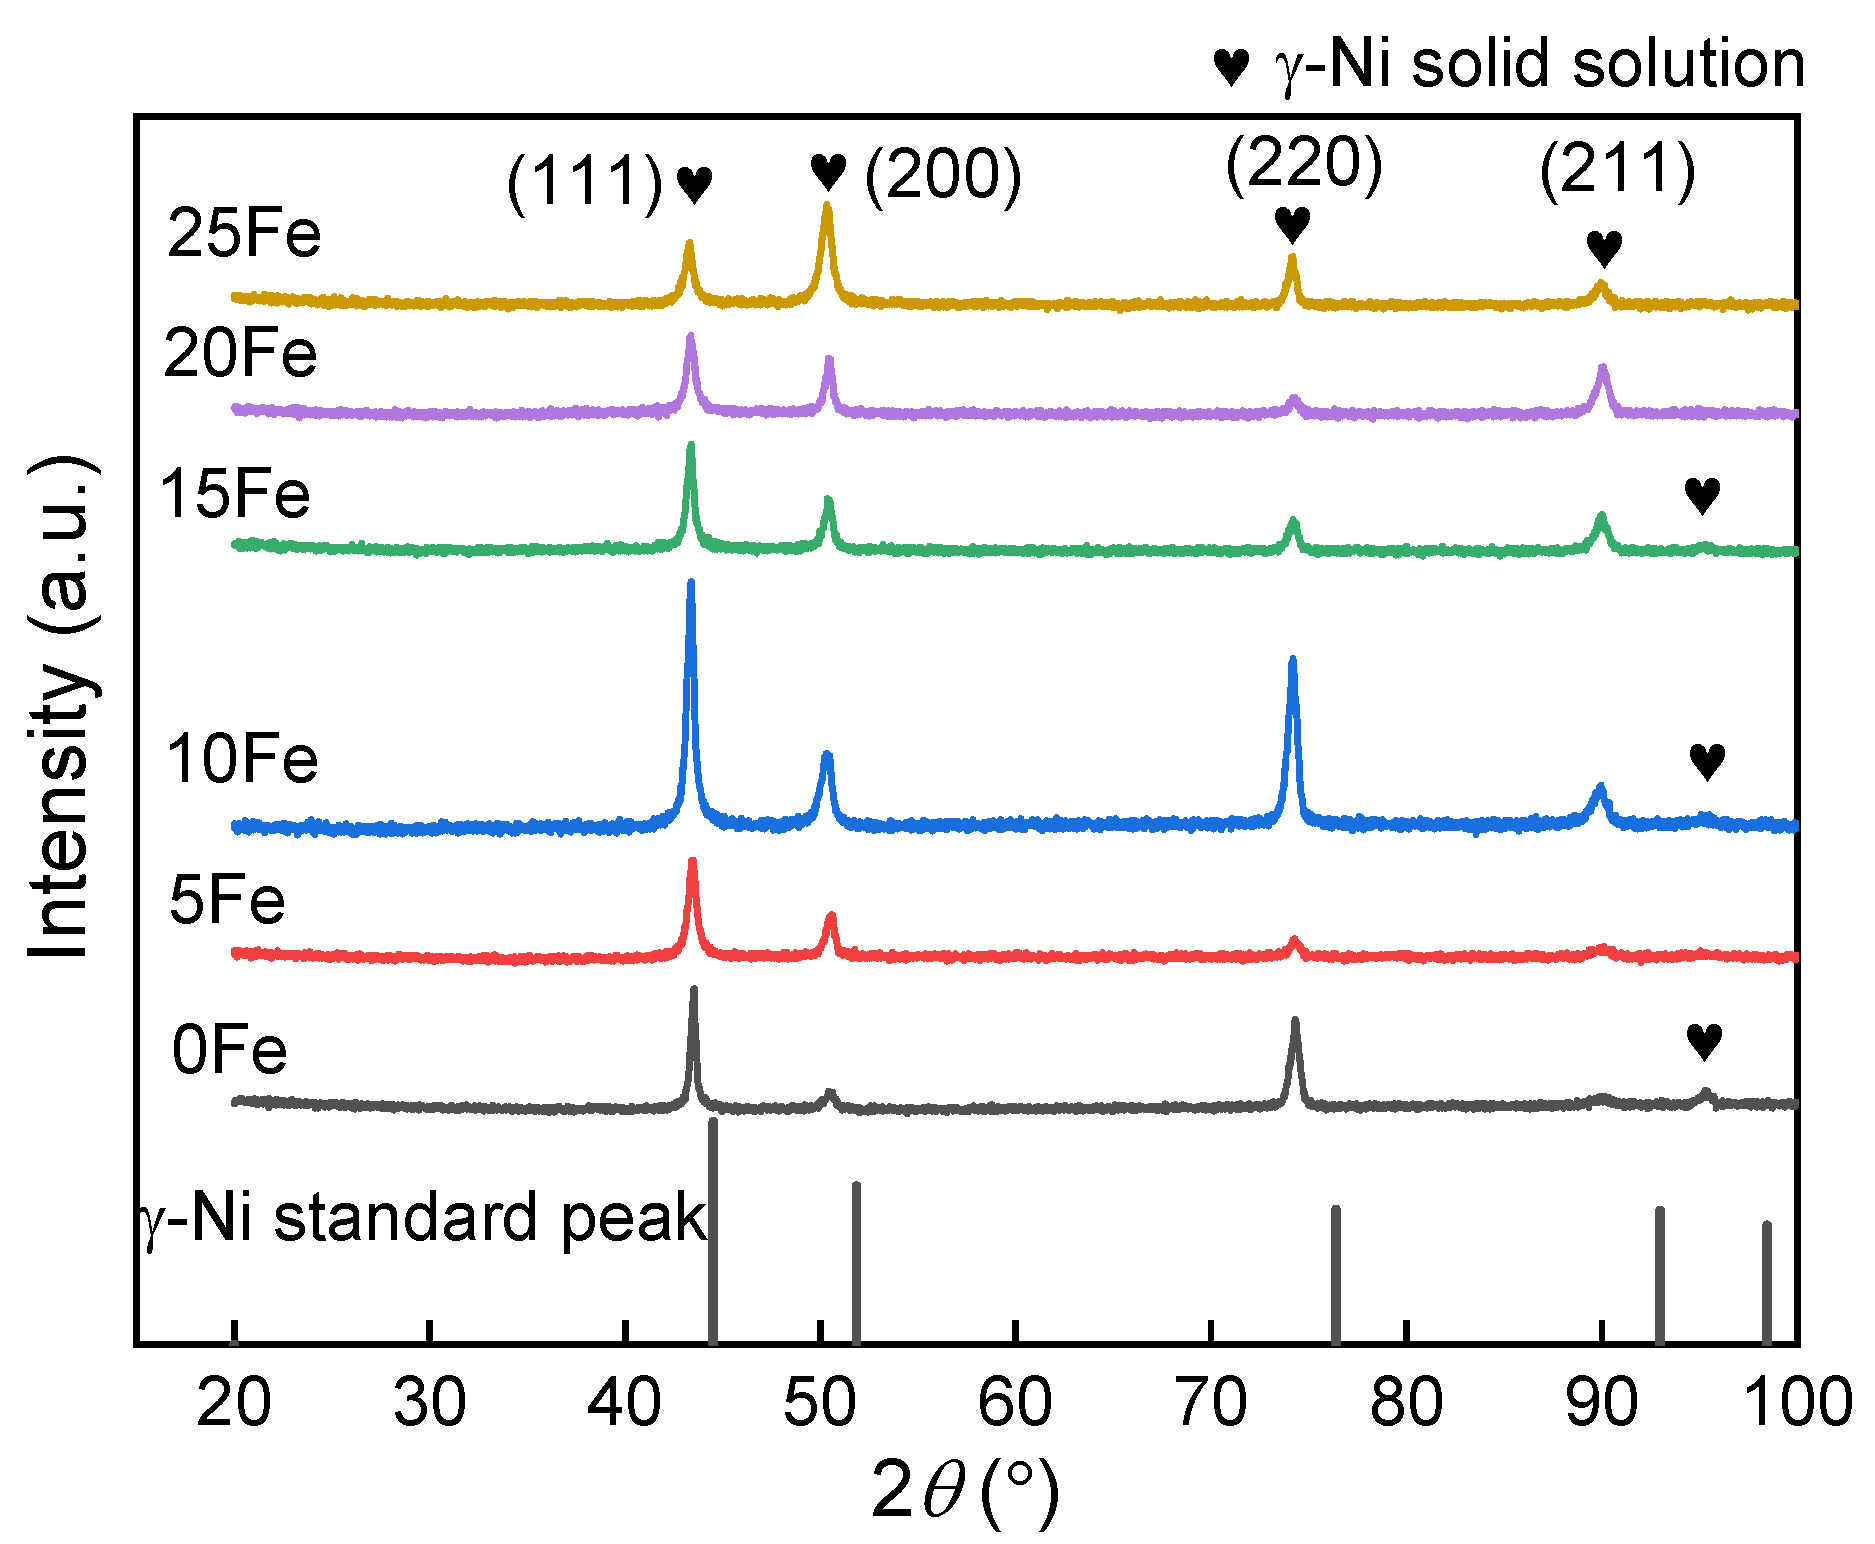
The microstructure and morphology of the coating were observed by scanning electron microscopy (SEM, FEI Quattro-S, Netherlands and Berlin ZEEISS EVO, 20 kV, Oberkochen, Germany) after the surface of the specimens was etched by aqua regia solution (3HCl: HNO3, vol%); energy-dispersive X-ray spectroscopy (EDS) was used to determine the elemental composition and distribution. Additionally, X-ray diffraction (XRD, D/MAX-RA12KW, Ouyatu, Japan) was used to analyze the phase composition of the coatings at a scan rate of 8°/min, with diffraction angle 2θ ranging from 20° to 100°. The instrument is measured through Bragg–Brentano diffraction geometry, and the phase composition was analyzed by Jade 6.5 software. Observation of the corrosion morphology after the immersion test was performed by optical microscopy (OM, Nikon LV150, Japan).

2.3. Salt Fog Measurement

A salt fog test was performed following the ASTM B117-09 standard [
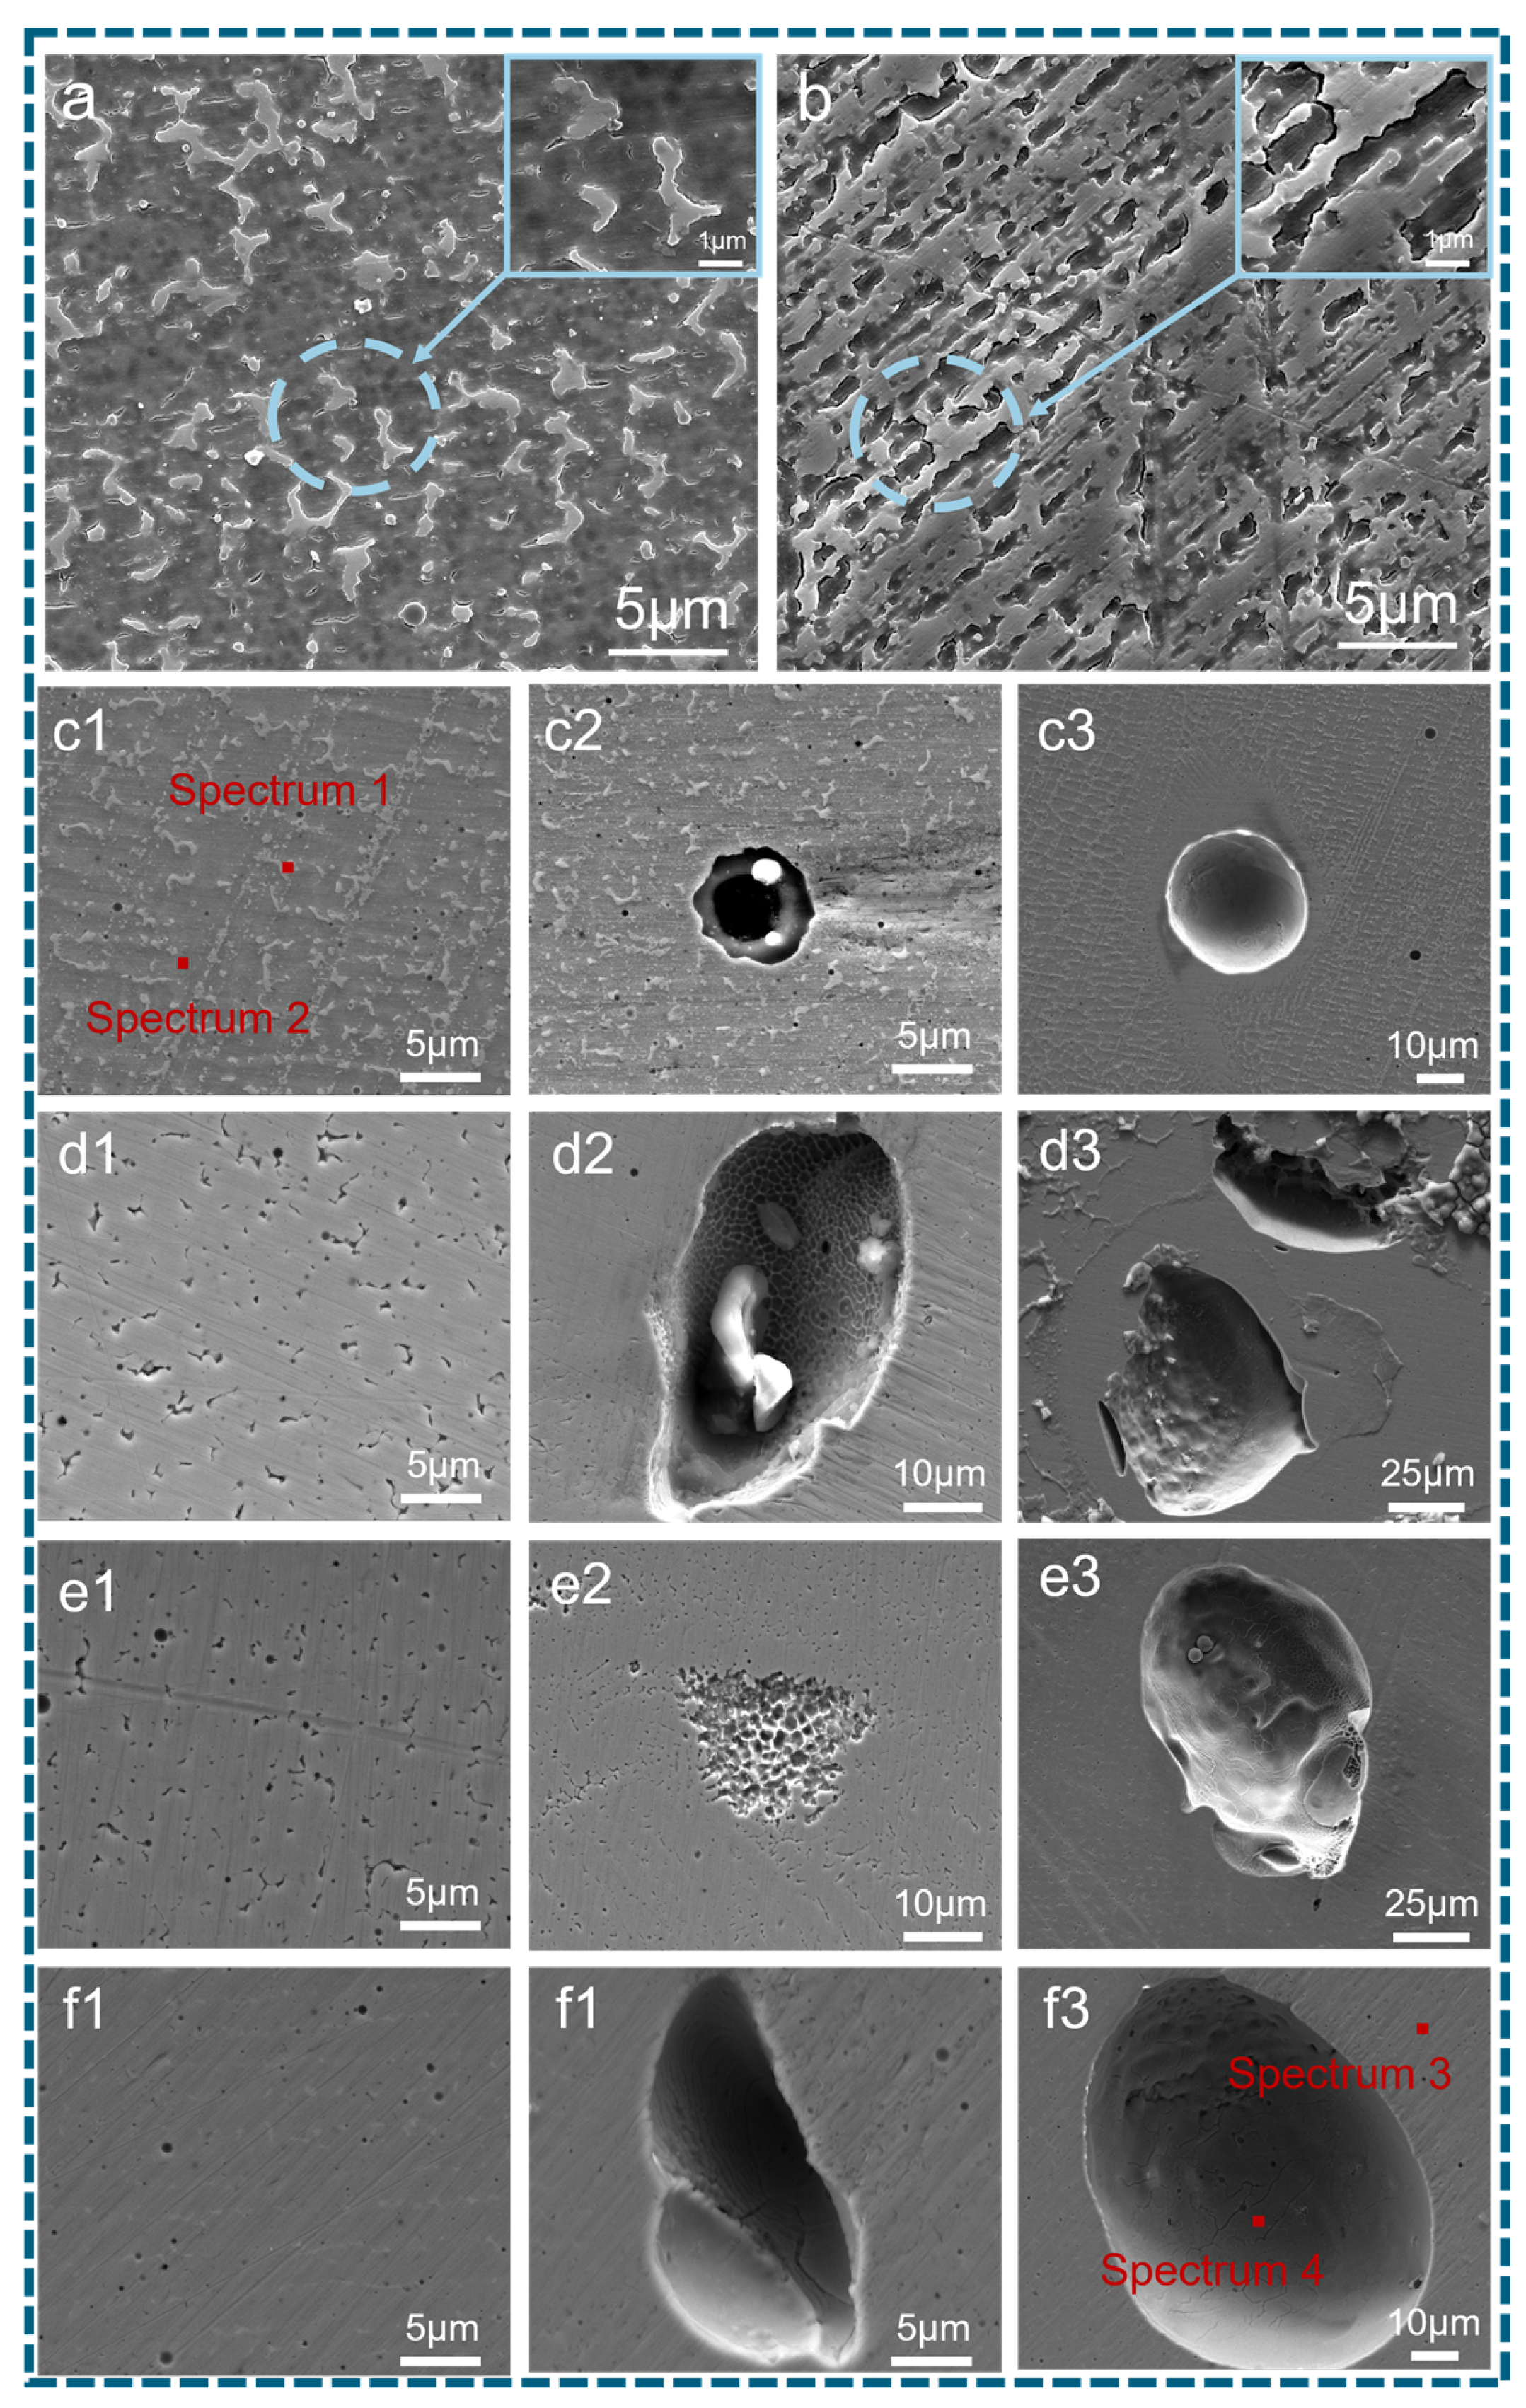
33] at a temperature of 35 °C, a relative humidity of 95%, and a sodium chloride concentration of 5 g/L. The sample was positioned at a 10-degree angle to the horizontal, and the corrosion process continued for 42 days. Following the completion of the corrosion process, the surface morphology of the sample was analyzed by SEM.

2.4. Ferric Trichloride Immersion Measurement

Ferric trichloride immersion tests were conducted in the 6 wt% FeCl3 + 0.05 mol/L HCl solution for 72 h at 85 °C in accordance with the ASTM G48 standard [
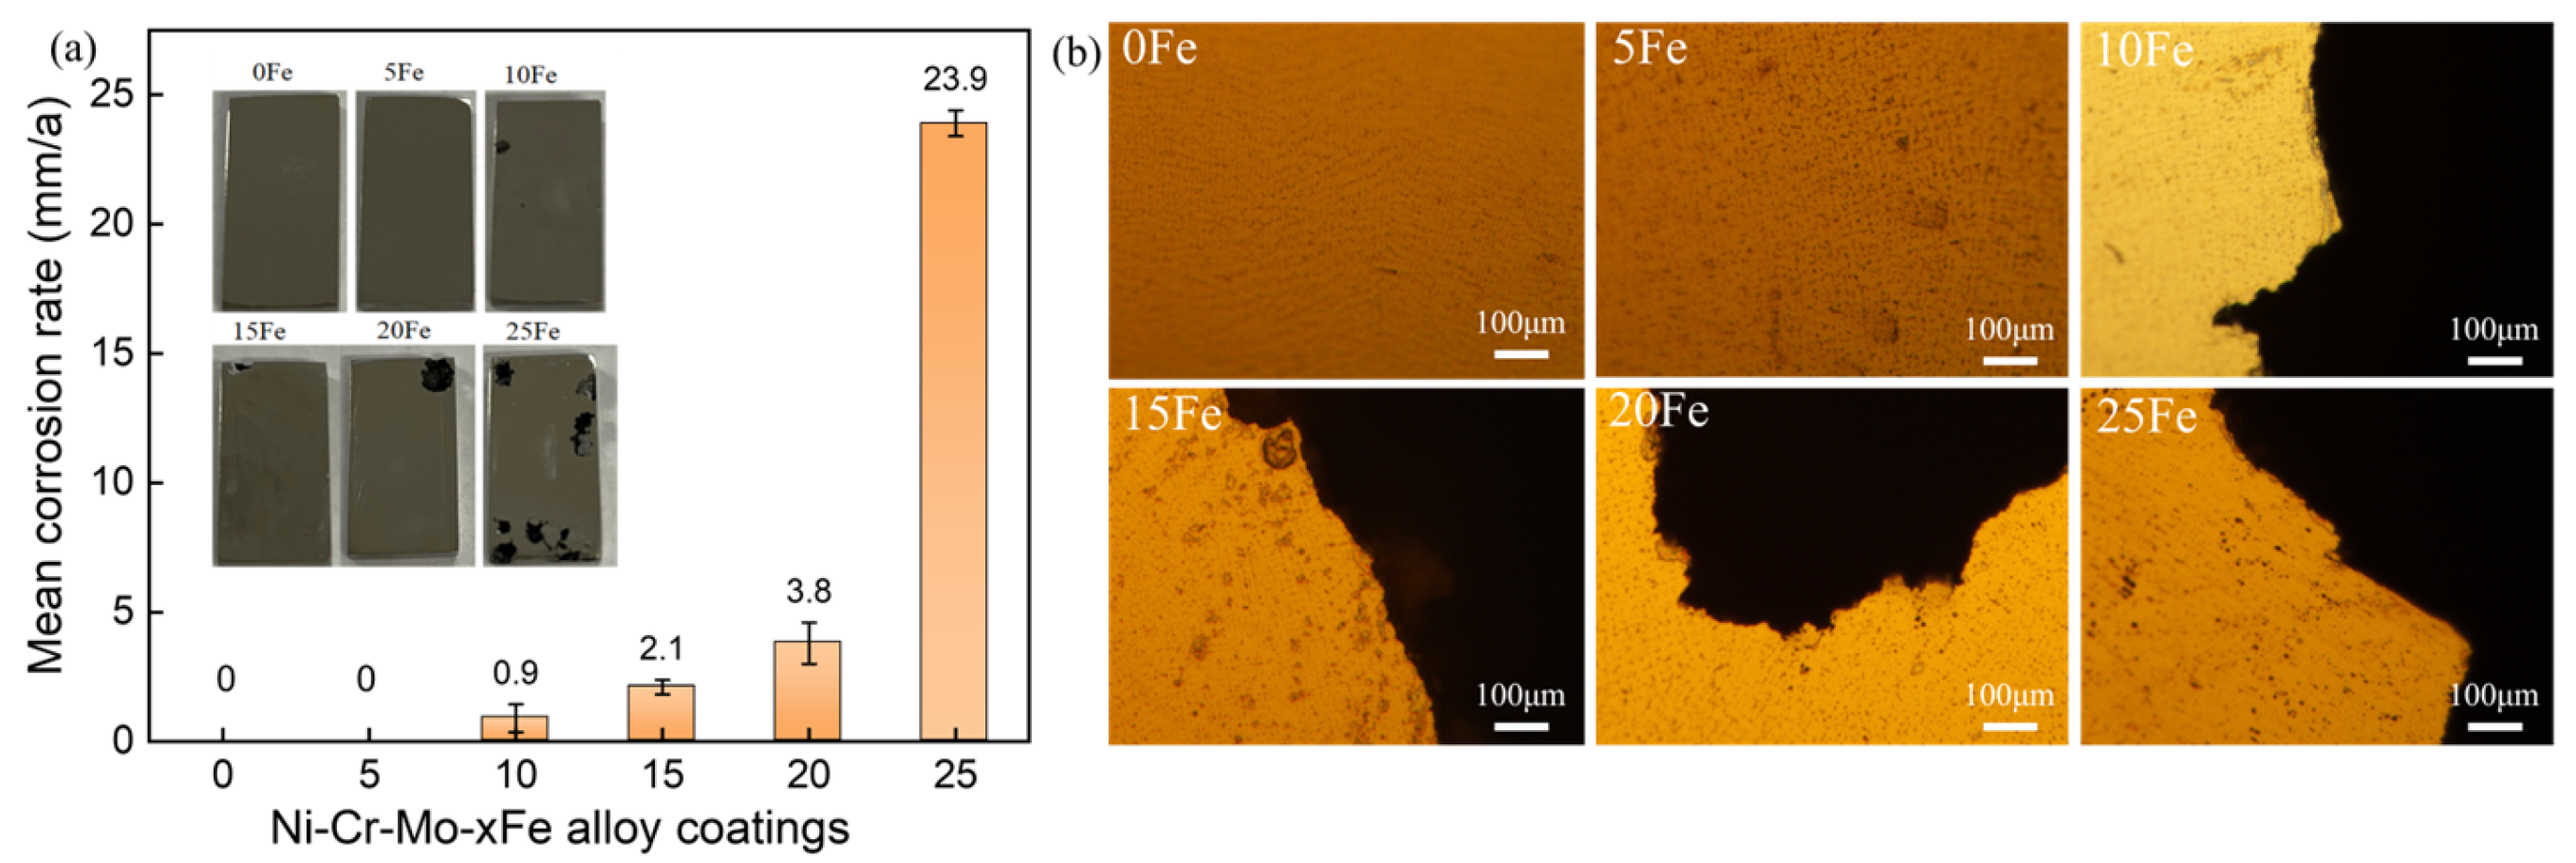
34]. The temperature was predetermined based on the critical pitting temperature. One can estimate critical pitting temperature (CPT) by using the following formula: CPT (°C) can be calculated using the formula: CPT (°C) = (2.5 × %Cr) + (7.6 × %Mo) + (31.9 × %N) − 41.0. The highest temperature for testing is 85 °C. The corrosion rate is calculated using the following expression:
v = M 0 M 1 ρ · S · t × 87600
In the formula, v is the corrosion rate (mm/a), M0 is the mass of the sample before the experiment (g), M1 is the mass of the sample after rust removal (g), S is the exposed area of the sample (cm2), t is the exposure time of the sample (h), and ρ is the density of the sample (g/cm3), determined by the Archimedes drainage method.

2.5. Electrochemical Measurements

The electrochemical measurements were carried out using the CHI 660E electrochemical workstation (Chenhua, Shanghai, China), using a traditional three-electrode system consisting of the laser cladding as the working electrode, the saturated calomel electrode (SCE) as the reference electrode, and platinum as the counter electrode. In addition, all potentials were referenced to the SCE. The test solution was a borate buffer with a concentration of 0.6 M NaCl, consisting of 0.2 M H3BO3 and 0.05 M Na2B4O7·10H2O. The pH value of the solution was stable at 8.4. Prior to testing, the working electrodes underwent potentiostatic polarization at −1 VSCE for 10 min to eliminate air-formed oxides. To achieve a stable open-circuit potential (OCP), the samples were immersed in the test solution for 1 h before conducting polarization curves, electrochemical impedance spectroscopy (EIS), and Mott–Schottky experiments.
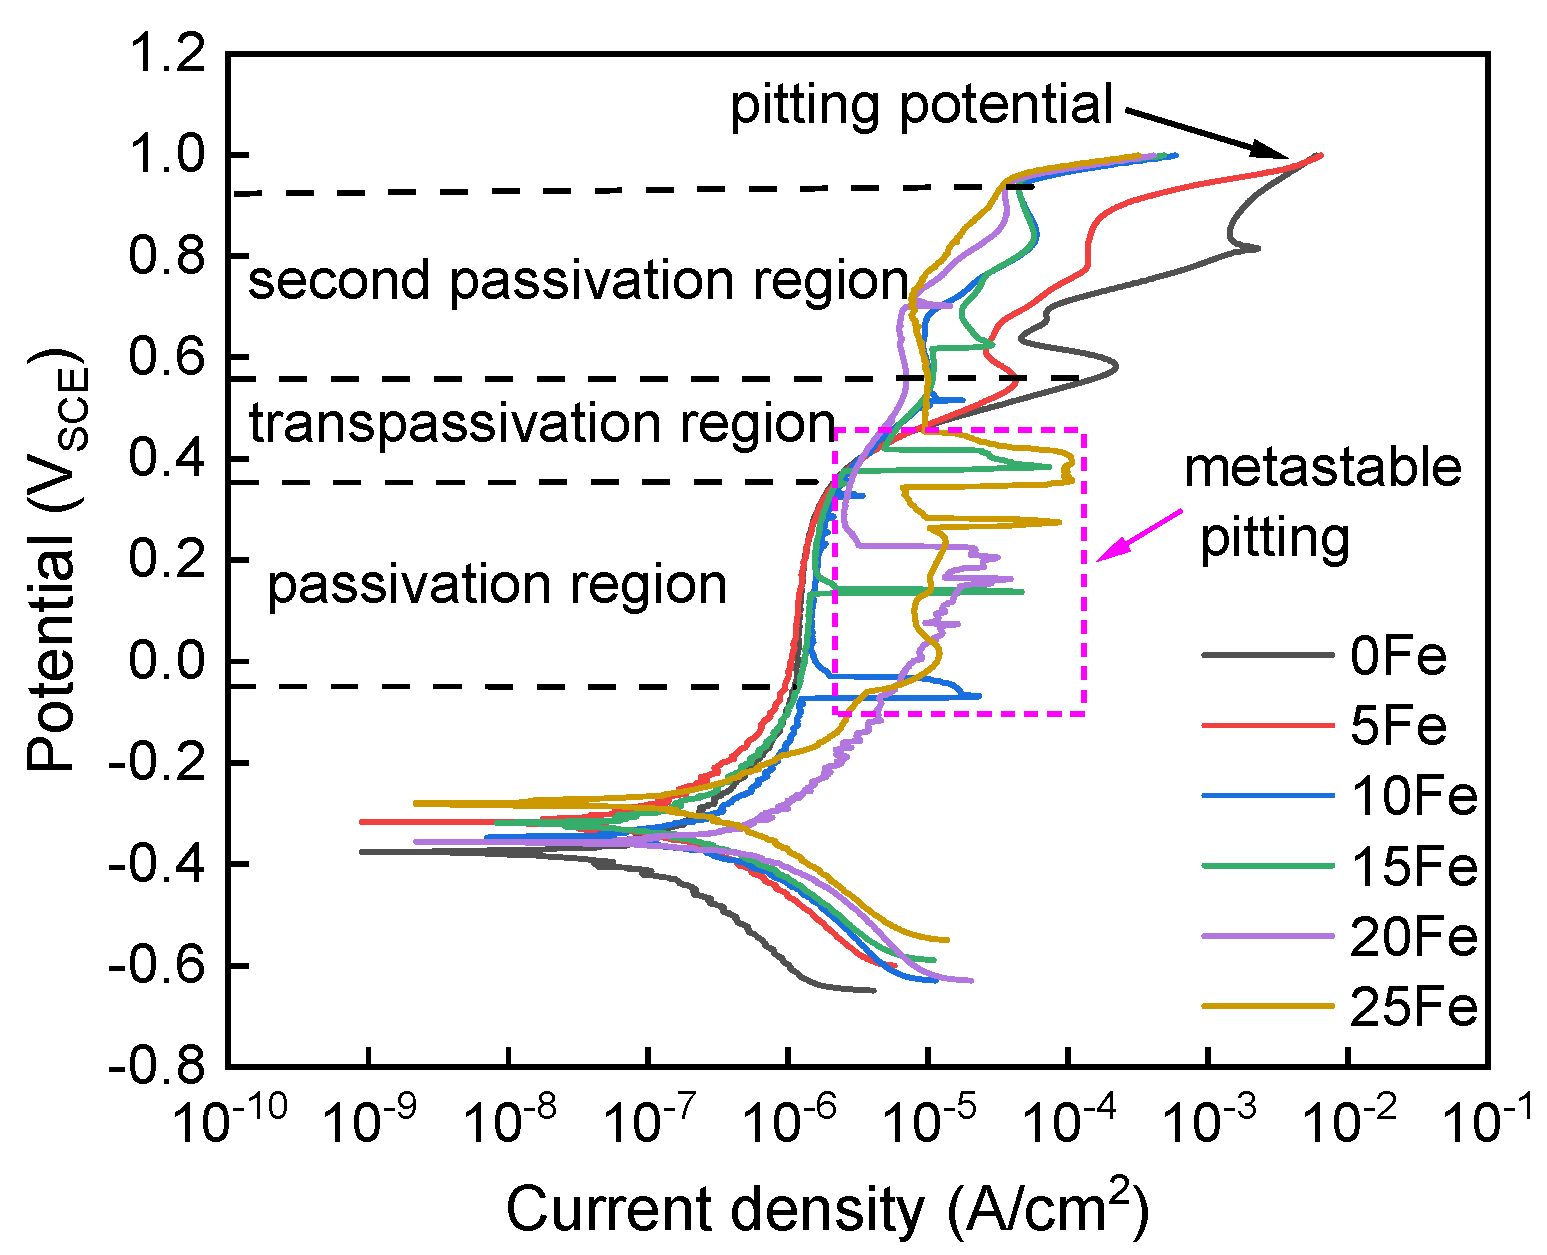
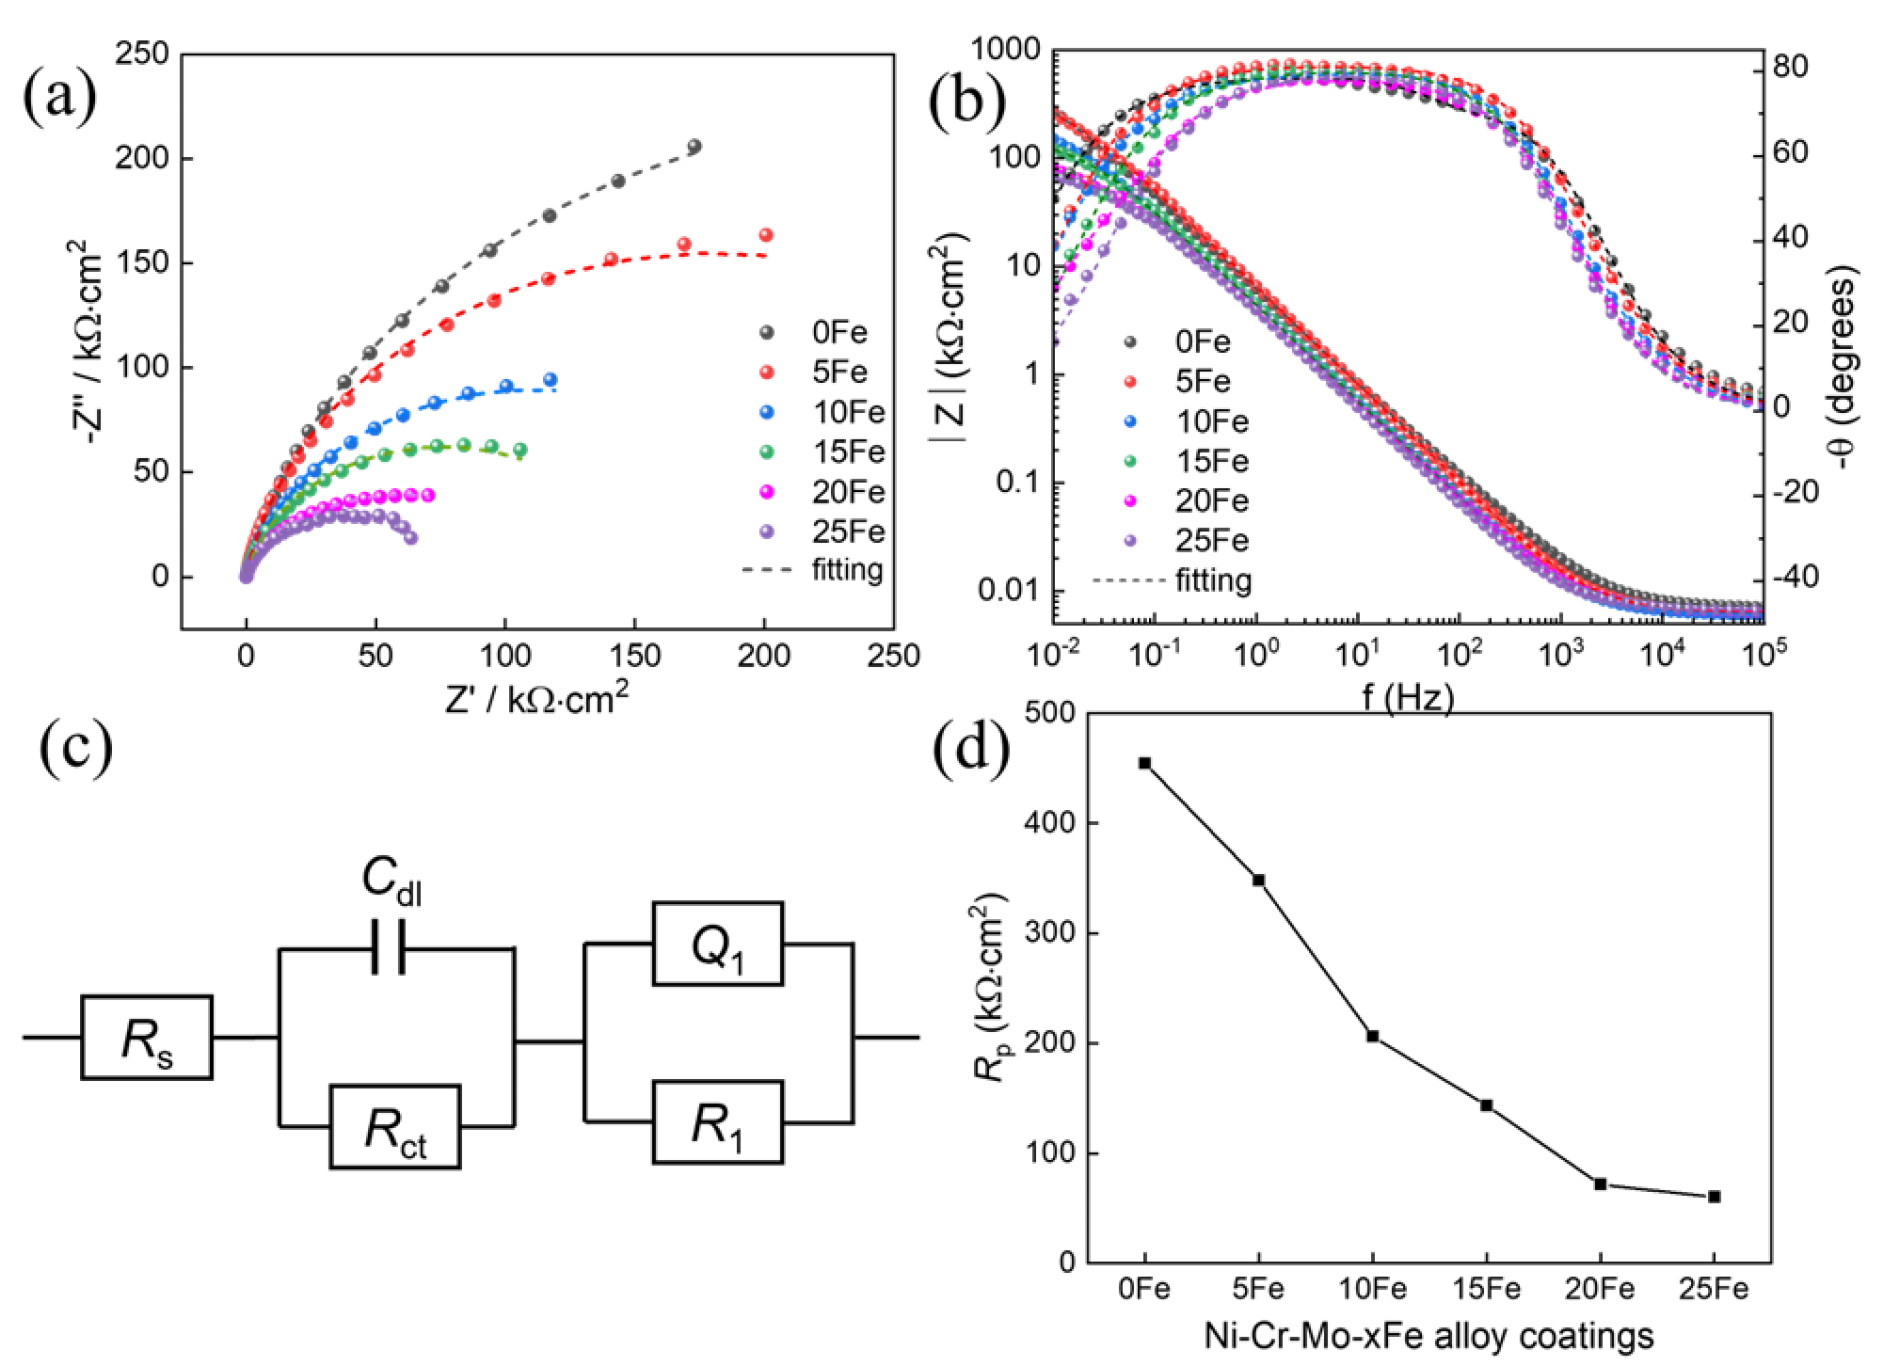
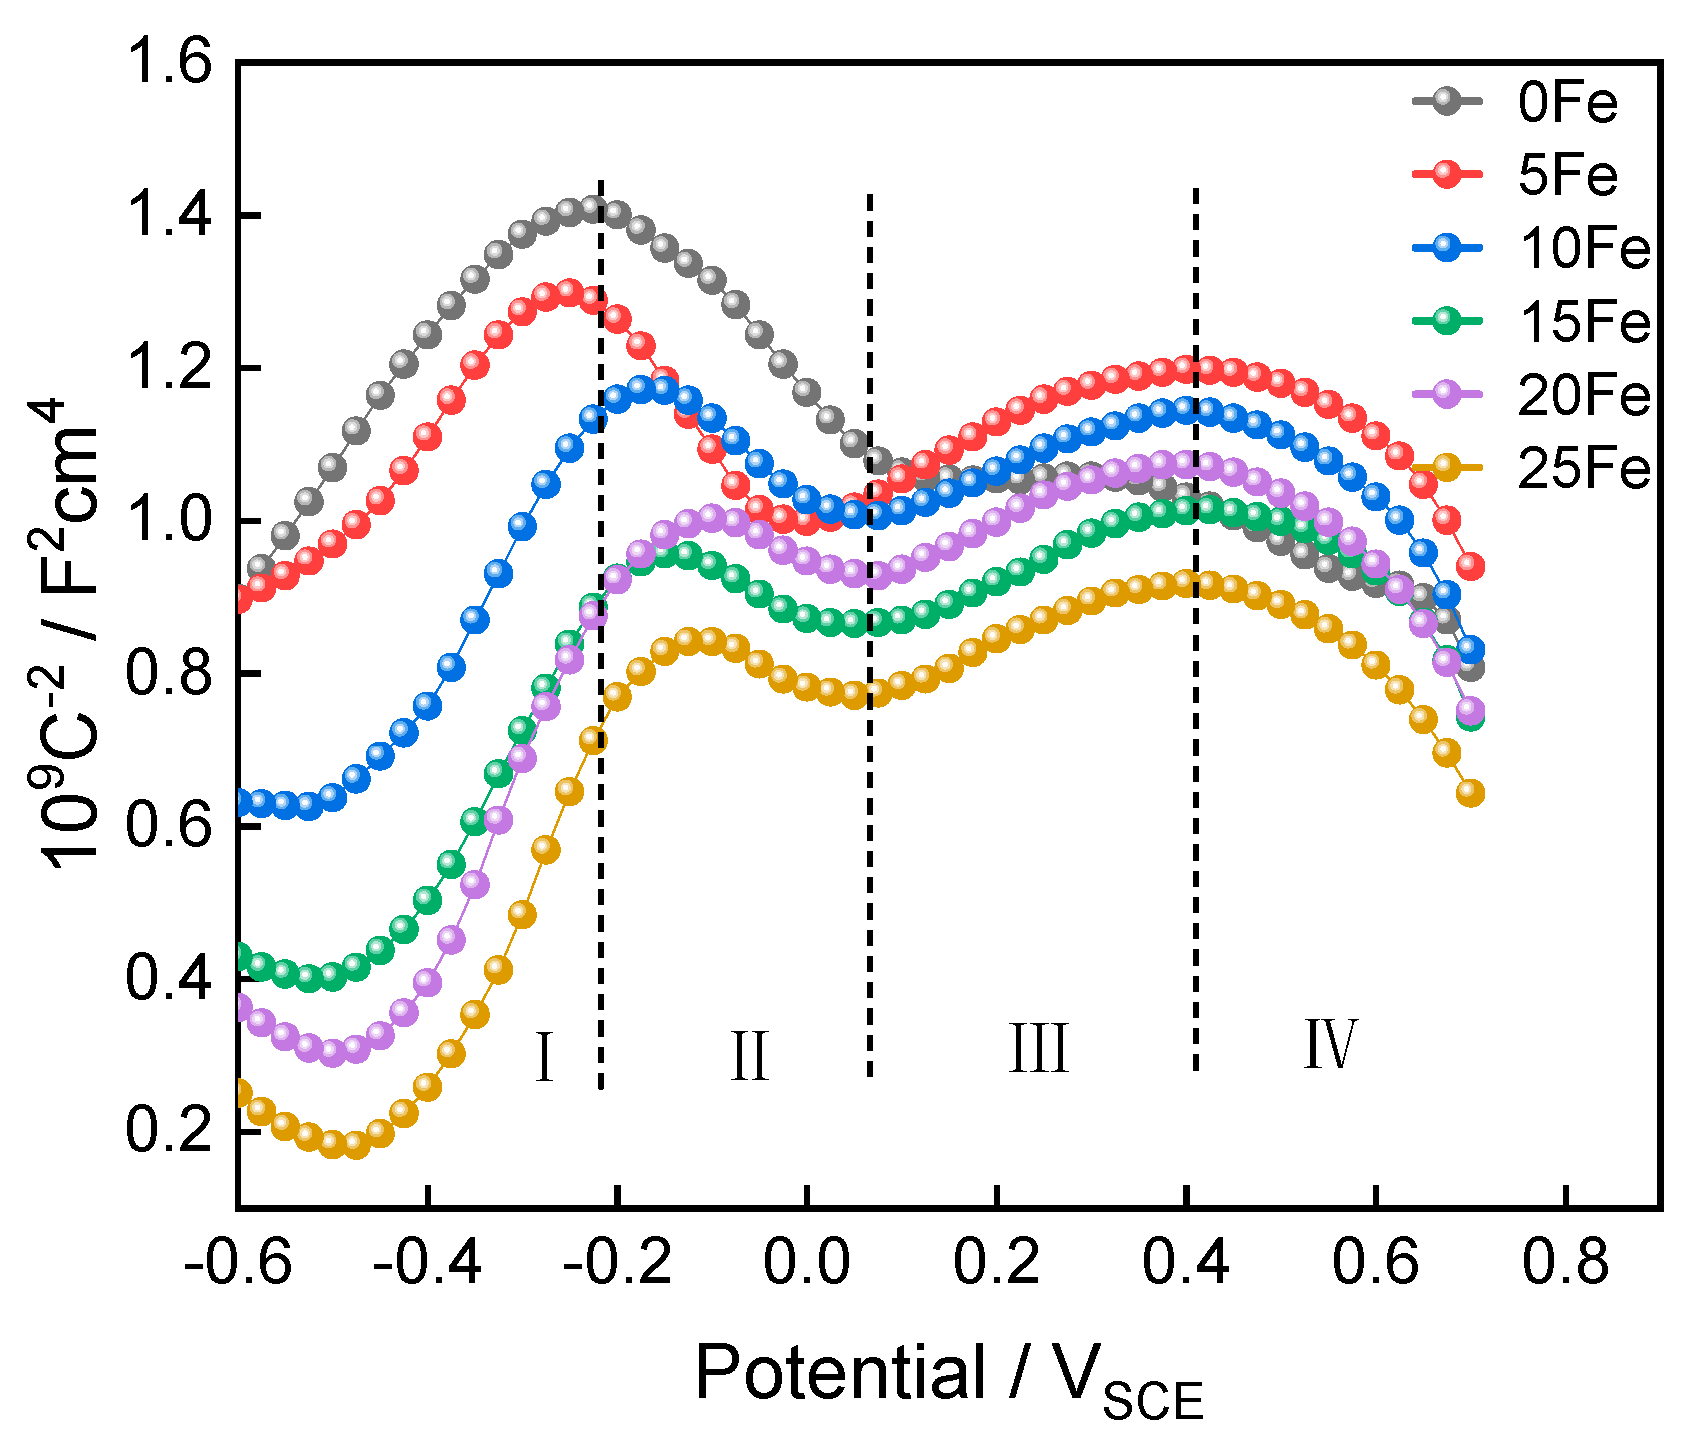
The potentiodynamic polarization curves were measured within a voltage range of −0.3 VSCE (vs. OCP) to +1 VSCE at a scan rate of 0.5 mV/s. The EIS measurements were carried out at a stable open-circuit potential with a sinusoidal voltage of ±10 mV, ranging from 105 Hz to 10−2 Hz in frequency. The EIS data were analyzed using the software Eisanalyser 1.0 and ZsimpWin 3.2. To investigate the properties of the passive films, Mott–Schottky experiments were conducted by measuring the potential from 0.7 VSCE to −0.6 VSCE with a sweep rate of 25 mV/s and an amplitude signal of 10 mV, at a frequency of 1000 Hz. All the measurements were conducted in the presence of air at ambient temperature (25 ± 2 °C). To ensure reproducibility, each experiment was repeated three times.

2.6. XPS Measurement

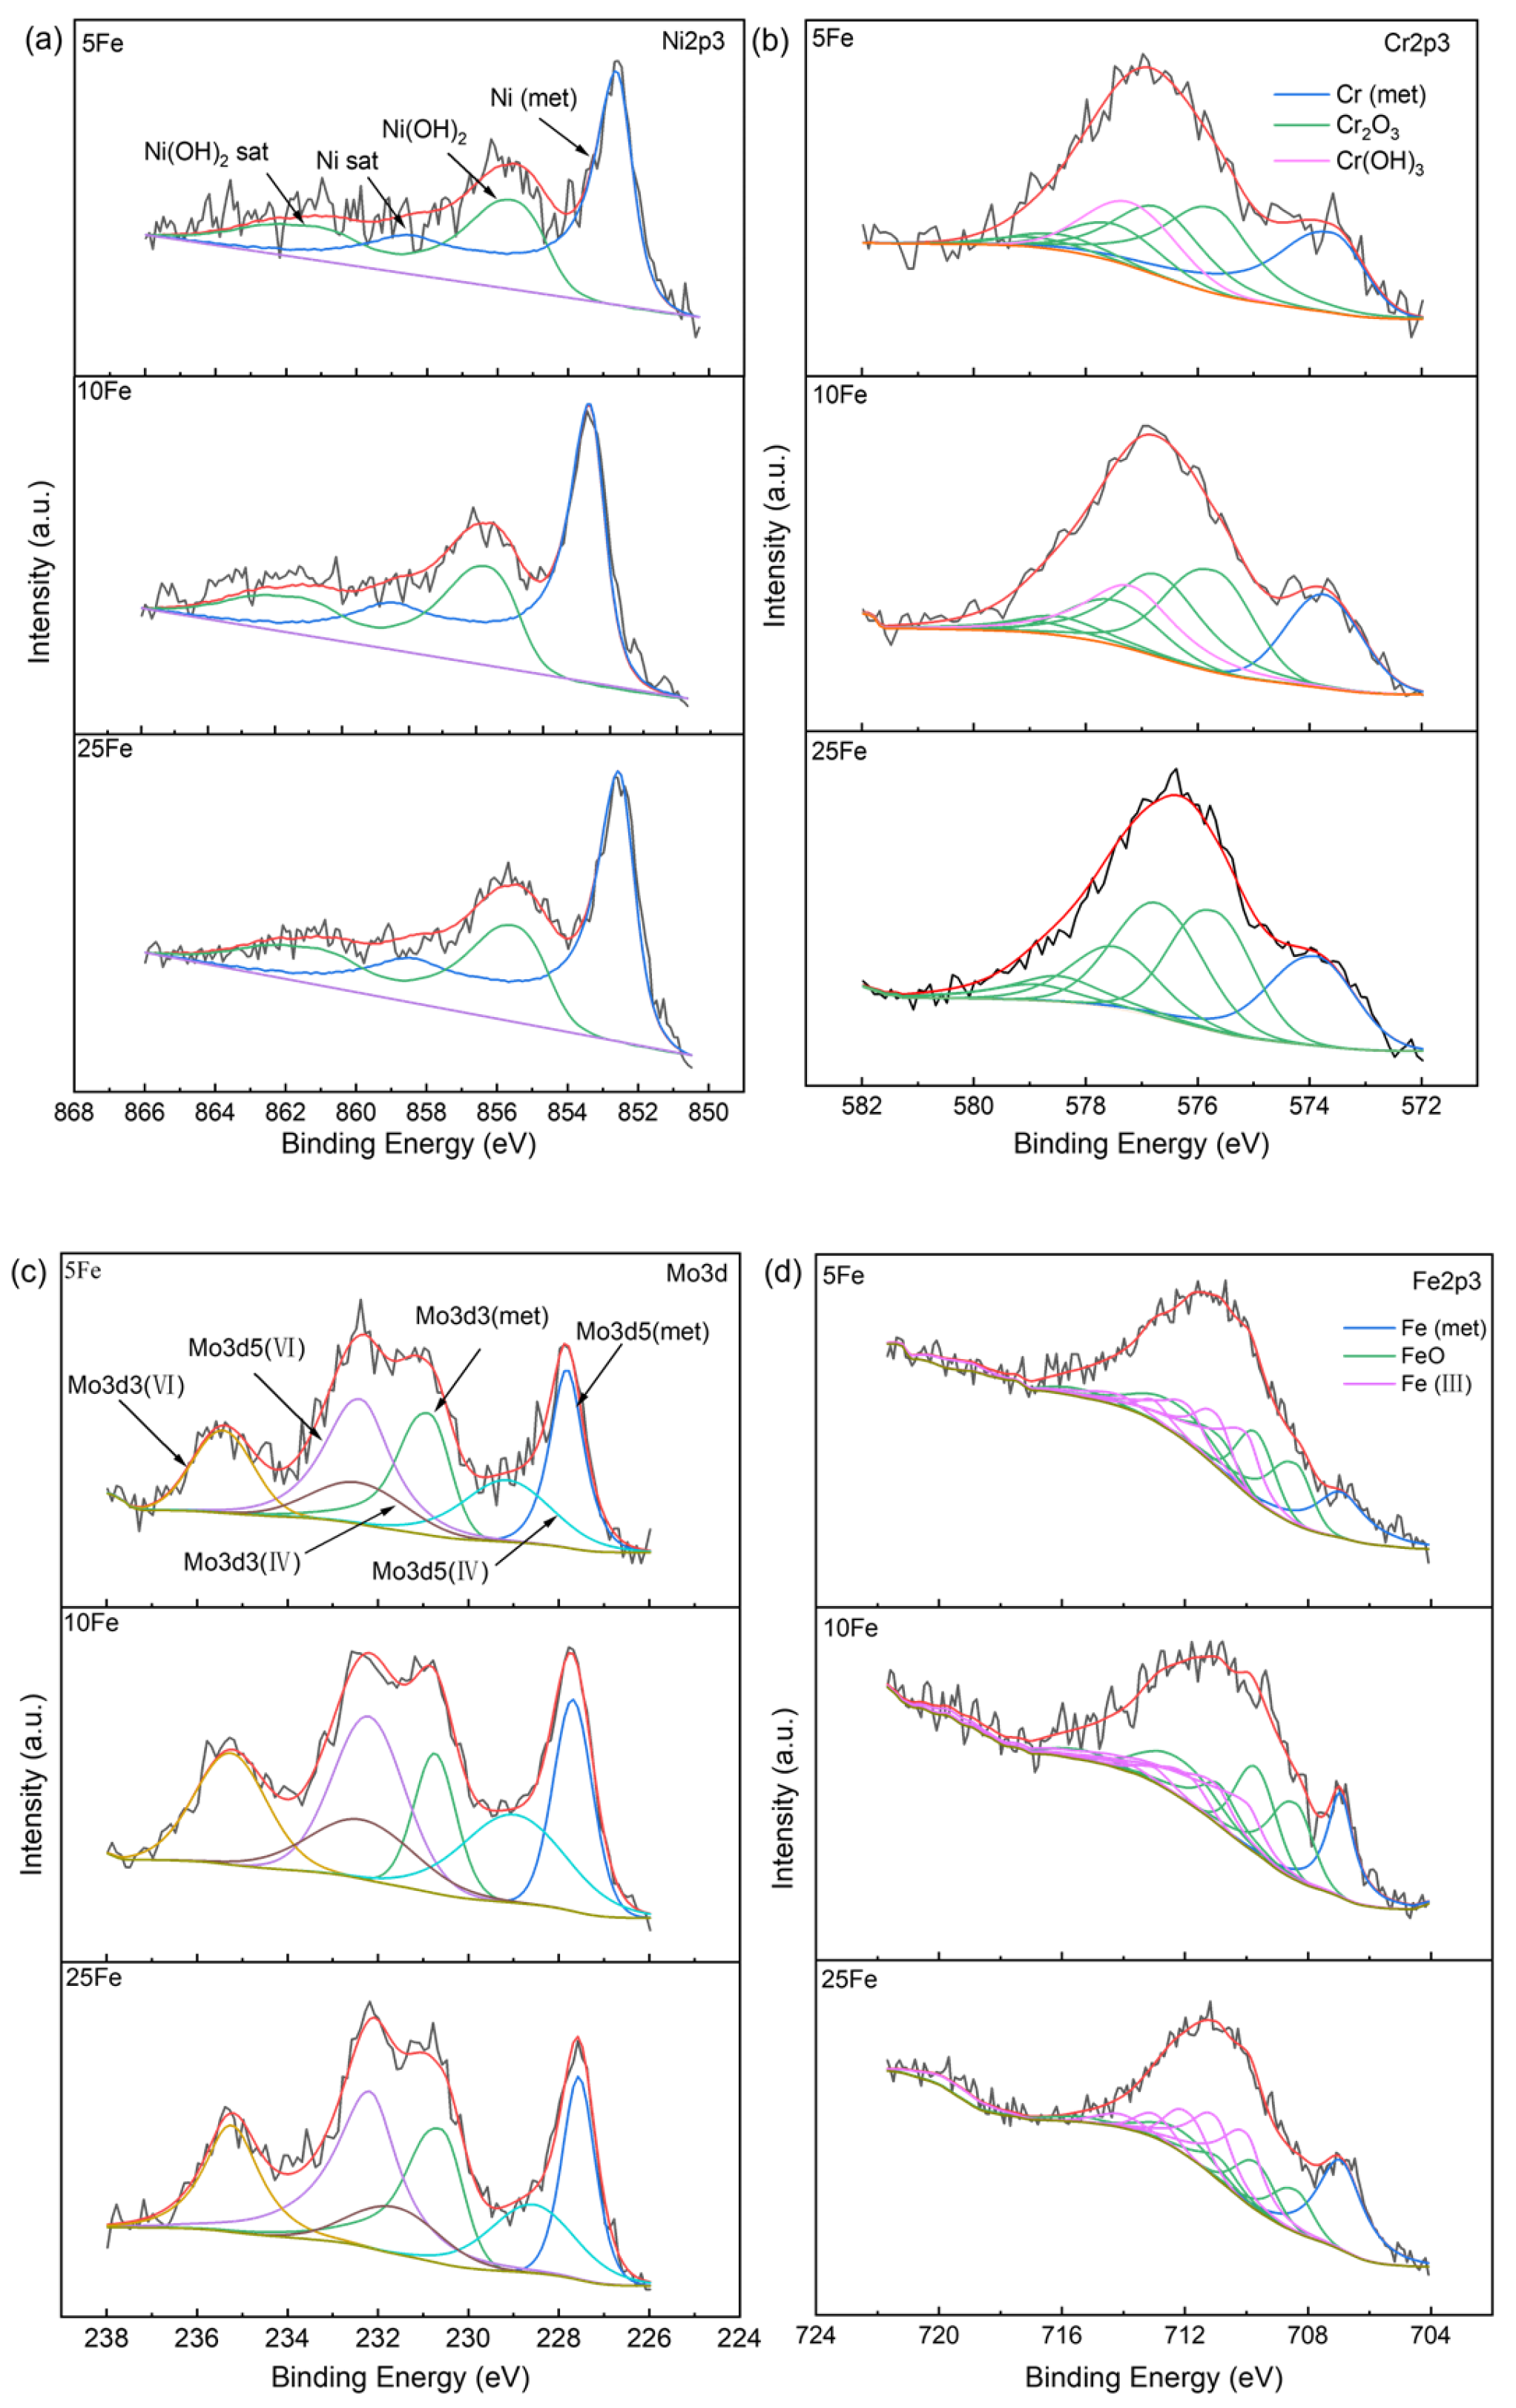
The passive film was formed in borate buffer solution (pH = 8.4) during potentiostatic polarization (0.2 VSCE) for 6 h. Its composition was measured by X-ray photoelectron spectroscopy (XPS) using a Thermo Scientific K-Alpha instrument (Waltham, MA, USA) with monochromatic Al Ka rays as excitation source, 400 μm beam spot, 12 kV operation, and 6 mA filament current. The X-ray photoelectron spectroscopy (XPS) peaks were corrected using standard peaks (C1s, 284.8 eV) and were analyzed utilizing Avantage V6.6 software.

3. Results

3.1. Phase and Microstructure Analysis of the Coatings

3.1.1. Phase Analysis

Figure 3 illustrates the XRD patterns of the coatings with varying Fe contents. In these XRD patterns, the black line represents the standard γ-Ni phase diffraction peaks (PDF No. 04-0850). Within the coatings with different iron contents, diffraction peaks corresponding to the face-centered cubic (FCC) γ-Ni crystal planes (111), (200), (220), and (211) are discernible. This observation suggests that the phase present in the Ni-Cr-Mo-xFe alloy coatings primarily consists of the FCC γ-Ni solid solution. Moreover, it is noteworthy that the diffraction peaks associated with the γ-Ni solid solution phase containing Cr, Mo, and other elements within the solid solution exhibit a noticeable leftward shift. This shift can be attributed to the process of forming the γ-Ni solid solution phase, wherein Cr, Mo, W, and Fe atoms substitute some of the Ni atoms in the Ni lattice. Notably, the atomic radii of Cr (128 pm), W (137 pm), Mo (139 pm), and Fe (126 pm) exceed that of Ni atoms (124 pm). According to the Bragg equation, 2dsinθ = nλ, it is well established that the introduction of larger-radius atoms (Cr, Mo, Fe) into the Ni lattice for solid solution formation results in lattice expansion and distortion. Consequently, this expansion leads to an increase in crystal plane spacing (d) and a reduction in the diffraction angle (θ), causing a shift of the diffraction peak towards lower angles.

3.1.2. Elemental Distribution and Microstructural Analysis

To analyze the effect of increased iron content on element diffusion in the coatings, the cross-section of the Ni-Cr-Mo-25Fe alloy coating with the highest iron content was selected for observation and analysis, and then the changes in the iron dilution rate in different coatings were analyzed. Figure 4a displays a cross-sectional view of the Ni-Cr-Mo-25Fe alloy coating with a single-layer thickness of roughly 700 μm. Areas of equal size were chosen from the top of the coating to the substrate for EDS analysis, as depicted in Figure 4b. The interface between the coating and the substrate comprises a transition zone, which exhibits a sharp decrease in iron and a gradual increase in alloy elements like Ni and Cr. There is mutual diffusion between the matrix elements and internal elements of the coating. The element content gradually becomes stable near the surface of the coating, and the distribution of the composition is relatively uniform. In the topmost layer, the average content of Ni, Cr, Mo, Fe, and W is 43 wt%, 19 wt%, 11 wt%, 25 wt%, and 2 wt%, respectively. This content is almost identical to the composition content found in the alloy powder. The variation in the iron dilution rate in Ni-Cr-Mo-xFe alloy coatings is illustrated in Figure 4c. In the bonding zone, the iron content sharply decreases and remains relatively stable at a distance of 300 μm from the substrate. The average iron content of the coating surface is <1 wt%, 5 wt%, 11 wt%, 16 wt%, 22 wt%, and 25 wt%, respectively. This result is indicative of a relatively uniform distribution of iron content at the top of the coating, and it is consistent with the iron content observed in the alloy powder.
Figure 5a–f depict the microstructure of the Ni-Cr-Mo-xFe alloy coating surface following erosion treatment. The diagrams reveal a consistent reticulated dendritic microstructure in all coatings, characterized by the gray-black regions and interdendritic gray-white regions. According to the XRD analysis, the surface of the coating exclusively exhibits the γ-Ni solid solution phase with a face-centered cubic structure, commonly referred to as the austenite phase. This observation suggests that both the gray-black regions and the gray-white regions are solid solution phases. The element content of each point is presented in Table 2. The results of EDS analysis revealed that when the iron content of the coating is in the range of 0~20 wt%, the Mo element content between dendrites is higher than that in the dendrite region. Notably, the segregation of Mo and Ni becomes more pronounced when the Fe content in the coating reaches 25 wt%, and conspicuous Fe segregation also occurs. In the interdendritic regions, the content of Mo, Ni, and Fe elements is 24 wt%, 31 wt%, and 20 wt%, respectively, in contrast to the dendritic region, where the corresponding content is 10 wt%, 42 wt%, and 25 wt%. There are significant differences between these two regions. It is worth noting that the Mo-rich white compound (Black arrows) was observed in the coatings, with a Mo content as high as 32 wt% (Table 2), and the compound was only distributed in the intergranular region. In addition, small micropore defects (Red arrows) were also observed on the surface of the coatings.
The elemental distribution characteristics of the gray-black regions and gray-white regions in Ni-Cr-Mo-25Fe alloy coatings are further analyzed using line scanning energy spectroscopy, as illustrated in Figure 5f. In the interdendritic gray-white regions, there is a significant increase in the Mo content, accompanied by decreases in the Ni and Fe elements. Solidification theory can provide an explanation for the variation in the distribution of elements between the two phases. During the initial stages of solidification, either ferrite or austenite may crystallize. Chromium is well known for stabilizing ferrite, whereas nickel serves as a stabilizer for austenite. Solidification takes place concurrently with the formation of the austenite phase in nickel-based alloys when the ratio of chromium equivalent (Creq) to nickel equivalent (Nieq) falls below 1.5 [35]. As a result, in the laser cladding process, non-equilibrium solidification commences with the growth of austenite dendrite. The liquid phase preferentially solidifies to form the dendrite, which is enriched in austenite-forming elements such as Ni. This dendritic is then pushed back into the liquid phase and subsequently solidifies in the spaces between the dendritic regions, leading to the formation of the interdendritic regions. Furthermore, the segregation of iron in the Ni-Cr-Mo-25Fe alloy coating is attributed to the influence of the Mo element. On one hand, Mo possesses a high melting point and a significant number of unpaired electrons. The presence of Mo leads to an increase in both vacancy formation energy and migration activation energy. Consequently, the combined effect of these factors results in an elevation of the diffusion activation energy for Fe, leading to a reduction in the diffusion rate of Fe. This, in turn, leads to a lower Fe content in the Mo-rich region [36]. Based on the analysis of phase composition, the phase created by the coating is a replacement solid solution of Ni. When a higher quantity of iron is present in the dendritic region, it signifies that more iron serves as a replacement solid solution within γ-Ni. Consequently, the segregation of Ni and Mo in the Ni-Cr-Mo-25Fe alloy coating intensifies as greater amounts of Mo are displaced and diffused, ultimately solidifying in the gaps.

3.2. Salt Fog Corrosion

Figure 6 and Figure 7 present, respectively, the macroscopic and microscopic morphology of the Ni-Cr-Mo-xFe alloy coatings after 42 days of exposure to a neutral salt fog environment. Upon macroscopic examination, reddish-brown rust spots are evident on the sample surfaces, indicating that the coating is more prone to pitting corrosion when the iron content in the coating is above 10 wt%. Figure 7a,b reveal that the surfaces of the Ni-Cr-Mo-0Fe and Ni-Cr-Mo-5Fe alloy coatings remain smooth, with no noticeable signs of corrosion. Furthermore, the surface of these two cladding layers can be seen in Figure 8a,b with a distinct Mo-rich region (Red arrows). Based on the EDS results (Table 3), the corrosion products surrounding the pits primarily consist of iron (Fe). Pits typically form due to localized damage to the passive film on the coating surface, resulting in corrosion spreading along the longitudinal direction of the damaged passive film. This process ultimately leads to the formation of stable pits. It is worth noting that the coatings display some degree of selective corrosion characteristics, with Ni-Cr-Mo-10Fe and Ni-Cr-Mo-25Fe alloy coatings exhibiting the most pronounced effects, as demonstrated in Figure 8. This selective corrosion can be attributed to the segregation of Mo between the dendritic regions and the interdendritic regions, leading to differing pitting corrosion resistances between these two regions. Pitting sensitivity [37] can be quantified using the pitting resistance coefficient (PREN), which is calculated as follows: PREN = wt% Cr + 3.3 wt% Mo + 16 wt% N. A higher PREN value signifies greater resistance to pitting corrosion. According to the PREN calculation formula, the Mo-rich interdendritic regions exhibit a higher PREN value, while the dendritic regions have a lower value. Consequently, corrosion dissolution predominantly occurs in the dendritic regions.
The EDS results (Table 3) indicate that the Mo-rich region (Spectrum 6) is uncorroded, possessing notable resistance to pitting corrosion, consistent with the PREN calculation results. Upon performing the SEM analysis of the prepared coating surface, there was no evidence of inclusions. It is crucial to emphasize that the analysis of pitting corrosion in this article does not account for situations caused by inclusions.

3.3. Ferric Chloride Immersion

To further assess the pitting corrosion resistance of Ni-Cr-Mo-xFe alloy coatings, these coatings were exposed to a solution consisting of ferric chloride (6 wt% FeCl3 + 0.05 mol/L HCl) at 85 °C for 72 h. The corrosion morphology and corrosion rate are depicted in Figure 9. Following the exposure of 72 h, intergranular corrosion became evident on the surface of the Ni-Cr-Mo-xFe alloy coating (Figure 9b), and corrosion pits emerged at the edges of the Ni-Cr-Mo-10Fe alloy coating. This corrosion extended longitudinally, and the interior had already experienced severe corrosion. With an increase in the iron content, both the extent and number of corrosion pits grew, leading to more severe internal corrosion of the coating. Consequently, the average corrosion rate of the coating (Figure 9a) gradually rose. When the iron content in the alloy coating reached 25 wt%, and the average corrosion rate spiked sharply, reaching 23.9 mm/a. This substantial increase in the corrosion rate significantly diminished the pitting corrosion resistance of the Ni-Cr-Mo-25Fe alloy coating. This decline can be attributed to the pronounced segregation of Mo, Ni, and Fe elements when the iron content reaches 25 wt%, resulting in a sharp reduction in the stability of the passive film and a significant decrease in its pitting resistance.

3.4. Electrochemical Behavior of the Coatings

3.4.1. Potentiodynamic Polarization

Figure 10 displays the potentiodynamic polarization curves of Ni-Cr-Mo-xFe alloy coatings in the borate buffer solution with 0.6 M NaCl. The electrochemical parameters obtained from the polarization curves, including corrosion potential (Ecorr), passivation potential (Ep), passivation current density (ip), and transpassivation potential (Etr), are presented in Table 4. Analyzing the characteristics of the obtained potentiodynamic polarization curves of the coatings, it becomes evident that when the iron content ranges from 0 to 15 wt%, the passivation current density of the coating does not exhibit significant differences, and the passivation range remains relatively consistent at approximately 400 mV. In this range, the coating does not display a transition from activation to passivation; instead, its anodic polarization curve directly enters the passivation zone. It is important to note that both the Ni-Cr-Mo-10Fe and Ni-Cr-Mo-15Fe alloy coatings exhibit metastable pitting corrosion, leading to fluctuations in the dimensional passivation current density. Red-brown rust was observed on the surface of the coatings during the process of testing. Furthermore, the Ni-Cr-Mo-15Fe alloy coating demonstrates a higher frequency of fluctuation in dimensional passivation current density, indicating an increased susceptibility to pitting corrosion. As the electrode potential rises to 362 mVSCE, there is a gradual increase in current density, and the curve enters the over-passivation zone. This corresponds to the oxidation dissolution of Cr (III), signifying that the dissolution rate of the passive film exceeds its formation rate. The current density peaks at approximately 565 mVSCE and then declines, entering the secondary passivation region. However, when the iron content ranges from 20 to 25 wt%, the current density of the coating increases with the increase in anode potential, and the dissolution rate of the passive film surpasses its generation rate. At this point, the current density of the coating becomes unstable with increased fluctuation amplitude. This suggests that with the increasing iron content, iron within the passive film becomes more susceptible to dissolution, leading to a decreased stability of the passive film.
In the high-potential region, the coating displays secondary passivation characteristics, primarily due to the role of molybdenum in stabilizing the passive film after local damage. During the pitting process, the surface-enriched molybdenum is readily dissolved and combined with oxygen to form MoO42− [38]. These molecules adsorb at the activation site of the passive film dissolution and generate MoO2 [39]. This process inhibits the adsorption of Cl, reduces the dissolution rate of the film, and promotes the formation of chromium hydroxide or oxide, thereby creating a dense passive film and enhancing pitting resistance [40,41,42]. As the iron content increases, there is a notable decrease in the passivation current density of the coating at the secondary passivation region. Furthermore, Ni-Cr-Mo-10Fe, Ni-Cr-Mo-15Fe, and Ni-Cr-Mo-20Fe alloy coatings exhibit a passivation plateau at a higher potential range (860–940 mVSCE), with the passivation current density decreasing as iron content increases. This suggests that in alkaline environments, the dissolution of iron on the passive film can promote Mo repassivation [43]. Additionally, the deposition of iron oxides or hydroxides on the surface can inhibit Cl adsorption, further reducing the current density and the dissolution rate of the passive film.

3.4.2. Corrosion Morphology Observation

Figure 11 illustrates the corrosion morphology of Ni-Cr-Mo-xFe alloy coatings after potentiodynamic polarization. Selective corrosion dissolution was observed on the surfaces of both Ni-Cr-Mo-0Fe and Ni-Cr-Mo-5Fe alloy coatings. Upon closer examination of the Ni-Cr-Mo-5Fe alloy coating surface (Figure 11b), it became apparent that selective corrosion dissolution predominantly occurs at the interface between the dendritic regions and interdendritic regions. The dendritic regions gradually corrode and dissolve, with an iron content ranging from 10 to 25 wt%, resulting in the development of pitting and selective corrosion on the surface of the coating. EDS analysis (Table 5) reveals that the Mo-rich interdendritic (spectrum 1) remains on the surface but is not entirely corroded, indicating that the dendritic regions are preferentially dissolved by corrosion. This observation suggests that the dendritic has weaker pitting resistance compared to the interdendritic, which aligns with the results obtained from salt fog corrosion analysis. Selective corrosion dissolution is evident within the pits of the Ni-Cr-Mo-15Fe alloy coating, resulting in a honeycomb-like corrosion morphology (Figure 11(d2)). Corrosion products accumulate within these pits (Figure 11(d3)). Notably, the primary corrosion products deposited in the pits of Ni-Cr-Mo-25Fe alloy coatings are iron corrosion products (Spectrum 4). This finding implies that the deposition of iron corrosion products within the pits can effectively inhibit the expansion of corrosion.

3.4.3. Electrochemical Impedance Spectra

Figure 12 presents the EIS impedance spectrum of the coating in the borate buffer solution with 0.6 M NaCl. The EIS data were validated through Kramers Kronig transformation using Eisanalyser software, meeting the constraints of linear system theory [44]. In the Nyquist diagram (Figure 11a), the Ni-Cr-Mo-xFe alloy coatings display semi-circular arcs with comparable shapes. As the iron content increases, the radius of the capacitive arc in the impedance spectrum decreases, indicating the promotion of charge transfer in the double layer. However, the low-frequency phase angle value decreases with the increasing iron content, signifying a gradual reduction in the stability of the passive film. Additionally, as the iron content rises, the impedance value of the coating progressively diminishes. Notably, the impedance values of both Ni-Cr-Mo-0Fe and Ni-Cr-Mo-5Fe alloy coatings are relatively high, and these two values overlap, indicating excellent corrosion resistance. Conversely, the Ni-Cr-Mo-25Fe alloy coating exhibits the lowest impedance value and the poorest corrosion resistance, a trend consistent with the results obtained from the dynamic potential polarization curve analysis.
Figure 12c presents an equivalent circuit diagram used for fitting the impedance spectrum, which is employed to describe the characteristics of the passive film on the coating surface. Table 6 lists the relevant fitting parameters. It is noteworthy that the fitting parameters exhibit relatively low errors, and the chi-square values of the results are also low, underscoring the reliability of the fitting outcomes. Within the equivalent circuit model, several key components are defined: Rs signifies the solution resistance, Cdl denotes the double-layer capacitance, while Rct represents the charge transfer resistance. The low-medium frequencies (Q1, R1) time constant is related to the redox processes taking place on the surface of the passive film. Q1 represents the phase angle component of the passive film capacitor; n1 is the exponent associated with the phase angle element Q1. This resistance (R1) is linked to the growth of the structure of the passive film [45]. As indicated by the fitting results in the table, with an increase in the iron content within the coating, R1 decreases. This decrease suggests that the outer structure of the passive film becomes less compact, resulting in reduced stability of the passive film. The preferential dissolution of Fe leads to the creation of cation vacancies, thereby increasing the concentration of point defects at the interface between the outer layer of the passive film and the solution. This in turn accelerates the electrochemical reaction process at the interface.
Polarization resistance Rp (Rp = R1 + Rct) is typically used to describe the corrosion resistance of coatings [46]. Higher Rp values indicate a more stable passive film formed on the surface of the samples, lower corrosion rates, and enhanced corrosion resistance of the coating. As depicted in Figure 11d, the Ni-Cr-Mo-0Fe alloy coating demonstrates the highest polarization resistance in borate buffer solution with 0.6 M NaCl. This finding highlights that the Ni-Cr-Mo-0Fe alloy coating boasts the most outstanding corrosion resistance among the examined samples.

3.4.4. Mott–Schottky Analysis

The Mott–Schottky curves can be used to analyze the semiconductor characteristics of the passive film on the surface of Ni-Cr-Mo-xFe alloy coatings, and the equation related to space charge capacitance and potential is shown as follows [47]:
1 C 2 = 2 e · N D · ε · ε 0 E E F B k T e
1 C 2 = 2 e · N A · ε · ε 0 E E F B k T e
where C denotes the space charge layer capacitance of the passive film. ND and NA, respectively, refer to the donor density and the acceptor density, e represents the absolute value of the electron charge (1.602 × 10⁻¹⁹ C), E stands for the applied potential, and ε signifies the dielectric constant of the semiconductor, with the relative dielectric constant of the oxide film on the surface of a nickel-based alloy assumed to be 20 [48]. ε 0 represents the vacuum permittivity of free space (8.854 × 10⁻¹⁴ F/cm), k is the Boltzmann constant (1.389 × 10⁻²³ J/K), T denotes the absolute temperature, EFB is the flat band potential. To visualize the linear segment of the M-S curve, we utilize the relationship between 1/C2 and potential (E). A positive slope represents an n-type semiconductor, and a negative slope signifies a p-type semiconductor. Furthermore, the intercept at 1/C2 to 0 VSCE on the potential axis represents a flat band potential.
Figure 13 presents the Mott–Schottky curves for Ni-Cr-Mo-xFe alloy coatings in a 0.6 M NaCl borate buffer solution. As observed in Figure 13, the curve can be divided into four distinct regions based on the slope. Regions I and III exhibit positive slopes, indicative of n-type semiconductor characteristics within the passive film. Conversely, regions II and IV display negative slopes, signifying p-type semiconductor characteristics of the passive film. The overall shape of the coating curve is similar across the samples, with slight variations observed in the Ni-Cr-Mo-0Fe alloy coating. Notably, region III does not demonstrate n-type semiconductor characteristics; instead, it represents a transition zone situated between two negative slope bands (region II and region IV). This observation suggests that the oxidation and dissolution of Cr2O3 primarily occur within the passive film, and the type of point defects remains unchanged throughout the dissolution process [49]. The donor concentration (ND) and receptor concentration (NA), calculated through linear fitting based on Formulas (1) and (2), are provided in Table 7.
In accordance with the PDM-II model [27], the semiconductor characteristics presented by the passive film are related to the defects within the passive film. In region I, the passive film forms on the surface of the coating, with cations diffusing through interstitial atoms, giving rise to passive films displaying n-type semiconductor behavior, such as Fe2O3 and FeOOH [29,50]. In region II, the passive film exhibits p-type semiconductor behavior, which can be attributed to the capacitive characteristics of the defective Cr2O3 barrier layer [51]. This behavior mainly arises from cation vacancies within the barrier layer [52]. With an increase in iron content within the coating, carrier density and cation vacancy defects rise, ultimately diminishing the stability of the coating passive film. In region III, the passive film exhibits n-type semiconductor behavior, with oxygen vacancies being the primary defect. The iron content in the coating falls within a range of 10–25 wt%, and the donor concentration of the passive film is relatively high (Table 7). Consequently, this leads to a decrease in the stability of the passive film [27].
The potential range corresponding to region IV corresponds to the secondary passivation stage of the coating (Figure 10). Thus, the slope observed in region IV reflects the semiconductor characteristics of the secondary passive film. In this stage, the secondary passive film exhibits p-type semiconductor characteristics. During the secondary passivation period, Mo dissolves to form soluble MoO42−, which adsorbs at the activation sites of the passive film. This phenomenon reduces the dissolution rate of the passive film and promotes the generation of Cr2O3 within the passive film. The primary defects within the barrier layer shift from oxygen vacancies or metal gaps to cation vacancies. Notably, the carrier density of the Ni-Cr-Mo-xFe alloy coatings within the secondary passivation zone is relatively low, indicating that the secondary passivation reduces the density of point defects and enhances the stability of the passive film.

3.4.5. Passive Film Analysis

The corrosion resistance of a coating largely relies on the formation of the passive film on its surface. In this study, we conducted an in-depth investigation into the elemental composition of a passive film using XPS. The three coatings were maintained at a constant potential of 0.2 V in borate buffer solution with 0.6 M NaCl for 6 h before undergoing XPS analysis. The XPS peaks corresponding to Ni2p3, Cr2p3, Fe2p3, and Mo3d in the passive film are shown in Figure 14. Ni2p3 was deconvolved using the nonlinear least squares method; Cr2p3 and Fe2p3 were deconvolved using the multi-splitting method according to the literature [53], and Mo3d was deconvolved using G-L peak splitting. Except for Ni2p3, which was subtracted using the linear method, all others were subtracted using the smart method. The peak fitting parameters are detailed in Table 8. The percentage atomic content of different cationic forms in the passive film is shown in Figure 14. It is evident that the Cr, Mo, and Fe content on the surface of the passive film exceeds that of the coating substrate, indicating an enrichment in these three elements on the surface of the passive film.
Figure 14a shows the high-resolution Ni2p3 spectrum, which was deconvoluted using the standard spectra of Ni (met), NiO, and Ni(OH)2. The results indicate an absence of NiO peaks in the spectrum, indicating that the morphology of the Ni element in the passive film is primarily metallic Ni and Ni(OH)2, devoid of NiO. This observation may be linked to the lower oxidation degree of Ni when compared to Fe and Cr [54]. Figure 14b shows a high-resolution Cr2p3 spectrum, revealing that the passive film contains metallic Cr, Cr2O3, and Cr(OH)3. However, when the iron content in the coating reaches 25 wt%, there is an absence of Cr(OH)3 peaks in the Cr2p3 spectrum. This suggests that the passive film on the surface of the Ni-Cr-Mo-25Fe alloy coating either lacks Cr(OH)3 or contains an extremely low content. From Figure 14, it becomes apparent that the Cr content in the passive film of the Ni-Cr-Mo-25Fe alloy coating did not significantly decrease. This indicates that, as the iron content increased, iron became enriched in the outer layer of the passive film, inhibiting the formation of Cr(OH)3 in the outer layer. The high-resolution Fe2p3 spectrum is presented in Figure 14c. Iron exhibits multiple valence states and compounds, including FeO, Fe2O3, Fe3O4, and FeOOH. The similar binding energies of iron oxides and hydroxides [55] make it challenging to deconvolute them separately. In this study, spectral peaks of Fe (met), FeO, and Fe (III) (average of Fe2O3 and FeOOH) were obtained using a multiple-splitting peak method. An increase in the proportion of Fe (III) content (Figure 14) leads to the formation of more oxygen vacancies within the passive film to maintain charge balance, resulting in a decrease in the stability of the passive film [56].
In Figure 14d, the passive film exhibits a high-resolution Mo3d spectrum with dual-splitting characteristics and a bimodal distribution. This spectrum mainly consists of metallic Mo, Mo (IV), and Mo (VI), with Mo (VI) having the highest content (Figure 15). This indicates that Mo (VI) represents the primary oxidation state of Mo and exists in the form of MoO42− [46]. The passive film of the Ni-Cr-Mo alloy coating comprises an inner layer rich in Cr/Ni and an outer layer rich in Mo [57]. Figure 14 demonstrates that the content of Fe and Mo in the passive film surpasses that of the alloying elements, suggesting an enrichment in Fe and Mo in the outer layer. The decrease in the Mo/Fe ratio results in a reduction in Mo-rich content, an increase in defect concentration, and a decrease in the stability of the passive film.

4. Discussion

In this study, Ni-Cr-Mo-xFe alloy coatings were prepared using laser cladding technology, and the phase composition and microstructure were comprehensively analyzed. Multiple testing techniques were utilized to examine and compare the corrosion behavior of Ni-Cr-Mo-xFe alloy coatings, along with the electrochemical performance and composition of passive films. The research revealed that selective corrosion dissolution occurs within the Ni-Cr-Mo-xFe alloy coating. Pitting is observed when the iron content in the coating exceeds 10 wt%, leading to a distinctive metastable pitting feature on the potentiodynamic polarization curve. Drawing upon the experimental findings and relevant literature, this study delves into the pitting behavior of Ni-Cr-Mo-xFe alloy coatings and explores the influence of Fe content on the passive film.

4.1. Pitting Mechanism of the Ni-Cr-Mo-xFe Alloy Coatings

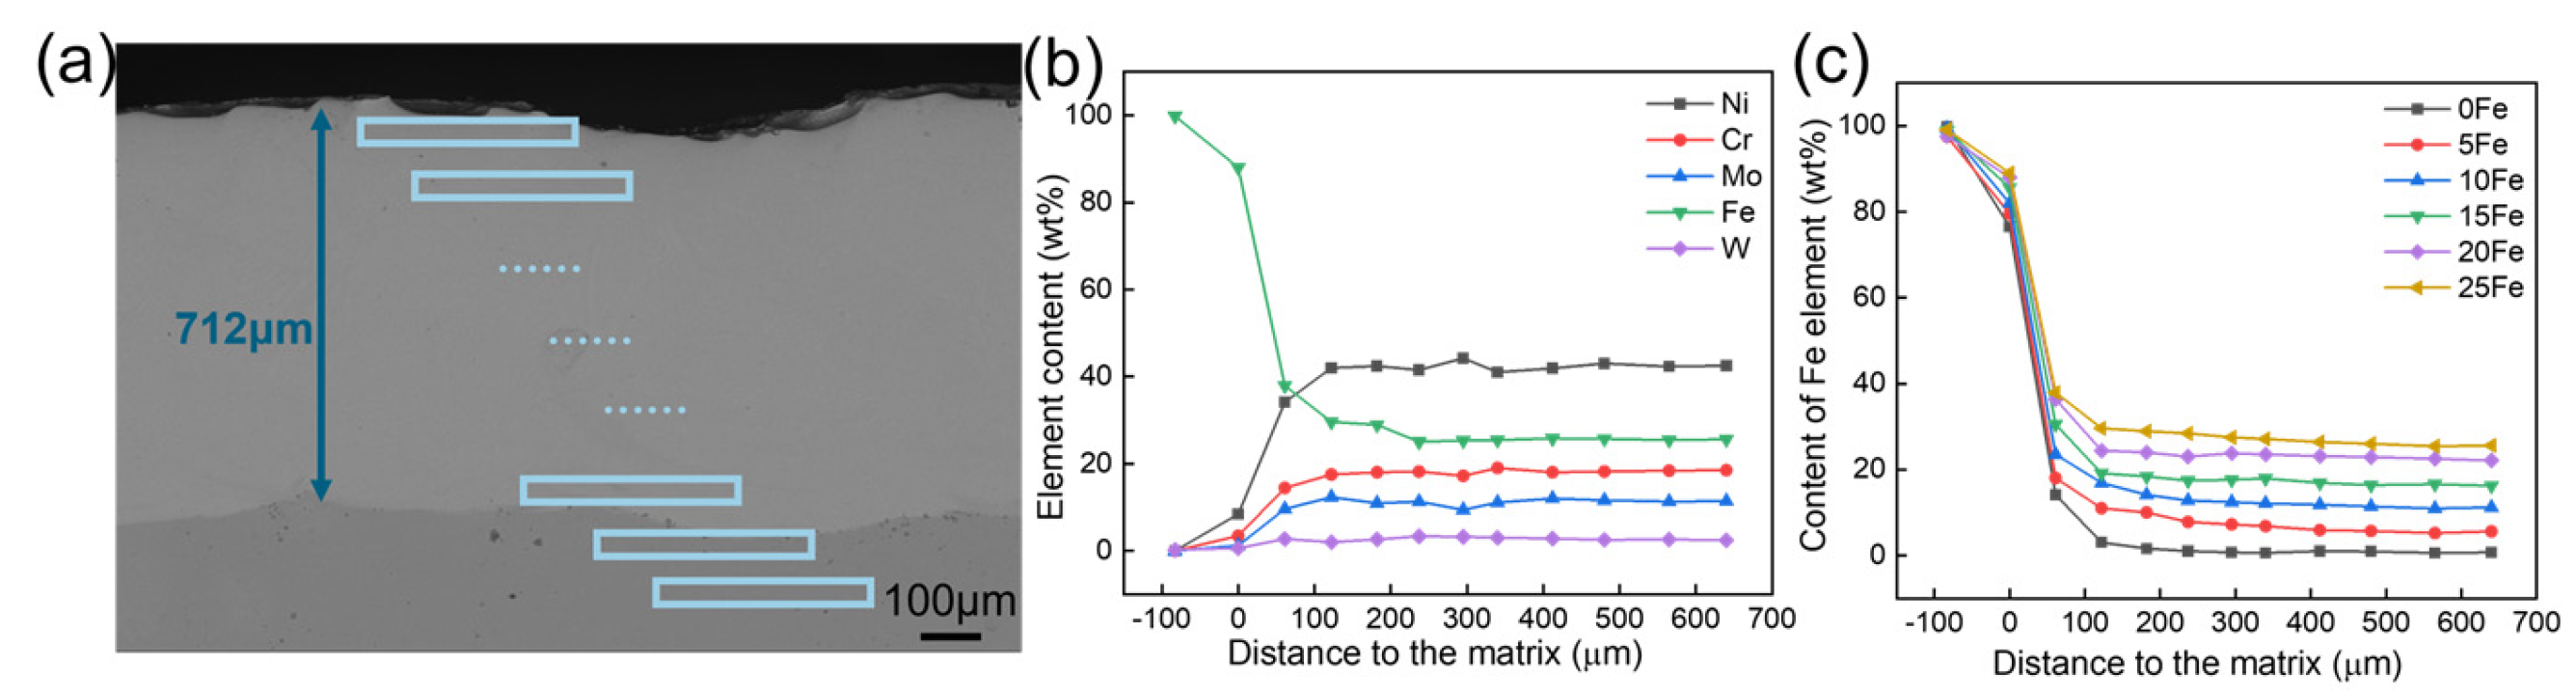
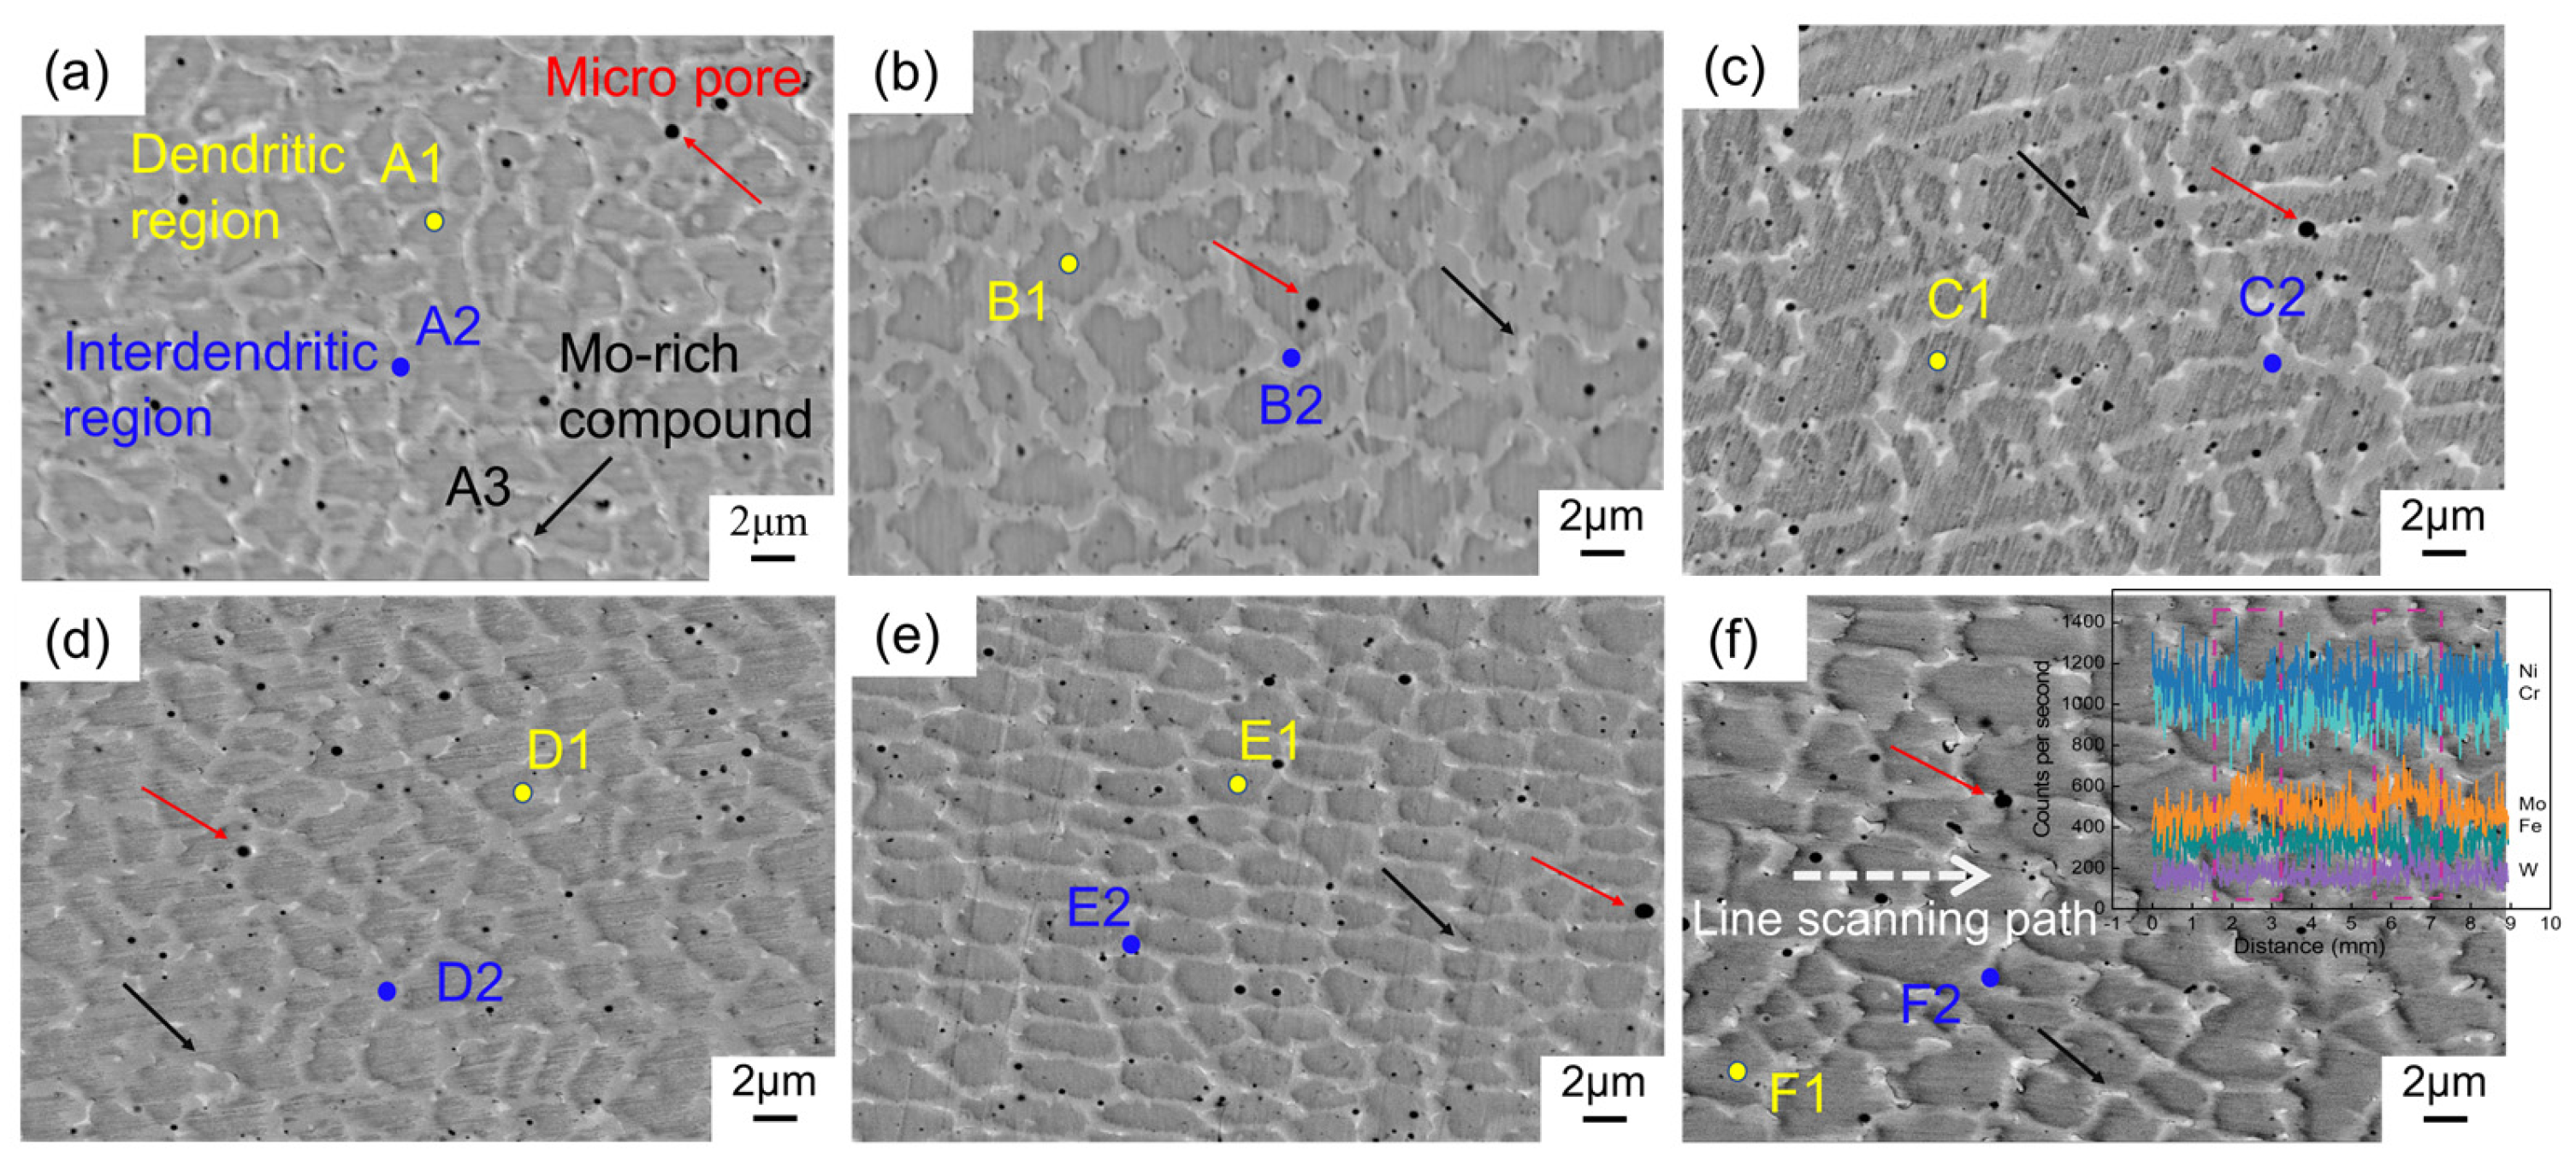
The element distribution of the Ni-Cr-Mo-xFe alloy coating is uniform, and the area of local accumulation of iron content and inclusion is not observed by SEM. The analysis and discussion herein do not consider the preparation problems and corrosion behavior caused by inclusions. Both the experiments conducted with neutral salt fog (Figure 8) and iron trichloride solution (
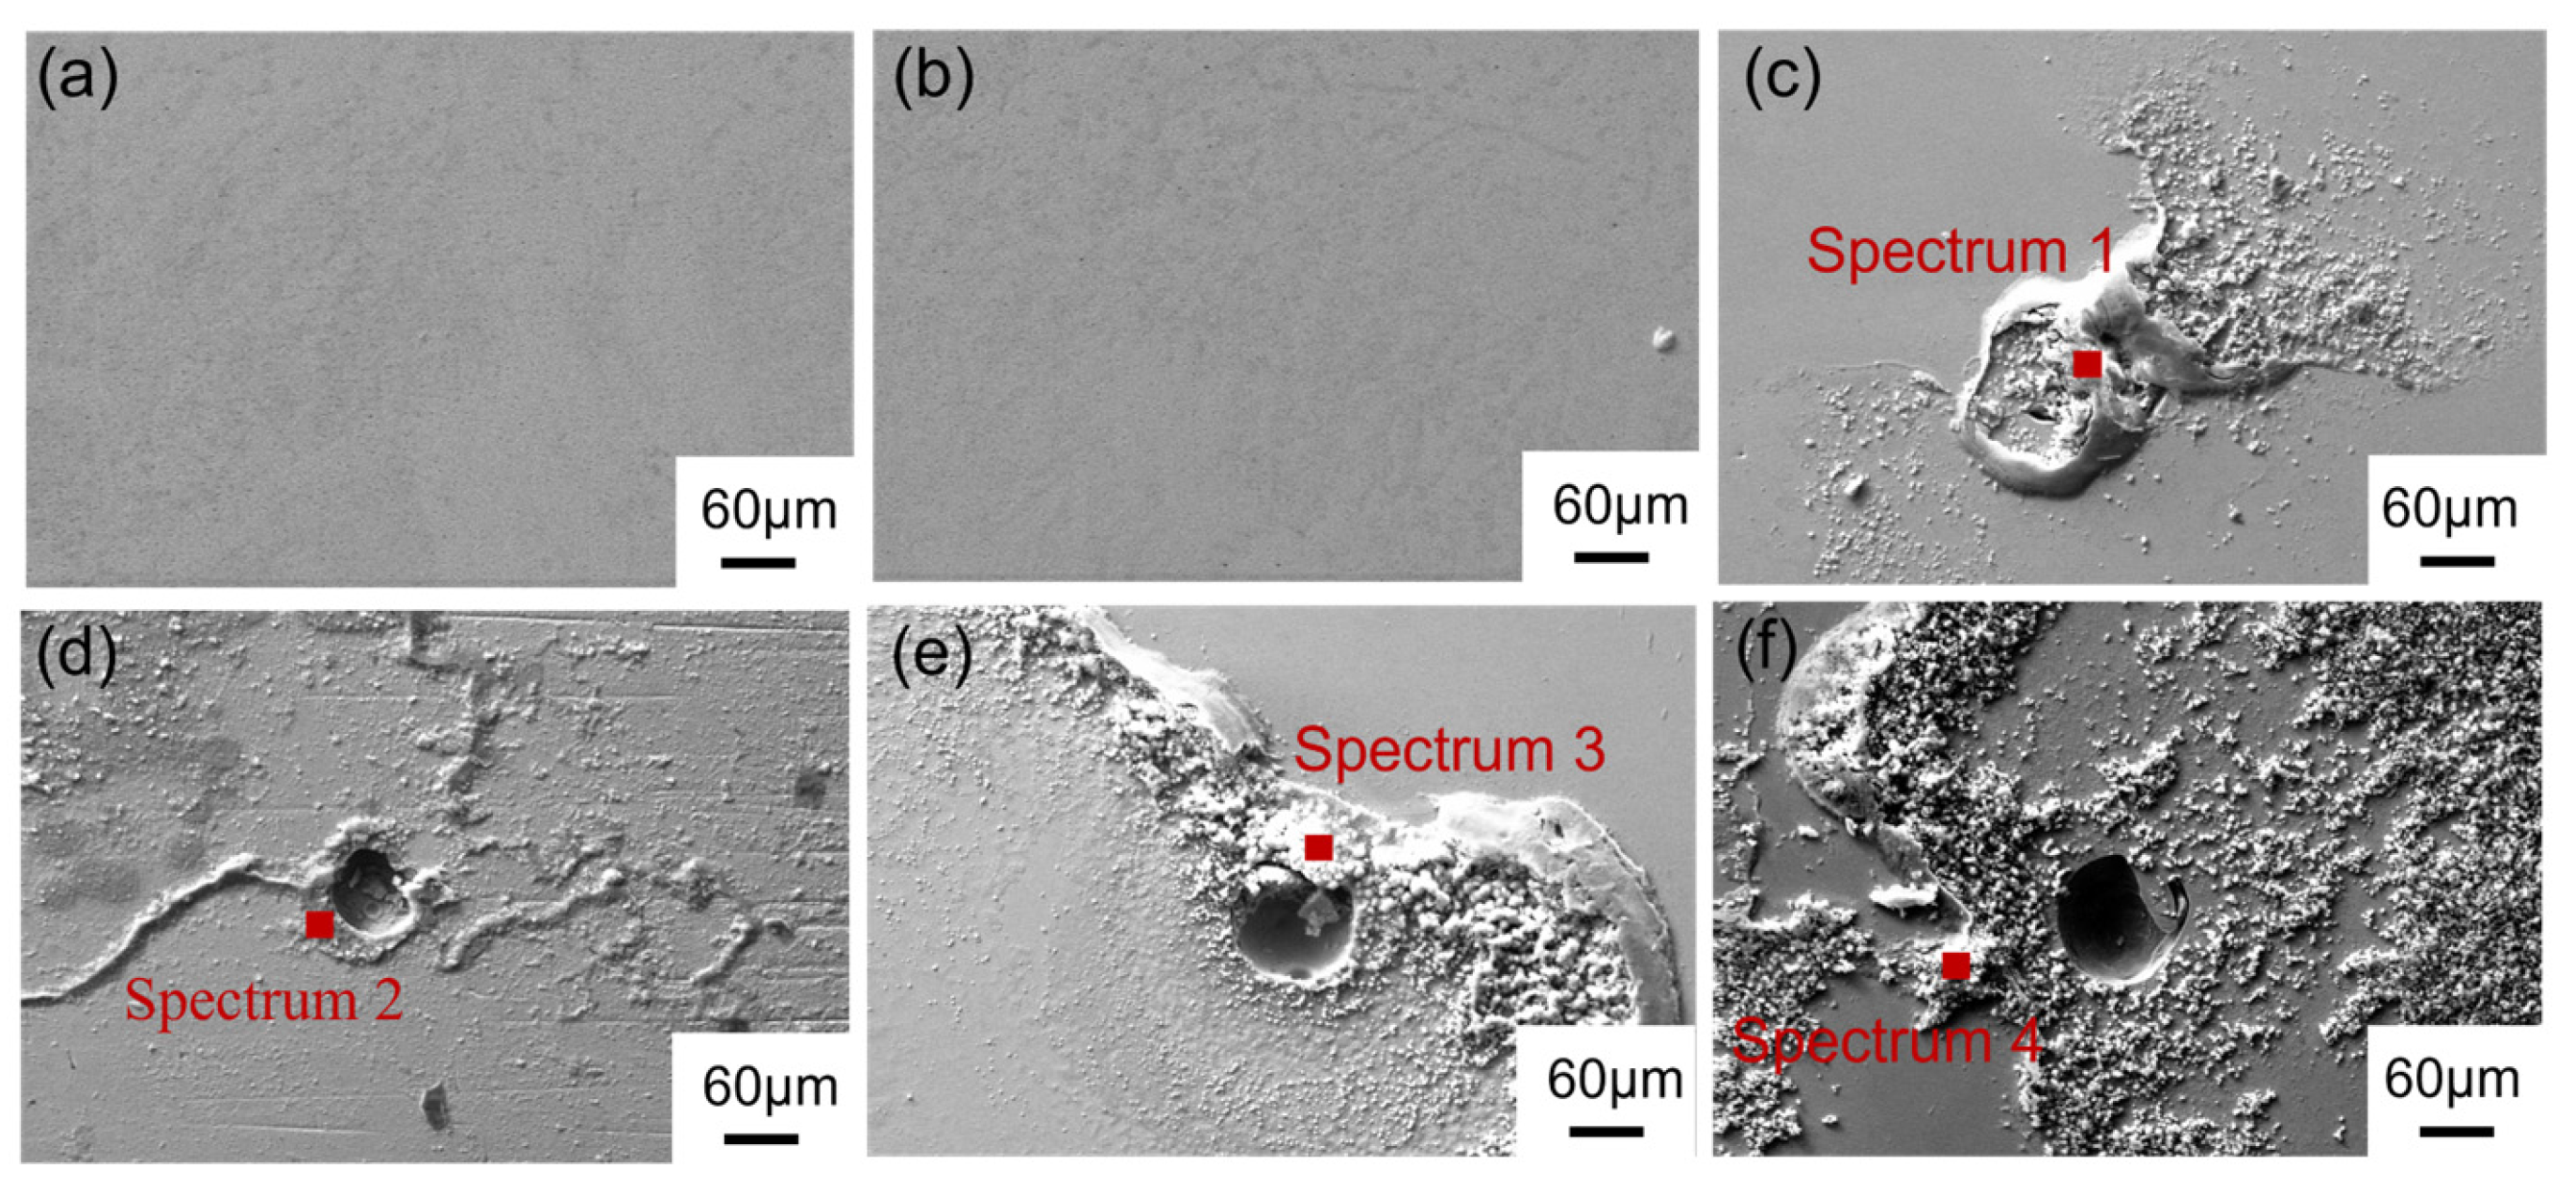
Figure 9) reveal instances of selective corrosion within the coating. Ni-Cr-Mo-0Fe and Ni-Cr-Mo-5Fe alloy coatings demonstrate remarkable resistance to pitting corrosion. Nonetheless, as the iron content in the coating reaches 10 wt%, surface pitting corrosion becomes apparent, indicating a decrease in the pitting resistance of the coating with the escalation of iron content.
The microstructure of the coating reveals significant disparities in composition between the dendritic regions and interdendritic regions. The interdendritic regions exhibit higher Mo content and lower Ni content, leading to differing potentials in various areas within the coating and resulting in non-uniform corrosion behavior. Within the iron content range of 10–20 wt%, the difference in iron content between the dendritic regions and interdendritic regions remains minimal, and there is no significant segregation. Simultaneously, an increase in iron content does not notably affect the segregation of Mo content. This suggests that an iron content exceeding 10 wt% leads to reduced density and stability of the passive film formed on the dendritic regions, making it more susceptible to Cl-induced corrosion, thereby diminishing pitting resistance.
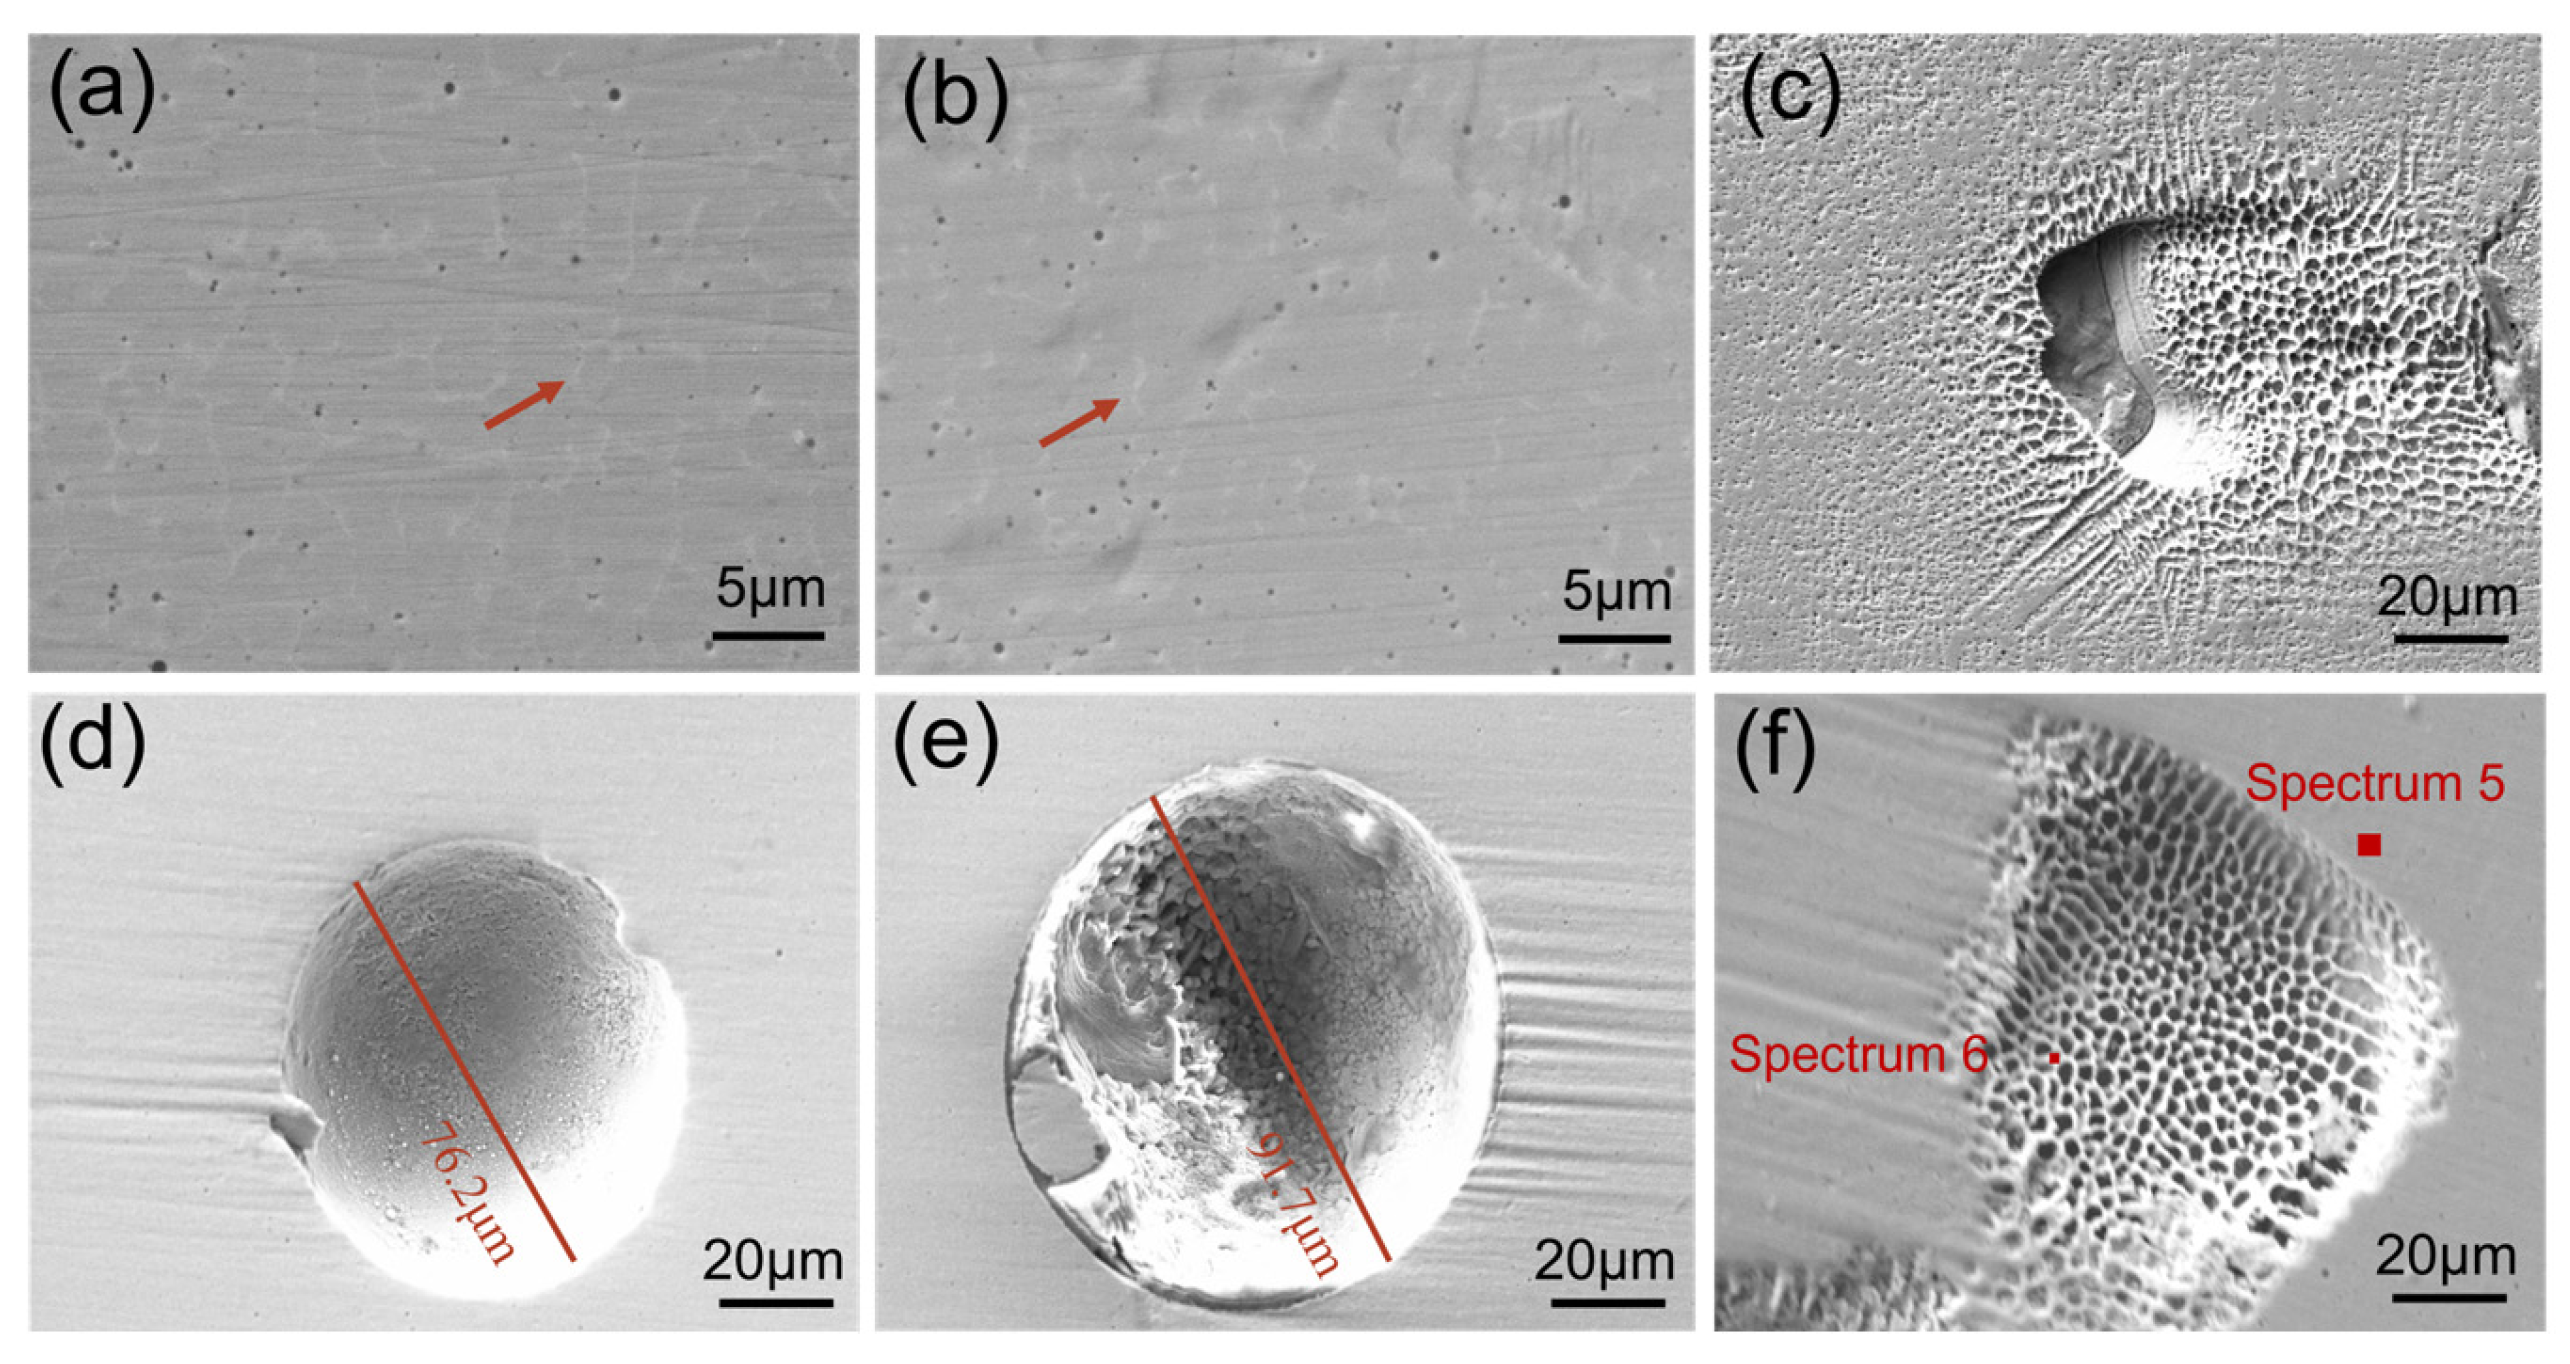
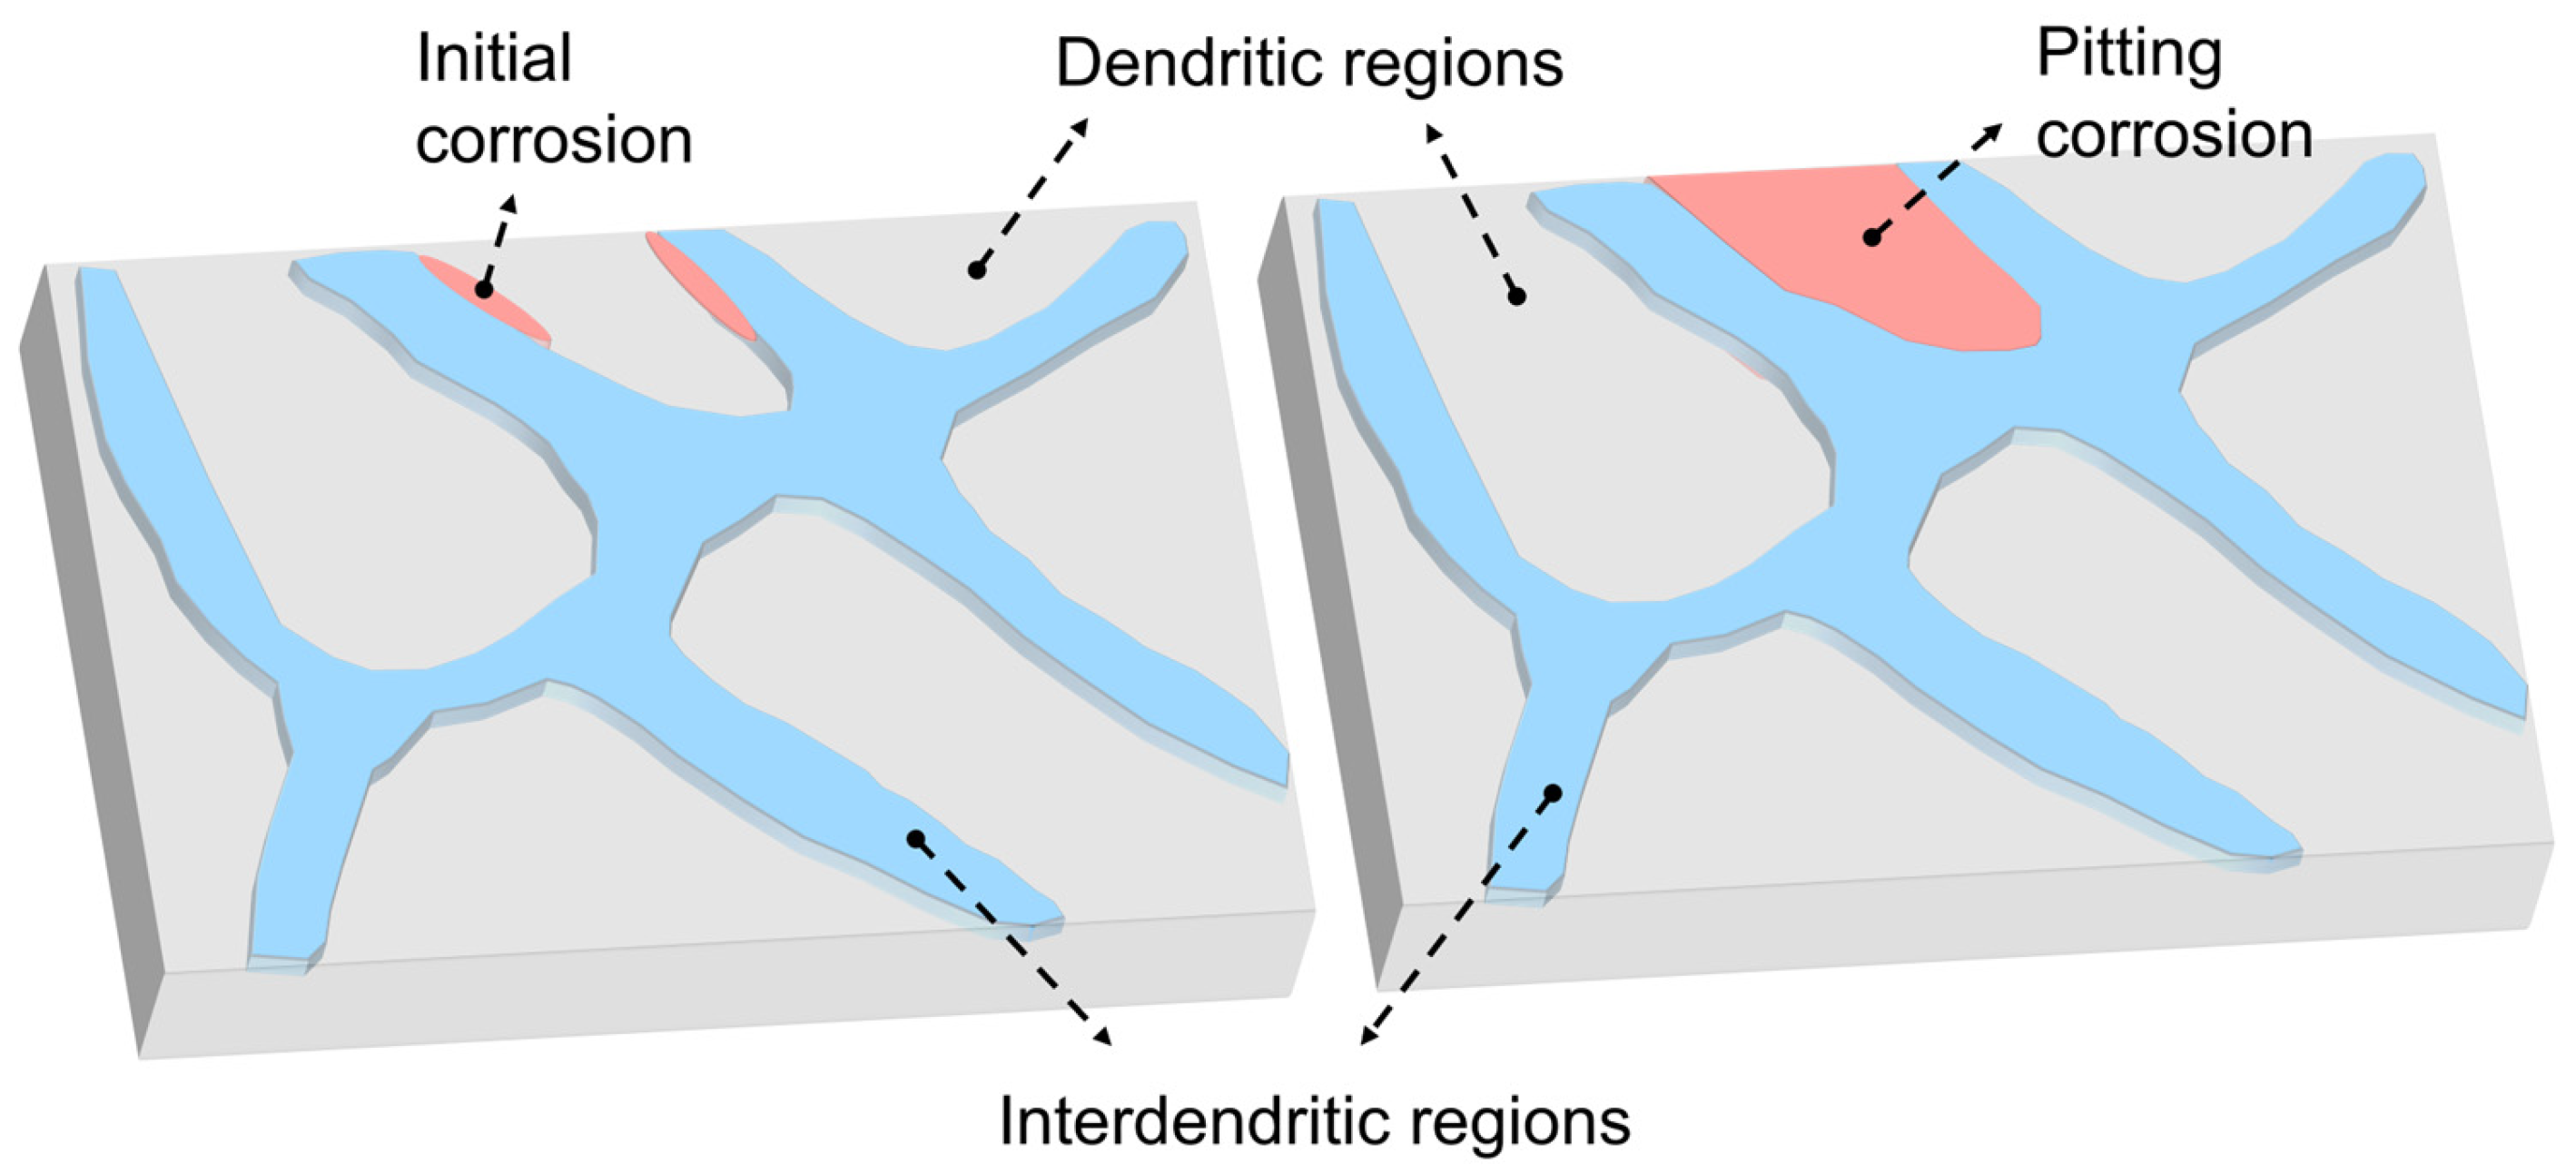
At an iron content of 25 wt%, the segregation of iron elements becomes conspicuous, with the dendritic regions exhibiting higher iron content than interdendritic regions. Additionally, Ni and Mo element segregation intensifies, resulting in the most severe corrosion observed in the Ni-Cr-Mo-25Fe alloy coating when exposed to salt fog and ferric chloride solution, accompanied by the formation of larger pits. According to the pitting resistance coefficient (PREN), the interdendritic regions display enhanced pitting resistance due to their higher Mo element content, while the dendritic regions become more susceptible to corrosion. The potential difference resulting from element segregation forms a corrosion micro-battery, where the interdendritic and dendritic regions intersect, initiating corrosion that progresses longitudinally along the contact site. As the dendritic regions corrode, the interdendritic regions are subsequently affected, ultimately leading to the expansion of corrosion and the formation of pits, as depicted in Figure 16.

4.2. Effect of Iron Content on Passive Film of the Ni-Cr-Mo-xFe Alloy Coatings

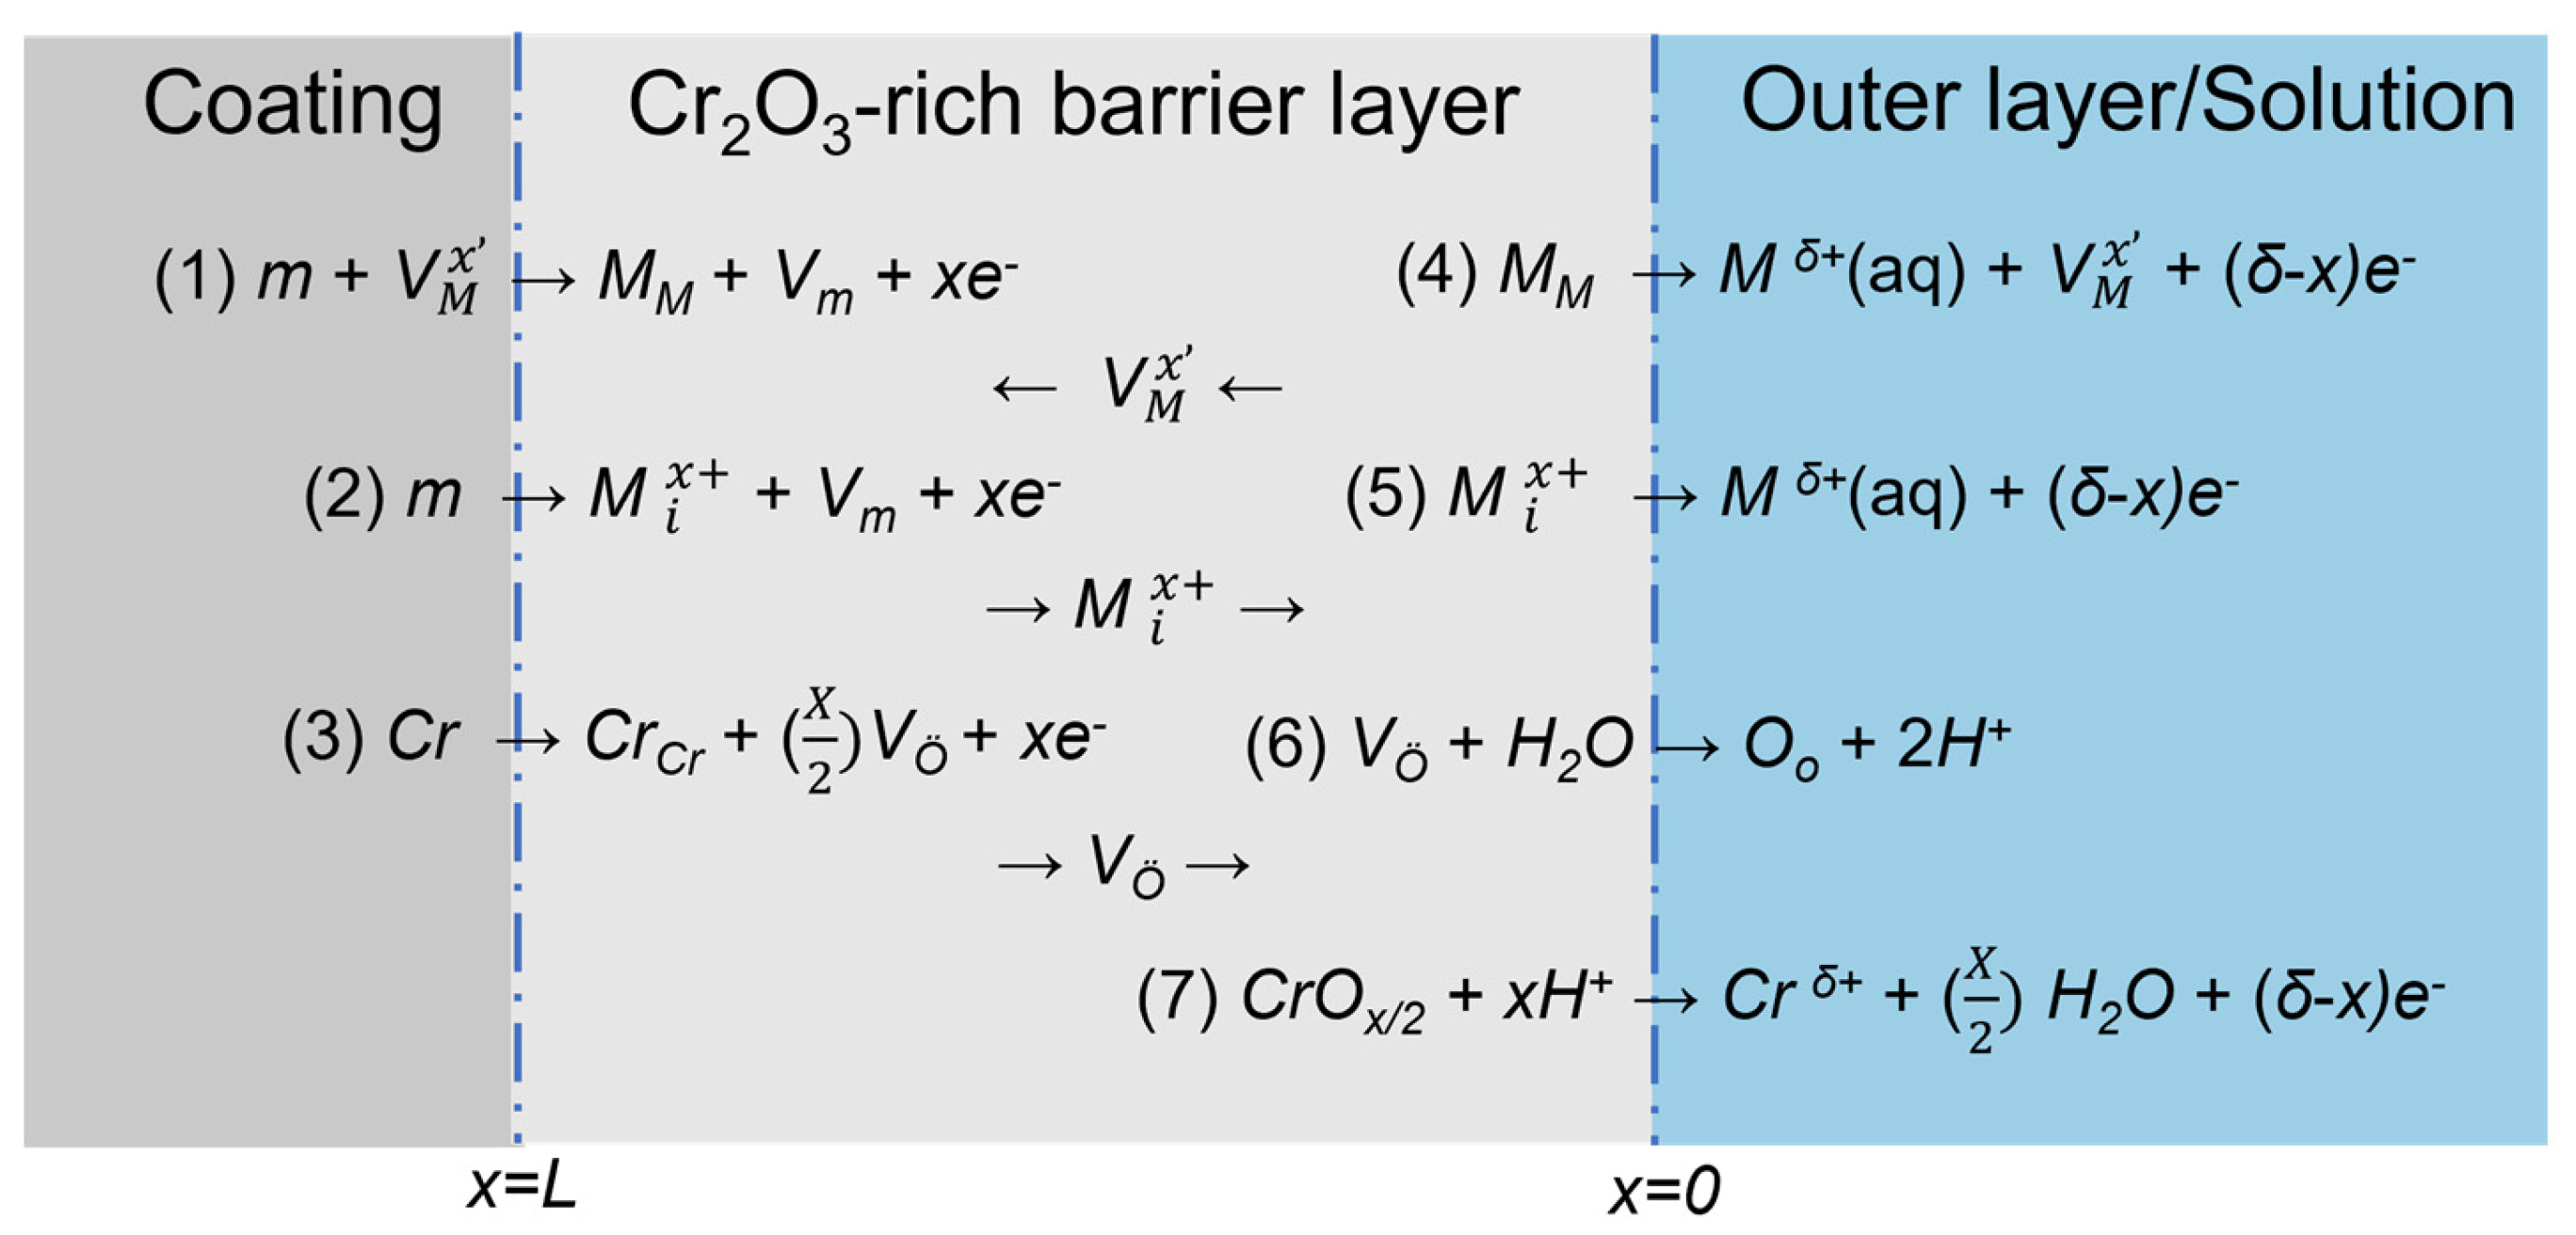
The PDM model is employed to describe the physical–chemical processes occurring during the formation of the passive film [58]. Given the presence of multiple alloy elements in Ni-Cr-Mo-xFe alloy coatings, the standard PDM model has been extended to accommodate a suitable passive film by introducing a point defect reaction involving multiple elements at the interface, as illustrated in Figure 17. According to the PDM-II model, the passive film formed on Ni-Cr-Mo alloy and coating exhibits a double-layer structure. This comprises an inner layer enriched with Cr2O3, which acts as a barrier layer, and an outer layer consisting of various oxides and hydroxides [27]. The inner layer comprises Cr2O3 with defects, with Ni and Fe acting as interstitial substituents doped within Cr2O3, while Mo functions as a substituent within the cationic sublattice [59]. The passive film produced by the coating also displays a double-layer structure, with an inner Cr2O3-rich barrier layer and an outer layer comprising oxides and hydroxides. The coating and barrier layer are assumed to be a three-dimensional lattice, with Cr undergoing preferential oxidation to generate a barrier layer of Cr2O3. Meanwhile, Ni and Fe form interstitial atoms doped within the barrier layer, and Mo takes on a substituent role in the cationic sublattice of the barrier layer [59]. The diffusion order of metal cations within oxides follows the sequence Fe2+ > Ni2+ > Cr3+, with Fe diffusing more rapidly and accumulating in the outer layer, whereas Cr diffuses more slowly and accumulates and grows within the inner layer [60,61,62]. Ni and Fe directly penetrate the outer layer/solution via reactions (2) and (5) through the barrier layer, while Mo infiltrates into the outer layer/solution through reactions (1) and (4) originating from the barrier layer. Notably, Mo (VI) possesses a higher charge, leading to stronger electrostatic interactions with negatively charged vacancies [63]. Consequently, Mo exhibits greater segregation into the barrier layer, with higher-ion-charge Mo tending to accumulate at the barrier layer/outer layer interface [64]. Oxygen vacancies are generated at the metal/barrier interface via reaction (3) and are subsequently annihilated at the barrier/solution interface through reaction (6). This demonstrates that the barrier layer forms from metal and grows inwards. Reaction (7) is responsible for the breakdown and dissolution of the barrier layer.
Based on the analysis presented above, when the Ni-Cr-Mo-xFe alloy coating is immersed in a Cl-containing solution, iron in the outer layer readily combines with Cl to form soluble chloride. This results in an increased number of cation vacancies, which migrate towards the coating, accumulating locally at the coating/barrier interface. This accumulation hinders further growth in the passive film, ultimately leading to localized passive film dissolution and pitting corrosion. In cases where the iron content falls within the range of 0 to 5 wt%, the dissolution of iron does not cause an excessive accumulation of cation vacancies at the interface, thus not affecting the growth of the passive film. The results obtained from salt fog tests and immersion tests in iron trichloride solution demonstrate that Ni-Cr-Mo-0Fe and Ni-Cr-Mo-5Fe exhibit excellent resistance to pitting corrosion. Potentiodynamic polarization curves indicate stable passivation regions and lower-dimensional passivation current densities for these coatings, while impedance spectra reveal higher impedance values.

5. Conclusions

This study investigates the microstructure and pitting corrosion behavior of Ni-Cr-Mo-xFe alloy coatings and delves into the influence of Fe content on the passive film. The main conclusions are as follows:
  • Ni-Cr-Mo-xFe alloy coatings (x = 0, 5, 10, 15, 20, 25 wt%) consist primarily of a γ-Ni solid solution phase, with no other discernible phases or precipitates detected. Ni and Mo exhibit segregation within the dendritic regions and the Mo-rich interdendritic regions. Notably, substantial segregation of Fe occurs when the iron content reaches 25 wt%, resulting in pronounced segregation of Mo and Ni.
  • When the iron content within the coating falls within the range of 0–5 wt%, the coating demonstrates exceptional resistance to pitting corrosion, and an increase in iron content can further enhance secondary passivation. However, within an iron content range of 10–25 wt%, the polarization curves exhibit a metastable pitting corrosion characteristic, resulting in the formation of pits on the surface of the coating. Pitting corrosion occurs due to selective corrosion of the dendritic regions, and the Ni-Cr-Mo-25Fe alloy coating exhibited the poorest corrosion resistance among all the coatings subjected to testing.
  • The enrichment of iron in the outer layer of the passive film results in the increased dissolution of iron, leading to elevated concentrations of cation vacancies. When the iron content exceeds or equals 10 wt%, the concentration of point defects in the passive film rises. This surplus of cation vacancies accumulates locally at the coating/barrier layer interface, impeding the growth of the passive film and inducing pitting corrosion. On the other hand, the dissolution of iron promotes the repassivation process of the Mo element, thereby preventing further corrosion of the coating. This study serves as a valuable reference for regulating the iron content in Ni-Cr-Mo alloy coatings when they are employed in marine environments.

Author Contributions

Methodology, Q.L., Z.L., Y.S. and Y.K.; formal analysis, Q.L.; investigation, Y.S. and J.L.; resources, H.N.; data curation, Y.S. and Y.Z.; writing—original draft preparation, Q.L.; writing—review and editing, Y.K., J.L. and H.N.; funding acquisition, Z.L. All authors have read and agreed to the published version of the manuscript.

Funding

This research was funded by the Equipment Pre-research General Fund Project (NO.6140922020).

Institutional Review Board Statement

Not applicable.

Informed Consent Statement

Not applicable.

Data Availability Statement

The data that support the findings of this study are available from the corresponding author upon reasonable request.

Acknowledgments

The authors thank Lin Chen for his help with the SEM characterization. The authors extend their gratitude to Chaoliang Yan from Shiyanjia Lab (www.shiyanjia.com, 12 July 2023) for providing invaluable assistance with the XPS analysis.

Conflicts of Interest

The authors declare no conflicts of interest.

References

  1. Kong, Y.; Liu, Z.; Wang, X.; Li, J.; Liu, Q. Evolution in microstructure and oxidation behaviors of the laser cladding C22 coatings with the Si addition concentrations. J. Alloys Compd. 2023, 932, 167536. [Google Scholar] [CrossRef]
  2. Li, J.; Liu, Z.; Ma, H.; Liu, Q.; Mao, J.; Zhang, J.; Kong, Y. Comparative study on the corrosion behaviour of 1.4529 super austenitic stainless steel and laser-cladding 1.4529 coating in simulated desulfurized flue gas condensates. Corros. Sci. 2022, 209, 110794. [Google Scholar] [CrossRef]
  3. Li, J.; Liu, Z.; Ma, H.; Wang, X.; Kong, Y.; Li, Y.; Shen, Y. High-temperature corrosion behavior of C276 alloy, 1.4529 steel and laser-cladding 1.4529 coating under the synergistic action of deposited chloride salt and HCl-containing atmosphere. Corros. Sci. 2023, 222, 111413. [Google Scholar] [CrossRef]
  4. Wang, X.; Liu, Z.; Cheng, K.; Shen, Y.; Li, J. Corrosion characteristics of Inconel 625 cladding layer and NiCrMoAl cladding layer in molten NaCl-KCl and NaCl-KCl-Na2SO4. Corros. Sci. 2023, 221, 111308. [Google Scholar] [CrossRef]
  5. Chen, L.; Bai, S.-L.; Ge, Y.-Y.; Wang, Q.-Y. Erosion-corrosion behavior and electrochemical performance of Hastelloy C22 coatings under impingement. Appl. Surf. Sci. 2018, 456, 985–998. [Google Scholar] [CrossRef]
  6. Liu, J.; Liu, H.; Tian, X.; Yang, H.; Hao, J. Microstructural evolution and corrosion properties of Ni-based alloy coatings fabricated by multi-layer laser cladding on cast iron. J. Alloy. Compd. 2020, 822, 153708. [Google Scholar] [CrossRef]
  7. Shen, F.; Tao, W.; Li, L.; Zhou, Y.; Wang, W.; Wang, S. Effect of microstructure on the corrosion resistance of coatings by extreme high speed laser cladding. Appl. Surf. Sci. 2020, 517, 146085. [Google Scholar] [CrossRef]
  8. Chen, L.; Bai, S.-L. The anti-corrosion behavior under multi-factor impingement of Hastelloy C22 coating prepared by multilayer laser cladding. Appl. Surf. Sci. 2018, 437, 1–12. [Google Scholar] [CrossRef]
  9. Ren, L.; Ding, Y.; Cheng, Y.; Nong, J.; Wang, S.; Wang, S.; Zhang, D.; Qin, Q.; Si, J.; Shoji, T.; et al. The microstructure evolving and element transport of Ni-based laser-cladding layer in supercritical water. Corros. Sci. 2022, 198, 110112. [Google Scholar] [CrossRef]
  10. Wu, F.; Chen, T.; Wang, H.; Liu, D. Effect of Mo on Microstructures and Wear Properties of In Situ Synthesized Ti(C,N)/Ni-Based Composite Coatings by Laser Cladding. Materials 2017, 10, 1047. [Google Scholar] [CrossRef]
  11. Zhou, J.; Kong, D. Effects of Ni addition on corrosion behaviors of laser cladded FeSiBNi coating in 3.5% NaCl solution. J. Alloy. Compd. 2019, 795, 416–425. [Google Scholar] [CrossRef]
  12. Zheng, C.; Liu, Z.; Liu, Q.; Kong, Y.; Liu, C. Effect of Cr on Corrosion Behavior of Laser Cladding Ni-Cr-Mo Alloy Coatings in Sulfuric Acid Dew Point Corrosion Environment. Coatings 2022, 12, 421. [Google Scholar] [CrossRef]
  13. Shen, Y.; Liu, Z.; Kong, Y.; Wang, X.; Li, J.; Ning, H.; Pan, C. Effect of Cr content on micro-galvanic dissolution behavior and corrosion characteristics of Cu-Cr alloy laser cladding layer in a simulated seawater environment. Appl. Surf. Sci. 2024, 647, 158972. [Google Scholar] [CrossRef]
  14. Zheng, C.; Liu, Z.; Liu, Q.; Li, Y.; Liu, C. Comparative investigation on corrosion behavior of laser cladding C22 coating, Hastelloy C22 alloy and Ti–6Al–4V alloy in simulated desulfurized flue gas condensates. J. Mater. Res. Technol. 2022, 18, 2194–2207. [Google Scholar] [CrossRef]
  15. Zhao, Y.; Zhang, T.; Chen, L.; Yu, T.; Sun, J.; Guan, C. Microstructure and mechanical properties of Ti–C–TiN-reinforced Ni204-based laser-cladding composite coating. Ceram. Int. 2021, 47, 5918–5928. [Google Scholar] [CrossRef]
  16. UNS N06625, N06219 and N08825; Standard Specification for Nickel-Alloy Welded Pipe. ASTM: West Conshohocken, PA, USA, 2009.
  17. Gittos, M.F.; Gooch, T.G. Effect of iron dilution on corrosion resistance of Ni-Cr-Mo alloy cladding. Br. Corros. J. 1996, 31, 309–314. [Google Scholar] [CrossRef]
  18. Sun, F.; Gu, Y.; Yan, J.; Zhong, Z.; Yuyama, M. Phenomenological and microstructural analysis of intermediate temperatures creep in a Ni–Fe-based alloy for advanced ultra-supercritical fossil power plants. Acta Mater. 2016, 102, 70–78. [Google Scholar] [CrossRef]
  19. Davis, J.R. ASM Specialty Handbook: Nickel, Cobalt, and Their Alloys; ASM international: Detroit, MI, USA, 2000. [Google Scholar]
  20. Xu, Y.-X.; Li, W.-Y.; Yang, X.-W. Influence of alloyed Fe on corrosion of Ni-Cr alloys in molten silicates and the effects of pre-oxidation treatment. Corros. Sci. 2018, 134, 179–188. [Google Scholar] [CrossRef]
  21. Xie, Y.; Zhang, J.; Young, D.J.; Zheng, W. Effect of Fe on corrosion of Ni-20Cr and Ni-30Cr alloys in wet CO2 gas at 650 and 700 °C. Corros. Sci. 2019, 154, 129–143. [Google Scholar] [CrossRef]
  22. Hemmati, I.; Ocelík, V.; De Hosson, J. Dilution effects in laser cladding of Ni–Cr–B–Si–C hardfacing alloys. Mater. Lett. 2012, 84, 69–72. [Google Scholar] [CrossRef]
  23. Khayat, Z.; Palmer, T. Impact of iron composition on the properties of an additively manufactured solid solution strengthened nickel base alloy. Mater. Sci. Eng. A 2018, 718, 123–134. [Google Scholar] [CrossRef]
  24. Moskal, G.; Niemiec, D.; Chmiela, B.; Kałamarz, P.; Durejko, T.; Ziętala, M.; Czujko, T. Microstructural characterization of laser-cladded NiCrAlY coatings on Inconel 625 Ni-based superalloy and 316L stainless steel. Surf. Coat. Technol. 2020, 387, 125317. [Google Scholar] [CrossRef]
  25. Lourenço, J.; Souza, L.; Faria, M.; Nunes, C.; Tomachuk, C.; Baker, M. Influence of the iron content on the microstructure and electrochemical behavior of as-cast modified Inconel 625. Corros. Sci. 2021, 193, 109892. [Google Scholar] [CrossRef]
  26. Jie, G.; Yan, S.; Kangning, W.; Qiang, S.; Canming, W. Effect of Fe content on microstructure and corrosion resistance of Ni-based alloy formed by laser cladding. Surf. Coat. Technol. 2022, 446, 128761. [Google Scholar] [CrossRef]
  27. Macdonald, D.D. The history of the Point Defect Model for the passive state: A brief review of film growth aspects. Electrochim. Acta 2011, 56, 1761–1772. [Google Scholar] [CrossRef]
  28. Landoulsi, J.; Genet, M.; Richard, C.; El Kirat, K.; Pulvin, S.; Rouxhet, P. Evolution of the passive film and organic constituents at the surface of stainless steel immersed in fresh water. J. Colloid Interface Sci. 2008, 318, 278–289. [Google Scholar] [CrossRef] [PubMed]
  29. Feng, Z.; Cheng, X.; Dong, C.; Xu, L.; Li, X. Passivity of 316L stainless steel in borate buffer solution studied by Mott–Schottky analysis, atomic absorption spectrometry and X-ray photoelectron spectroscopy. Corros. Sci. 2010, 52, 3646–3653. [Google Scholar] [CrossRef]
  30. Jinlong, L.; Tongxiang, L.; Chen, W.; Limin, D. Comparison of corrosion properties of passive films formed on coarse grained and ultrafine grained AISI 2205 duplex stainless steels. J. Electroanal. Chem. 2015, 757, 263–269. [Google Scholar] [CrossRef]
  31. Kocijan, A.; Merl, D.K.; Jenko, M. The corrosion behaviour of austenitic and duplex stainless steels in artificial saliva with the addition of fluoride. Corros. Sci. 2011, 53, 776–783. [Google Scholar] [CrossRef]
  32. Freire, L.; Carmezim, M.; Ferreira, M.; Montemor, M. The electrochemical behaviour of stainless steel AISI 304 in alkaline solutions with different pH in the presence of chlorides. Electrochim. Acta 2011, 56, 5280–5289. [Google Scholar] [CrossRef]
  33. AASfTa Materials; American Society for Testing and Materials: West Conshohocken, PA, USA, 2009.
  34. AASfTa Materials; ASTM International: West Conshohocken, PA, USA, 2020.
  35. Li, R.; Ferreira, M.; Anjos, M.; Vilar, R. Localized corrosion of laser surface cladded UNS S31254 superaustenitic stainless steel on mild steel. Surf. Coat. Technol. 1997, 88, 90–95. [Google Scholar] [CrossRef]
  36. Lin, C.-M. Predicting the Effect of Mo Addition on Metastable Phase Equilibria and Diffusion Path of Fe in NiAl Laser-Clad Coatings Using First-Principle Calculations and CALPHAD Simulations. Processes 2022, 10, 1228. [Google Scholar] [CrossRef]
  37. Lorenz, K.; Medawar, G. About the corrosion behaviour of Cr–Ni–Mo austenitic steels with and without nitrogen addition taking their resistance in chloride solutions. Thyssen Res. 1969, 1, 97–108. [Google Scholar]
  38. Tobler, W.; Virtanen, S. Effect of Mo species on metastable pitting of Fe18Cr alloys—A current transient analysis. Corros. Sci. 2006, 48, 1585–1607. [Google Scholar] [CrossRef]
  39. Richardson-Boedler, C. Metal passivity as mechanism of metal carcinogenesis: Chromium, nickel, iron, copper, cobalt, platinum, molybdenum. Toxicol. Environ. Chem. 2007, 89, 15–70. [Google Scholar] [CrossRef]
  40. Li, D.; Wang, J.; Chen, D.; Liang, P. Molybdenum addition enhancing the corrosion behaviors of 316 L stainless steel in the simulated cathodic environment of proton exchange membrane fuel cell. Int. J. Hydrog. Energy 2015, 40, 5947–5957. [Google Scholar] [CrossRef]
  41. Zhang, S.; Li, H.; Jiang, Z.; Zhang, B.; Li, Z.; Wu, J.; Fan, S.; Feng, H.; Zhu, H. Effects of Cr and Mo on precipitation behavior and associated intergranular corrosion susceptibility of superaustenitic stainless steel S32654. Mater. Charact. 2019, 152, 141–150. [Google Scholar] [CrossRef]
  42. Tian, H.; Cheng, X.; Wang, Y.; Dong, C.; Li, X. Effect of Mo on interaction between α/γ phases of duplex stainless steel. Electrochim. Acta 2018, 267, 255–268. [Google Scholar] [CrossRef]
  43. Dai, J.; Feng, H.; Li, H.-B.; Zhu, H.-C.; Zhang, S.-C.; Qu, J.-D.; He, T.; Jiang, Z.-H.; Zhang, T. Insights into the mechanism of Mo protecting CoCrFeNi HEA from pitting corrosion—A quantitative modelling study on passivation and repassivation processes. J. Mater. Sci. Technol. 2024, 182, 152–164. [Google Scholar] [CrossRef]
  44. Luo, H.; Gao, S.; Dong, C.; Li, X. Characterization of electrochemical and passive behaviour of Alloy 59 in acid solution. Electrochim. Acta 2014, 135, 412–419. [Google Scholar] [CrossRef]
  45. Mirhashemihaghighi, S.; Światowska, J.; Maurice, V.; Seyeux, A.; Klein, L.H.; Salmi, E.; Ritala, M.; Marcus, P. Interfacial native oxide effects on the corrosion protection of copper coated with ALD alumina. Electrochim. Acta 2016, 193, 7–15. [Google Scholar] [CrossRef]
  46. Luo, H.; Dong, C.; Li, X.; Xiao, K. The electrochemical behaviour of 2205 duplex stainless steel in alkaline solutions with different pH in the presence of chloride. Electrochim. Acta 2012, 64, 211–220. [Google Scholar] [CrossRef]
  47. Luo, H.; Su, H.; Dong, C.; Xiao, K.; Li, X. Electrochemical and passivation behavior investigation of ferritic stainless steel in alkaline environment. Constr. Build. Mater. 2015, 96, 502–507. [Google Scholar] [CrossRef]
  48. Bellanger, G.; Rameau, J.J. Behaviour of Hastelloy C22 steel in sulphate solutions at pH 3 and low temperatures. J. Mater. Sci. 1996, 31, 2097–2108. [Google Scholar] [CrossRef]
  49. Zhang, Y.; Urquidi-Macdonald, M.; Engelhardt, G.R.; Macdonald, D.D. Development of localized corrosion damage on low pressure turbine disks and blades: I. Passivity. Electrochim. Acta 2012, 69, 1–11. [Google Scholar] [CrossRef]
  50. Sunseri, C.; Piazza, S.; Di Quarto, F. Photocurrent Spectroscopic Investigations of Passive Films on Chromium. J. Electrochem. Soc. 1990, 137, 2411–2417. [Google Scholar] [CrossRef]
  51. BenSalah, M.; Sabot, R.; Triki, E.; Dhouibi, L.; Refait, P.; Jeannin, M. Passivity of Sanicro28 (UNS N-08028) stainless steel in polluted phosphoric acid at different temperatures studied by electrochemical impedance spectroscopy and Mott–Schottky analysis. Corros. Sci. 2014, 86, 61–70. [Google Scholar] [CrossRef]
  52. Belo, M.d.C.; Rondot, B.; Pons, F.; Le Héricy, J.; Langeron, J.P. Study by Auger Spectrometry and Cathodic Reduction of Passive Films Formed on Ferritic Stainless Steels. J. Electrochem. Soc. 1977, 124, 1317–1324. [Google Scholar] [CrossRef]
  53. Biesinger, M.C.; Payne, B.P.; Grosvenor, A.P.; Lau, L.W.M.; Gerson, A.R.; Smart, R.S.C. Resolving surface chemical states in XPS analysis of first row transition metals, oxides and hydroxides: Cr, Mn, Fe, Co and Ni. Appl. Surf. Sci. 2011, 257, 2717–2730. [Google Scholar] [CrossRef]
  54. Olsson, C.-O.; Landolt, D. Passive films on stainless steels—Chemistry, structure and growth. Electrochim. Acta 2003, 48, 1093–1104. [Google Scholar] [CrossRef]
  55. Ghods, P.; Isgor, O.; Brown, J.; Bensebaa, F.; Kingston, D. XPS depth profiling study on the passive oxide film of carbon steel in saturated calcium hydroxide solution and the effect of chloride on the film properties. Appl. Surf. Sci. 2011, 257, 4669–4677. [Google Scholar] [CrossRef]
  56. Li, W.; Luo, J. Electrochemical investigations on formation and pitting susceptibility of passive films on iron and iron-based alloys. Int. J. Electrochem. Sci. 2007, 2, 627–665. [Google Scholar] [CrossRef]
  57. Lloyd, A.C.; Noël, J.J.; McIntyre, S.; Shoesmith, D.W. Cr, Mo and W alloying additions in Ni and their effect on passivity. Electrochim. Acta 2004, 49, 3015–3027. [Google Scholar] [CrossRef]
  58. Zhang, L.; Macdonald, D.D. Segregation of alloying elements in passive systems—II. Numerical simulation. Electrochim. Acta 1998, 43, 2673–2685. [Google Scholar] [CrossRef]
  59. Macdonald, D.D. On the Existence of Our Metals-Based Civilization. J. Electrochem. Soc. 2006, 153, B213–B224. [Google Scholar] [CrossRef]
  60. Dieckmann, R.; Mason, T.O.; Hodge, J.D.; Schmalzried, H. Defects and Cation Diffusion in Magnetite (III.) Tracerdiffusion of Foreign Tracer Cations as a Function of Temperature and Oxygen Potential. Berichte Der Bunsenges. Für Phys. Chem. 1978, 82, 778–783. [Google Scholar] [CrossRef]
  61. Dieckmann, R. Point defects and transport properties of binary and ternary oxides. Solid State Ion. 1984, 12, 1–22. [Google Scholar] [CrossRef]
  62. Ren, Y.; Chang, S.; Wu, Y.; Zhang, Z.; Shen, F.; Li, L. Effect of inhomogeneous composition on the passive film of AISI 431 coating fabricated by extreme-high-speed laser cladding. Surf. Coat. Technol. 2022, 440, 128496. [Google Scholar] [CrossRef]
  63. Macdonald, D.D.; Real, S.; Smedley, S.I.; Urquidi-Macdonald, M. Evaluation of Alloy Anodes for Aluminum-Air Batteries: IV. Electrochemical Impedance Analysis of Pure Aluminum in at 25 °C. J. Electrochem. Soc. 1988, 135, 2410–2414. [Google Scholar] [CrossRef]
  64. Macdonold, D.D.; Ben-Haim, M.; Pallix, J. Segregation of Alloying Elements into Passive Films. J. Electrochem. Soc. 1989, 136, 3269–3273. [Google Scholar] [CrossRef]
Figure 1. Surface morphologies of Ni-Cr-Mo alloy powder (a) and pure Fe powder (b).
Coatings 14 00459 g001
Figure 2. Schematic diagram of laser cladding and specimen.
Coatings 14 00459 g002
Figure 3. XRD patterns of the Ni-Cr-Mo-xFe alloy coatings.
Coatings 14 00459 g003
Figure 4. Diagram of cross-section (a) and elemental distribution (b) of Ni-Cr-Mo-25Fe alloy coating and Fe dilution rate (c) for Ni-Cr-Mo-xFe alloy coatings.
Coatings 14 00459 g004
Figure 5. Microstructure of the surface of the Ni-Cr-Mo-xFe alloy coatings ((a): 0Fe; (b): 5Fe; (c): 10Fe; (d): 15Fe; (e): 20Fe; (f): 25Fe) after etching.
Coatings 14 00459 g005
Figure 6. The macroscopic morphology of the Ni-Cr-Mo-xFe alloy coatings after exposure to salt fog (5 wt% NaCl, 35 °C) for 42 days.
Coatings 14 00459 g006
Figure 7. The pitting morphologies of the Ni-Cr-Mo-xFe alloy coatings ((a): 0Fe; (b): 5Fe; (c): 10Fe; (d): 15Fe; (e): 20Fe; (f): 25Fe) after exposure to salt fog (5 wt% NaCl, 35 °C) for 42 days.
Coatings 14 00459 g007
Figure 8. Corrosion morphologies on the surface of the Ni-Cr-Mo-xFe alloy coatings ((a): 0Fe; (b): 5Fe; (c): 10Fe; (d): 15Fe; (e): 20Fe; (f): 25Fe) after 42 days of salt fog corrosion.
Coatings 14 00459 g008
Figure 9. Mean corrosion rate (a) and macroscopic morphology (b) of Ni-Cr-Mo-xFe alloy coatings after 72 h of immersion in ferric chloride solution (0.05 M HCl + 6 wt% FeCl3, 85 °C).
Coatings 14 00459 g009
Figure 10. Potentiodynamic polarization curves of the Ni-Cr-Mo-xFe alloy coatings in borate buffer solution with 0.6 M NaCl.
Coatings 14 00459 g010
Figure 11. Corrosion morphology of the surface of the Ni-Cr-Mo-xFe alloy coatings after potentiodynamic polarization test in borate buffer solution with 0.6 M NaCl ((a): 0Fe; (b): 5Fe; (c1–c3): 10Fe; (d1–d3): 15Fe; (e1–e3): 20Fe; (f1–f3): 25Fe).
Coatings 14 00459 g011
Figure 12. Nyquist plots (a), bode plots (b), equivalent circuit model (c), and polarization resistance (d) of the Ni-Cr-Mo-xFe alloy coatings in borate buffer solution with 0.6 M NaCl.
Coatings 14 00459 g012
Figure 13. Mott–Schottky plots of the passive film formed on the Ni-Cr-Mo-xFe alloy coatings after immersion in borate buffer solution with 0.6 M NaCl.
Coatings 14 00459 g013
Figure 14. The high-resolution XPS spectra of the passive film formed on the Ni-Cr-Mo-5Fe, Ni-Cr-Mo-10Fe, Ni-Cr-Mo-25Fe coatings: (a) Ni2p3; (b) Cr2p3; (c) Fe2p3; (d) Mo3d.
Coatings 14 00459 g014
Figure 15. XPS cation fraction of the passive film.
Coatings 14 00459 g015
Figure 16. Schematic diagram of selective corrosion dissolution of the coating.
Coatings 14 00459 g016
Figure 17. Interfacial reactions on the passive film of Ni-Cr-Mo-xFe alloy coating based on PDM. m = metal atom (Ni, Cr, Mo, Fe, etc.), V M x = cation vacancy on the barrier layer, MM = metal cation on the metal sublattice of the barrier layer, Vm = vacancy on metal phase, M i x + = interstitial cation (Cr, Fe, Ni), VÖ = anion (oxygen) vacancy, M δ+(aq) = metal cation in outer layer/solution interface, OO = oxide ion on the anion sublattice, CrOx/2 = stoichiometric barrier layer oxide.
Coatings 14 00459 g017
Table 1. The chemical compositions of alloy powder.
Alloy Powder Element Content (wt%)
CrMoWFeNi
Ni-Cr-Mo0Fe24.515.53.00.2Bal.
Ni-Cr-Mo-5Fe5Fe23.114.43.05.1Bal.
Ni-Cr-Mo-10Fe10Fe21.913.62.910.4Bal.
Ni-Cr-Mo-15Fe15Fe20.712.82.715.2Bal.
Ni-Cr-Mo-20Fe20Fe19.412.12.520.4Bal.
Ni-Cr-Mo-25Fe25Fe18.211.32.425.3Bal.
Table 2. Element distribution of the spots in Figure 5.
SamplesSpotsElement Content [Standard Deviation] (wt%)
NiCrMoFeW
0FeA156 [0.9]24 [0.8]12 [1.0]<1 [0.4]8 [1.8]
A254 [1.3]25 [0.8]16 [0.9]<1 [0.4]5 [1.6]
A338 [1.4]23 [0.8]32 [1.0]<1 [0.4]7 [1.8]
5FeB154 [1.3]23 [0.8]11 [0.9]5 [0.4]7 [1.6]
B249 [1.4]24 [0.8]15 [1.0]5 [0.4]7 [1.8]
10FeC152 [1.3]22 [0.8]12 [1.0]11 [0.4]3 [1.6]
C249 [1.3]23 [0.8]14 [0.9]10 [0.4]4 [1.6]
15FeD147 [1.2]21 [0.7]10 [0.9]16 [0.4]6 [1.6]
D243 [1.3]22 [0.7]15 [0.9]15 [0.6]5 [1.7]
20FeE144 [1.2]20 [0.7]11 [0.6]20 [0.9]5 [1.6]
E240 [1.4]20 [0.8]14 [1.0]19 [0.5]7 [1.8]
25FeF142 [1.3]19 [0.8]10 [1.0]25 [0.5]4 [1.8]
F231 [1.3]20 [0.8]24 [0.9]20 [0.5]5 [1.7]
Table 3. EDS results of spectrum 1–6 displayed in Figure 7 and Figure 8.
SpectrumElement Content [Standard Deviation] (wt%)
NiCrMoFeWCl
14 [0.5]7 [0.4]2 [0.5]82 [1.0]2 [1.1]3 [0.2]
26 [0.5]10 [0.4]5 [0.6]72 [1.2]2 [1.3]5 [0.3]
35 [0.5]7 [0.4]5 [0.4]76 [1.2]2 [1.2]5 [0.2]
43 [0.7]6 [0.4]4 [0.4]79 [1.2]2 [1.3]6 [0.1]
542 [0.8]19 [0.5]11 [0.6]26 [0.7]2 [1.2]0 [0.2]
637 [0.8]20 [0.5]17 [0.6]23 [0.7]3 [1.2]0 [0.2]
Table 4. Electrochemical parameters of the coatings in borate buffer solution with 0.6M NaCl.
CoatingsEcorr (mVSCE)Ep (mVSCE)ip (µA·cm−2)Etr (mVSCE)
0Fe−376 ± 23−57 ± 91.21 ± 1.3365 ± 13
5Fe−317 ± 16−58 ± 151.13 ± 1.6355 ± 6
10Fe−346 ± 3230 ± 201.54 ± 2.1358 ± 12
15Fe−318 ± 12−51 ± 121.56 ± 1.8356 ± 15
20Fe−356 ± 42---
25Fe−284 ± 46---
Table 5. EDS results of spectrum 1–4 displayed in Figure 11.
SpectrumElement Content [Standard Deviation] (wt%)
NiCrMoFeW
142 [0.7]22 [0.6]20 [0.8]12 [0.7]4 [1.4]
250 [1.0]21 [0.6]12 [0.8]14 [0.6]3 [1.5]
341 [0.8]19 [0.5]10 [0.6]25 [0.7]5 [1.2]
416 [1.4]20 [1.1]3 [0.5]59 [1.7]2 [2.8]
Table 6. Equivalent circuit parameters for electrochemical impedance spectra.
Coatings0Fe5Fe10Fe15Fe20Fe25Fe
Rs/Ω cm27.006.526.616.196.756.59
Error%0.450.520.580.680.560.69
C/μF cm−256.6453.71112.897.17162.7202.4
Error%5.338.2412.385.5010.477.53
Rct/kΩ cm238828416010042.9233.78
Error%2.663.786.532.258.080.06
Yo,1/10−4 Ω−1 cm−2 s−n0.660.560.660.720.680.64
Error%4.256.895.893.154.711.88
n10.800.860.860.850.860.86
Error%0.490.630.520.300.410.22
R1/kΩ cm266.5864.0146.1243.5128.7326.33
Error%9.9311.97.3211.0613.897.01
chi-squared (10−4)2.664.524.743.056.408.06
Table 7. Evolution of the density donors and acceptors calculated from Mott–Schottky experiments.
CoatingsPart IPart IIPart IIIPart IV
(ND 1020)/cm3(NA 1020)/cm3(ND 1020)/cm3(NA 1020)/cm3
0Fe4.335.48-3.31
5Fe4.396.268.954.60
10Fe3.586.5913.494.39
15Fe3.289.9512.094.23
20Fe3.2112.1512.075.08
25Fe2.7912.7912.195.34
Table 8. The binding energy of the main species present in the passive film obtained from the deconvolution of XPS spectral.
ComponentsBinding Energy (eV)
Peak1Peak2Peak3Peak4Peak5Peak6
Ni (met)852.6
Ni(OH)2855.6
Mo3d5 (met)227.7
Mo3d3 (met)230.7
Mo3d5 (IV)228.9
Mo3d3 (IV)232.1
Mo3d5 (VI)232.3
Mo3d3 (VI)235.3
Cr (met)573.8
Cr2O3575.7576.7577.5578.5578.9
Cr(OH)3577.2
Fe (met)706.9
FeO708.4709.7710.9712.1715.4
Fe (III)710.0711.0711.9713.0714.1719.5
Disclaimer/Publisher’s Note: The statements, opinions and data contained in all publications are solely those of the individual author(s) and contributor(s) and not of MDPI and/or the editor(s). MDPI and/or the editor(s) disclaim responsibility for any injury to people or property resulting from any ideas, methods, instructions or products referred to in the content.

