Article

Improvement of Fatigue Strength in Additively Manufactured Aluminum Alloy AlSi10Mg via Submerged Laser Peening

by
Hitoshi Soyama
Department of Finemechanics, Tohoku University, Sendai 980-8579, Japan
Coatings 2024, 14(9), 1174; https://doi.org/10.3390/coatings14091174
Submission received: 30 July 2024 / Revised: 5 September 2024 / Accepted: 9 September 2024 / Published: 11 September 2024
(This article belongs to the Special Issue Laser Surface Engineering: Technologies and Applications)

Abstract

:
As the fatigue properties of as-built components of additively manufactured (AM) metals are considerably weaker than those of wrought metals because of their rougher surface, post-processing is necessary to improve the fatigue properties. To demonstrate the improvement in the fatigue properties of AM metals via post-processing methods, the fabrication of AlSi10Mg, i.e., PBF–LS/AlSi10Mg, through powder bed fusion (PBF) using laser sintering (LS) and its treatment via submerged laser peening (SLP), using a fiber laser and/or a Nd/YAG laser, was evaluated via plane bending fatigue tests. In SLP, laser ablation (LA) is generated by a pulsed laser and a bubble is generated after LA, which behaves like a cavitation bubble that is referred to as “laser cavitation (LC)”. In this paper, LA-dominated SLP is referred to as “laser treatment (LT)”, while LC collapse-dominated SLP is referred to as “laser cavitation peening (LCP)”, as the impact of LC collapse is used for peening. It was revealed that SLP using a fiber laser corresponded with LT rather than LCP. It was demonstrated that the fatigue strength at N = 107 was 85 MPa for LCP and 103 MPa for the combined process of blasting (B) + LT + LCP, whereas the fatigue strength of the as-built specimen was 54 MPa.

Graphical Abstract

1. Introduction

Additive manufactured (AM) metals are attractive metals, as they are manufactured directly via computer-aided design (CAD)/computer-aided manufacturing (CAM) [1,2,3,4,5,6]. However, the fatigue properties of as-built AM metals are considerably weaker than those of bulk metals [7,8,9,10,11,12], as the surface roughness of as-built metals is very high due to the partially melted particles that are used in the additive manufacturing process. Thus, post-processing to improve the fatigue properties of as-built AM metals is required, by smoothing the surface and introducing compressive residual stress [9,13,14,15,16,17]. It has been reported that the improvement in fatigue strength from powder bed fusion (PBF) using the laser sintering (LS) titanium alloy Ti6Al4V through submerged laser peening (SLP) is better than that achieved through shot peening (SP) and cavitation peening (CP) [12]; therefore, the effect of SLP on the fatigue properties of PBF–LS/AlSi10Mg should be investigated, as the fatigue properties of PBF–LS/AlSi10Mg are considerably weak [18,19,20,21,22] and the fatigue behavior of PBF–LS/AlSi10Mg can be enhanced by post-processing techniques [15,16,23,24,25,26,27,28,29,30,31,32].
For laser peening (LP), in which a pulsed laser is used for peening, there are two main methods. In one method, the pulsed laser is irradiated at a target that is covered with a water film, i.e., LP with a water film [33,34,35,36,37,38,39,40,41]. The other method involves the pulsed laser being irradiated at a target in water [42,43,44,45,46,47]; this is called “submerged laser peening (SLP)”. In both types of laser peening, i.e., LP with a water film and SLP, it is believed that plastic deformation occurs due to laser ablation (LA) with the confining medium, i.e., water [48]. It should be noted that in the case of SLP, after LA, a bubble is generated and expands, then shrinks, and then collapses, similar to a cavitation bubble (see Figure 1). The high-speed images in Figure 1 are cited from reference [12] and show a typical application of SLP. In the present paper, the laser-induced bubble is referred to as “laser cavitation (LC)”. At LA stage, the pulsed laser generates LA and it also produces thermal effects, such as melting the surface of the specimen. At LC collapse stage, LC is collapsed and rebounds, and an impact is produced. When the pressure in the water was measured using a submerged shock wave sensor, the amplitude of the pressure at LA stage was larger than that during LC collapse [49,50]. On the other hand, when the impact passing through the target metal was measured using a handmade polyvinylidene fluoride PVDF sensor [50], the impact at LC collapse stage was 1.3 times greater than that at LA stage. Namely, in terms of the impact of the different stages, which affect the target metals, LC collapse is more effective than LA. Thus, SLP can be distinguished by its mechanisms into LA stage and LC collapse stage.
As will be mentioned later, when the pulse width tw of the pulsed laser was changed in this study, the pulsed laser with a longer tw produced heat effects, such as melting of the surface of the target during LA stage. This represents a type of laser treatment (LT) in which melting and peening, due to LA, are included. On the other hand, at LC collapse stage, the impact that could be utilized for peening was generated. The peening method using the cavitation impact is called “cavitation peening (CP)” [51] and the peening method using LC collapse is called “laser cavitation peening (LCP)”. Thus, for convenience in the present paper, depending on which mechanism is dominant, SLP is classified as LT or LCP, as shown in Figure 1.
As mentioned above, the fatigue properties of the as-built PBF–LS/AlSi10Mg specimens were considerably weak and they were enhanced by post-processing methods, such as shot peening (SP) [23,24,26,31], LP [26,29,30], ultrasonic surface modification [29], and tumble finishing [32]. As is well-known, hot isostatic pressing (HIP) is an effective method for improving fatigue properties [8,52,53,54,55,56,57,58,59]; however, HIP is not suitable for improving fatigue properties where there are surface defects [60]. It was reported that the improvements in the fatigue strength of an as-built PBF–LS/TiAl4V [12] and magnesium alloy [61] via SLP were better than that achieved via SP and CP. Thus, in the present paper, SLP was chosen for the mechanical surface treatment for the as-built PBF–LS/AlSi10Mg specimens, as surface smoothing and the introduction of compressive residual stress represent key factors in improving the fatigue properties of as-built AM metals [11,12,62].
In both LP with a water film and SLP, a Nd/YAG laser with a Q-switch, with a pulse width tw of several nanoseconds, was used, as LA is required in conventional LP. The typical repetition frequency of a conventional Nd/YAG laser is about a dozen Hz, and several pulse/mm2 to a dozen pulses/mm2 is the level required for the improvement of fatigue strength [12,61]. Additionally, a high-repetition, portable pulse laser system, with a power and pulse width of 10 mJ and 1.3 ns, has been developed [46]; however, its repetition frequency is about 100 Hz, and 800–1600 pulse/mm2 is the level required for treatment. Thus, the slow processing speed, due to the repetition frequency of the laser system, represents an obstacle to the practical application of LP.
In order to increase the generation frequency of the cavitation bubble, a cavitation generator using a piezo actuator was developed [63]; however, the bubble size was still too small; although vortex cavitation is a key factor in CP [64]. From the perspective of using LC for dental and medical applications, a pulsed laser with a pulse width of several hundred microseconds has been used [65,66,67,68]. The heat effect from the pulsed laser has been used in surgery. It has been proven that a laser pulse of several hundred microseconds is applicable for LCP [69]. Thus, to increase the repetition frequency of a laser system for LP, a fiber laser could be used instead of a Nd/YAG laser with a Q-switch, as a fiber laser can produce laser pulses of tens to hundreds of microseconds in terms of a kHz order frequency.
In this study, in order to develop a novel form of post-processing using a fiber laser for the improvement of the fatigue properties of the as-built PBF–LS/AlSi10Mg compared to conventional SLP, the as-built PBF–LS/AlSi10Mg specimens were treated via SLP using a fiber laser and/or a Nd/YAG laser with a Q-switch and tested via plane bending fatigue tests. The surface characteristics, such as the surface roughness, residual stress, and hardness, were evaluated. Then, an experimental formula to estimate the improved fatigue life via SLP using a fiber laser and/or a Nd/YAG laser was proposed, considering the surface roughness and the residual stress.

2. Materials and Methods

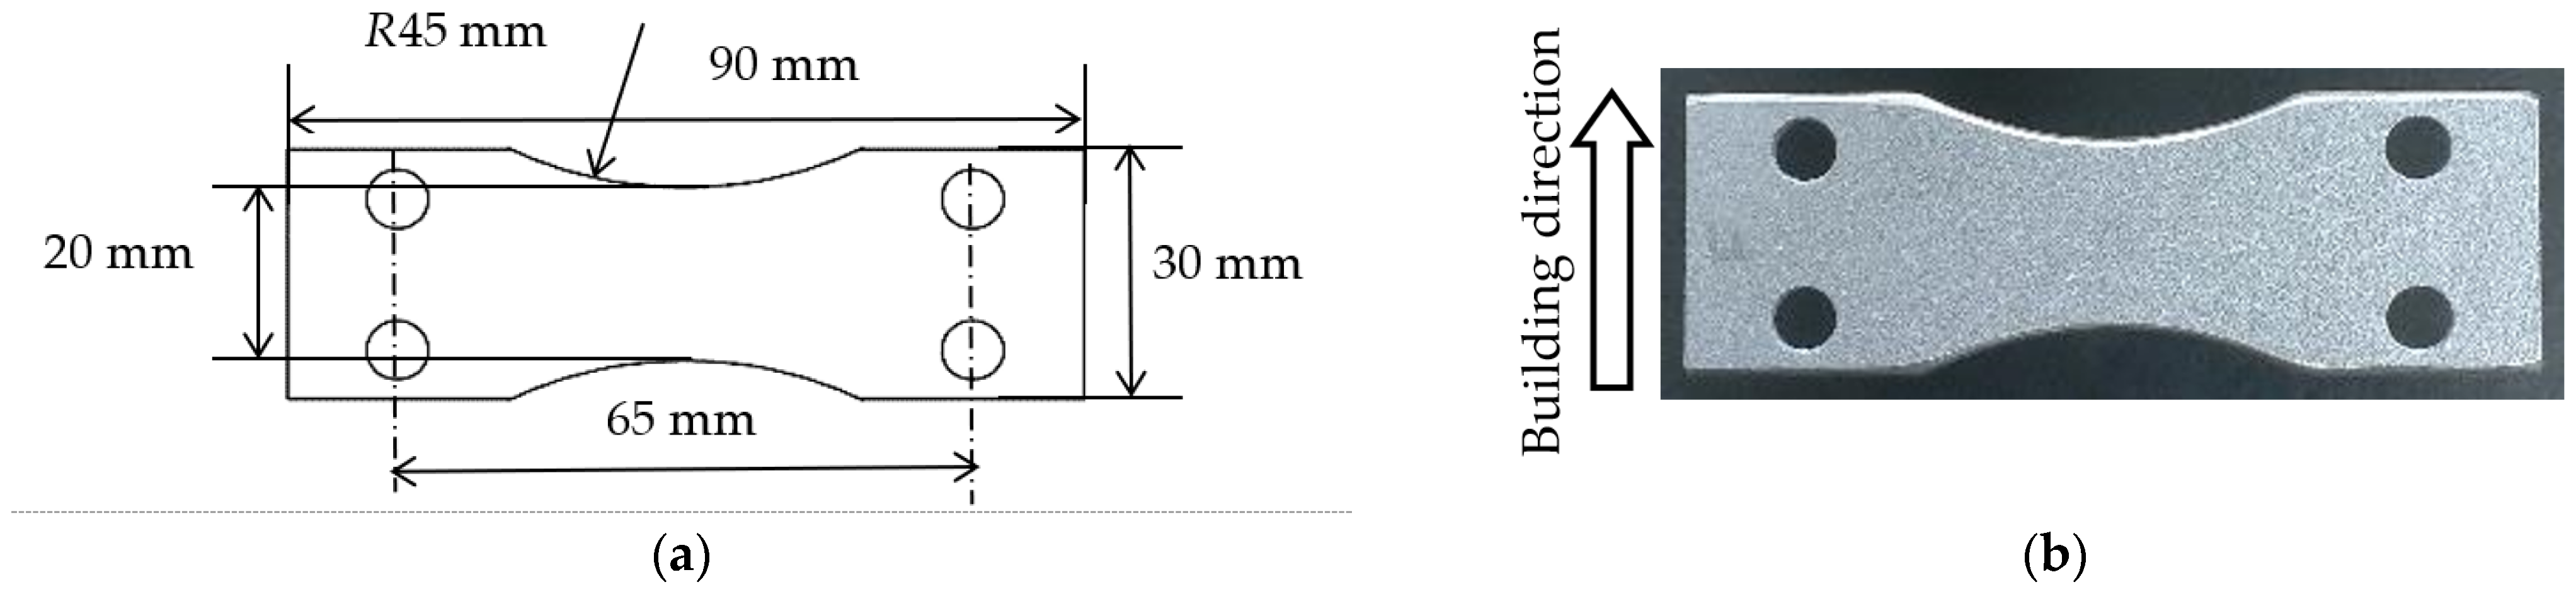
2.1. Materials and Test Specimens

Figure 2 shows: (a) a schematic and (b) a photograph of a specimen for the plane bending fatigue tests involving the manufactured PBF–LS/AlSi10Mg. The PBF-LS/AlSi10Mg conditions were the standard conditions of the EOS M290 system (EOS GmbH, Krailing, Germany), as follows: the laser power was 400 W, the laser spot diameter was 100 μm, the preheating temperature of the build platform was 473 K, and the layer thickness was 30 μm. The particles used were 38–53 μm in diameter. The building direction is shown in Figure 2b. After PBF–LS, the specimens were annealed at 473 K for 4.5 h to release residual stress and then cooled in air. In order to avoid crack initiation in the corner of the as-built specimen, the corner was rounded using a #180 rubber whetstone (Tact Polisher Disk T1 #180, Tact Corporation, Kuwana, Japan) and a #400 disk paper (GP100DX-400, Trusco Nakayama Corporation, Tokyo, Japan), the same as detailed in a previous report [9]. The number of PBF–LS/AlSi10Mg specimens used was 27. One specimen was used for each instance of post-processing and seven (7) post-processing were examined. Three (3) as-built specimens were used to determine the variation in the fatigue life. To obtain the S-N curves and fatigue strength, 17 of the 27 specimens were used. In order to investigate LCP intensity, the arc height of the stainless steel plate was measured considering the Society of Automotive Engineers SAE standard J442 [70] and J443 [71]. The stainless steel used was Japanese Industrial Standard JIS SUS304; the size was 20 mm × 50 mm and the thickness was 1.5 mm. An N-gauge Almen strip was also used. One specimen was used for each condition and the arc height at three (3) different positions was measured to find the standard deviation.

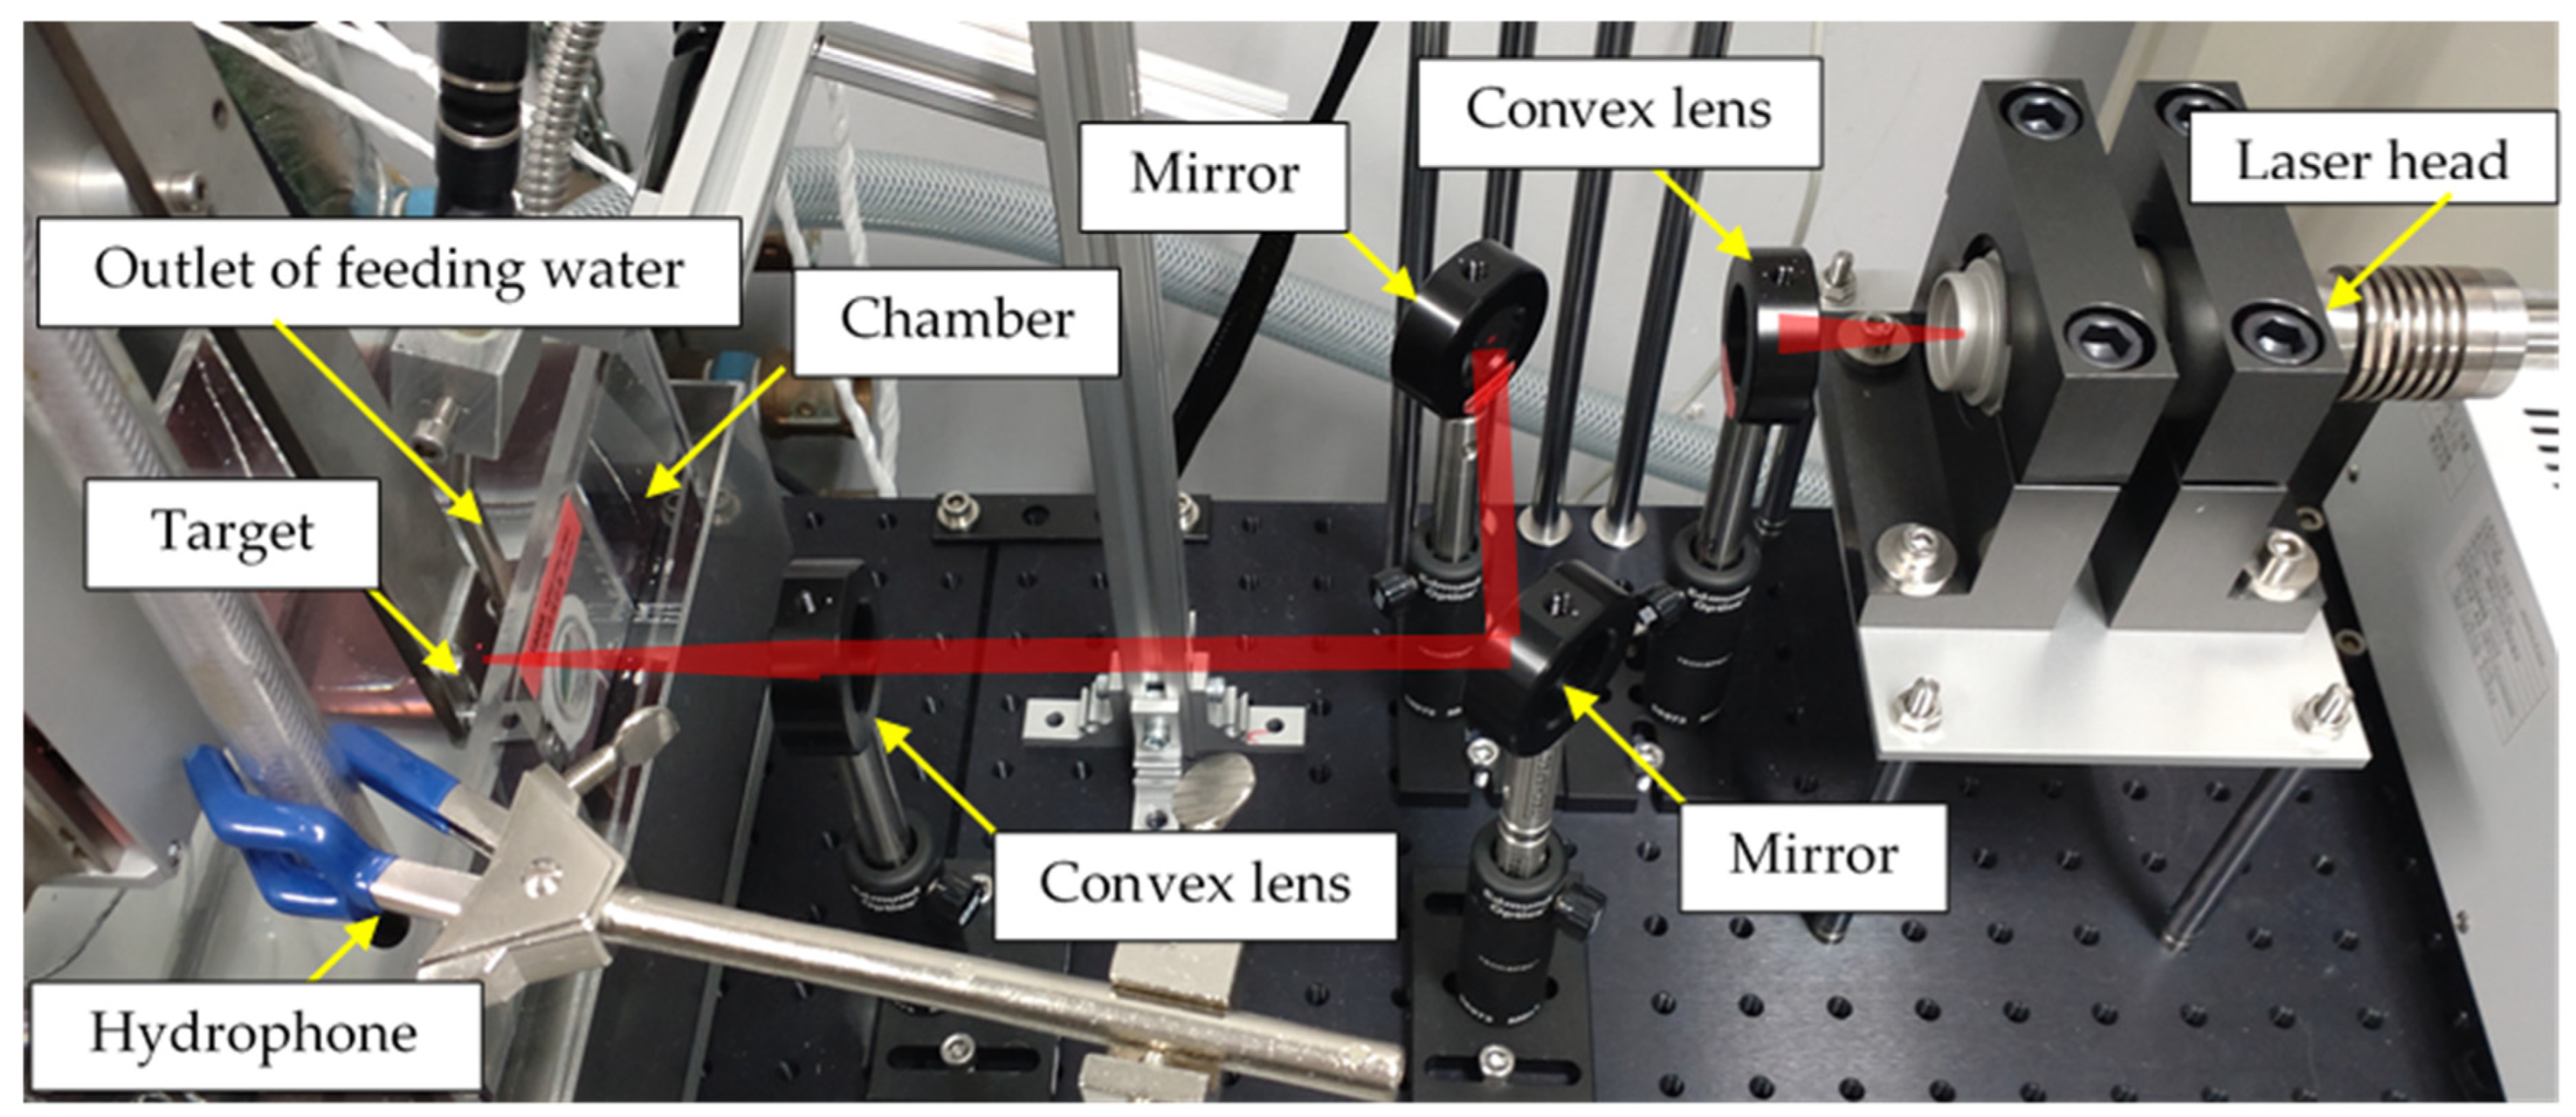
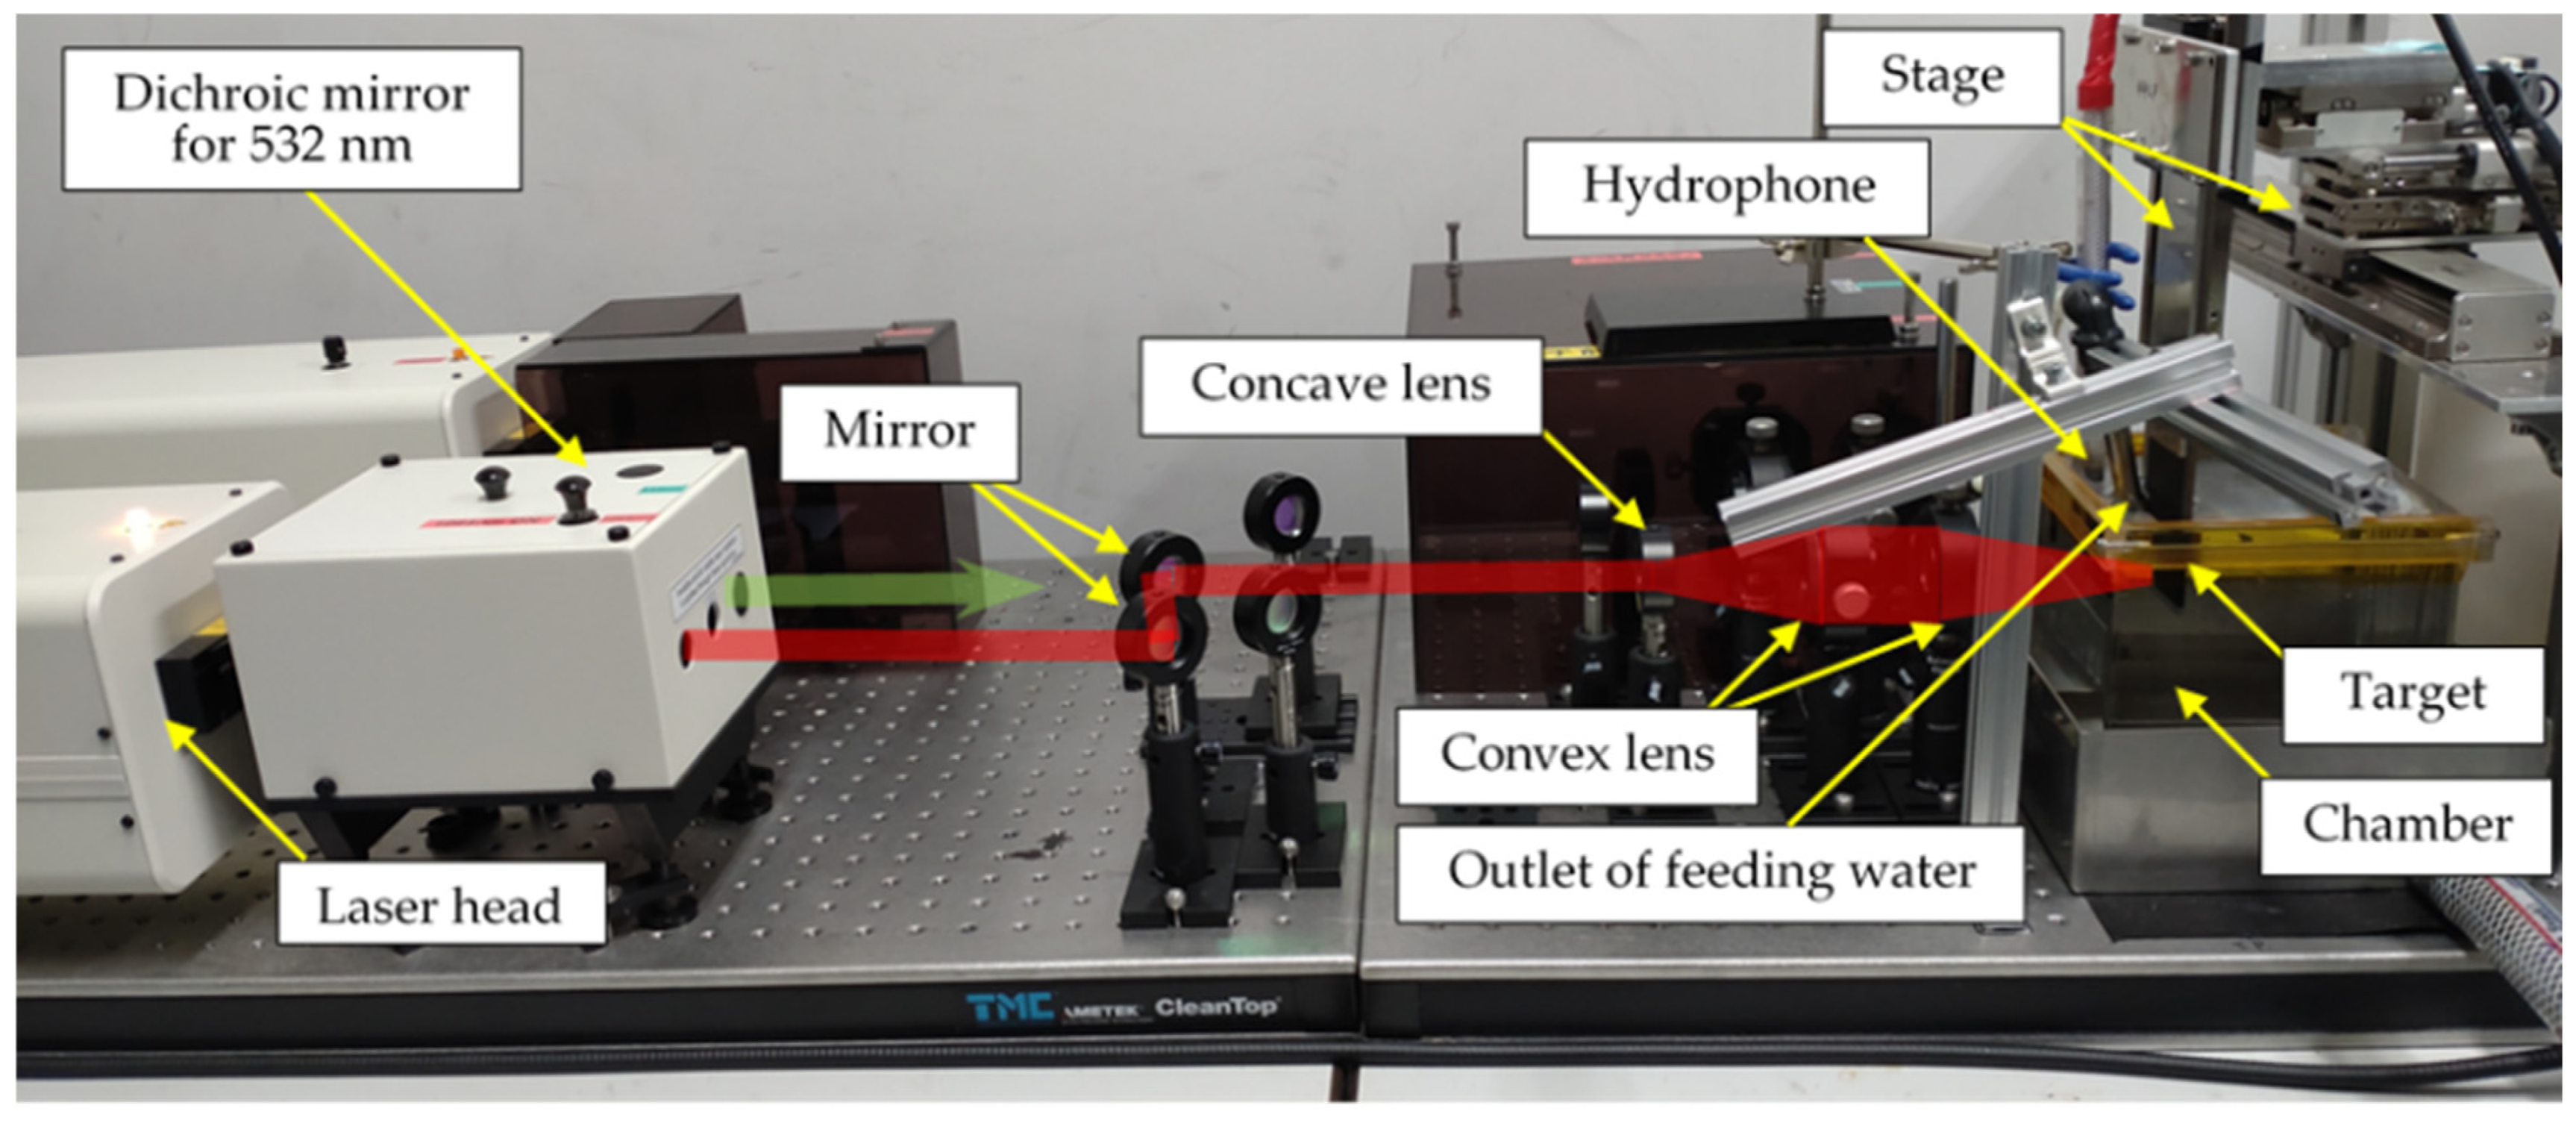
2.2. Post-Processing

In order to demonstrate an improvement in the fatigue properties via SLP using a fiber laser and/or a Nd/YAG laser with a Q-switch, the specimen was treated via SLP. Figure 3 illustrates a schematic of a test section of SLP system. A pulsed laser from a fiber laser or a Nd/YAG laser was used to irradiate the specimen, which was placed in a water-filled chamber, by focusing the convex lens. The standoff distance in air sa and in water sw were defined, as shown in Figure 3. The specimen was placed on a stage, which was moved using linear stepping motors in vertical and horizontal directions. The laser pulse density ρL [pulse/mm2] was controlled by the horizontal velocity vh [mm/s] and the stepwise movement in the vertical direction sv [mm], using the stepping motors. When the repetition frequency of the laser was fL [Hz; pulse/s], ρL can be defined by Equation (1):
ρ L = f L     v h   s v
In order to avoid a cushion effect during LC collapse, degassed water was fed into the chamber [72]. A hydrophone (Miniature Hydrophone Type 8103, Brüel & Kjær, HBK Company, Virum, Denmark) was placed in the chamber to monitor LC size, as the most important LCP parameter is LC size, because the energy generated by the cavitation collapse is proportional to the volume of the cavitation bubble [73], and it has been reported that the number of photons is proportional to the maximum diameter of the bubble [74]. Namely, a larger cavitation bubble produces a larger impact during cavitation bubble collapse [75,76]. The signal was connected to a pre-amplifier (Charge conditioning amplifier 2692, Brüel & Kjær, HBK Company, Virum, Denmark) and recorded using a digital oscilloscope (DPO3054, Tektronix, Inc., Beaverton, OR, USA).
LC size was monitored according to the developing time tD of LC obtained from the signal from the hydrophone, detailed as follows. In regard to Rayleigh [77], the collapse time, tc, in terms of the initial radius of the bubble, R0, until the collapse, can be calculated using Equation (2):
t c = 0.91468   R 0     ρ   p
When the values, i.e., the pressure p = 0.1013 MPa and the density of the water ρ = 998 kg/m3, are substituted into Equation (2), Equation (3) is obtained:
R 0   m m = 0.0111   t c   [ μ s ]
Regarding the previous report [72], when tD is defined by the time from LA to LC collapse, dmax [mm] is proportional to tD [μs], and this relationship can be described as Equation (4):
d m a x [ m m ] = k   t D   [ μ s ]    
Here, k is the proportional constant; it was 0.0103 in the previous report, and this is shown to be reasonable, by comparing it with 0.0111 in Equation (3). Thus, the dmax of LC was monitored by tD.
The aspect of LA and LC were observed using a high-speed video camera (VW9000, Keyence Corporation, Osaka, Japan). The full frame size was 640 pixels × 640 pixels and the maximum frame rate for the full frame was 4000 frames per second. The maximum frame rate was 230,000 frames per second and the frame size was 160 pixels × 32 pixels.
Figure 4 shows a diagonal view of SLP system using a fiber laser (High-power laser system JL-SP0272, Japan Laser Corporation, Tokyo, Japan). The maximum power was 500 W in CW mode, the wavelength was 1080 ± 2 nm, the maximum repetition frequency was 50 kHz, the working minimum pulse width was 20 μs, the laser beam diameter was 2 mm, the beam quality of the laser output was ±2%, and the maximum divergence was 140 mrad. In Figure 4, the laser beam passage is shown using a semi-transparent red line. Due to the divergence of the fiber laser, a convex lens with a focus distance of 50 mm was placed near the laser head of the fiber laser. The laser beam was reflected by mirrors and then focused by the other convex lens, of which the focus distance was 50 mm. The chamber used had a window made of synthetic silica. The estimated focal spot size measured by the ablation area using the three aluminum specimens was 0.241 ± 0.014 mm at tw = 300 μs and sw = 8 mm.
Figure 5 shows a diagonal view of SLP system using a Nd/YAG laser (SureliteTM SL I-10, Continuum®, Amplitude Laser Inc., San Jose, CA, USA). Although the Nd/YAG laser that was used can generate wavelengths at both 532 nm and 1064nm, the used wavelength was 1064 nm, considering the previous report [72]. The pulse width, the repetition frequency, the energy, the beam quality of the laser output, the laser beam diameter, and the divergence was 6 ns, 10 Hz, 0.33 J, ±2%, 6 mm, and 0.5 mrad, respectively. The laser beam is also indicated by the semi-transparent red line in Figure 5. The laser beam was reflected by the mirrors and expanded by a concave lens, the focus distance of which was 100 mm, and a convex lens produced a parallel beam and then focused it, to avoid damage to the chamber made of hard glass. The estimated focal spot size measured by the ablation area using the three aluminum specimens was 1.493 ± 0.017 mm.

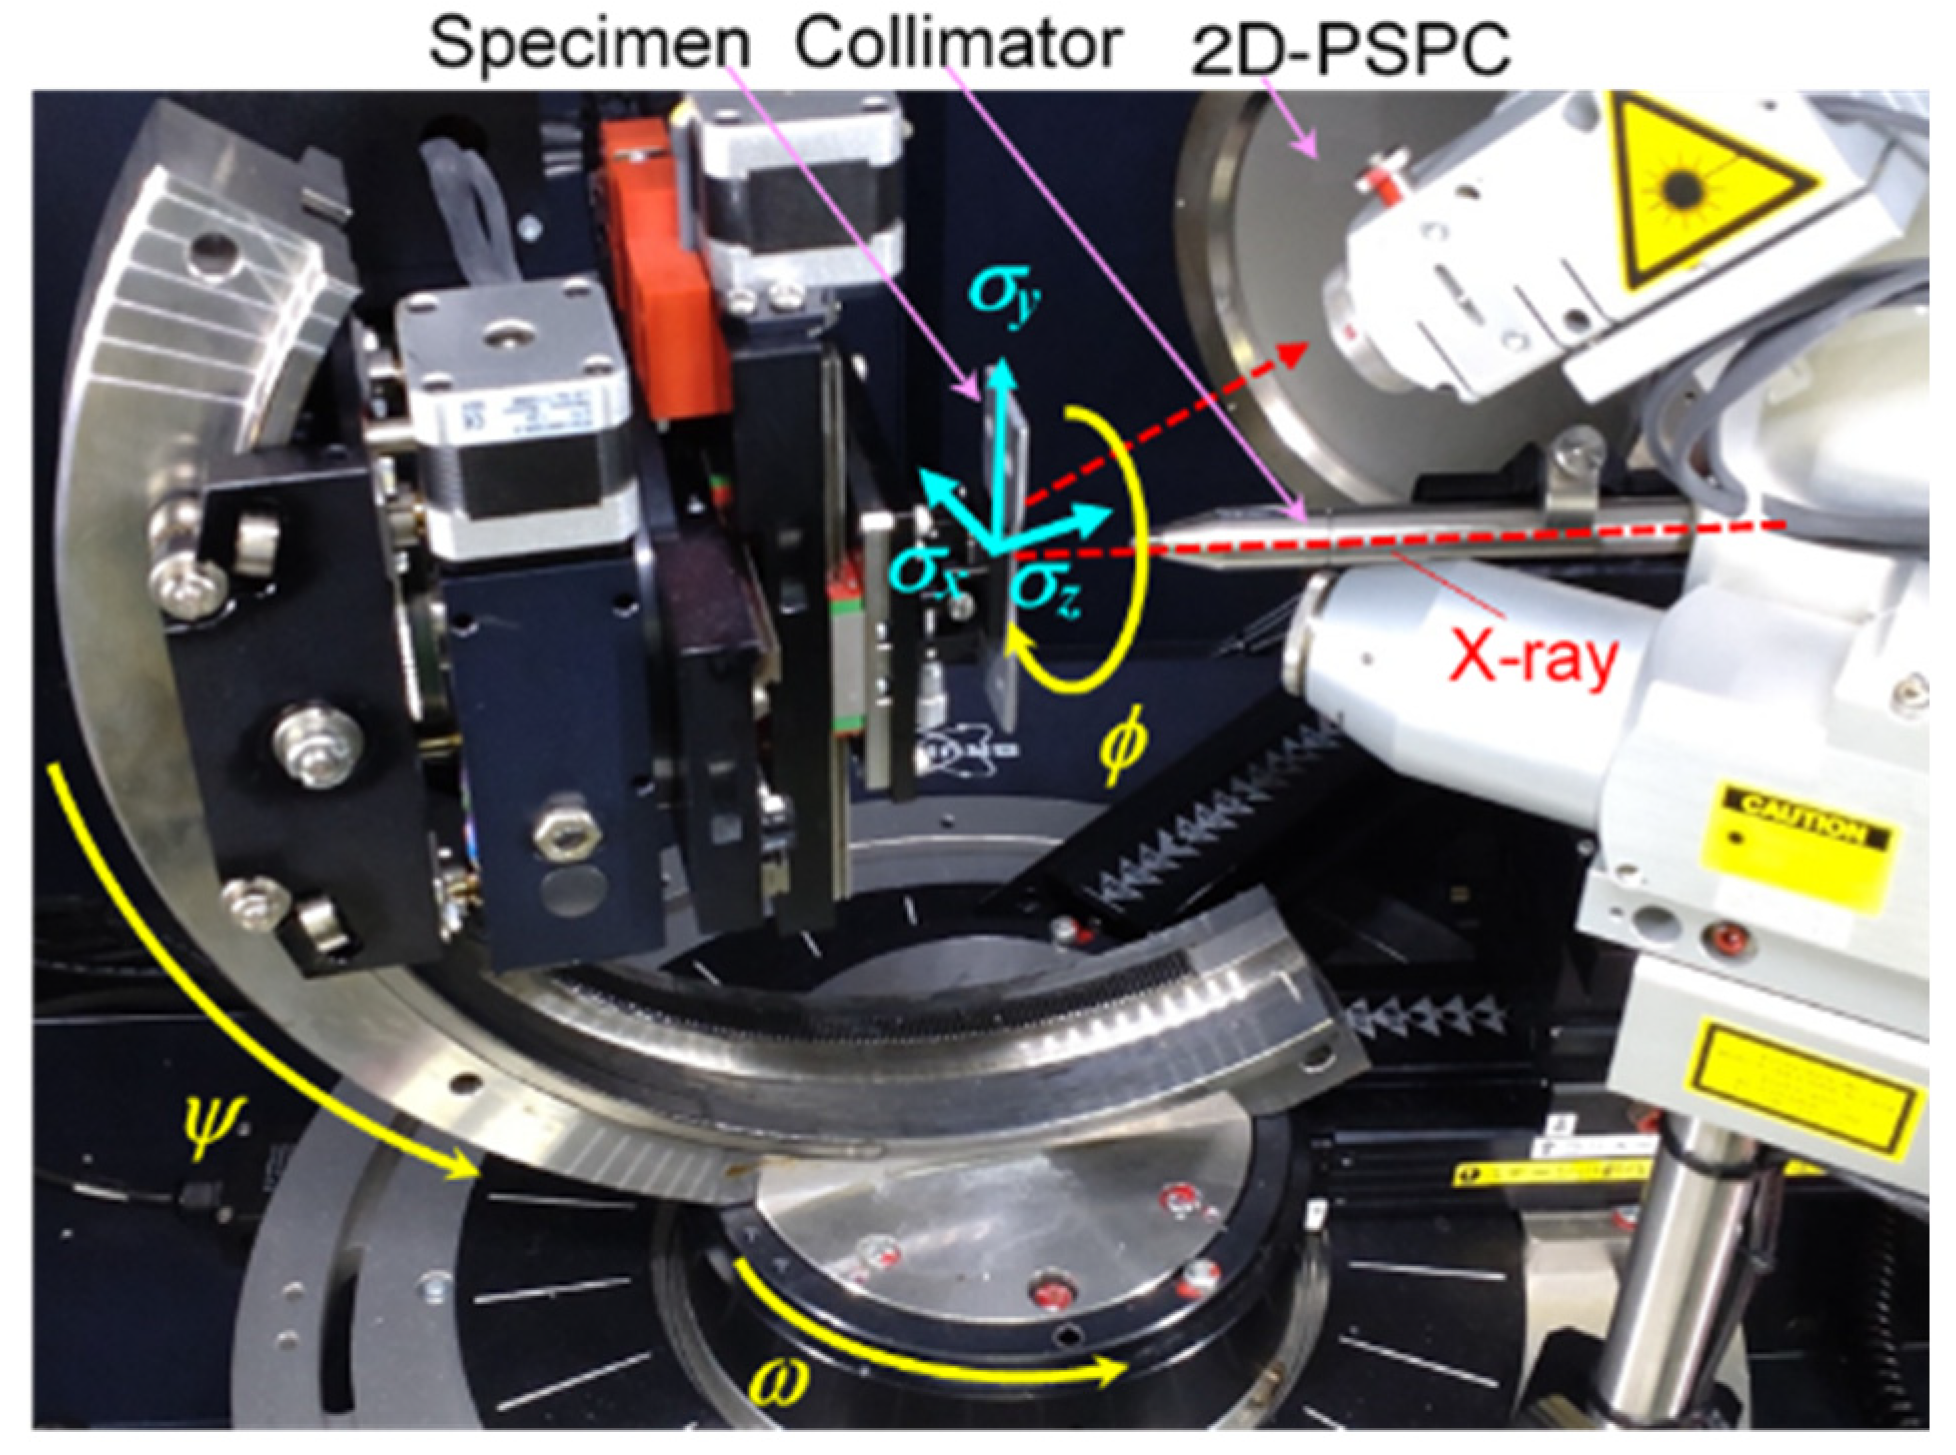
2.3. Fatigue Testing and Measurement of Surface Characteristics

For the fatigue tests, both moment-controlled (Advanced PBF, Tokyo Koki Testing Machine Co., Ltd., Sagamihara, Japan) and displacement-controlled (PBF-30, Tokyo Koki Testing Machine Co., Ltd., Sagamihara, Japan) plane bending fatigue test machines were used. The moment-controlled machine was used to evaluate the fatigue life at a constant maximum amplitude of applied stress, σa, as the bending stiffness of the specimen was slightly changed during post-processing. In order to obtain the fatigue strength, the displacement-controlled machine was used, as the maximum working frequency was 25 Hz for the displacement-controlled machine and 2 Hz for the moment-controlled machine. With both machines, the stress ratio R was set as −1 for all the fatigue tests. The applied stress σa in the test was calculated from the bending moment M, the width of the specimen b (i.e., 20 mm), and the thickness δ measured with a micrometer, with an accuracy of 0.001 mm, as shown in Equation (5):
σ a = 6   M b   δ 2    
With the moment-controlled machine, the misalignment of a specimen resulting from the PBF–LS and the post-processing was corrected by the angle of the servomotor, which controlled the angle instantaneously by measuring the moment. Both the amplitude of the angle θa and the moment were monitored and recorded during the fatigue test to make clear the difference in the bending stiffness; a specimen was considered as having failed once the angle had reached +10° or −10°.
With the displacement-controlled machine, the misalignment was corrected by the initial position of the motor. The applied bending moment was monitored by a load cell, and when the bending moment reached about 20% of the applied bending moment, it was classed as a failure. The fatigue strength and its standard deviation were calculated using Little’s method [78].
In order to investigate the effect of post-processing on residual stress, the residual stress σR on the surface was evaluated via the 2D method [79], using an X-ray diffraction (XRD) system with a two-dimensional (2D) position-sensitive proportional counter (PSPC) (D8 Discover, Bruker Japan K. K., Tokyo, Japan). The X-rays used were Cu-Kα rays (wavelength: 0.1540 Å) operated at 40 kV and 40 mA. The lattice plane (h k l) used was the Si (5 3 3) plane, and the diffraction angle without strain was 136.9 degrees. The diffracted X-rays were collected by scanning the specimen surface over an 8 mm × 8 mm area, using a 0.8 mm diameter collimator. The 24 diffraction rings from the specimen at various specimen angles ϕ and incident angles ψ of the X-ray were detected (see Figure 6), and the exposure time per frame at each single position was 1 min. It should be noted that the initial position of ω was set as 116° and it moved to 108° over 1 min to obtain a better Debye ring. The residual stress was calculated using the relevant software (Leptos version 7.9, Bruker Japan K. K., Tokyo, Japan). Young’s modulus and Poisson’s ratio were 167.2 GPa and 0.221, respectively. The analyzed area of the obtained X-ray diffraction covered the range of the diffraction angle (2θ = 134°–140°), and the analyzed area of the Debye ring direction (χ) was in the range of χ = 65°–115°. The details of the 2D method are set out in reference [79]. As mentioned above, the bending stress applied in the longitudinal direction of the specimen and the residual stress applied in the longitudinal direction of the specimen, i.e., σy in Figure 6, are discussed in this paper. The full width at half the maximum of the X-ray diffraction pattern FWHM for each specimen was measured at ϕ = 0°, 45°, and 90° and, then, the averaged value and the standard deviation were obtained.
In order to elucidate the effects of the surface characteristics on the fatigue properties, the surface roughness and hardness were also measured. The arithmetic mean surface roughness Ra was measured using a stylus-type profilometer (Surfcom Touch 50, Tokyo Seimitsu Co., Ltd., Hachioji, Japan), with a cutoff length of 8 mm and a measuring length of 40 mm. The Ra was measured in accordance with International Organization for Standardization (ISO) 21920 [80]. To reveal the standard deviation of the surface roughness, the surface roughness at three (3) different positions was measured. As the surfaces of the specimens were very rough, the surface hardness was measured using a Rockwell superficial hardness tester (ATK-F1000, Akashi Corporation, Tokyo, Japan). For the Rockwell superficial hardness test, a 120° circular diamond cone indenter was used. The initial load was 3 kgf (29 N) and the applied load was 15 kgf (147 N). The hardness was measured seven times in each case, and the average value and standard deviation were obtained from all the values, excluding the highest and lowest values. The surface of the specimens was observed using a digital microscope (VHX-2000, Keyence Corporation, Osaka, Japan) and a scanning electron microscope (SEM) (JCM-7000, JEOL Ltd., Akishima, Japan).

3. Results

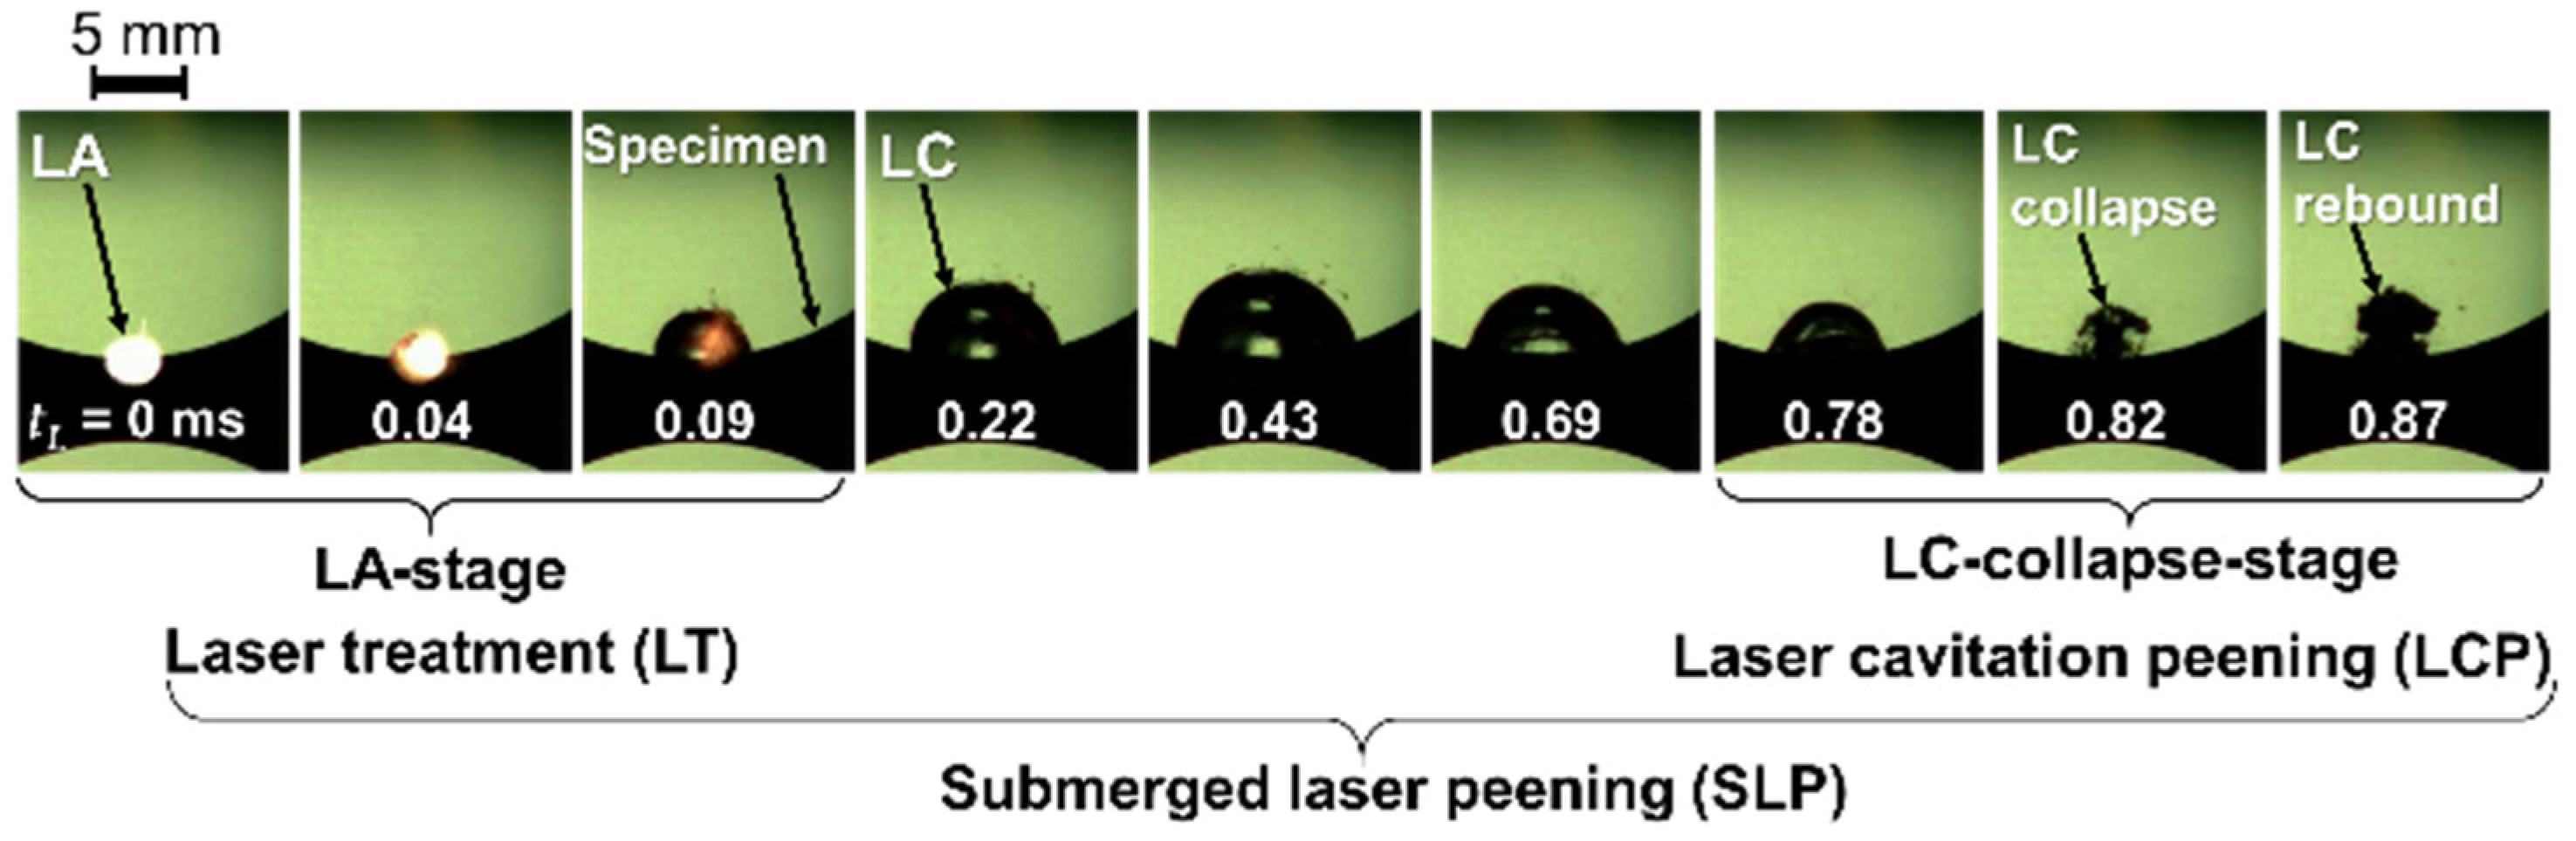
3.1. Laser Ablation (LA) and Laser Cavitation (LC) Generated by a Nd/YAG Laser and a Fiber Laser

In order to reveal the typical aspects of SLP, i.e., LA and LC, the aspects of the surface irradiated by the Nd/YAG laser and observed by the high-speed video camera are shown in Figure 7a,b, which shows the signal detected by the hydrophone that was recoded simultaneously with the high-speed video camera. At tL = 0 ms, LA was observed, as in Figure 7a, and peaks were observed, as in Figure 7b. As shown in Figure 7a, a hemispherical bubble, i.e., LC, developed, and it had a maximum diameter dmax at tL = 0.53 ms, and shrunk, and then collapsed at tL = 1.05 ms. The dmax was 11.2 mm and the tD was 1,050 μs. Thus, k in Equation (4) was 0.0107, which was 104% of 0.0103 [72] and 96% of 0.0111 in Equation (3). As shown in Figure 7b, peaks were observed at tL = 1.05 ms. The peak–peak at tL = 1.05 ms was about 180 kPa and it was 12.5% larger than that at tL = 0 ms. As shown in Figure 7a, LC developed again and then collapsed for a second time at tL = 1.67 ms.
In order to investigate the potential of SLP using the fiber laser, Figure 8 shows the aspect and the noise generated by the fiber laser at tw = 20 μs and 300 μs. As sa = 55 mm and sw = 8 mm were chosen, the noise could not be recorded with the video simultaneously due to the size of the hydrophone, in order to avoid the hydrophone blocking the light. Thus, the video and the noise were recorded separately. As shown in Figure 8a,b, LA was observed at tL = 0 ms and LC was generated after LA; LC developed and then collapsed. As shown in Figure 8a, at tw = 20 μs, the first collapse of LC occurred at tL = 0.25 ms and the second collapse occurred at tL = 0.41 ms. As shown in Figure 8b, the amplitude of ps increased at tL = 0 ms due to LA and increased again at tL = 0.25 ms due to the first collapse of LC. The maximum amplitude of ps during the first collapse of LC was about three times greater than that of LA. Thus, SLP using the fiber laser produced an LC collapse impact that was greater than that of LA.
In the case of tw = 300 μs, the first collapse of LC occurred at tL = 0.33 ms and the second collapse occurred at tL = 0.56 ms, as shown in Figure 8c. Where the noise was concerned, the amplitude had a peak at tL = 0 ms and tL ≈ 0.5 ms. As mentioned previously, the video and the noise were not recorded simultaneously, to avoid the hydrophone blocking the light. From the data recorded on the video and the noise, the amplitude of the noise did not have a peak during the first collapse of LC, as the heat of the fiber laser was poured into LC for 0.3 ms, as tw = 300 μs was nearly equal to the time of the first collapse.
When the dmax of tw = 20 μs and tw = 300 μs were compared, it was 2.2 mm for tw = 20 μs and 2.8 mm for tw = 300 μs. The maximum amplitude of the noise was about 5 kPa for tw = 20 μs and 0.9 kPa for tw = 300 μs. Thus, the impact of LC collapse of tw = 20 μs was 5.5 times larger than that of tw = 300 μs, whereas the dmax of tw = 300 μs was 1.3 times larger than that of tw = 20 μs. This result shows that the larger LC of tw = 300 μs generated weaker noise than the smaller LC of tw = 20 μs. This might be caused by a cushion effect [72], due to too much heat from the pulsed laser energy at tw = 300 μs. When k in Equation (4) was calculated, it was found to be 0.0088 for tw = 20 μs and 0.0085 for tw = 300 μs. In other words, k was smaller than that of the Nd/YAG laser. This means that the collapsing of LC induced by the fiber laser was slower than that induced by the Nd/YAG laser. Additionally, LC at tw = 300 μs was slower than that at tw = 20 μs. This suggests that LC induced by the longer tw had a larger cushion effect and produced a weaker impact.
Regarding a previous study, LCP intensity was nearly proportional to the volume of LC considering the threshold of the target material and it was also proportional to the square of the pressure amplitude [72]. When it was assumed that LCP intensity of the fiber laser and the Nd/YAG laser was proportional to the volume of LC, LCP intensity of a single impact in regard to the Nd/YAG laser, whose dmax was 11.2 mm, was 132 times larger than that of the fiber laser, which was tw = 20 μs, as the dmax was 2.2 mm. In terms of noise, the maximum amplitude of the Nd/YAG laser was about 80 kPa and that of the fiber laser of tw = 20 μs was about 5 kPa, and (80/5)2 is 256. Thus, in the present condition, LCP noise for the Nd/YAG laser was 136–256 times stronger than LCP noise for the fiber laser, as the volume of LC produced by the Nd/YAG laser was 132 times larger than that produced by the fiber laser. As mentioned above, as the maximum repetition frequency of the fiber laser was 50 kHz, which was 5,000 times larger than that of the Nd/YAG laser, the fiber laser could be used for LCP, if parameters, such as the tw, sw, sa, or the focal distance of the convex lens, are optimized. However, SLP using the fiber laser was optimized to be used for LT in this paper.

3.2. Determination of Submerged Laser Peening (SLP) Conditions Using a Fiber Laser

As this is the first report on SLP using a fiber laser, the effect of parameters, such as the tw and sw on SLP, were investigated. Figure 9 and Figure 10 reveal the arc height h changing with the tw and sw, respectively. In both cases, sa was set at 55 mm. In order to obtain Figure 9, sw was 8 mm and the repetition frequency was chosen so that the laser energy per unit of time was equivalent. To obtain Figure 10, tw was set at 300 μs, the repetition frequency was 300 Hz, and ρL = 50 pulse/mm2, considering the results in Figure 9. Under these conditions, all the specimens were deformed, with a concave treated surface. In conventional SLP using the Nd/YAG laser, the specimens were deformed with a convex treated surface, as the treated surface was plastically elongated. A composite plate made of an elongated surface layer and a base metal forms a convex shape, compressive residual stress is introduced to the surface due to compression from the base metal, and then the compressive residual stress improves the fatigue properties. On the other hand, a composite plate made of a shrunk surface layer and a base metal forms a concave shape, the tensile residual stress is introduced to the surface due to tension from the base metal, and the tensile residual stress is a drawback of the fatigue properties. The present results showing the deformation of the treated surface into a concave surface clearly indicates that the treated surface was shrinking. As mentioned later, tensile residual stress was introduced. As shown in Figure 1, SLP is divided into two stages, i.e., LA stage and LC collapse stage. During LA stage, the surface is melted by the heat energy from the pulsed laser. Although LC collapse noise produced by the fiber laser was detected, as shown in Figure 8b, SLP using the fiber laser was governed by LA stage rather than LC collapse stage. Then, as shown in Figure 1, SLP governed by LA stage is classified as a laser treatment (LT) in this paper. Thus, SLP using the fiber laser will henceforth be referred to as LT. Therefore, SLP using the fiber laser was chosen as the condition that caused the most deformation in regard to a concave surface, i.e., tw = 300 μs and sw = 8 mm.

3.3. Aspects of Surface Treated by Post-Processing Methods

The aspects of the treated surfaces observed using a digital microscope and SEM are shown in Figure 11 and Figure 12, respectively. Figure 11 and Figure 12 reveal the results for the: (a) as-built surface, (b) laser treatment (LT (SLP using the fiber laser)), (c) blasting (B), (d) laser cavitation peening (LCP (SLP by the Nd/YAG laser)), (e) blasting + laser treatment, (f) laser treatment + laser cavitation peening, (g) blasting + laser cavitation peening, and (h) blasting + laser treatment + laser cavitation peening. For the laser treatment (LT), i.e., SLP using the fiber laser, the repletion frequency, the pulse width tw, and the pulse density ρL were 300 Hz, 300 μs, and 50 pulse/mm2, respectively. The blasting (B) was carried out at an air pressure of 0.7 MPa, using garnet #150, considering the previous report. In regard to the laser cavitation peening (LCP), i.e., SLP using the Nd/YAG laser, the repetition frequency was 10 Hz and the ρL was 4 pulse/mm2, considering previous reports [9,50]. “B + LT” means that LT was carried out after B. “LT + LCP” means that LCP was carried out after LT. “B + LCP” means that LCP was carried out after B. “B + LT + LCP” means that LT was carried out after B, and then LCP was carried out.
On the as-built surface, partially melted particles were observed, as shown in Figure 11a and Figure 12a. Deep valleys, which lay perpendicular to the building direction, were also observed, and the bottoms of the valleys were very sharp, as shown in Figure 12a. These surface defects might become crack sources during fatigue.
When the as-built surface was treated with LT, many columnar structures were observed, as shown in Figure 11b and Figure 12b. The pulsed laser ablated Al phase, then the Si phase, which are shown as columnar structures, remained.
Due to the blasting (B) of the as-built surface, the sharp edges were roughened, as shown in Figure 12c. These roughened surfaces reduced the reflection of the pulsed laser, meaning that LA effect increased. In other words, blasting enhanced the effect of LT and/or LCP.
In the case of LCP, microstructures and small circular defects were observed, as shown in Figure 11d and Figure 12d. These structures were produced by LA of ns second laser pulses.
When the surface was treated with LT after blasting, circular defects, which were larger than those in LCP, were observed, as shown in Figure 11e and Figure 12e. Under this condition, the power was 45 W for LT, i.e., SLP with the fiber laser, and 3 W for LCP, i.e., SLP with the Nd/YAG laser. In other words, the greater laser power melted the surface and this produced large circular defects.
After LT + LCP, microstructures were observed, with a size in between those for the surfaces treated with LT or LCP, as shown in Figure 11f and Figure 12f. The surface was partially melted by LT, and the surface showed a similar aspect in Figure 11e and Figure 12e, then it was ablated through LCP, i.e., a short, pulsed laser of 6 ns in terms of the pulse width.
When the surface was treated with LCP after blasting (see Figure 11g and Figure 12g), the microstructures seemed to be slightly larger than those treated with LCP only. As mentioned above, the blasted surface was more likely to absorb laser energy, meaning that the surface was considered to be more melted.
As shown in Figure 11h and Figure 12h, with the B + LT + LCP, the surface was melted by the fiber laser and then ablated by the Nd/YAG laser. The microstructures were similar to those in Figure 11g and Figure 12g, and the size of the microstructures was slightly larger than those for the B + LCP treatment, as the surface was melted by LT.
In order to show the fracture location and the morphology, Figure 13 reveals the aspect of the fractured specimen tested at σa = 110 MPa, by using the moment-controlled plane bending fatigue tester. The post-processing conditions used to obtain Figure 13 were the same conditions as in Figure 11 and Figure 12. In the case of Figure 13a for the as-built, (b) LT, and (e) B + LT treatments, the crack was propagated with kinking. As shown in Figure 13d,f, the crack was also propagated with kinking and some of the crack paths were parallel to LCP pattern. This tendency suggests that there was a localized, weak region, parallel to LCP pattern.

3.4. Effects of Post-Processing on Fatigue Properties and Surface Properties

In order to reveal the effects of the post-processing used, i.e., blasting (B), laser treatment (LT), laser cavitation peening (LCP), and the combined processes of these post-processing methods, Figure 14 reveals: (a) the fatigue life at σa = 110 MPa evaluated using the moment-control plane bending fatigue tester, (b) the surface roughness Ra, (c) the residual stress σR, (d) the Rockwell hardness HR15T, (e) the full width at half the maximum of the X-ray diffraction pattern FWHM, and (f) the amplitude of the initial angle in the plane bending fatigue test θa. The post-processing conditions to obtain Figure 14 were the same conditions as in Figure 11, Figure 12 and Figure 13.
In the case with the fatigue life of σa = 110 MPa, the results for the as-built specimens were evaluated in triplicate and were 73,525, 73,904, and 84,822. The average value was 77,417 and the standard deviation was 6416, which was 8.28% of the average value. In the case of the post-processing methods, the fatigue life was tested once, and the error bars in Figure 14a represent 8.28% of each average value.
In LT, as shown in Figure 14a, the fatigue life was shortened, whereas the surface was smoothened (see Figure 14b). The reason could be that the residual stress after LT existed in the form of tension, as shown in Figure 14c. As shown in Figure 14e, the FWHM under LT increased drastically and the surface was melted (see Figure 11b and Figure 12b). Thus, LT melted the as-built surface and quenched the surface because of the water involved in SLP.
In the case of blasting (B), B reduced the surface roughness (see Figure 14b), introducing compressive residual stress (see Figure 14c). These effects improved the fatigue life.
In LCP, the surface was smoothened, the same as in B (see Figure 14b), and compressive residual stress was introduced (see Figure 14c). Thus, the fatigue life was improved via LCP, as shown in Figure 14a. As shown in Figure 14d, the HR15T of LCP was the smallest and the fatigue life was not the best, whereas the defects from LCP were smaller than those for the other techniques, as shown in Figure 11 and Figure 12. As shown in Figure 14f, the θa of LCP was larger than for the others, suggesting that the surface of LCP was annealed. This tendency was similar to that seen in a previous report [62]. This could be the reason why the hardness and the fatigue life of LCP were not the best.
In cases involving combined processes, including B, such as B + LT and B + LCP, the effect of LT and LCP was enhanced by B, as the blasted surface absorbed the pulsed laser energy by reducing the reflection. For example, the surface roughness of B + LT or B + LCP was smoother than that of LT or LCP (see Figure 14b). The residual stress of B + LT included more tension than that of LT and the residual stress of B + LCP included more compression than that of LCP, as shown in Figure 14d. In the case of the combined process LT + LCP, the introduced residual stress was −480 ± 24 MPa, which was more compression than LCP only (−135 ± 20 MPa), whereas LT introduced tensile residual stress (412 ± 31 MPa).
As shown in Figure 14d, the Rockwell hardness HR15T was increased by LT + LCP and B + LT + LCP. It was also slightly increased by LT and B. On the other hand, HR15T was reduced by LCP and B + LCP. As the surface roughness of the as-built surface was very high, the scatter band in all cases was large. Thus, it was very difficult to evaluate the hardness of the surface of the as-built PBF–LS/AlSi10Mg specimens.
As shown in Figure 14a, regarding the fatigue life at σa = 110 MPa, B + LT + LCP was the best, LT + LCP was second, B + LCP was third, and B and LCP were fourth. Thus, B + LT + LCP was chosen as the post-processing technique for the evaluation of the fatigue strength. As previously reported, LCP was shown to be better when compared with SP and CP via jet, and the fatigue strength of LCP was also examined.
In order to reveal the improvement in the fatigue strength of as-built PBF–LS/AlSi10Mg specimens via the post-processing methods used, Figure 15 illustrates the S-N curve for as-built, LCP, and B + LT + LCP specimens obtained using the displacement-controlled plane bending fatigue test. The post-processing conditions used to obtain Figure 15 were the same conditions as those for Figure 11, Figure 12, Figure 13 and Figure 14. That is to say, blasting (B) was carried out at air pressure of 0.7 MPa, using garnet #150. In LT with the fiber laser, the repletion frequency, the pulse width tw, and the pulse density ρL were 300 Hz, 300 μs, and 50 pulse/mm2, respectively. LCP using the Nd/YAG laser was carried out at a repetition frequency of 10 Hz and ρL = 4 pulse/mm2 [9,50]. To compare the fatigue properties of the as-built PBF–LS/AlSi10Mg specimens with cast AlSi10Mg, the S-N curve for smooth specimens was evaluated using the cyclic bending multiple fatigue test at R = −1 [81], which is illustrated in Figure 15. As shown in Figure 15, the fatigue properties of the as-built PBF–LS/AlSi10Mg specimens were weak compared with cast AlSi10Mg. When the fatigue strength at N = 107 was calculated using Little’s method [78], it was 54 ± 9 MPa for the as-built specimen, 85 ± 10 MPa for LCP, and 103 ± 12 MPa for B + LT + LCP. Thus, B + LT + LCP enhanced the fatigue strength of the PBF–LS/AlSi10Mg specimens by 1.91 times compared with the as-built specimen, and this strength was greater than that achieved with LCP alone.
In order to compare the present results with previous findings in references [16,24,26], Table 1 shows the fatigue strength of as-built and post-processing PBF–LS/AlSi10Mg specimens. The improvement ratio comparing as-built and those after post-processing with B + LT + LCP was better than the previously reported results, except for the notched one, as the fatigue strength of the notched as-built specimen was quite weak. Thus, the proposed post-processing technique is worth utilizing in practical applications.

3.5. Estimation of Improvement in Fatigue Life via Post-Processing Using Surface Roughness, Residual Stress, and Hardness

In order to determine the key parameters for the improvement of the fatigue properties of PBF–LS/AlSi10Mg specimens via post-processing methods, an estimation method for improving the fatigue life was discussed. Because the fatigue properties needed to be estimated from key parameters, the key parameters for improvement had to be identified.
Considering previous reports [12,14], experimental correlation formulas, which are shown in Equations (6) and (7) were proposed to estimate the improved fatigue life using the surface roughness, residual stress, and hardness. Here, Nf est and Nf AB are the estimated number of cycles and number of cycles of the as-built specimens, and cs, cR, and cH are the sensitivity constants representing the effects of the surface roughness, residual stress, and hardness, respectively. In Equations (6) and (7) the effects of the surface roughness, residual stress, and hardness are normalized by the surface roughness RaAB, the residual stress σR AB considering the applied stress σa, and the hardness HR15T AB of the as-built specimen, respectively.
N f   e s t = N f   A B 1 + c S 1 R a R a   A B + c R σ R   A B σ R σ a
N f   e s t = N f   A B 1 + c S 1 R a R a A B + c R σ R   A B σ R σ a + c H H R 15 T H R 15 T A B
The calculation of cs, cR, and cH was performed via a least-squares method, using the measured values shown in Table 2. The obtained constants, i.e., cs, cR, and cH, are shown in Table 3. The relationship between Nf exp and Nf est obtained through Equations (6) and (7) is shown in Figure 16a,b. The obtained slope abest for the relationship between Nf exp and Nf est is also shown in Table 3, with the standard deviation σs (see Equation (8)).
N f   e s t = ( a b e s t ± σ s ) N f   e x p
In Table 3, the correlation coefficient r and the determination coefficient Dc are also shown. The probability of a non-correlation pnon of 7 data was calculated from r [82].
As shown in Figure 16a,b, Nf est was proportional to Nf exp, and its slope was 1.082 ± 0.028 and 1.075 ± 0.035. When pnon is smaller than 1%, it can be said that the relationship is highly significant. As shown in Table 3, the pnon of both Equations (6) and (7) is less than 1%; thus, it can be concluded that the relationship between Nf exp and Nf est was highly significant. In other words, the improvement in the fatigue life via post-processing can be estimated using the surface roughness, residual stress, and hardness.
When the cs, cR, and cH in Table 3 were compared, cs > cR >> cH was the order obtained. This means that the contribution of surface smoothing is more effective than the introduction of compressive residual stress in the improvement of fatigue life via post-processing, and the effect of hardening is less effective than surface smoothing and the introduction of compressive residual stress. As the r in Equation (6) was nearly equal to that of Equation (7), the improvement in the fatigue life of as-built PBF–LS/AlSi10Mg specimens via post-processing can be estimated using the surface roughness and residual stress on the surface. That is to say, the main factors in the improvement of the fatigue properties of as-built PBF–LS/AlSi10Mg specimens via post-processing were the surface roughness and the residual stress on the surface.

4. Conclusions

In order to demonstrate the improvement in the fatigue properties of AM metals via submerged laser peening (SLP), AlSi10Mg that had undergone powder bed fusion (PBF) with laser sintering (LS), i.e., PBF–LS/AlSi10Mg, was treated with SLP using a fiber laser of which the maximum repetition frequency was 50 kHz and/or a Nd/YAG laser of which the maximum repetition frequency was 10 Hz, and tested via plane bending fatigue tests. In this paper, to distinguish the effect of laser ablation (LA) and laser cavitation (LC) in SLP, post-processing techniques governing the use of LA and LC were tested and were named “laser treatment (LT)” and “laser cavitation peening (LCP)”, respectively. The results obtained can be summarized as follows:
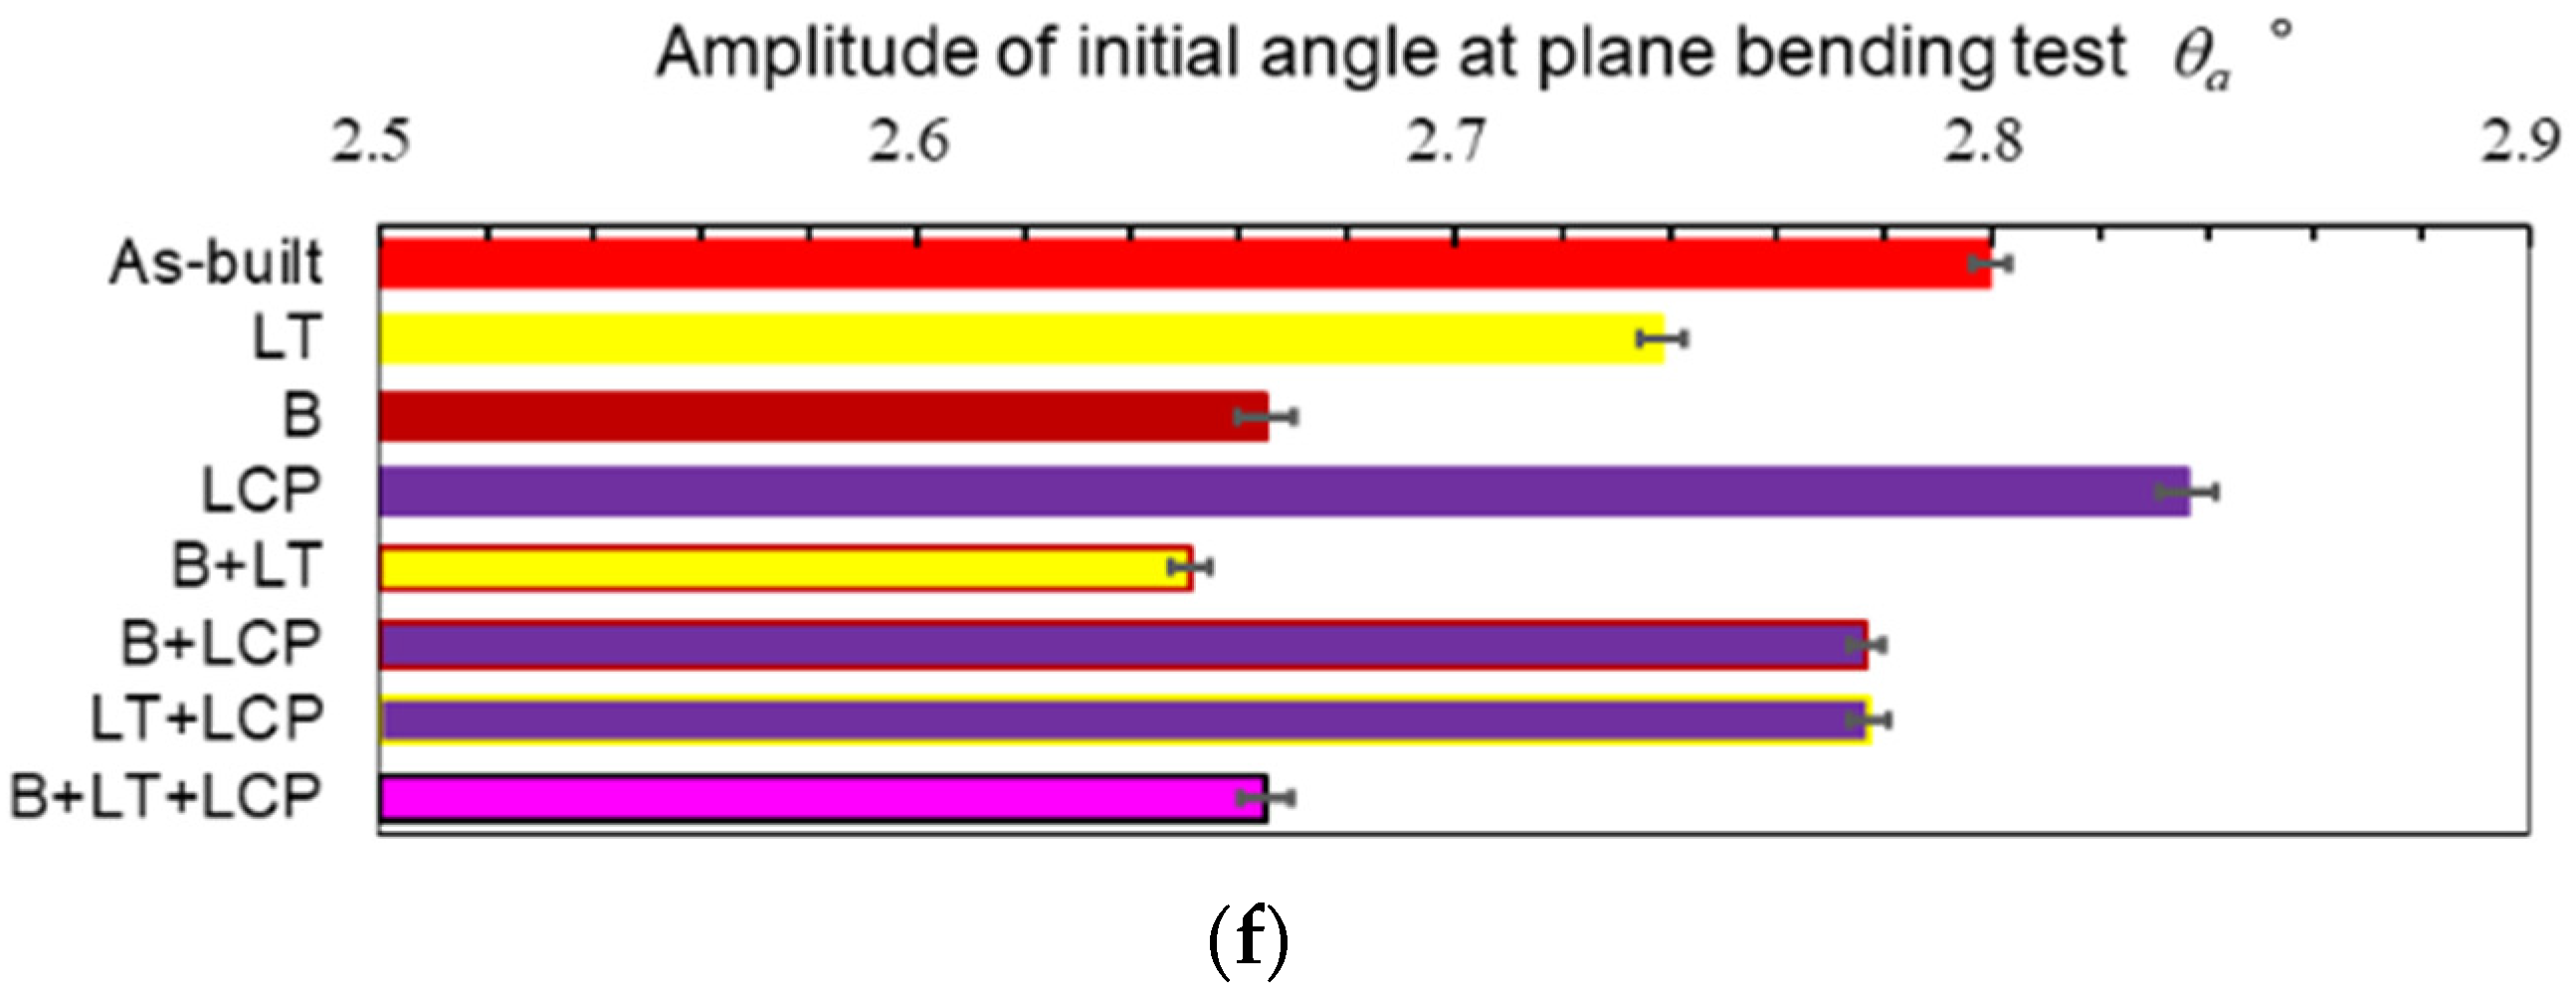
  • In SLP using a fiber laser, LC was observed. The amplitude of the pressure wave generated by LC collapse was three times larger than that for LA. Under this condition, SLP using the fiber laser smoothened the surface of the as-built PBF–LS/AlSi10Mg, and the surface residual stress was tensile after undergoing SLP using the fiber laser. Thus, SLP using the fiber laser was classified as an LT rather than an LCP;
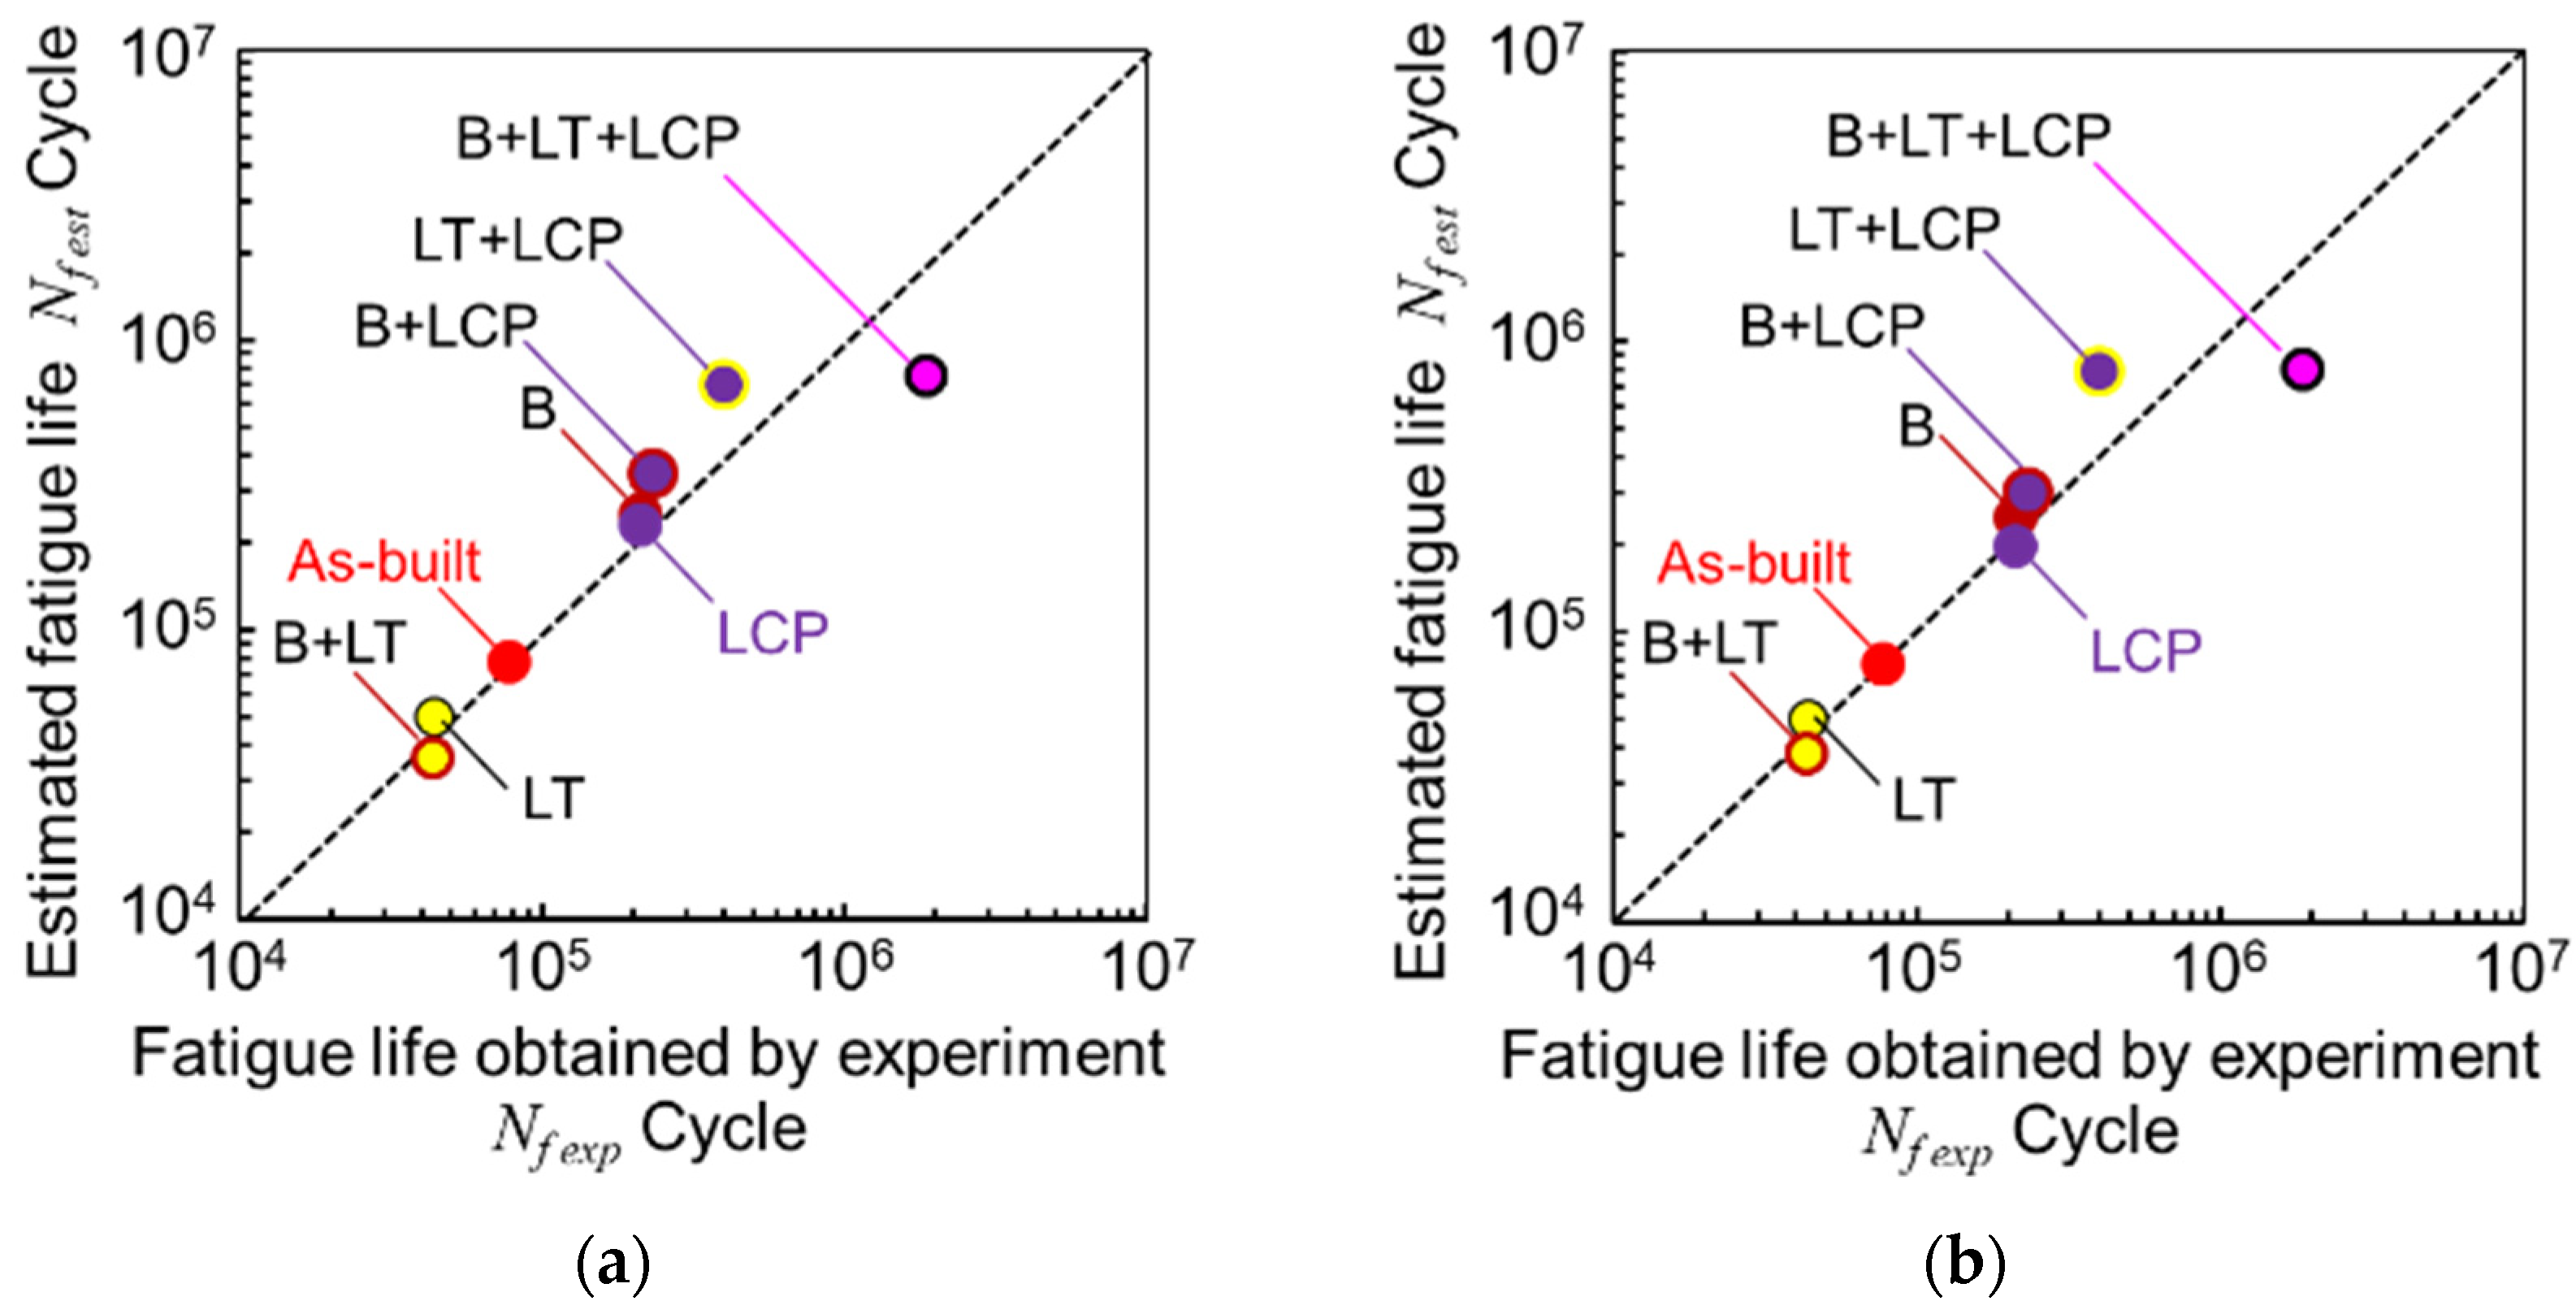
  • Blasting (B) roughened the as-built surface of PBF–LS/AlSi10Mg and enhanced the effect of the following LT, as the blasted surface absorbed the pulsed-laser energy. LT, i.e., SLP using a fiber laser, melted the as-built surface and quenched the surface, then introduced tensile residual stress. LCP, i.e., SLP using the Nd/YAG laser, introduced compressive residual stress into the as-built surface. In the case of the fatigue life at σa = 110 MPa, B + LT + LCP was best, LT + LCP came second, B + LCP came third, and B and LCP came fourth;
  • Regarding the fatigue strength of PBF–LS/AlSi10Mg at N = 107, for B + LT + LCP, this was 103 ± 12 MPa, and for LCP, it was 85 ± 10 MPa, whereas for the as-built specimen, it was 54 ± 9 MPa. Thus, B + LT + LCP improved the fatigue strength by 1.9 times compared with that of the as-built specimen;
  • LT + LCP introduced compressive residual stress (−480 ± 24 MPa) that was larger than that of enhanced LCP only (−135 ± 20 MPa). Although LT introduced tensile residual stress (412 ± 31 MPa);
  • The improvement in the fatigue strength of the as-built PBF–LS/AlSi10Mg can be estimated from the surface roughness and the surface residual stress. Hardening also contributed to the improvement in the fatigue strength; however, the contribution of hardening to the improved fatigue strength was relatively small, considering the difficulty in evaluating the hardness of as-built PBF–LS/AlSi10Mg due to the rough surface;
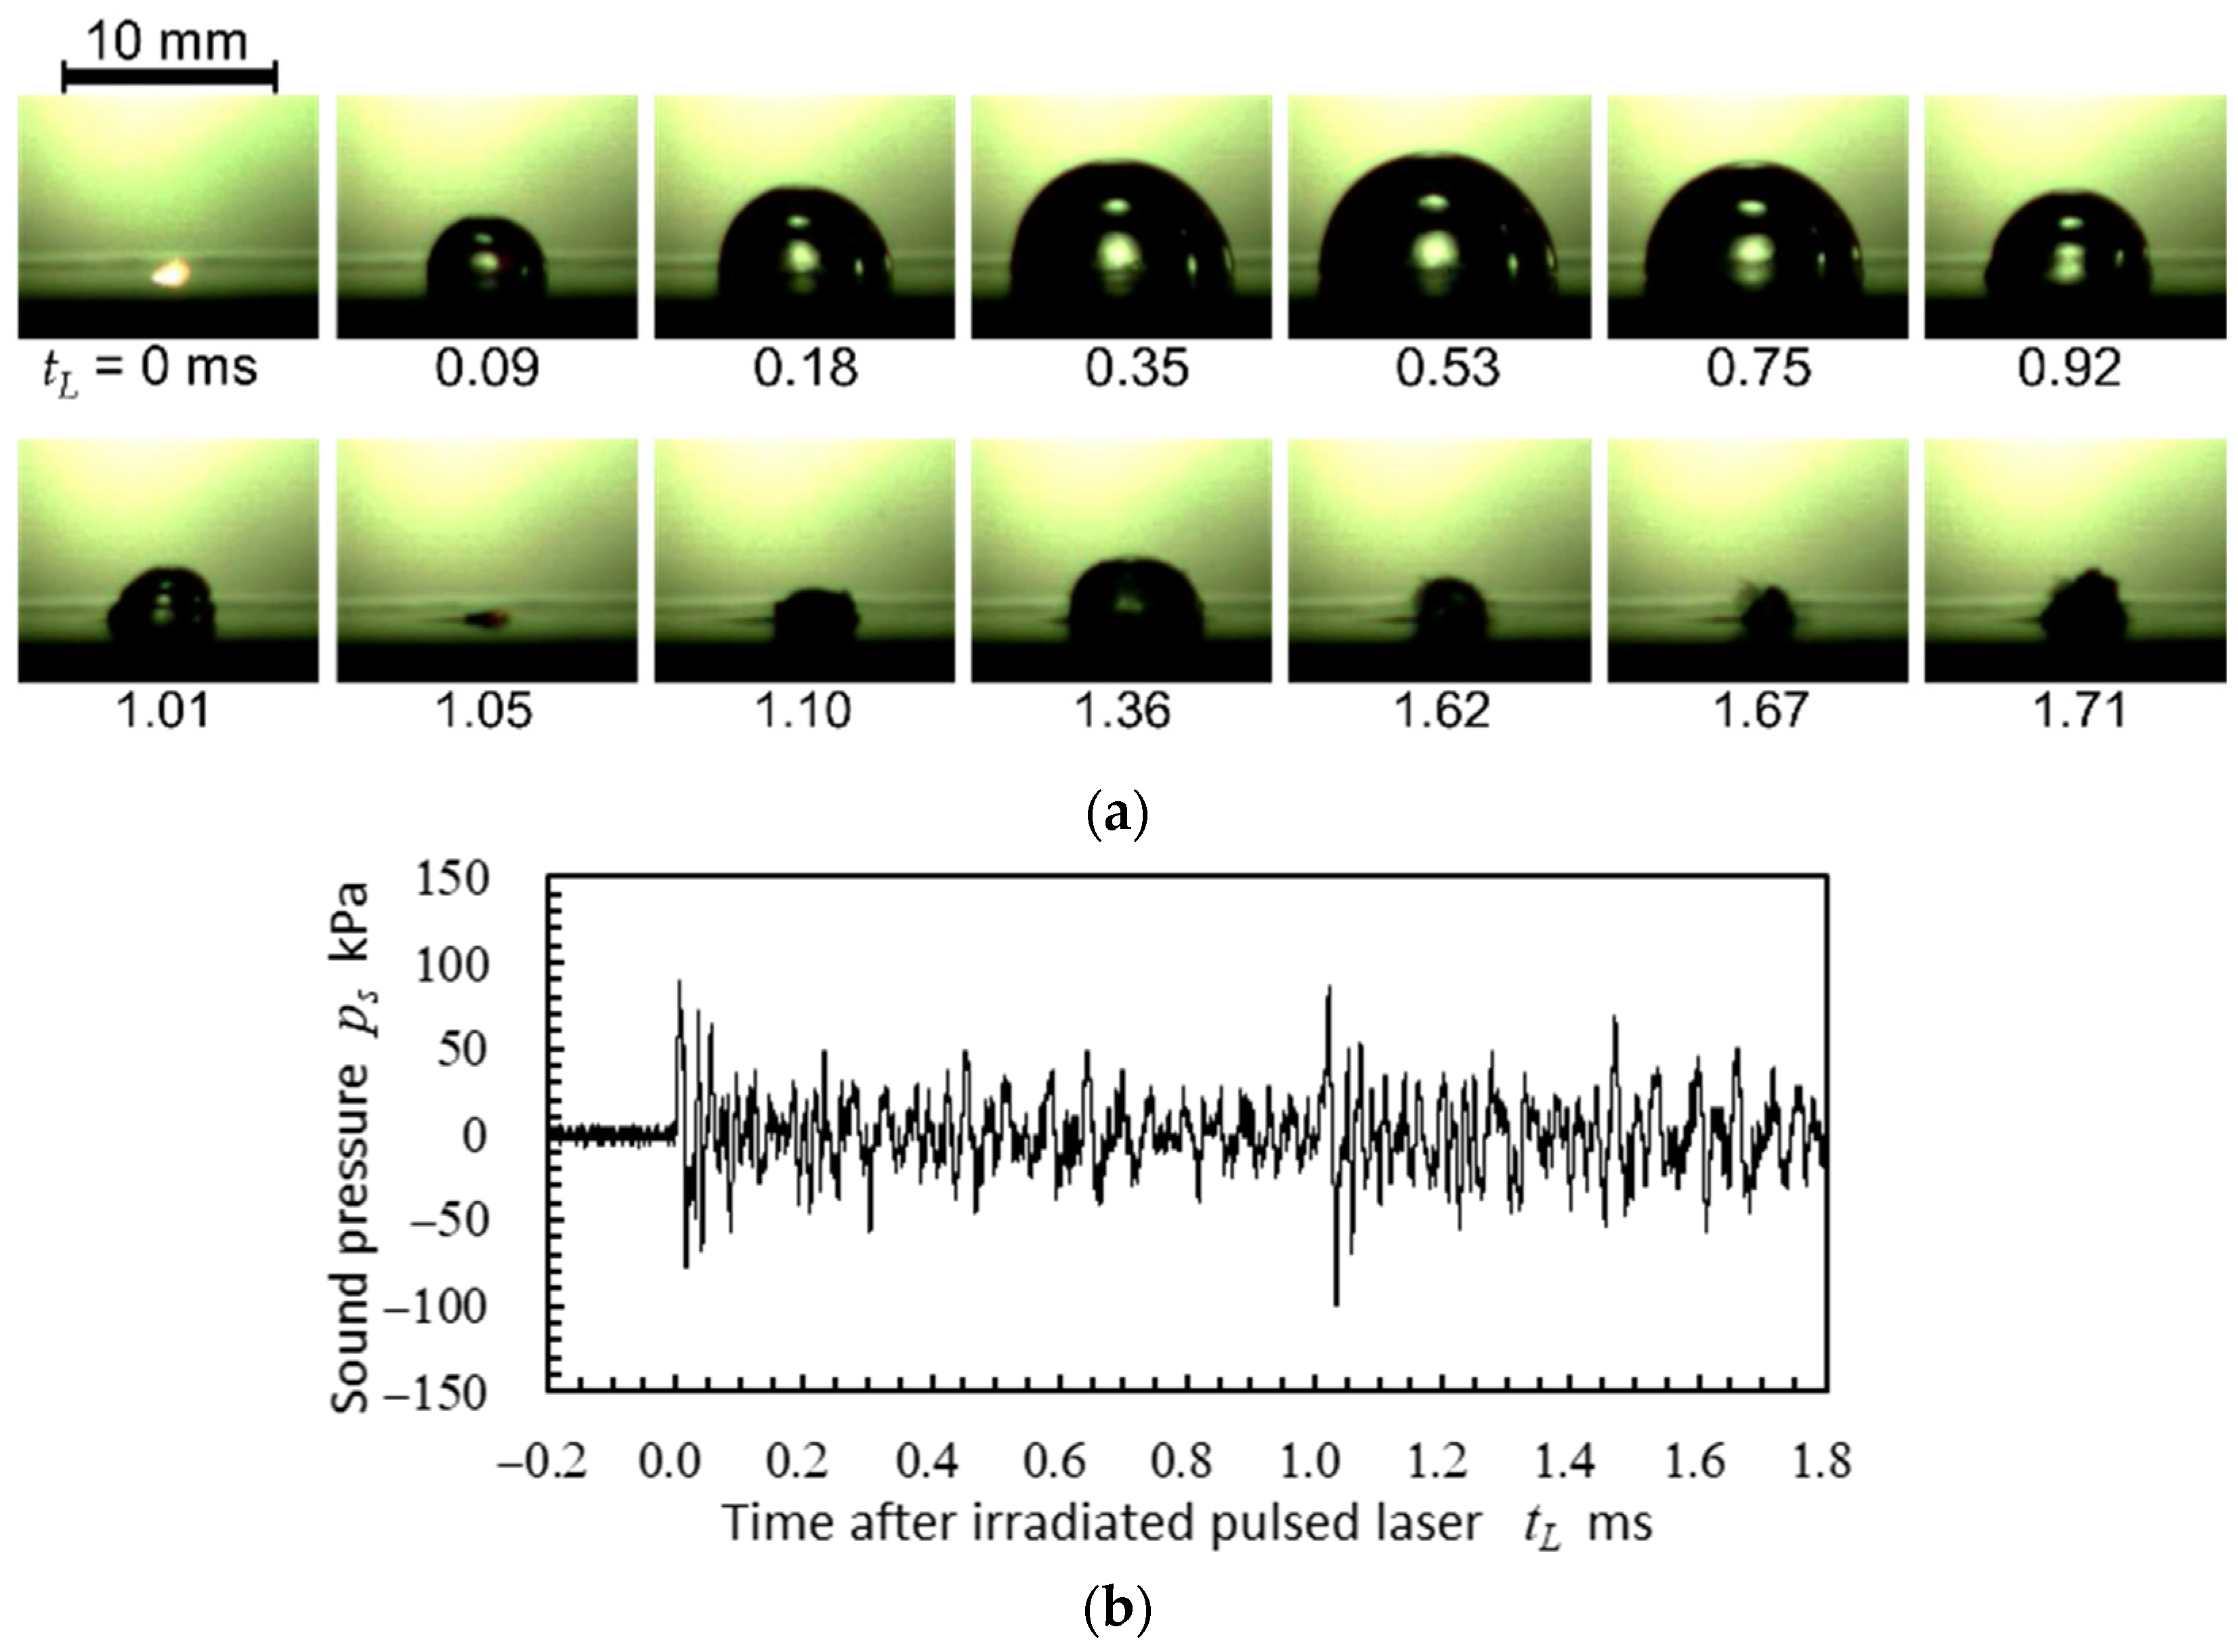
  • Regarding SLP with the fiber laser, when the pulse width was shorter, the sound pressure of LC collapse became greater. During LC collapse using the larger pulse width, the sound pressure of the first LC collapse became smaller, and that of the second LC collapse became greater, as heat energy was introduced into the bubble during the first shrinking in LC.

Funding

This research was partly supported by JSPS KAKENHI (grant numbers 22KK0050 23K25988), JST CREST (JPMJCR2335), and the Suzuki Foundation (5-i19).

Institutional Review Board Statement

Not applicable.

Informed Consent Statement

Not applicable.

Data Availability Statement

The data presented in this study are available upon request from the author.

Conflicts of Interest

The author declares that there are no conflicts of interest.

Abbreviations

2Dtwo-dimensional
ABas-built
AMadditively manufactured
Bblasting
CADcomputer-aided design
CAMcomputer-aided manufacturing
CPcavitation peening
HIPhot isostatic pressing
ISOInternational Organization for Standardization
JISJapanese Industrial Standards
LAlaser ablation
LClaser cavitation
LCPlaser cavitation peening
LPlaser peening
LSlaser sintering
LTlaser treatment
PBFpowder bed fusion
PSPCposition sensitive proportional counter
PVDFpolyvinylidene fluoride
SAESociety of Automotive Engineers
SLPsubmerged laser peening
SPshot peening
XRDX-ray diffraction
Symbol
abestslope
bwidth of specimen
cHconstant for surface hardness
cRconstant for surface residual stress
csconstant for surface roughness
Dcdetermination coefficient
dmaxmaximum diameter of LC
EYoung’s modulus
FWHMfull width at half the maximum of X-ray diffraction
fLrepetition frequency of the laser
HR15TRockwell hardness
harc height
kproportional constant
Mbending moment
Nnumber of cycles to failure
Nf estestimated fatigue life
Nf expfatigue life obtained by experiment
ppressure
pnonprobability of non-correlation
pssound pressure detected by hydrophone
Rstress ratio
R0initial radius of bubble
Rasurface roughness
rcorrelation coefficient
sastandoff distance in air
svvertical direction
swstandoff distance in water
tccollapse time of bubble
tLtime after irradiated pulsed laser
tDdeveloping time of LC
twlaser pulse width
vhhorizontal velocity
χDebye ring direction
δthickness of specimen
ϕrotation angle of specimen
θdiffraction angle
θaamplitude of initial angle in plane bending fatigue test
ρdensity of water
ρLlaser pulse density
λwavelength
νPoisson’s ratio
σaapplied stress
σRresidual stress
σsstandard deviation of slope
ψincidence angle

References

  1. Murr, L.E.; Gaytan, S.M.; Ramirez, D.A.; Martinez, E.; Hernandez, J.; Amato, K.N.; Shindo, P.W.; Medina, F.R.; Wicker, R.B. Metal fabrication by additive manufacturing using laser and electron beam melting technologies. J. Mater. Sci. Technol. 2012, 28, 1–14. [Google Scholar] [CrossRef]
  2. Wang, X.J.; Xu, S.Q.; Zhou, S.W.; Xu, W.; Leary, M.; Choong, P.; Qian, M.; Brandt, M.; Xie, Y.M. Topological design and additive manufacturing of porous metals for bone scaffolds and orthopaedic implants: A review. Biomaterials 2016, 83, 127–141. [Google Scholar] [CrossRef] [PubMed]
  3. DebRoy, T.; Wei, H.L.; Zuback, J.S.; Mukherjee, T.; Elmer, J.W.; Milewski, J.O.; Beese, A.M.; Wilson-Heid, A.; De, A.; Zhang, W. Additive manufacturing of metallic components—Process, structure and properties. Prog. Mater. Sci. 2018, 92, 112–224. [Google Scholar] [CrossRef]
  4. You, S.G.; You, S.M.; Kang, S.Y.; Bae, S.Y.; Kim, J.H. Evaluation of the adaptation of complete denture metal bases fabricated with dental CAD-CAM systems: An in vitro study. J. Prosthet. Dent. 2021, 125, 479–485. [Google Scholar] [CrossRef] [PubMed]
  5. Wang, P.; Li, X.; Luo, S.; Nai, M.L.S.; Ding, J.; Wei, J. Additively manufactured heterogeneously porous metallic bone with biostructural functions and bone-like mechanical properties. J. Mater. Sci. Technol. 2021, 62, 173–179. [Google Scholar] [CrossRef]
  6. Alammar, A.; Kois, J.C.; Revilla-Leon, M.; Att, W. Additive manufacturing technologies: Current status and future perspectives. J. Prosthodont. 2022, 31, 4–12. [Google Scholar] [CrossRef]
  7. Edwards, P.; O’Conner, A.; Ramulu, M. Electron beam additive manufacturing of titanium components: Properties and performance. J. Manuf. Sci. Eng. Trans. ASME 2013, 135, 1–7. [Google Scholar] [CrossRef]
  8. Kahlin, M.; Ansell, H.; Moverare, J.J. Fatigue behaviour of notched additive manufactured Ti6Al4V with as-built surfaces. Int. J. Fatigue 2017, 101, 51–60. [Google Scholar] [CrossRef]
  9. Soyama, H.; Sanders, D. Use of an abrasive water cavitating jet and peening process to improve the fatigue strength of titanium alloy 6Al-4V manufactured by the electron beam powder bed melting (EBPB) additive manufacturing method. JOM 2019, 71, 4311–4318. [Google Scholar]
  10. Kahlin, M.; Ansell, H.; Kerwin, A.; Smith, B.; Moverare, J. Variable amplitude loading of additively manufactured Ti6Al4V subjected to surface post processes. Int. J. Fatigue 2021, 142, 12. [Google Scholar] [CrossRef]
  11. Versga, K.P.; Yeo, S.H.; Soyama, H. Investigation of surface finish and fatigue life of laser powder bed fused Ti-6Al-4V. Int. J. Fatgiue 2024, 189, 108558. [Google Scholar]
  12. Soyama, H.; Wong, K.L.; Eakins, D.; Korsunsky, A.M. The effects of submerged laser peening, cavitation peening, and shot peening on the improvement of the torsional fatigue strength of powder bed fused Ti6Al4V produced through laser sintering. Int. J. Fatigue 2024, 185, 108348. [Google Scholar] [CrossRef]
  13. Kahlin, M.; Ansell, H.; Basu, D.; Kerwin, A.; Newton, L.; Smith, B.; Moverare, J.J. Improved fatigue strength of additively manufactured Ti6Al4V by surface post processing. Int. J. Fatigue 2020, 134, 105497. [Google Scholar] [CrossRef]
  14. Sanders, D.; Soyama, H.; De Silva, C. Use of Cavitation Abrasive Surface Finishing to Improve the Fatigue Properties of Additive Manufactured Titanium Alloy Ti6Al4V; SAE Technical Papers; SAE: Warrendale, PA, USA, 2021. [Google Scholar] [CrossRef]
  15. Khajehmirza, H.; Heydari Astaraee, A.; Monti, S.; Guagliano, M.; Bagherifard, S. A hybrid framework to estimate the surface state and fatigue performance of laser powder bed fusion materials after shot peening. Appl. Surf. Sci. 2021, 567, 150758. [Google Scholar] [CrossRef]
  16. Maleki, E.; Bagherifard, S.; Razavi, N.; Bandini, M.; du Plessis, A.; Berto, F.; Guagliano, M. On the efficiency of machine learning for fatigue assessment of post-processed additively manufactured AlSi10Mg. Int. J. Fatigue 2022, 160, 106841. [Google Scholar] [CrossRef]
  17. Maleki, E.; Bagherifard, S.; Guagliano, M. Correlation of residual stress, hardness and surface roughness with crack initiation and fatigue strength of surface treated additive manufactured AlSi10Mg: Experimental and machine learning approaches. J. Mater. Res. Technol. 2023, 24, 3265–3283. [Google Scholar] [CrossRef]
  18. Zhang, C.; Zhu, H.; Liao, H.; Cheng, Y.; Hu, Z.; Zeng, X. Effect of heat treatments on fatigue property of selective laser melting AlSi10Mg. Int. J. Fatigue 2018, 116, 513–522. [Google Scholar] [CrossRef]
  19. Romano, S.; Brückner-Foit, A.; Brandão, A.; Gumpinger, J.; Ghidini, T.; Beretta, S. Fatigue properties of AlSi10Mg obtained by additive manufacturing: Defect-based modelling and prediction of fatigue strength. Eng. Fract. Mech. 2018, 187, 165–189. [Google Scholar] [CrossRef]
  20. Qian, G.; Jian, Z.; Qian, Y.; Pan, X.; Ma, X.; Hong, Y. Very-high-cycle fatigue behavior of AlSi10Mg manufactured by selective laser melting: Effect of build orientation and mean stress. Int. J. Fatigue 2020, 138, 105696. [Google Scholar] [CrossRef]
  21. Beretta, S.; Gargourimotlagh, M.; Foletti, S.; du Plessis, A.; Riccio, M. Fatigue strength assessment of “as built” AlSi10Mg manufactured by SLM with different build orientations. Int. J. Fatigue 2020, 139, 105737. [Google Scholar] [CrossRef]
  22. Lehner, P.; Blinn, B.; Beck, T. Improving the defect tolerance and fatigue strength of am AlSi10Mg. Adv. Eng. Mater. 2023, 25, 2201855. [Google Scholar] [CrossRef]
  23. Bagherifard, S.; Beretta, N.; Monti, S.; Riccio, M.; Bandini, M.; Guagliano, M. On the fatigue strength enhancement of additive manufactured AlSi10Mg parts by mechanical and thermal post-processing. Mater. Des. 2018, 145, 28–41. [Google Scholar] [CrossRef]
  24. Uzan, N.E.; Ramati, S.; Shneck, R.; Frage, N.; Yeheskel, O. On the effect of shot-peening on fatigue resistance of AlSi10Mg specimens fabricated by additive manufacturing using selective laser melting (AM-SLM). Addit. Manuf. 2018, 21, 458–464. [Google Scholar] [CrossRef]
  25. Maleki, E.; Bagherifard, S.; Sabouri, F.; Bandini, M.; Guagliano, M. Hybrid thermal, mechanical and chemical surface post-treatments for improved fatigue behavior of laser powder bed fusion AlSi10Mg notched samples. Surf. Coat. Technol. 2022, 430, 127962. [Google Scholar] [CrossRef]
  26. Nakamura, M.; Takahashi, K.; Saito, Y. Effect of shot and laser peening on fatigue strength of additively manufactured aluminum alloy with rough surfaces. J. Mater. Eng. Perform. 2022, 32, 1589–1600. [Google Scholar] [CrossRef]
  27. Maleki, E.; Bagherifard, S.; Unal, O.; Sabouri, F.; Bandini, M.; Guagliano, M. Effects of different mechanical and chemical surface post-treatments on mechanical and surface properties of as-built laser powder bed fusion AlSi10Mg. Surf. Coat. Technol. 2022, 439, 128391. [Google Scholar] [CrossRef]
  28. Maleki, E.; Bagherifard, S.; Unal, O.; Bandini, M.; Guagliano, M. On the effects of laser shock peening on fatigue behavior of V-notched AlSi10Mg manufactured by laser powder bed fusion. Int. J. Fatigue 2022, 163, 107035. [Google Scholar] [CrossRef]
  29. Maleki, E.; Bagherifard, S.; Unal, O.; Jam, A.; Shao, S.; Guagliano, M.; Shamsaei, N. Superior effects of hybrid laser shock peening and ultrasonic nanocrystalline surface modification on fatigue behavior of additive manufactured AlSi10Mg. Surf. Coat. Technol. 2023, 463, 129512. [Google Scholar] [CrossRef]
  30. Biddlecom, J.; Li, Y.; Zhao, X.; Berfield, T.A.; Pataky, G.J. Femtosecond laser shock peening residual stress and fatigue life of additive manufactured AlSi10Mg. JOM 2023, 75, 1964–1974. [Google Scholar] [CrossRef]
  31. Maleki, E.; Bagherifard, S.; Heydari Astaraee, A.; Sgarbazzini, S.; Bandini, M.; Guagliano, M. Application of gradient severe shot peening as a novel mechanical surface treatment on fatigue behavior of additively manufactured AlSi10Mg. Mater. Sci. Eng. A 2023, 881, 145397. [Google Scholar] [CrossRef]
  32. Maleki, E.; Bagherifard, S.; Unal, O.; Revuru, M.; Bandini, M.; Guagliano, M. The efficiency of tumble finishing as a final post-treatment for fatigue enhancement of notched laser powder bed fusion AlSi10Mg. Sci. Rep. 2023, 13, 4602. [Google Scholar] [CrossRef]
  33. Peyre, P.; Fabbro, R.; Merrien, P.; Lieurade, H.P. Laser shock processing of aluminium alloys. Application to high cycle fatigue behaviour. Mater. Sci. Eng. A 1996, 210, 102–113. [Google Scholar] [CrossRef]
  34. Hatamleh, O.; Lyons, J.; Forman, R. Laser and shot peening effects on fatigue crack growth in friction stir welded 7075-T7351 aluminum alloy joints. Int. J. Fatigue 2007, 29, 421–434. [Google Scholar] [CrossRef]
  35. Luong, H.; Hill, M.R. The effects of laser peening and shot peening on high cycle fatigue in 7050-T7451 aluminum alloy. Mater. Sci. Eng. A 2010, 527, 699–707. [Google Scholar] [CrossRef]
  36. Trdan, U.; Skarba, M.; Grum, J. Laser shock peening effect on the dislocation transitions and grain refinement of Al–Mg–Si alloy. Mater. Charact. 2014, 97, 57–68. [Google Scholar] [CrossRef]
  37. Lu, J.; Lu, H.; Xu, X.; Yao, J.; Cai, J.; Luo, K. High-performance integrated additive manufacturing with laser shock peening—Induced microstructural evolution and improvement in mechanical properties of Ti6Al4V alloy components. Int. J. Mach. Tools Manuf. 2020, 148, 103475. [Google Scholar] [CrossRef]
  38. Zhang, Y.; Guo, W.; Shi, J.; Chi, J.; Chen, G.; Han, G.; Zhang, H. Improved rotating bending fatigue performance of laser directed energy deposited Ti6Al4V alloys by laser shock peening. J. Alloys Compd. 2024, 980, 173664. [Google Scholar] [CrossRef]
  39. Stránský, O.; Beránek, L.; Pathak, S.; Šmaus, J.; Kopeček, J.; Kaufman, J.; Böhm, M.; Brajer, J.; Mocek, T.; Holešovský, F. Effects of sacrificial coating material in laser shock peening of L-PBF printed AlSi10Mg. Virtual Phys. Prototyp. 2024, 19, 2340656. [Google Scholar] [CrossRef]
  40. Gong, Z.; Zhang, T.; Chen, Y.; Lu, J.; Ding, X.; Zhang, S.; Lan, M.; Shen, Y.; Wang, S. Effect of laser shock peening on stress corrosion cracking of TC4/2A14 dissimilar metal friction stir welding joints. J. Mater. Res. Technol. 2024, 30, 1716–1725. [Google Scholar] [CrossRef]
  41. Liu, Q.; Chu, S.; Zhang, X.; Wang, Y.; Zhao, H.; Zhou, B.; Wang, H.; Wu, G.; Mao, B. Laser shock processing of titanium alloys: A critical review on the microstructure evolution and enhanced engineering performance. J. Mater. Sci. Technol. 2025, 209, 262–291. [Google Scholar] [CrossRef]
  42. Sano, Y.; Mukai, N.; Okazaki, K.; Obata, M. Residual stress improvement in metal surface by underwater laser irradiation. Nucl. Instrum. Methods Phys. Res. Sect. B-Beam Interact. Mater. Atoms 1997, 121, 432–436. [Google Scholar] [CrossRef]
  43. Sano, Y.; Obata, M.; Kubo, T.; Mukai, N.; Yoda, M.; Masaki, K.; Ochi, Y. Retardation of crack initiation and growth in austenitic stainless steels by laser peening without protective coating. Mater. Sci. Eng. A 2006, 417, 334–340. [Google Scholar] [CrossRef]
  44. Sano, T.; Eimura, T.; Hirose, A.; Kawahito, Y.; Katayama, S.; Arakawa, K.; Masaki, K.; Shiro, A.; Shobu, T.; Sano, Y. Improving fatigue performance of laser-welded 2024-T3 aluminum alloy using dry laser peening. Metals 2019, 9, 1192. [Google Scholar] [CrossRef]
  45. Sano, Y. Quarter century development of laser peening without coating. Metals 2020, 10, 152. [Google Scholar] [CrossRef]
  46. Sano, Y.; Kato, T.; Mizuta, Y.; Tamaki, S.; Yokofujita, K.; Taira, T.; Hosokai, T.; Sakino, Y. Development of a portable laser peening device and its effect on the fatigue properties of HT780 butt-welded joints. Forces Mech. 2022, 7, 100080. [Google Scholar] [CrossRef]
  47. Kato, T.; Sakino, Y.; Sano, Y. Effect of laser peening without coating (LPwC) on retardation of fatigue crack growth in SM490 plates. Forces Mech. 2023, 13, 100234. [Google Scholar] [CrossRef]
  48. Sano, Y.; Akita, K.; Sano, T. A mechanism for inducing compressive residual stresses on a surface by laser peening without coating. Metals 2020, 10, 816. [Google Scholar] [CrossRef]
  49. Sasoh, A.; Watanabe, K.; Sano, Y.; Mukai, N. Behavior of bubbles induced by the interaction of a laser pulse with a metal plate in water. Appl. Phys. A 2005, 80, 1497–1500. [Google Scholar] [CrossRef]
  50. Soyama, H. Comparison between the improvements made to the fatigue strength of stainless steel by cavitation peening, water jet peening, shot peening and laser peening. J. Mater. Process. Technol. 2019, 269, 65–78. [Google Scholar] [CrossRef]
  51. Soyama, H.; Korsunsky, A.M. A critical comparative review of cavitation peening and other surface peening methods. J. Mater. Process. Technol. 2022, 305, 117586. [Google Scholar] [CrossRef]
  52. Leuders, S.; Thone, M.; Riemer, A.; Niendorf, T.; Troster, T.; Richard, H.A.; Maier, H.J. On the mechanical behaviour of titanium alloy TiAl6V4 manufactured by selective laser melting: Fatigue resistance and crack growth performance. Int. J. Fatigue 2013, 48, 300–307. [Google Scholar] [CrossRef]
  53. Masuo, H.; Tanaka, Y.; Morokoshi, S.; Yagura, H.; Uchida, T.; Yamamoto, Y.; Murakami, Y. Effects of defects, surface roughness and hip on fatigue strength of Ti-6A1-4V manufactured by additive manufacturing. In Proceedings of the 3rd International Symposium on Fatigue Design and Material Defects (FDMD), Lecco, Italy, 19–22 September 2017; pp. 19–26. [Google Scholar] [CrossRef]
  54. Sun, Y.Y.; Lu, S.L.; Gulizia, S.; Oh, C.H.; Fraser, D.; Leary, M.; Qian, M. Fatigue performance of additively manufactured Ti-6Al-4V: Surface condition vs. Internal defects. JOM 2020, 72, 1022–1030. [Google Scholar] [CrossRef]
  55. Tarik Hasib, M.; Ostergaard, H.E.; Li, X.; Kruzic, J.J. Fatigue crack growth behavior of laser powder bed fusion additive manufactured Ti-6Al-4V: Roles of post heat treatment and build orientation. Int. J. Fatigue 2021, 142, 105955. [Google Scholar] [CrossRef]
  56. Mishurova, T.; Artzt, K.; Rehmer, B.; Haubrich, J.; Ávila, L.; Schoenstein, F.; Serrano-Munoz, I.; Requena, G.; Bruno, G. Separation of the impact of residual stress and microstructure on the fatigue performance of LPBF Ti-6Al-4V at elevated temperature. Int. J. Fatigue 2021, 148, 106239. [Google Scholar] [CrossRef]
  57. du Plessis, A.; Razavi, N.; Wan, D.; Berto, F.; Imdaadulah, A.; Beamer, C.; Shipley, J.; MacDonald, E. Fatigue performance of shelled additively manufactured parts subjected to hot isostatic pressing. Addit. Manuf. 2022, 51, 102607. [Google Scholar] [CrossRef]
  58. Guennec, B.; Hattal, A.; Hocini, A.; Mukhtarova, K.; Kinoshita, T.; Horikawa, N.; Gubicza, J.; Djemaï, M.; Dirras, G. Fatigue performance of zirconia-reinforced Ti-6Al-4V nanocomposite processed by laser powder bed fusion: An improvement by hot isostatic pressing. Int. J. Fatigue 2022, 164, 107129. [Google Scholar] [CrossRef]
  59. Bhandari, L.; Gaur, V. Different post-processing methods to improve fatigue properties of additively built Ti-6Al-4V alloy. Int. J. Fatigue 2023, 176, 107850. [Google Scholar] [CrossRef]
  60. Chern, A.H.; Nandwana, P.; Yuan, T.; Kirka, M.M.; Dehoff, R.R.; Liaw, P.K.; Duty, C.E. A review on the fatigue behavior of Ti-6Al-4V fabricated by electron beam melting additive manufacturing. Int. J. Fatigue 2019, 119, 173–184. [Google Scholar] [CrossRef]
  61. Soyama, H.; Kuji, C.; Liao, Y. Comparison of the effects of submerged laser peening, cavitation peening and shot peening on the improvement of the fatigue strength of magnesium alloy AZ31. J. Magnes. Alloys 2023, 11, 1592–1607. [Google Scholar] [CrossRef]
  62. Soyama, H.; Kuji, C. Improving effects of cavitation peening, using a pulsed laser or a cavitating jet, and shot peening on the fatigue properties of additively manufactured titanium alloy Ti6Al4V. Surf. Coat. Technol. 2022, 451, 129047. [Google Scholar] [CrossRef]
  63. Soyama, H.; Tanaka, M.; Takiguchi, T.; Yamamoto, M. Development of a cavitation generator mimicking pistol shrimp. Biomimetics 2024, 9, 47. [Google Scholar] [CrossRef]
  64. Soyama, H.; Liang, X.; Yashiro, W.; Kajiwara, K.; Asimakopoulou, E.M.; Bellucci, V.; Birnsteinova, S.; Giovanetti, G.; Kim, C.; Kirkwood, H.J.; et al. Revealing the origins of vortex cavitation in a venturi tube by high speed X-ray imaging. Ultrason. Sonochem. 2023, 101, 106715. [Google Scholar] [CrossRef] [PubMed]
  65. Blanken, J.; De Moor, R.J.G.; Meire, M.; Verdaasdonk, R. Laser induced explosive vapor and cavitation resulting in effective irrigation of the root canal. Part 1: A visualization study. Lasers Surg. Med. 2009, 41, 514–519. [Google Scholar] [CrossRef] [PubMed]
  66. Matsumoto, H.; Yoshimine, Y.; Akamine, A. Visualization of irrigant flow and cavitation induced by Er:YAG laser within a root canal model. J. Endod. 2011, 37, 839–843. [Google Scholar] [CrossRef]
  67. Lukac, N.; Jezersek, M. Amplification of pressure waves in laser-assisted endodontics with synchronized delivery of Er:YAG laser pulses. Lasers Med. Sci. 2018, 33, 823–833. [Google Scholar] [CrossRef]
  68. Sugimoto, Y.; Obata, S. Behavior of a sphere caused by pulsed laser induced bubble simulating stone crushing with tul. In Proceedings of the 11th International Symposium on Cavitation 2021, Virtual, 10–13 May 2021; pp. 614–617. [Google Scholar]
  69. Soyama, H. Development of laser cavitation peening using a normal-oscillation Nd:YAG laser. Coatings 2023, 13, 1395. [Google Scholar] [CrossRef]
  70. SAE J442; Test Strip, Holder, and Gage for Shot Peening. SAE International Standards: Warrendale, PA, USA, 2013; pp. 1–5.
  71. SAE J443; Procedures for Using Standard Shot Peening Almen Strip. SAE International Standards: Warrendale, PA, USA, 2010; pp. 1–6.
  72. Soyama, H.; Iga, Y. Laser cavitation peening: A review. Appl. Sci. 2023, 13, 6702. [Google Scholar] [CrossRef]
  73. Ward, B.; Emmony, D.C. The energies and pressures of acoustic transients associated with optical cavitation in water. J. Mod. Opt. 1990, 37, 803–811. [Google Scholar] [CrossRef]
  74. Ohl, C.D.; Lindau, O.; Lauterborn, W. Luminescence from spherically and aspherically collapsing laser induced bubbles. Phys. Rev. Lett. 1998, 80, 393–396. [Google Scholar] [CrossRef]
  75. Lauterborn, W.; Ohl, C.D. Cavitation bubble dynamics. Ultrason. Sonochem. 1997, 4, 65–75. [Google Scholar] [CrossRef]
  76. Ohl, C.D.; Kurz, T.; Geisler, R.; Lindau, O.; Lauterborn, W. Bubble dynamics, shock waves and sonoluminescence. Philos. Trans. R. Soc. A-Math. Phys. Eng. Sci. 1999, 357, 269–294. [Google Scholar] [CrossRef]
  77. Rayleigh, L. On the pressure developed in a liquid during the collapse of a spherical cavity. Lond. Edinb. Dublin Philos. Mag. J. Sci. 1917, 34, 94–98. [Google Scholar] [CrossRef]
  78. Little, R.E. Estimating the median fatigue limit for very small up-and-down quantal response tests and for S-N data with runouts. ASTM STP 1972, 511, 29–42. [Google Scholar]
  79. He, B.B. Two-Dimensional X-ray Diffraction; John Wiley & Sons, Inc.: Hoboken, NJ, USA, 2009; pp. 249–328. [Google Scholar]
  80. ISO 21920-2; I. Geometrical Product Specifications (GPS)—Surface Texture: Profile, Part 2: Terms, Definitions and Surface Texture Parameters. ISO; Geneva, Switzerland, 2021.
  81. Linder, J.; Axelsson, M.; Nilsson, H. The influence of porosity on the fatigue life for sand and permanent mould cast aluminium. Int. J. Fatigue 2006, 28, 1752–1758. [Google Scholar] [CrossRef]
  82. Taylor, J.R. An Introduction to Error Analysis, the Study of Uncertainties in Physical Measurements; University Science Books: Sausalito, CA, USA, 1982. [Google Scholar]
Figure 1. Typical aspects of submerged laser peening (SLP), showing laser ablation (LA), laser cavitation (LC), laser treatment (LT), and laser cavitation peening (LCP). These high-speed images are reprinted from [12], with permission from Elsevier, License Number 5824671356429.
Coatings 14 01174 g001
Figure 2. Geometry of plane bending fatigue specimen manufactured via PBF–LS/AlSi10Mg: (a) schematic of specimen (the thickness is 3 mm), (b) photograph of as-built specimen.
Coatings 14 01174 g002
Figure 3. Schematic of test section of SLP system and definition of standoff distance in air sa and water sw.
Coatings 14 01174 g003
Figure 4. Diagonal view of SLP system using a fiber laser.
Coatings 14 01174 g004
Figure 5. Diagonal view of SLP using a Nd/YAG laser.
Coatings 14 01174 g005
Figure 6. Photograph of XRD system and coordinates for residual stress measurement [11].
Coatings 14 01174 g006
Figure 7. Aspects of LA and LC and sound pressure changing over time after irradiated pulsed laser tL induced by Nd/YAG laser with a wavelength λ = 1064 nm and a pulse width tw = 6 ns: (a) aspects of LA and LC, (b) sound pressure ps.
Coatings 14 01174 g007
Figure 8. Aspects of LA and LC and sound pressure changes over time after irradiated pulsed laser tL induced by fiber laser with a wavelength λ = 1080 nm at pulse width tw = 20 μs and 300 μs: (a) aspect of LA and LC at tw = 20 μs; (b) sound pressure ps at tw = 20 μs; (c) aspects of LA and LC at tw = 300 μs; (d) sound pressure ps at tw = 300 μs.
Coatings 14 01174 g008aCoatings 14 01174 g008b
Figure 9. Effect of pulse width tw on LT using fiber laser.
Coatings 14 01174 g009
Figure 10. Effect of standoff distance in water sw on LT using fiber laser.
Coatings 14 01174 g010
Figure 11. Aspects of specimen observed by a digital microscope: (a) as-built surface; (b) LT (SLP with fiber laser); (c) blasting (B); (d) LCP (SLP with Nd/YAG laser); (e) B + LT; (f) LT + LCP; (g) B + LCP; (h) B + LT + LCP.
Coatings 14 01174 g011
Figure 12. Aspects of specimen observed by a SEM: (a) as-built surface; (b) LT (SLP with fiber laser); (c) blasting (B); (d) LCP (SLP with Nd/YAG laser); (e) B + LT; (f) LT + LCP; (g) B + LCP; (h) B + LT + LCP.
Coatings 14 01174 g012
Figure 13. Aspects of the fractured specimen: (a) as-built surface; (b) LT (SLP with fiber laser); (c) blasting (B); (d) LCP (SLP with Nd/YAG laser); (e) B + LT; (f) LT + LCP; (g) B + LCP; (h) B + LT + LCP.
Coatings 14 01174 g013
Figure 14. Mechanical properties of as-built, LT, B, LCP, B + LT, B + LCP, LT + LCP, and B + LT + LCP specimens: (a) fatigue life at σa = 110 MPa; (b) surface roughness Ra; (c) residual stress σR; (d) Rockwell hardness HR15T; (e) full width at half the maximum of X-ray diffraction pattern FWHM; (f) amplitude of initial angle in the plane bending fatigue test θa.
Coatings 14 01174 g014aCoatings 14 01174 g014b
Figure 15. Improvement of fatigue strength in as-built PBF–LS/AlSi10Mg specimens via B, LT, and LCP.
Coatings 14 01174 g015
Figure 16. Estimated fatigue life Nf est from fatigue life obtained via experiment Nf exp at σa = 110 MPa using mechanical surface properties: (a) Equation (6)—surface roughness Ra and residual stress σR, (b) Equation (7)—surface roughness Ra, residual stress σR, and Rockwell hardness HR 15T.
Coatings 14 01174 g016
Table 1. Fatigue strength of as-built AlSi10Mg specimens.
SpecimenAs-Built Post-ProcessingImprovement Ratio
Fatigue strength at 107 [present]
(Plane bending, R = −1)
54 MPaLCP 85 MPa57%
B + LT + LCP103 MPa91%
Fatigue strength at 3 × 10⁶ [16]
(Rotating bending, R = −1 with notch)
10 MPaSP172 MPa(720%)
SP292 MPa(920%)
Fatigue strength at 106 [26]
(Plane bending, R = 0)
56 MPaLP90 MPa61%
SP89 MPa59%
Fatigue strength at 107 [26]
(Plane bending, R = 0)
51 MPaLP90 MPa76%
SP81 MPa59%
Fatigue strength at 107 [24]
(Rotating bending, R = −1)
75 MPaPolished100 MPa33%
Polished + SP110 MPa47%
Table 2. Measured values for the number of cycles to failure, surface roughness, residual stress, and hardness.
Post-ProcessingNumber of Cycles
to Failure
Nf exp [cycles]
Arithmetical Mean Roughness Ra [μm]Residual Stress
σR [MPa]
Rockwell Hardness HR15T AB
Average ValueStandard DeviationAverage ValueStandard DeviationAverage ValueStandard Deviation
As-built77,41712.881.14681976.64.0
LT43,8628.370.854123176.93.0
B211,92210.740.24−1652677.21.1
LCP211,41910.680.77−1352074.25.2
B + LT43,1346.860.525672378.42.5
B + LCP234,63710.030.88−2562074.81.5
LT + LCP404,7599.400.27−4802480.31.5
B + LT + LCP1,865,5028.440.35−4892079.02.4
Table 3. Constants for experimental formula to estimate fatigue life using surface roughness, residual stress, and hardness.
SymbolEquation (6)Equation (7)
Constant for surface roughnesscS0.1920.181
Constant for residual stresscR0.1620.160
Constant for hardnesscH0.023
Slopeabest1.0821.075
Standard deviation of slopeσs0.0280.035
Correlation coefficientr0.9330.936
Determination coefficientDc0.8700.831
Probability of non-correlationpnon0.22%0.20%
Disclaimer/Publisher’s Note: The statements, opinions and data contained in all publications are solely those of the individual author(s) and contributor(s) and not of MDPI and/or the editor(s). MDPI and/or the editor(s) disclaim responsibility for any injury to people or property resulting from any ideas, methods, instructions or products referred to in the content.

