Abstract
The paper describes our project to develop, verify, and deploy an All-Hazards Return of Investment (ROI) model for the U. S. Army Engineer Research and Development Center (ERDC) to provide army installations with a decision support tool for evaluating strategies to make existing installation facilities more resilient. The need for increased resilience to extreme weather caused by climate change was required by U.S. code and DoD guidance, as well as an army strategic plan that stipulated an ROI model to evaluate relevant resilient strategies. During the project, the ERDC integrated the University of Arkansas designed model into a new army installation planning tool and expanded the scope to evaluate resilient options from climate to all hazards. Our methodology included research on policy, data sources, resilient options, and analytical techniques, along with stakeholder interviews and weekly meetings with installation planning tool developers. The ROI model uses standard risk analysis and engineering economics terms and analyzes potential installation hazards and resilient strategies using data in the installation planning tool. The ROI model calculates the expected net present cost without the resilient strategy, the expected net present cost with the resilient strategy, and ROI for each resilient strategy. The minimum viable product ROI model was formulated mathematically, coded in Python, verified using hazard scenarios, and provided to the ERDC for implementation.
1. Introduction
A RAND study concluded that “U.S. Army installations experience significant damage and mission impacts from hurricanes, floods, and other natural hazard events [1]”. Many of these natural hazards are expected to increase in severity and frequency due to climate change. The U.S. Army plans to build more resilience into installations but must consider the return on investment of resilient strategies due to fiscal constraints [1]. Assets are engineered systems. A resilient system “is able to successfully complete its planned mission(s) in the face of disruption(s) (environmental or adversarial) and has capabilities allowing it to successfully complete future missions with evolving threats”. A resilient strategy makes the asset more resilient to disruptions [2].
To make installations more resilient to extreme weather, DoD installation managers realized that they needed to develop resilient strategies for new facility construction and modifications to existing facilities and operations. The army, air force, and the Department of Homeland Security funded RAND studies (i.e., [1,3,4]) on resilient strategies and methods to examine return of investment of these strategies. RAND’s Air Force Study [3] identified three types of resilient strategies: interventional, landscape, and structural. A RAND report for the Department of Homeland Security [4] identified strategies to mitigate the risk to National Critical Functions (NCF). A NCF may be affected by up to eight climate drivers (i.e., drought, extreme cold, extreme heat, flooding, sea-level rise, severe storm systems (nontropical), tropical cyclones and hurricanes, and wildfires). By applying 254 unique resilient strategies across multiple impact pathways, RAND [4] found 954 potential resilient strategies that could apply to installations. Their approach allows for each impact pathway to have extensive coverage as well as multiple strategies for each installation to evaluate for a particular hazard. RAND [4] concluded that each resilient strategy can be evaluated by four criteria: strength of evidence (how well the strategy is studied in the literature), effectiveness (impact of the strategy on reducing risk), feasibility (how easily the strategy is implemented), and cyber vulnerability (if the strategy introduces new cyber threats).
The army is developing PLANNER, a cloud-based installation planning tool that centralizes army installation data and hosts installation management decision support tools. The project initially focused on extreme weather due to climate change and the research of resilient strategies to reduce the risk to existing facilities, operations, and personnel due to weather-related hazards. The current draft DoDI 4715.AG1 states that “DoD Component heads will integrate information from installation master plans and other assessments and plans relating to all-hazards threats for military installations…”. In anticipation of DoD and army guidance to consider All-Hazards Risk Analysis (AHRA), the PLANNER team changed its focus to a broader set of hazards. In August 2024, the PLANNER team received approval to incorporate AHRAs in PLANNER AHRA in place of Installation Climate Resilience Plans (ICRPs). The all-hazards list will include climate, municipal services, energy, cybersecurity, solid waste, waste and wastewater, and others. This decision will require installation managers to broaden their search for resilient strategies for these hazards.
This paper summarizes our research project to develop an All-Hazard ROI model to evaluate strategies to make Army installations more resilient to hazards that could significantly impact their operations, facilities, and personnel. The University of Arkansas research team collaborated with the ERDC and the Forge Group, LLC., hereinafter Forge, to develop a minimum viable product (MVP) ROI model using installation planning data (i.e., the all-hazards risk matrix and data on potential resilient strategies) in PLANNER. The MVP ROI model calculates the expected net present cost (ENPC) of not funding each potential resilient strategy, the ENPC if each resilient strategy is funded, and the ROI for each resilient strategy. This analysis method provides the essential data installation planners need to identify and justify the most promising resilient strategies for their installation. In addition, the ROI model will provide credible and consistent data for army installation managers and army and DoD resource allocation decision makers.
The paper is organized as follows. First, a discussion of the research project scope followed by a description of the major project decisions and changes during the project. The second section identifies the project sponsors and research team. The third section describes the research methodology and findings from the stakeholder interviews and senior stakeholder presentations. Research and stakeholder analysis is then summarized with a decision hierarchy and MVP influence diagram. The fourth section describes the ROI model’s mathematical foundation, the Python code implementation, the assessment scenarios developed to verify the model, and the code verification results. The fifth section identifies areas for future research to increase model fidelity and make the ROI model more data driven. Finally, the paper concludes with a summary of the paper. A list of acronyms is appended, and Appendix A provides a summary of the stakeholder meetings.
2. Project Scope
The initial project research focused on the impact of extreme weather caused by climate change on army installations, facilities, and operations. The DoD defines climate change as “variations in average weather conditions that persist over multiple decades or longer that encompass increases and decreases in temperature, shifts in precipitation, and changing risks of certain types of severe weather events” and extreme weather events as “occurrences of unusually severe weather or climate conditions that can cause devastating impacts on communities and agricultural and natural ecosystems [5]”. As the DoD recognized the emergence of climate change and related severe weather events, they planned to develop resilient strategies to reduce the potential impact on installation facilities, operations, and personnel.
Two major project decisions were made by the ERDC team leaders early in the project. The first was to align this research with the army strategy for installation planning and extreme weather due to climate change. The second was to integrate the ROI model into PLANNER, the new army installation planning tool.
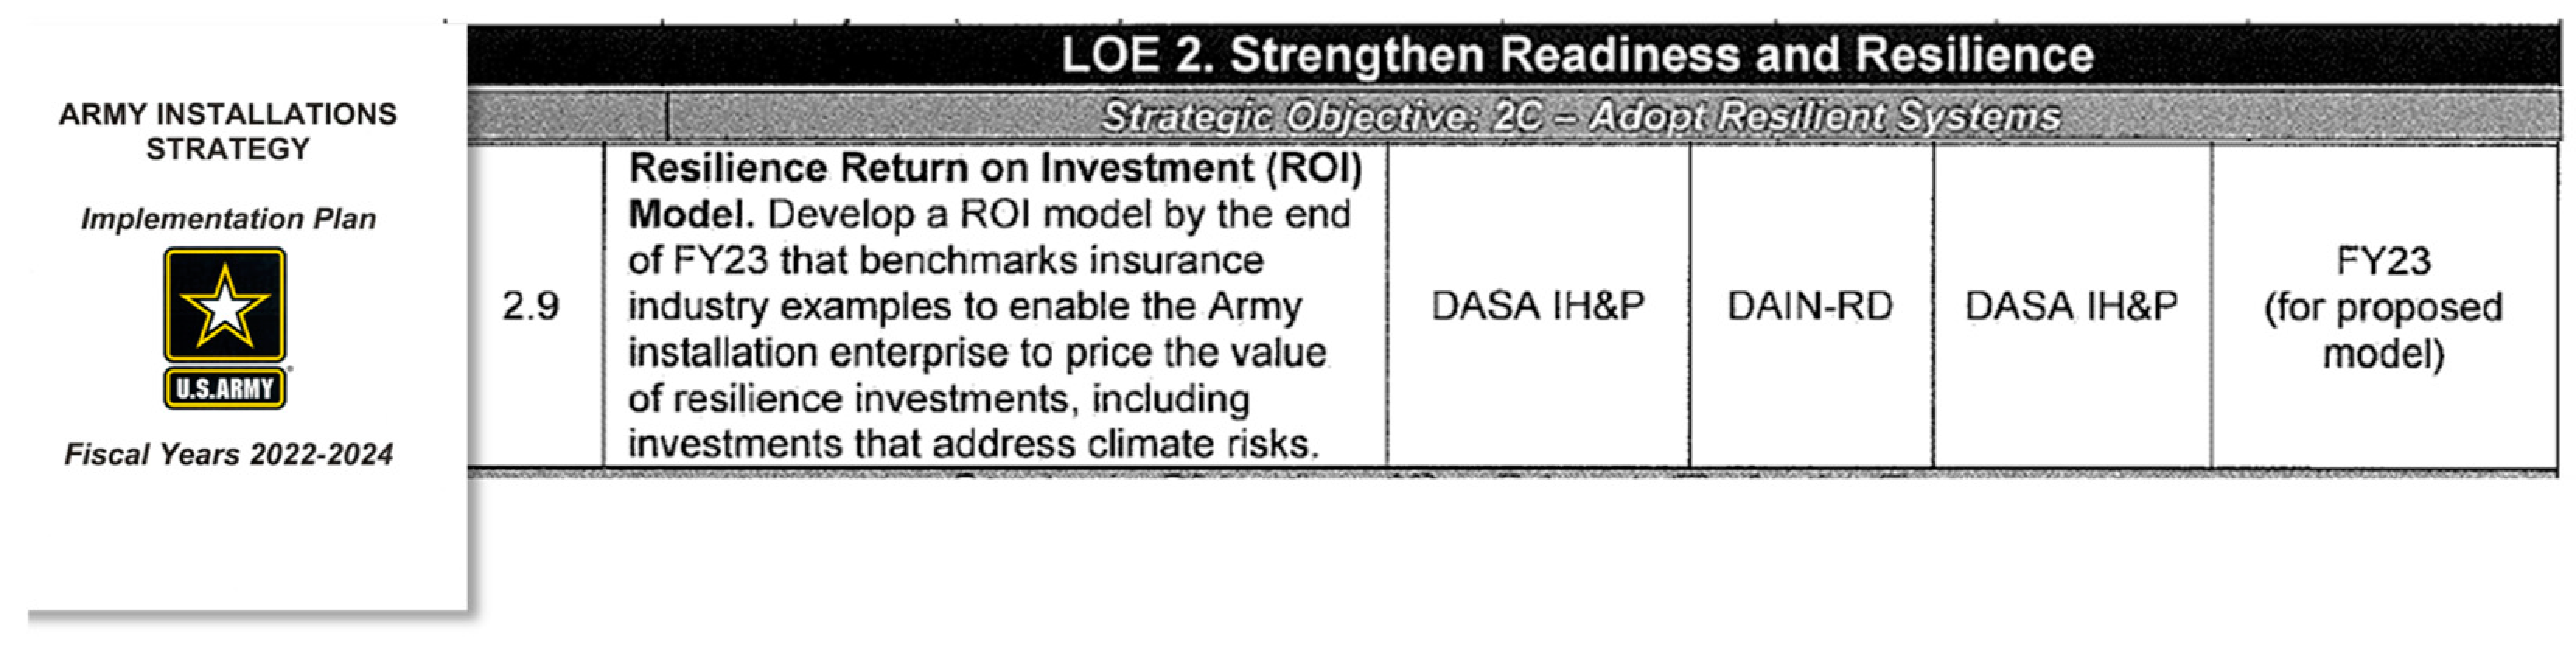
Related to the first decision, the army released the Army Installation Strategy (AIS) [6] and a corresponding Army Installation Strategy Implementation Plan (AIS-IP) [7] in 2020, which recognized the potential impacts of severe weather caused by climate change. The AIS-IP emphasizes the importance of increased infrastructure resilience to climate change and lists several tasks under four lines of effort (LOEs) to implement installation strategy across the army. LOE 2 focused on strengthening readiness and resilience and had 10 tasks.2 Task 2.9 required a resilience ROI model. Figure 1 shows the task description, and the army organizations involved. This research supported the office of the Deputy Assistant Secretary of the Army for Installations, Housing and Partnerships (DASA-IH&P) and the Department Chief of Staff (DCS) G-9 (DAIN-RD) assigned with the task of governing the development of a ROI model to evaluate installation resilience investments, including those that address climate risks.
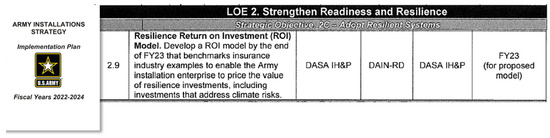
Figure 1.
Task 2.9 from AIS-IP [7].
The initial project objective was to develop a methodology integrating financial climate risk assessment and incorporate the methodology into PLANNER, an Army Installation Modernization Pilot Program (AIMP2) investment by the Assistant Secretary of the Army for Installations, Energy and Environment (ASA (IE&E)). PLANNER will enable installation master planning to provide digital, agile, data-driven decision-making processes that optimize resources, enhance resilience, and adapt to evolving mission requirements.
Initially, our methodology focused on financial climate risk and leveraging industry and commercial property insurance models, specifically based on RAND’s ROI model [1], to inform resilience investment decisions required by the Army Installations Strategy Implementation Plan (AIS I-Plan) [8]. RAND’s methodology also identified deficiencies in publicly available data and discussed the development of insurance risk models of Army facilities.
As the project developed, two significant changes were made in the project scope. First, the stakeholders we interviewed did not express interest in using insurance data because the government does not use commercial insurance for government owned buildings and installation planners did not believe that building standards for military facilities are equivalent to commercial standards. Therefore, they believed that insurance data not based on actual insurance contracts for army facilities would lack credible DoD budget decision makers. Second, the PLANNER team desired to have an all-hazard model in addition to the hazards of extreme weather due to climate change for a digital adaptation to the current draft of DoDI 4715.AG for Integrated Installation Resilience (IIR). The decision not to use insurance data estimates and to develop an all-hazards model led the research team to use standard risk analysis terminology and the development of an all-hazards ROI model.
PLANNER is an Army Installation Modernization Pilot Program (AIMP2) initiative under sponsorship and leadership of the Assistant Secretary of the Army for Installations, Energy and Environment (ASA(IE&E)). Susan Wolters, a program manager in ERDC’s Environmental Laboratory, leads the PLANNER project. The ERDC Information Technology Laboratory (ITL) (Buchanan, Richards, and Ables) led the ROI project and funded the University of Arkansas (UARK) team (Parnell, Curry, and Specking) to define the problem and gather data to develop the methodology and the MVP for this project. The Forge team included their Rapid Capabilities Director and her PLANNER development team.
As a result, the revised project scope was to develop an all-hazard ROI model in PLANNER to evaluate installation resilient strategies. The model uses risk analysis terms, and we assume all the data on the hazards and the resilient strategies are available in PLANNER. The ROI model calculates the expected NPC without the resilient strategy, the expected NPC with the resilient strategy, and ROI for each resilient strategy. The research team used agile development to create a mathematical model, code, verify, and provide the model to the ERDC team for integration into PLANNER. We chose to use an agile development process over traditional methods since the goals and requirements were not clear at the beginning. This approach made it easy for us to pivot our development when requirements changed from a focus on climate to all hazards and not using insurance rates.
3. Research Methodology
Our methodology in this section is organized as follows:
- Define the decision frame using a decision hierarchy (Section 3.1);
- Develop and maintain influence diagrams that identify the data sources, the data relationships, the flow of information, the decision models, and the value to decision makers and stakeholders (Section 3.2);
- Research the problem domain, data sources, data providers, and analytic techniques (Section 3.2);
- Identify and obtain relevant data on hazards and resilient strategies (Section 3.2);
- Develop, verify, and provide application software for ERDC contractors to deploy on army cloud-based systems, e.g., PLANNER (Section 3.3.1, Section 3.3.2, and Section 4);
- Perform relevant data analysis and develop data visualizations to inform our decision methodology (Section 4);
- Identify future research to make the model more data driven (Section 5);
- Obtain stakeholders’ needs and requirements using interviews and scheduled meetings with our research sponsor, army installation stakeholders and decision makers, ERDC research teams, and ERDC contractors (Appendix A) [9].
3.1. Decision Hierarchy
A decision hierarchy is a decision analysis problem definition artifact to define the project decisions [10]. The decision hierarchy has three sections. The givens provide the key findings and assumptions that provide the important background for the project. The middle section provides the research team’s understanding of project tasks. Finally, the future work identifies tasks for future work. Figure 2 displays the decision hierarchy for the effort.
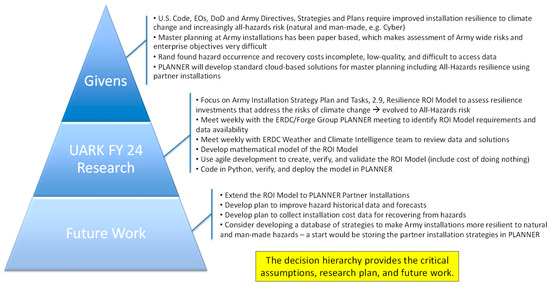
Figure 2.
Decision Hierarchy.
The decision hierarchy identified that the purpose of the ROI model is to provide insights to army installations for installation resilience investment processes. After completion of the project, PLANNER will include a methodology for assessing all hazards risk and evaluating installation resilience strategies. All hazards include natural hazards (i.e., risk of extreme weather due to climate change) and human-caused hazards (e.g., energy resilience, mission assurance, and cyber threats).
3.2. MVP ROI Model Influence Diagram
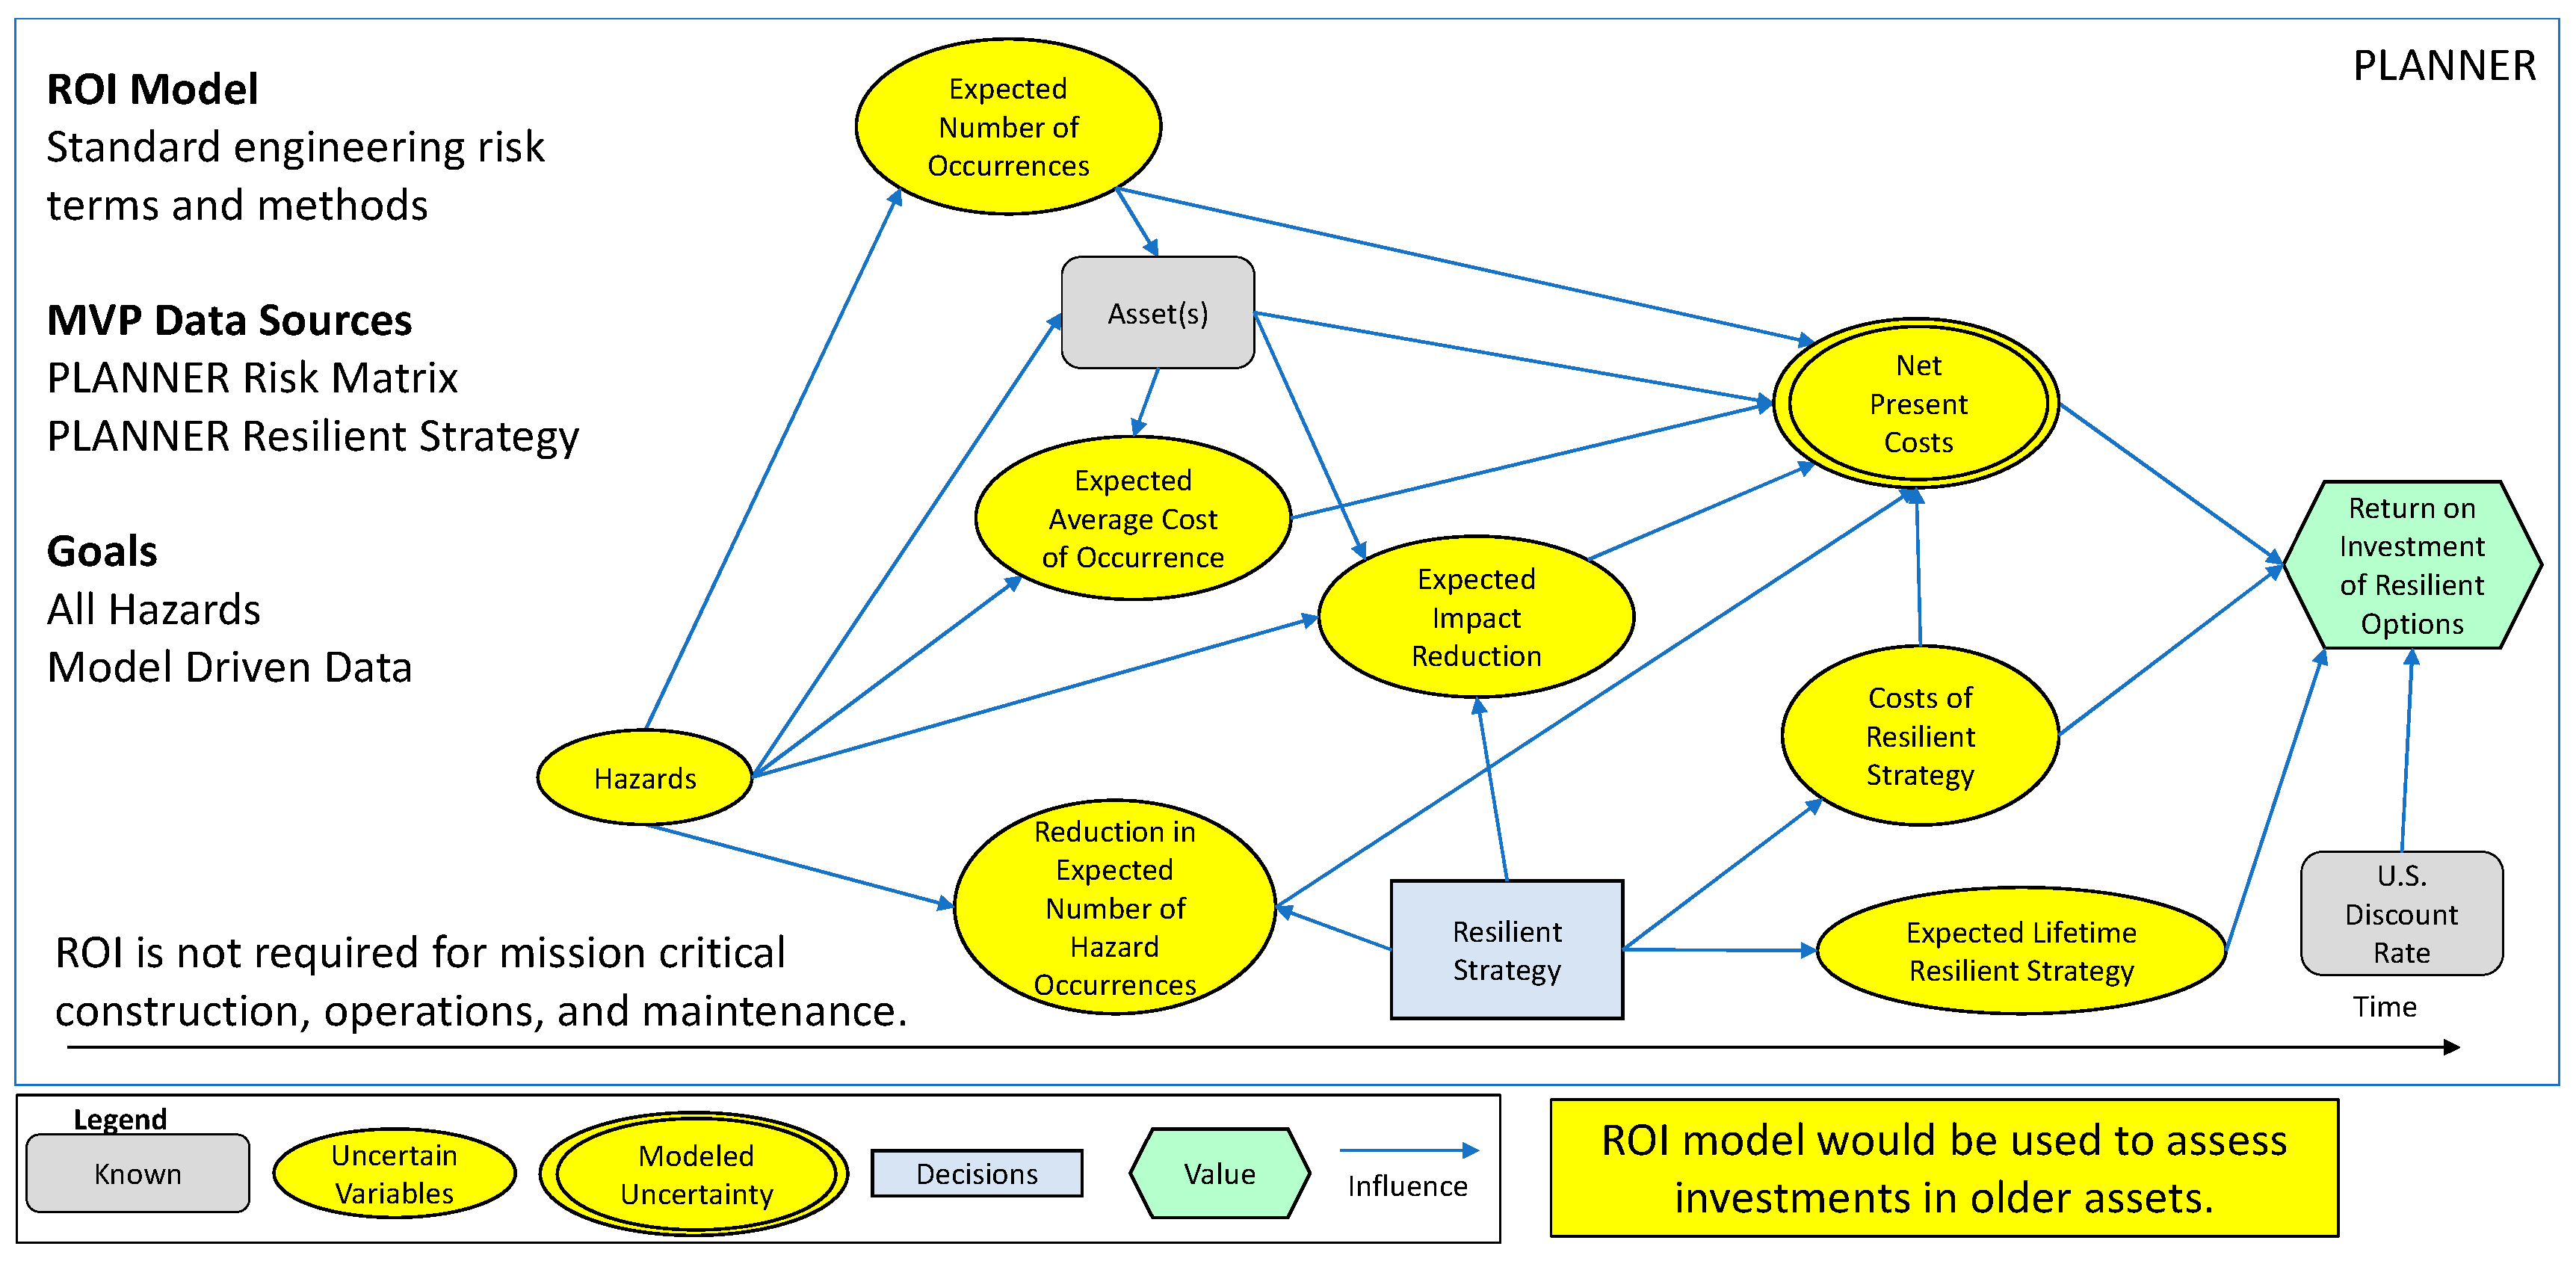
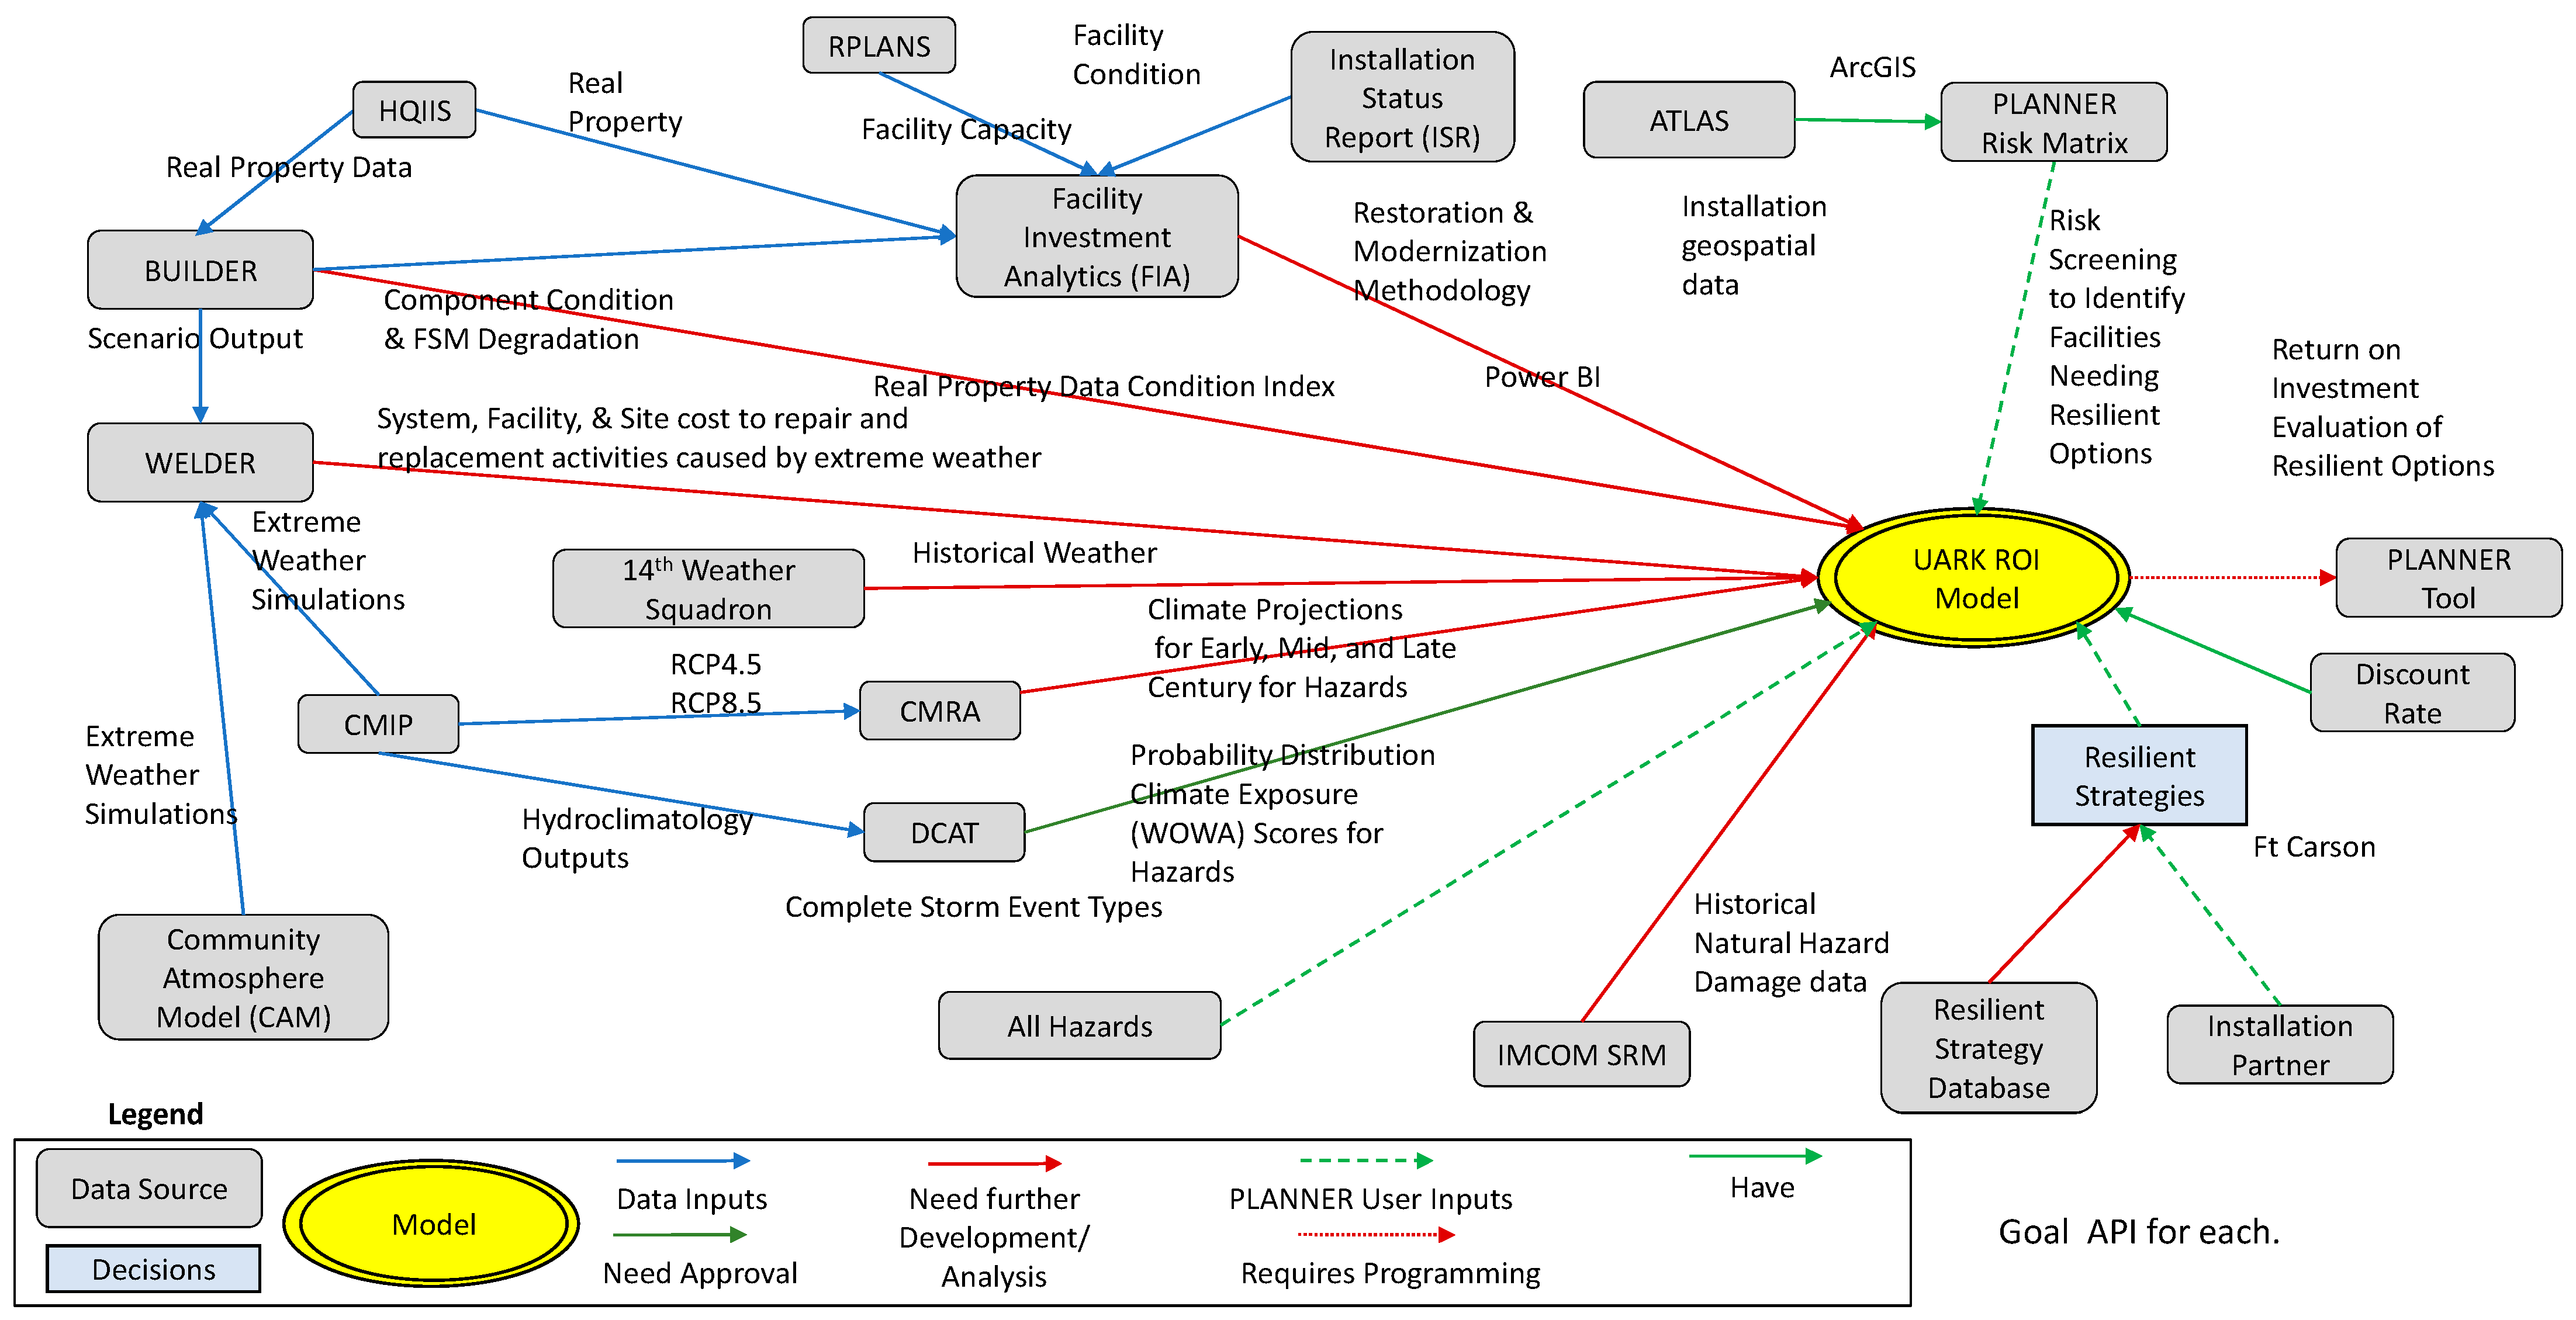
The research team created the influence diagram in Figure 3 to describe the MVP ROI model methodology. It shows the flow of information and probabilistic relationships between variables [11]. There are five types of variables with ovals representing uncertain variables, double ovals representing modeled uncertain variables, rectangles representing decisions, rounded rectangles representing known information, and a hexagon representing the value variable. A solid arrow between represents an influence, while a dashed arrow represents a hypothesized influence not currently in our methodology. There is also an arrow across the bottom of the influence diagram that denotes that the diagram should be viewed from left to right and the information in the nodes is time sequenced.

Figure 3.
MVP ROI Model Influence Diagram.
The MVP ROI model and its corresponding influence diagram in Figure 3 uses standard risk analysis and engineering economic analysis terms and methods. The model uses data from the PLANNER Risk Matrix and PLANNER Resilient Strategies modules and is an all-hazards model, albeit most of the current PLANNER data are for environmental hazards. We expect installation planners to assess potential resilient strategy investments for non-mission critical assets that have not been constructed to be resilient to the specified hazard(s). The ROI calculation may not be required for mission critical construction, operations, and maintenance that have been constructed to be resilient to the specified hazard.
The influence diagram assumes a geographical area of interest (e.g., the location of a group of assets) is known and begins by identifying the possible hazards facing that area. The MVP is concerned with a specified set of assets(s) within this geographical area that could be impacted by the hazard. PLANNER users input the number of expected hazard occurrences per year for each hazard and potential cost of each hazard on the relevant set of assets. The model could be extended to include the hazard costs on each asset if PLANNER incorporates these data in the future.
Using the PLANNER Risk Matrix, the MVP uses the expected number of hazard occurrences per year, the expected cost of occurrence, and the lifetime of the resilient strategy to calculate the ENPC of all hazards without any resilient strategies implemented. Using PLANNER data on resilient strategies, the expected impact reduction as a result of the resilient strategy, the reduction in expected number of hazard occurrences, and the costs for implementing a resilient strategy is combined to calculate the ENPC of implementing a resilient strategy. These ENPCs are calculated using the minimum between the lifetimes of the asset(s) and the lifetime of the resilient strategy along with the U.S. government-defined discount rate. Overall, ROI values for resilient strategies provide valuable financial data to aid installation planners in decision making for when and how to deploy resilient strategies.
3.3. MVP ROI Model Development and Implementation
Our research required understanding the intersection of the emerging practices in all-hazard risk analysis with return-on-investment modeling. Risk analysis is a well-researched field applied in many fields. Bier [12] performed an extensive literature review that analyzed the incorporation of decision analysis with risk analysis. Bier found several works that used some of the methods discussed above, such as influence diagrams. In addition, searching “risk analysis” in the Web of Science produces over 100,000 works. “Return-on-investment” is also a heavily researched area producing over 14,000 works in the Web of Science. A search for the intersection of “all hazard risk analysis” and “return-on-investment” produced zero publications.
Therefore, the Web of Science search was extended by looking at all hazard risk analysis without quotations. With these keywords, the search produced over 95,000 works. The first several result pages were reviewed and many of them were deemed out of scope for this project due to considering only one risk, such as [13,14,15,16], or based on proving a theory, such as [17]. Several related papers were found, such as [18,19,20,21], that provided insightful information. Kappes et al. [18] provides insight into the challenges of analyzing multi-hazard risks. Owolabi and Sajjad [19] performed a systematic review on multi-hazard risk assessments and found that most multi-hazard risk assessment work involved landslides. Ayyub et al. [20] provide the most useful information, since it presented a mathematical framework for an all-hazards risk analysis, which included benefit–cost analysis. Liu et al. [21] provided a three-step process to calculate risk caused by natural and technological hazards.
Refs. [18,19,21] were used to extend the influence diagram and to develop a mathematical model with a Python-based implementation for assessing the ROI on potential resilient strategies. To determine the ROI, the current ENPC of hazard impacts was calculated and compared to the ENPC of developing and building resilient strategies to fortify installations against all hazards. The ROI model applies to facilities that were not designed or modified to be resilient to all hazards. A resilient strategy is a plan implemented to fortify an asset or group of assets in the face of hazards. For example, implementing a resilient strategy may prevent building damage and disruption to mission operations.
The mathematical model described in the next section is the MVP model. PLANNER is also an agile development project. In the MVP, data currently available in PLANNER is used to ensure our model can be integrated into PLANNER and used by installation planners.
3.3.1. Mathematical Formulation
Using the concepts presented in the MVP influence diagram, the notation required for the mathematical formulation of our ROI model is presented next. The ROI is calculated using rigorous mathematical definitions and equations and input data provided from PLANNER.
First, three sets, and , contain the set of all possible hazards relevant to a group of asset(s), the set of all relevant resilient strategies for a group of asset(s), and the set of years during which a resilient strategy is effective. As previously discussed, the PLANNER Risk Matrix, the PLANNER list of resilient strategies, and the resilient strategy lifetimes will populate the elements of these respective sets.
the set of all hazards
the set of resilient options
the set years the resilient option is effective
Next, the list of constant parameters used as inputs for the mathematical ROI formulation is shown below.
- Department of Defense discount rate for economic analysis
- Expected lifetime of resilient strategy with no hazard
- Budget estimate of resilient strategy in year
- Number of expected occurrences of hazard during year
- Average expected impact reduction in the cost of occurrence of hazard with resilient strategy during year
- Averaged expected cost of occurrence (in $) of hazard during year
Related to the influence diagram (Figure 3), the and values will come directly from the PLANNER Risk Matrix, while the , , and values will come from the list of possible resilient strategies within PLANNER. Finally, the discount rate for the U.S. government and the DoD is used as recently suggested by the United States White House [9].
The ROI model includes a single binary variable, , equal to 1 if the resilient strategy, , is funded and implemented, and if otherwise.
Using these sets, constants, and the decision variable, ENPCs of implementing and not implementing resilient strategy are calculated.
The first function (2), , provides a mathematical representation of the expected NPC of not implementing resilient strategy, . In this formulation, the numerator consists of the cost in year, , among all hazards in calculated by multiplying the expected number of hazard, , occurrences in year, , by the expected cost of a single hazard, , occurrence in year, , without implementing a resilient strategy, . The denominator consists of one plus the discount rate raised to the power of the year, . Dividing the costs in the numerator by this value converts future costs beyond year to present costs to aid installation planners in understanding the present impacts of future costs.
Next, the second function (3), , provides a similar calculation for determining the expected NPC of implementing a strategy, . Alternative to the first function, we calculate cost in year, , among all hazards, , by multiplying the expected number of hazard occurrences in year, , with implementing a strategy, , by one minus the reduction in the expected number of hazard, , occurrences when a strategy, , is implemented. Finally, we multiply this reduced number of expected occurrences by the expected cost of a single hazard, , occurrence in year, . The total cost of implementing a strategy, , includes the possible implementation and maintenance cost, , of the resilient strategy, , in year, . All costs over the lifetime of the resilient strategy are converted to present costs by dividing by one plus the discount rate raised to the year, .
Finally, these functions are used to calculate the ROI of a particular resilient strategy,, by dividing the difference between our two ENPCs when and by the NPC of implementing a strategy, , without expected hazard costs.
The MVP ROI model provides a financial analysis for a given resilient strategy, . By design, the formulation is relatively easy to communicate and implement. Excessive notation was avoided to allow for better transition to PLANNER. Furthermore, this MVP could be extended to calculate the overall ROI on a portfolio of resilient strategies in .
This formulation is meant to be flexible for use with any desired hazards and resilient options. If a hazard does not impact an asset, then the ENPC would be equal to zero as the parameter . Alternatively, when a resilient option does not impact a hazard, then the vulnerability reduction parameter . Our current MVP ROI model captures both cases.
It is important to note that this ROI analysis is for planning purposes, we cannot guarantee that a resilience option will be successful. The planners must follow best practices by performing engineering studies to understand the asset, how a hazard impacts the asset, and how a resilient option impacts the asset(s) during a hazard. The data produced from these studies should be used in our model. The resilient option effectiveness will need to be updated based on actual hazard/resilient option results for future analyses.
3.3.2. Python Model Implementation
To create a transferable MVP ROI model to provide the ERDC and PLANNER teams, the ROI model was coded in Python. The Python implementation reads in inputs from PLANNER export files. In addition to the ROI calculations, the Python code creates figures and visualizations for installation planners.
The model calculates the ROI for resilient strategies for various hazards using the above mathematical formulation. The model prompts the user to select an Excel file containing the necessary data, processes these data, and calculates the expected NPCs and ROIs for different strategies. The necessary data include: a budget estimate of resilient strategies, the average number of expected hazard occurrences per year with and without resilient strategies, the average cost of occurrence with and without the resilient strategy, and the lifetime of each resilient strategy. All input parameter values are found in the PLANNER risk matrix and the PLANNER set of resilient strategies.
The model also allows for yearly changes in the expected number of hazard occurrences, average cost of hazard occurrence, and expected resilient strategy lifetime. Currently, we assume the resilient strategy budget estimate to be a one-time cost at year . However, the model allows for a year-over-year cost of the resilient strategy in the calculations when PLANNER has these data. After reading all the necessary data, the model calculates both functions, and . According to the mathematical formulation, these two values are used in an ROI function to calculate the ROI for each resilient option.
4. Results
For code verification, test cases were created that have a unique combination of number of hazards and whether the resilient strategy reduces the number of hazards occurrences or the impact of specific hazards. The current MVP model only uses PLANNER data from the risk matrix and the resilient strategies input by the installation planner. The risk matrix provides the average number of expected occurrences for each hazard per year and the average cost of each occurrence. The resilient strategy in PLANNER provides the implementation cost, the strategy lifetime, and the hazard(s) impact reduction. Finally, the U.S. discount rate is used to calculate and output the resulting net present costs with and without an implemented resilient strategy and the ROI for each resilient strategy.
Realistic test cases are essential to verify that the MVP ROI model can accurately handle various types of data inputs and provide reliable outputs that decision makers can use to assess different resilience strategies. Table 1 shows the test cases we developed for the ROI model based on strategies identified by the PLANNER development team and our research. The data in the table are notional and provide a comprehensive set covering a variety of hazards for an installation with several extreme weather hazards. Each test case includes parameters, such as occurrences per year, cost of occurrence, impact reduction, resilient strategy lifetime, resilient strategy cost, and yearly changes. These scenarios were created to test the code under diverse conditions, reflecting real-world scenarios. To ensure the realism of these test cases, notional data were taken directly from PLANNER screenshots where available.

Table 1.
Verification Scenario Data.
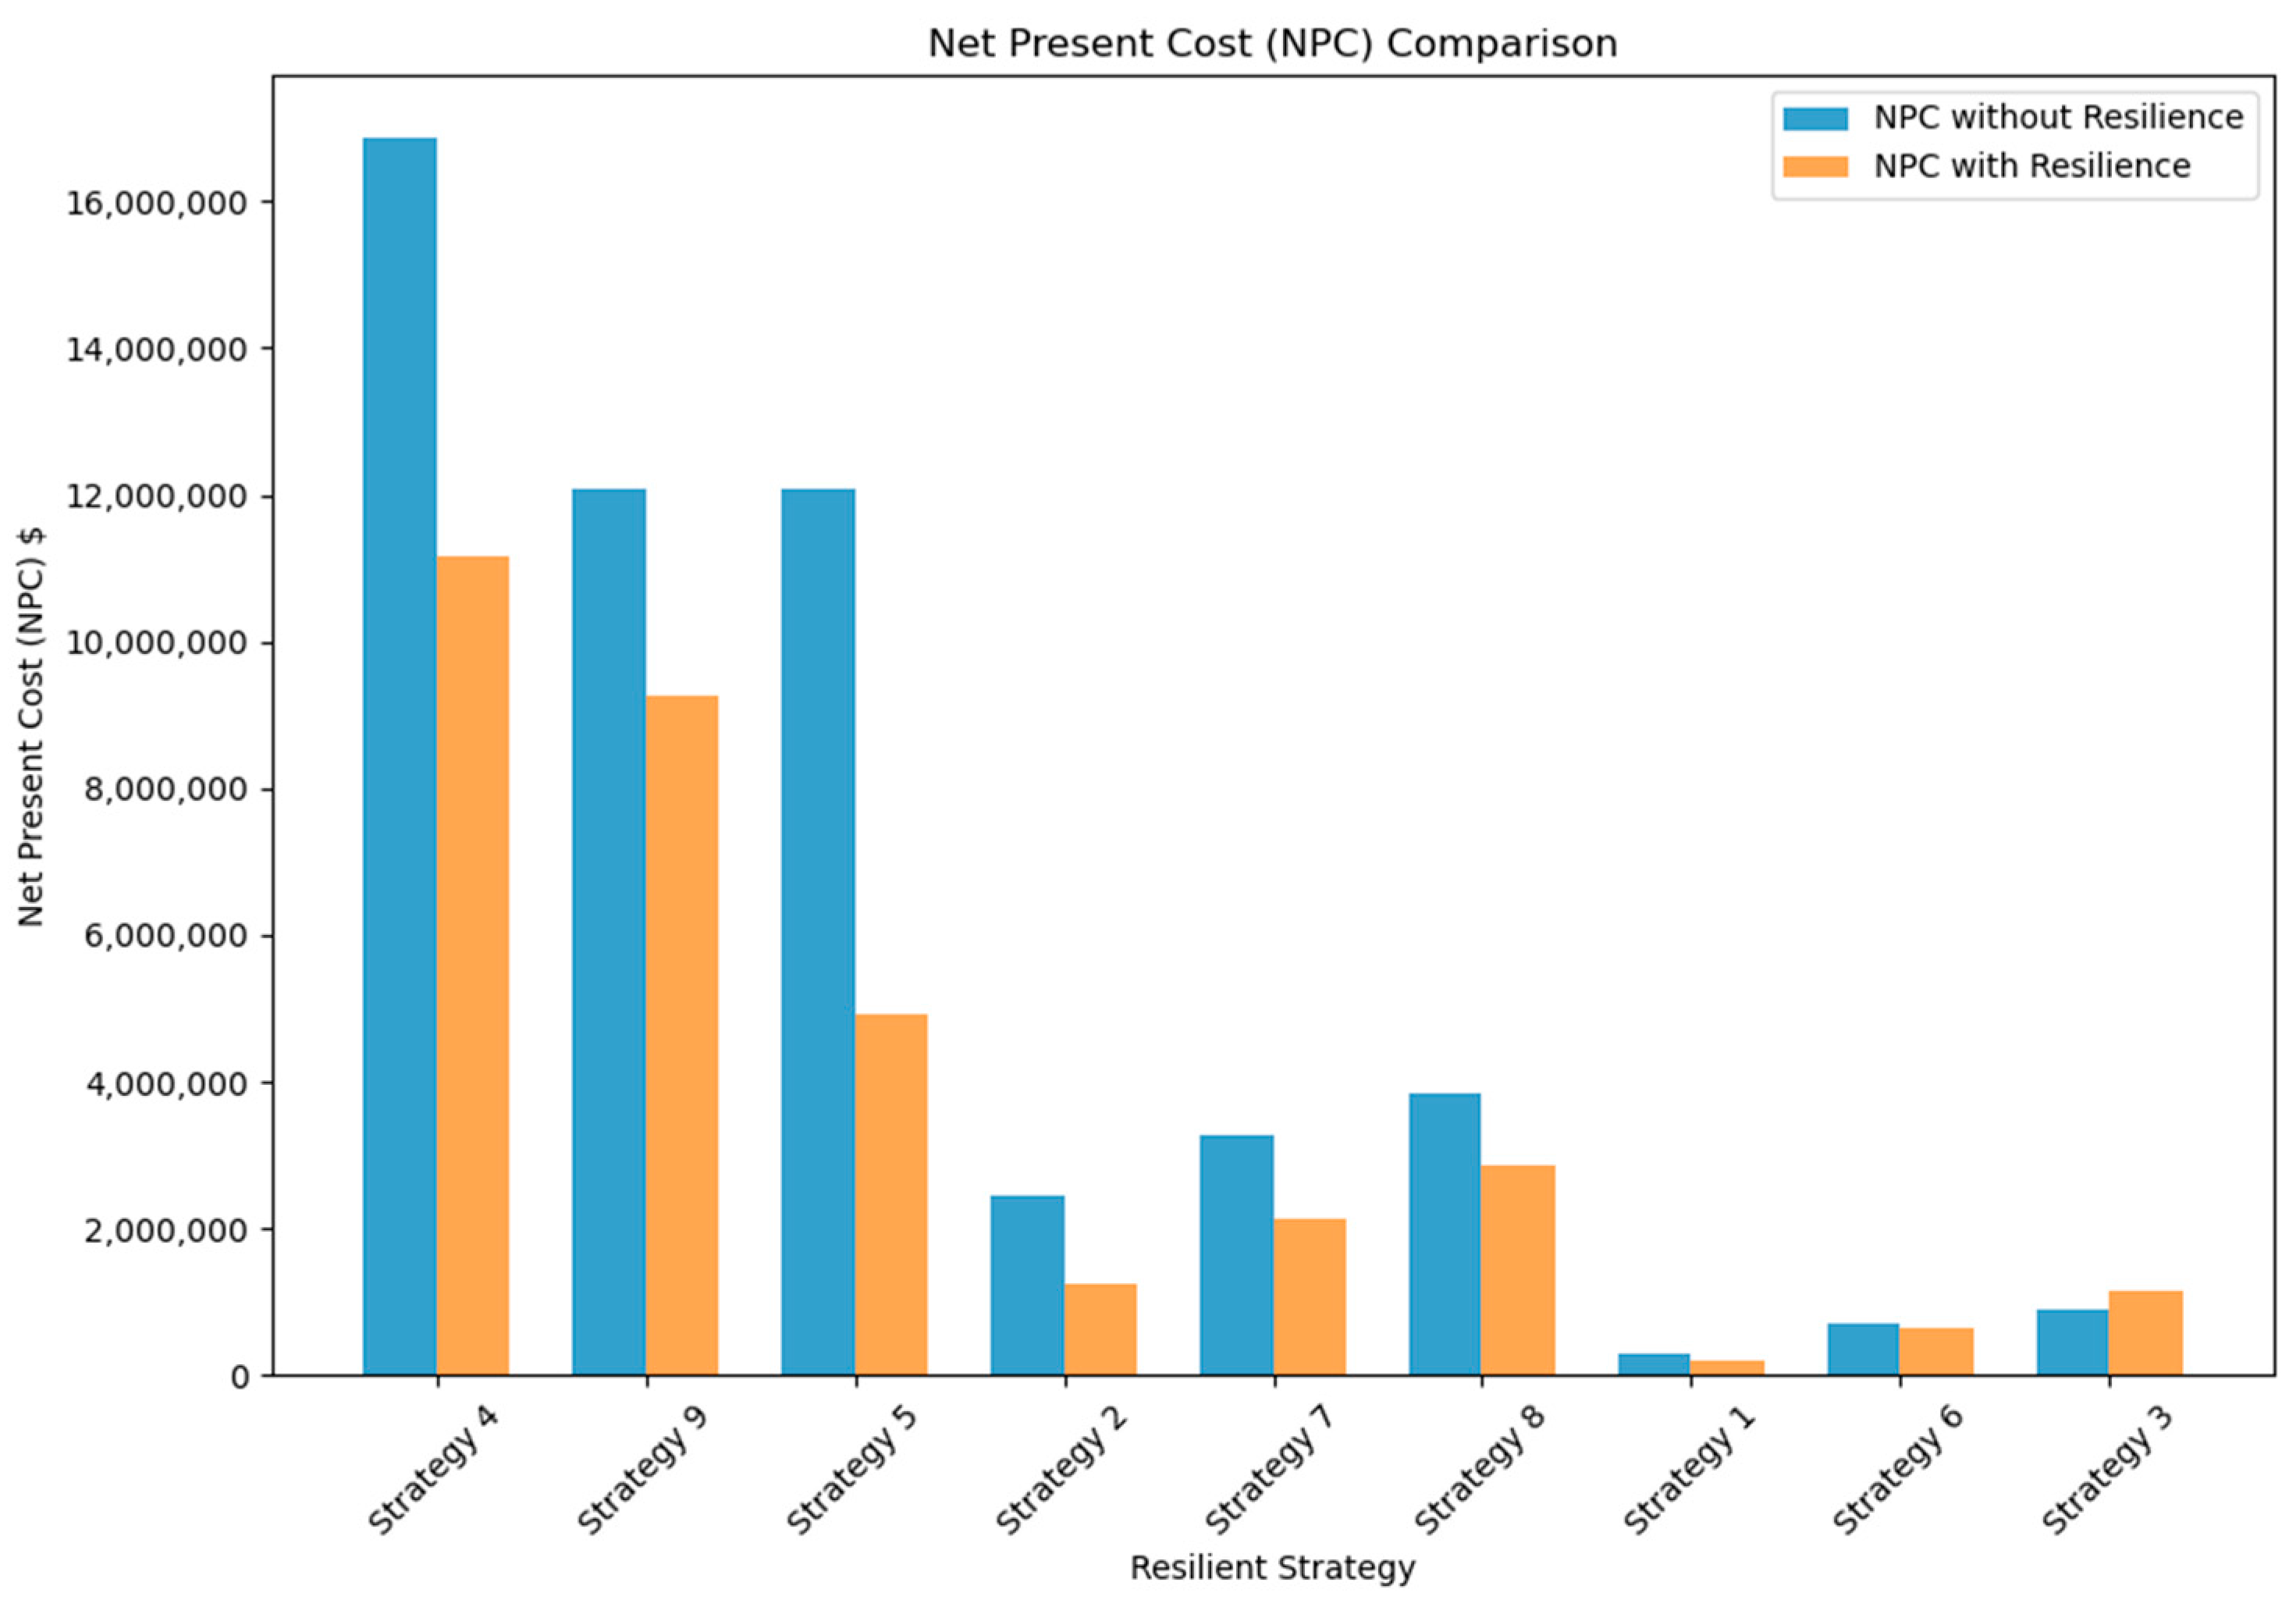
The results from running the ROI model on our test cases, found in Table 2, reveal significant differences in the expected NPC between scenarios with and without resilience funding. For example, Strategy 1 shows a reduction in expected NPC from $282,808 without resilience to $213,123 with resilience, resulting in a 70% ROI. Conversely, Strategy 3 indicates an increase in NPC from $894,004 to $1,164,305, yielding a negative ROI of −39%. The highest ROI observed is for Strategy 4 at 381%, where the expected NPC decreases dramatically from $16,875,826 to $11,159,390 upon funding the resilient strategy.
Table 2.
Verification Results.
It is important to consider both the expected NPCs and the ROIs in the results because of how ROI is calculated. ROI is determined by dividing the strategy induced savings by the cost of the strategy. This means that a strategy can have a high ROI even if the difference in expected NPC is not large, if the cost of the strategy is low. By examining both expected NPC and ROI, decision makers can gain a better understanding of the financial benefits and cost-effectiveness of different resilient strategies.
Figure 4 compares the NPC with and without selecting the resilient strategy over the lifetime of the resilient strategy. The difference in the bars represents the expected NPC of the expected savings that the resilient strategy would provide.
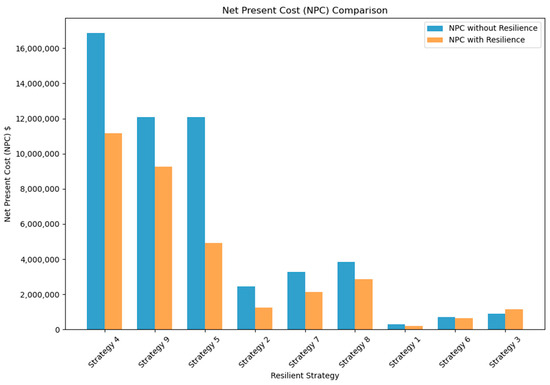
Figure 4.
Net Present Cost Comparison.
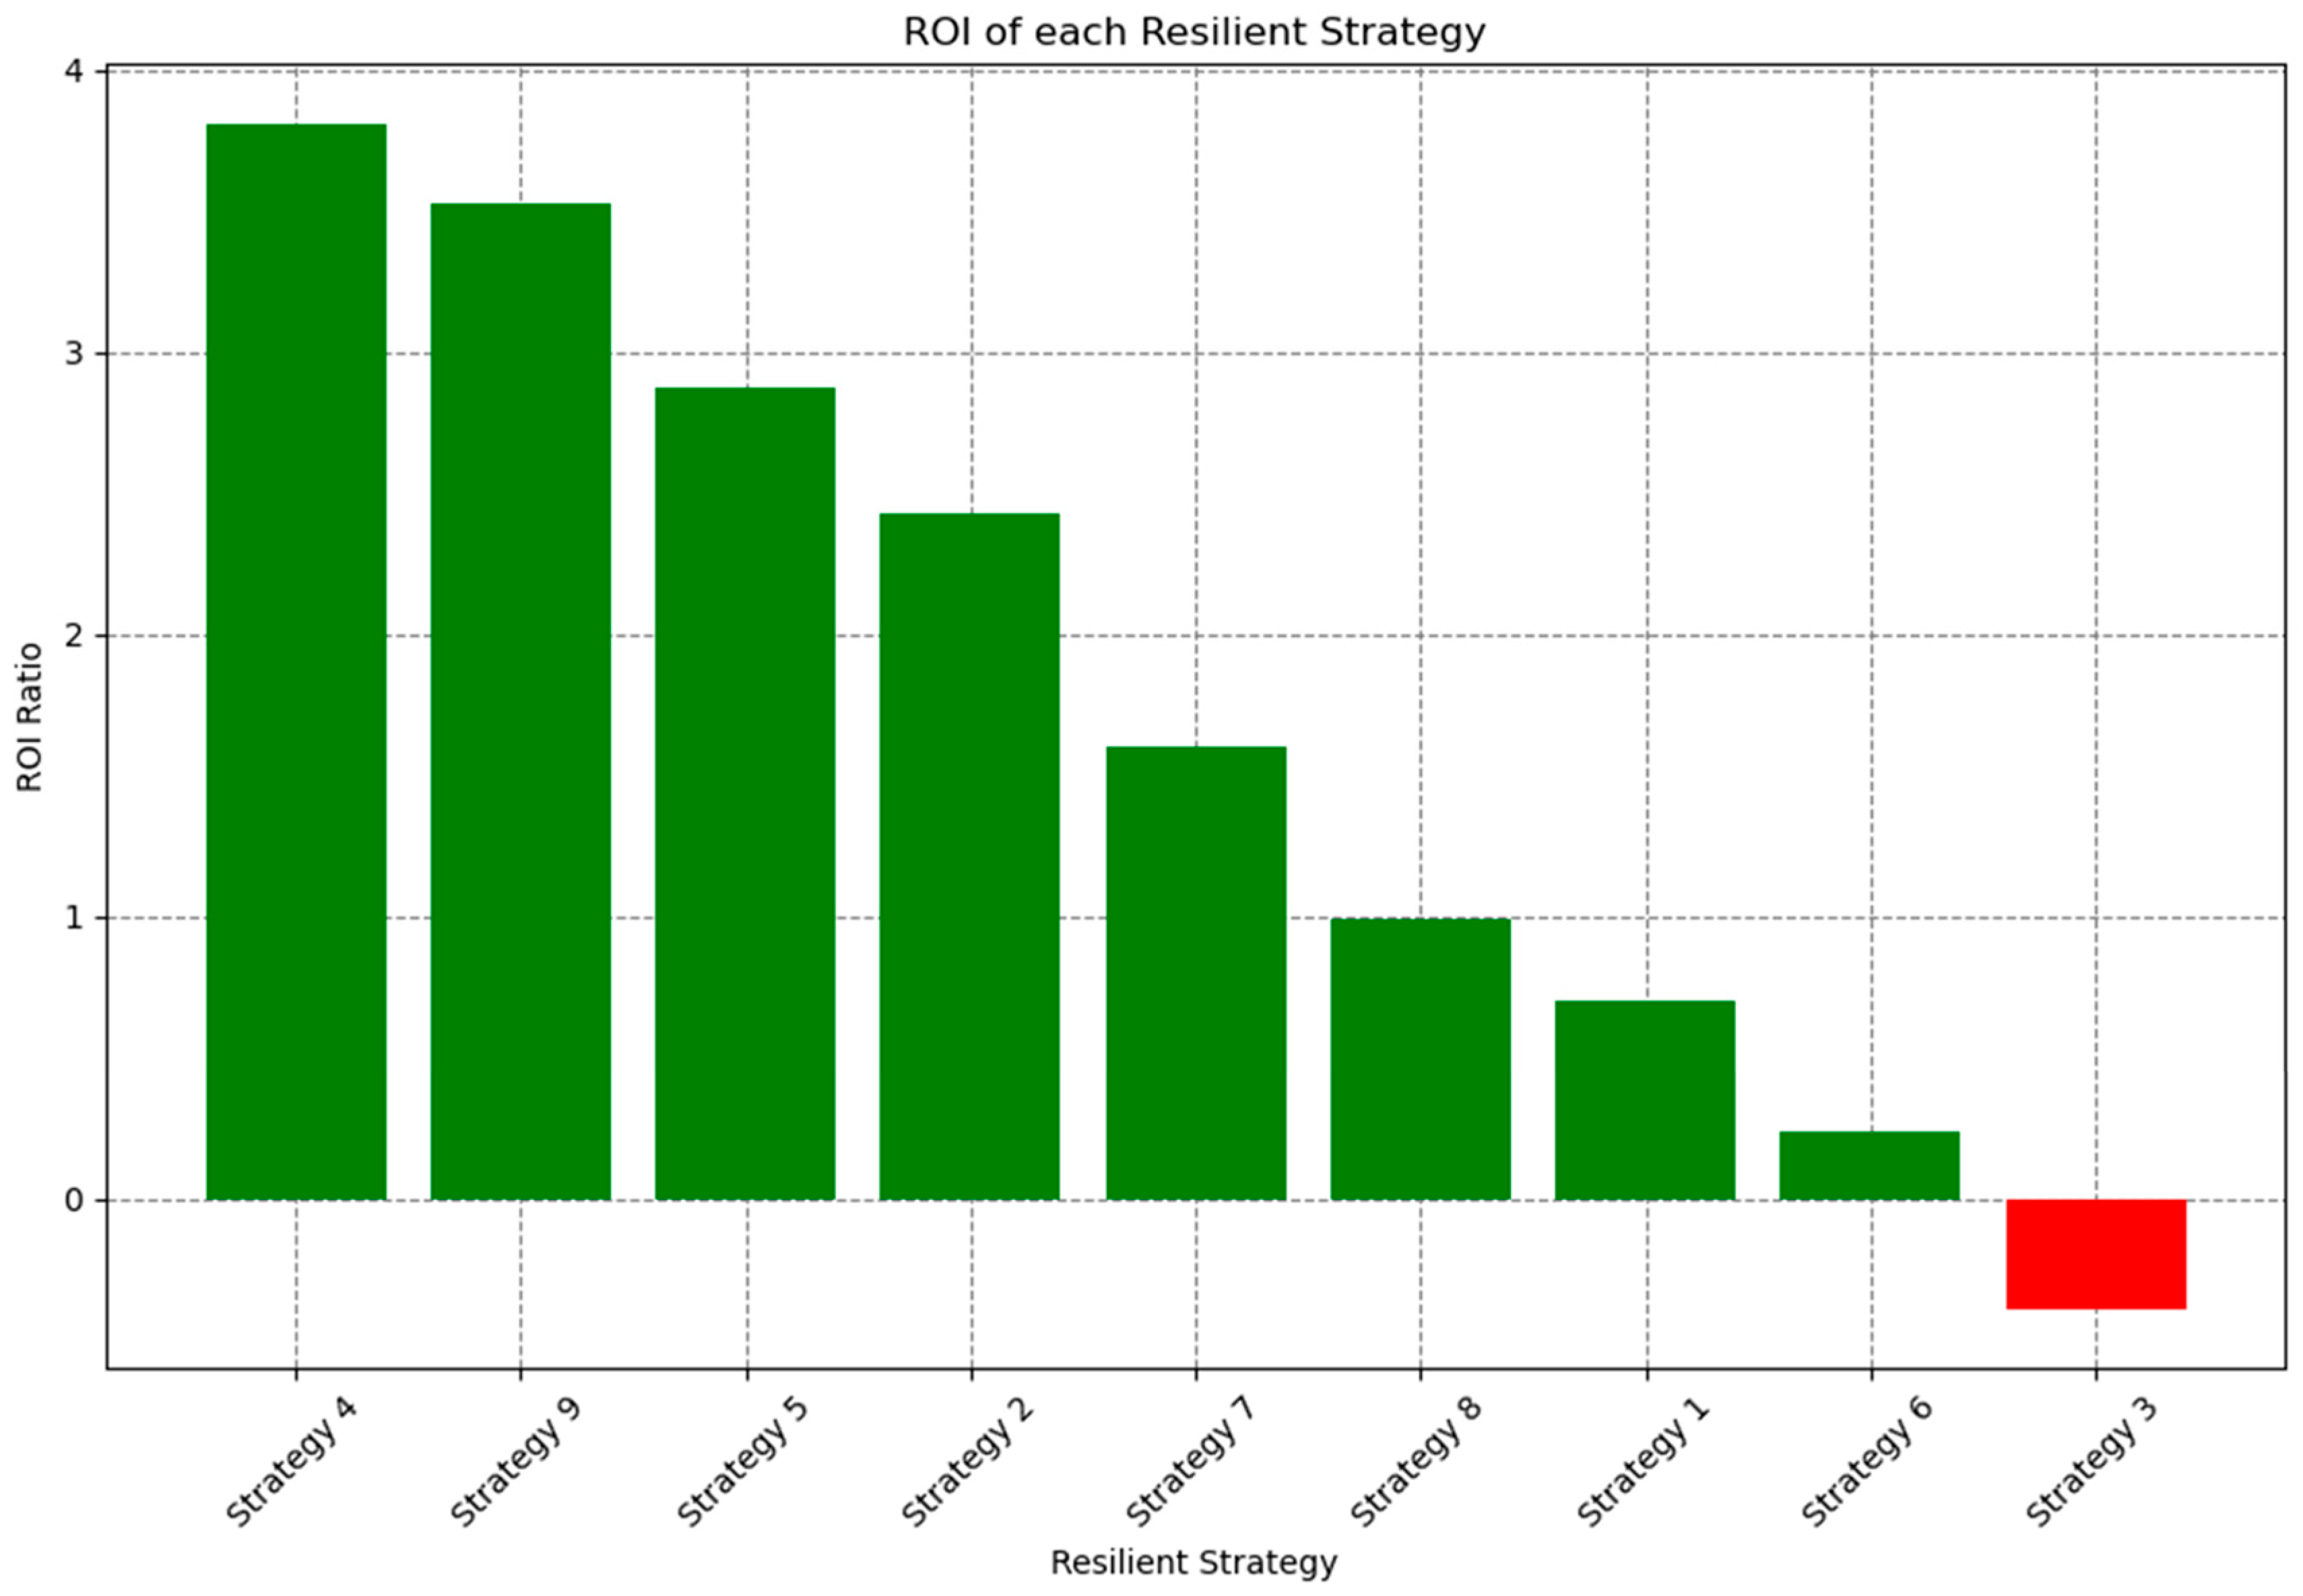
Figure 5 displays the ROI of each resilient strategy. Strategy 3 has a negative ROI, representing a loss on investment. Meanwhile, Strategy 4 has a ROI of 3.8, which represents a very large return on investment of 380%.

Figure 5.
Resilient Strategy Return on Investment.
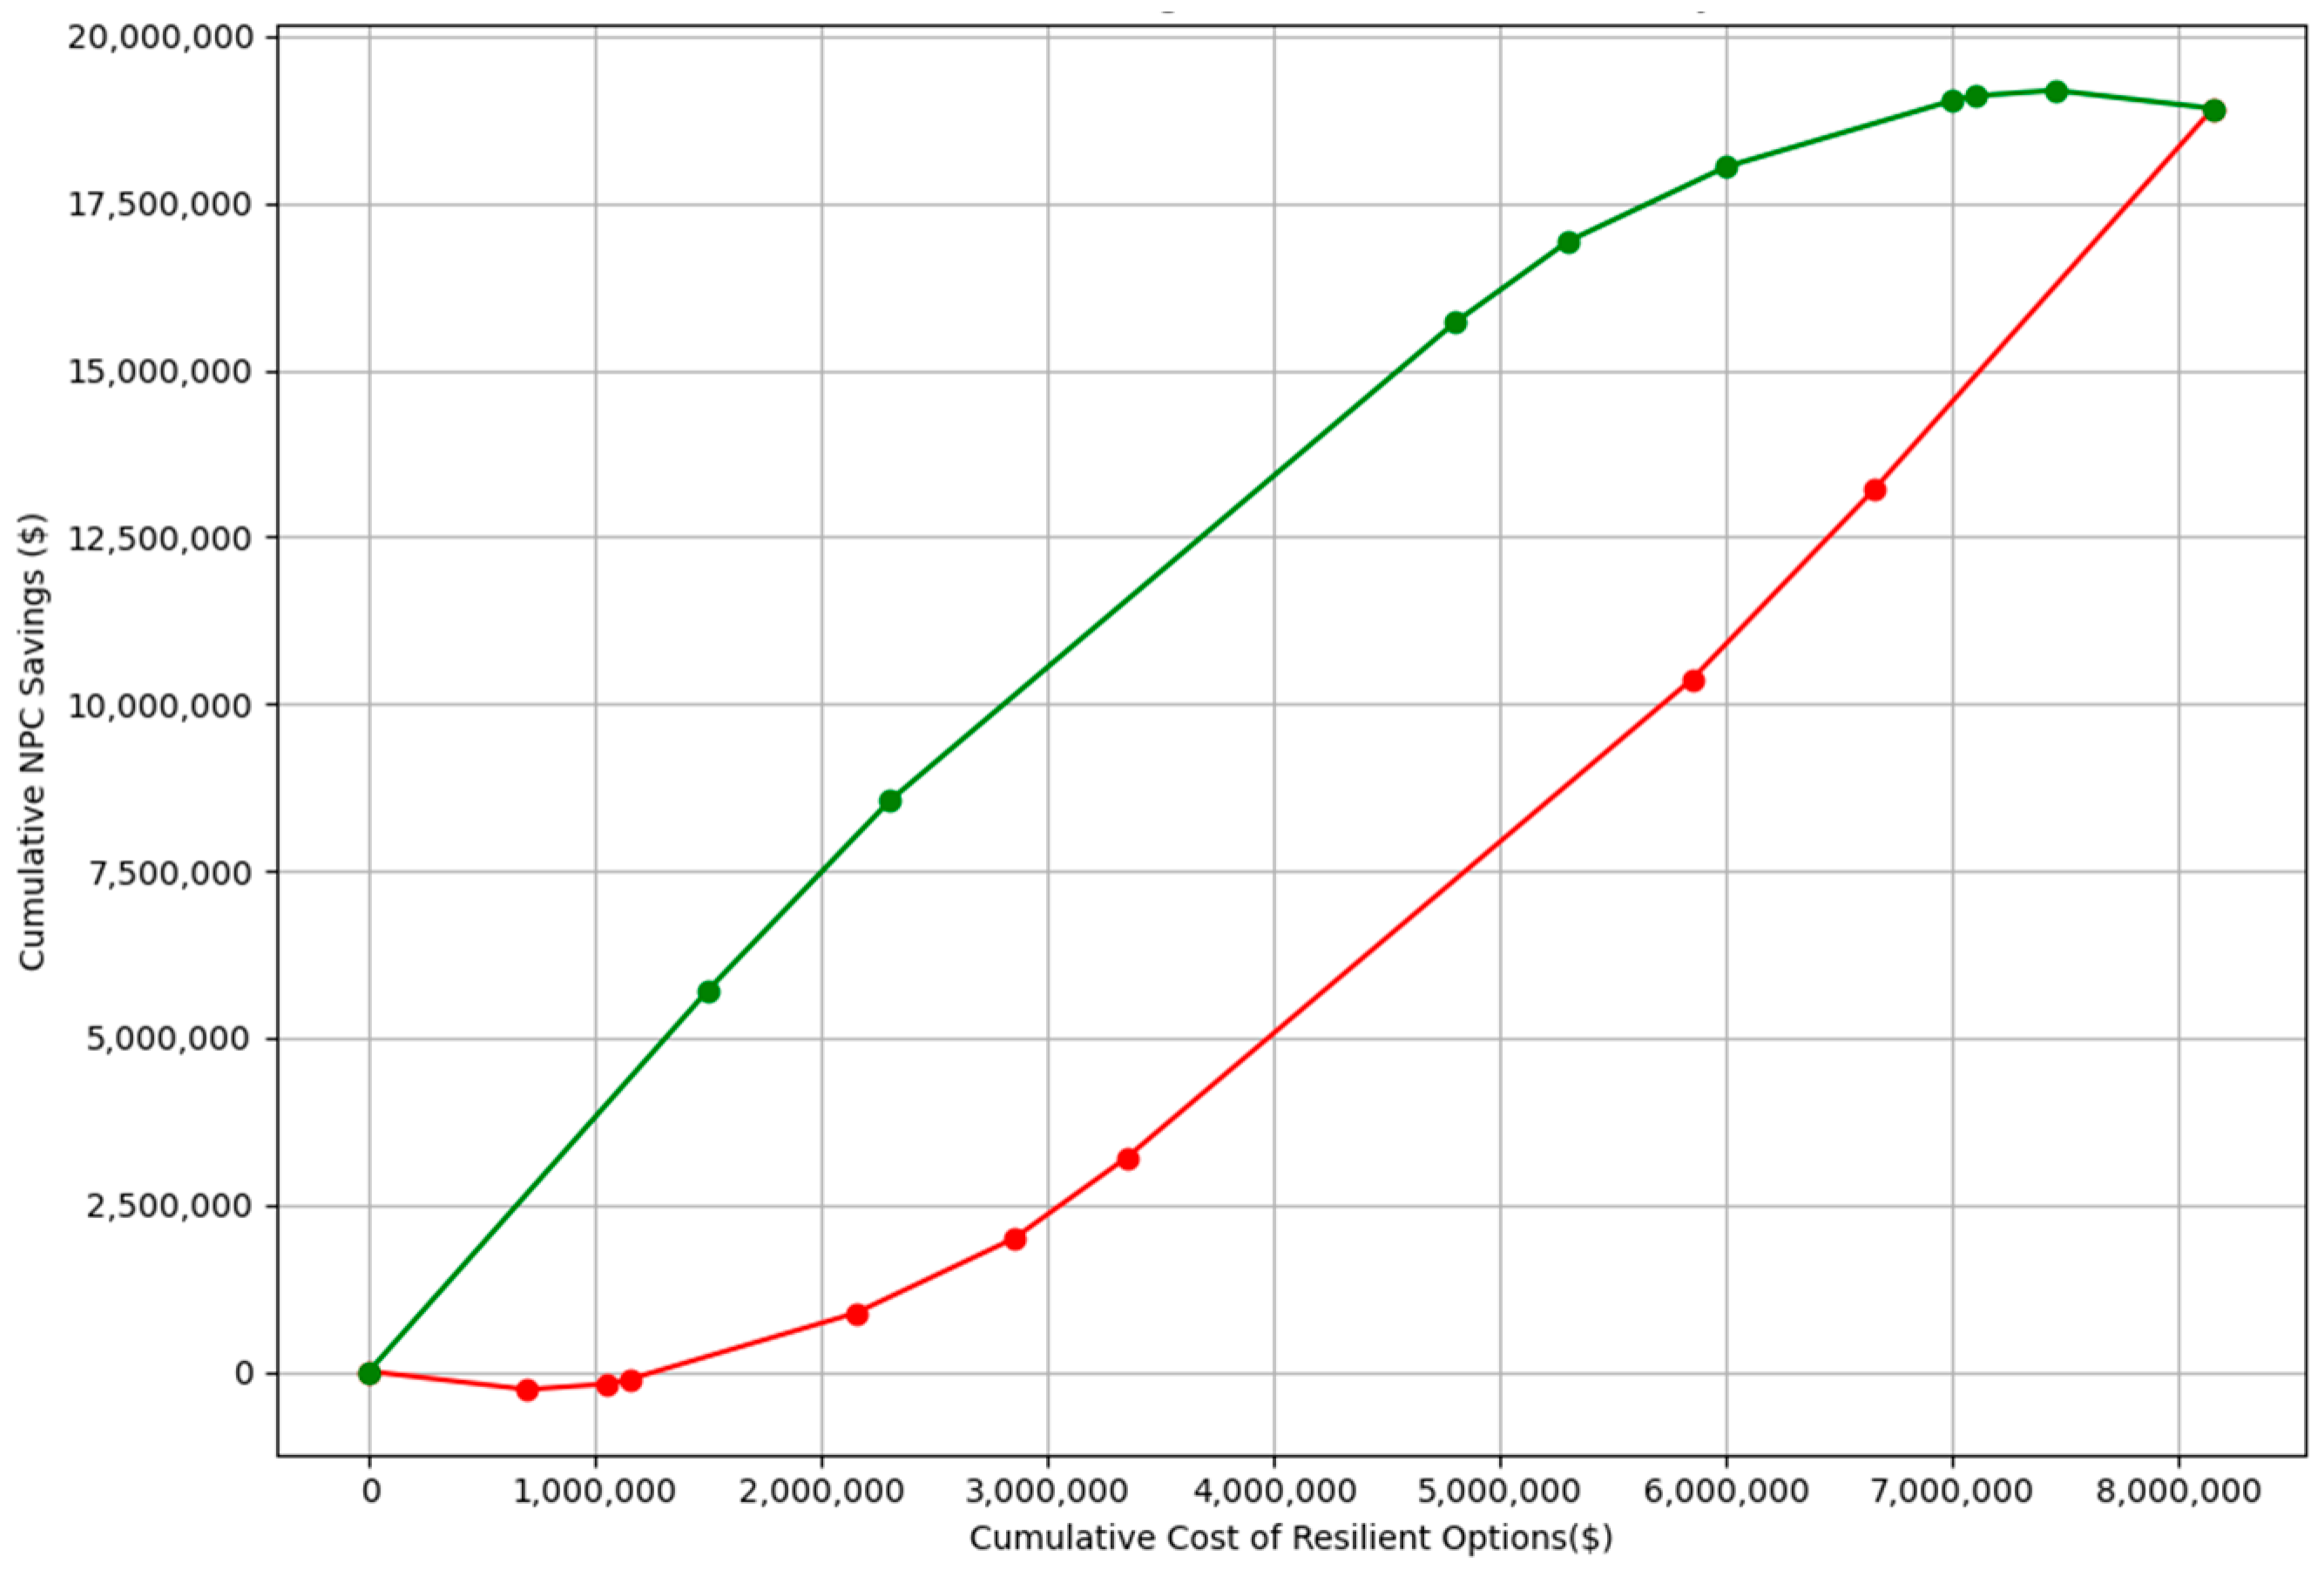
Figure 6 compares the cumulative expected NPC of funding multiple resilient strategies with the cumulative expected NPC savings. The top line in green represents the efficient frontier and the bottom line in red represents the inefficient frontier. Any portfolio of strategies funded would fall in the “football” region created by these two lines.
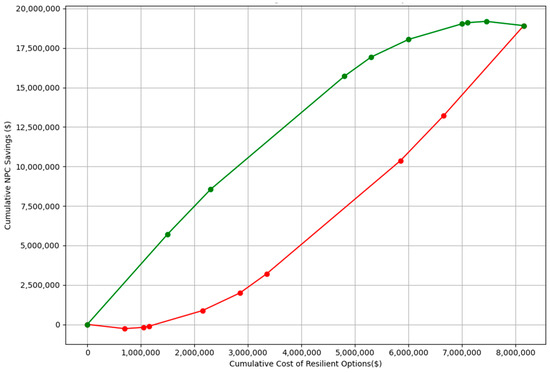
Figure 6.
Cumulative Cost versus Cumulative Savings.
To verify the results of our Python implementation, we developed an Excel model that directly implements the ROI mathematical formulation. The same test strategies found in Table 1 were used. The ideal output for the Excel model is to produce the same output values as the Python model. If consistent, then the Python model correctly implements the ROI mathematical formulation. When executing the Excel model with the strategies in Table 1, we found that the Python and Excel models produce the same results, seen in Table 2, with the exception to strategy 3. This is because the Python model selects the shortest resilient strategy lifetime when hazards have different lifetimes. The Excel model allows for the different lifetimes to be used. They produce the same answer when one lifetime is used for all hazards.
5. Future Research
In this current work, an MVP ROI was developed model using data in PLANNER to ensure the methodology satisfied Task 2.9. The model was limited by the availability of data on hazards and resilient strategies in PLANNER. Section 5.1 provides data sources that could make the model more data driven. Section 5.2 provides improvements that could be made to the methodology with or without improved data.
5.1. Potential Future Data Sources
To build a comprehensive decision support tool for installation planners, PLANNER uses information and data on three main types of data: installation assets, relevant hazards, and resilient options and strategies. With accurate data from these sources, installation planners can best understand the likelihood a particular hazard will impact them, the severity of that potential impact, the assets that might be impacted, as well as all the options for mitigating those impacts. In its current form, PLANNER does include data from all three of these data sources, but it requires installation planners to submit much of the necessary data for analysis. In this section, all the possible sources for each of these three data types are discussed and how PLANNER could use these data to centralize, standardize, and streamline their analysis. When applicable, the current and future use of each potential data source within PLANNER is described.
Figure 7 provides an influence diagram that identifies the future data sources that could be integrated into PLANNER for use in the ROI model.

Figure 7.
Potential Future PLANNER Data Sources for ROI Model.
Table 3 lists and describes the data sources in Figure 7 and provides the current accessibility, the type of data, and current or potential future use of each.
Table 3.
Potential Future Data Sources.
Where accessibility is categorized as “Available as data input”, the data source can be accessed by U.S. government employees or contractors for direct use but is not currently be used by PLANNER or our ROI model. Next, a “Needs approval” categorization denotes that the data source is not broadly available for government employees or contractors. “Needs further analysis” denotes that the data are available and suggests future research explores its usefulness when modeling ROI. A “PLANNER user inputs” designation means that these data are available and requires PLANNER users (installation planners) to submit that relevant data. Finally, a “Used in PLANNER” or “Used in ROI” model designation means that the data are currently available and being used within the PLANNER tool or in our ROI model, respectively.
In this future research section, all hazard-related data sources involve extreme weather-related hazards because the initial project scope only included such hazards. The late move to an all-hazards approach did not allow our University of Arkansas team enough time to research data sources for hazard data outside of extreme weather events. Future work to explore such data sources is encouraged.
First, multiple data sources provide information on installations, their specific geographical locations, and their assets. HQIIS refers to the Headquarters Installations Information System, and it is the authoritative source system for Army Real Property Assets. These assets could include but are not limited to installations, sites, enclaves, and bases. This information directly leads to the next two data sources: BUILDER and WELDER. The BUILDER Sustainment Management System is a web-based application produced by ERDC’s Construction Engineering Research Laboratory (CERL). It is used to help civil engineers, installation planners, and technicians decide when, where, and how to best maintain installation infrastructures. BUILDER uses real property data to identify key buildings and their components. With these data, BUILDER is able to produce their key life cycle attributes: age, material, and current condition. These data from BUILDER are then provided to WELDER, a decision support tool used to address natural hazards. WELDER allows users to visualize extreme weather projections to model the likelihood and severity of an extreme weather event’s impact on a particular building or asset.
Other data sources, RPLANS and ISR, provide useful data on facility conditions and capacities. These data are then used in FIA to build a framework integrating data sources like BUILDER and WELDER. This framework serves as the basis for a decision support tool assisting installation planners in asset investment analysis. As earlier discussed, FIA focuses on the maintenance and upkeep of installation assets and their components. These data sources, with additional analysis, would be useful for our ROI model because future work could provide more specific information on which assets could be fortified by some set of resilient strategies. PLANNER would need to incorporate these data sources without the required work from installation planners to specify the costs of particular asset damages. This allows for greater accuracy and finer detail when calculating ROI without the added burden on installation planners.
The next set of data sources provide historical and future information about extreme weather, hazards, and natural disasters that should be considered in installation planning. First, CMIP, CMRA, and DCAT all together provide useful data on climate hazard projections and their possible effects on installations. They are used to assist federal agencies when planning for future extreme weather events. CMIP has been developed by various researchers across the globe and is widely available. CMRA is a federally funded decision support and visualization tool for federal and public use. Finally, DCAT refers to the climate assessment tool produced by the DoD. DCAT is a tool, available to the U.S. government and contractors, that holds a collection of scientific data for use in research and decision making. As of right now, it has not been approved for use in PLANNER, but we strongly suggest its inclusion as it likely holds significant weather projections particularly relevant to DoD installations.
The community atmosphere model (CAM) is a global model produced by the National Science Foundation’s National Center for Atmospheric Research. As the table mentioned, CAM provides useful extreme weather simulations that could inform installation planners. Unlike the CMIP, CMRA, DCAT, and CAM, the USAF 14th Weather Squadron is the USAF’s only climate operations unit. It collects, holds, protects, and utilizes climate data for the DoD. Providing these data to the DoD maximizes the combat effectiveness of DoD personnel and weapons systems. This goal certainly includes using these data to better understand how, when, and to what severity past weather events affected DoD installations. Like the 14th Weather Squadron, the IMCOM SRM provides historical data. Alternative to particular weather events, IMCOM holds key information about the financial damage of past natural hazards. Their reports contain particular weather events, the dates in which they occurred, the installations they affected, and their related damage repair costs.
In its current form, PLANNER requires installation planners to input their number of hazard occurrences along with the cost of each occurrence. By including the previously described data sources, PLANNER can remove the administrative overhead on installation planners by generating these values based on historical data and/or future projections. Currently, PLANNER only uses ArcGIS data from ATLAS to build their risk matrix. Future inclusion of these data sources would increase the accuracy of this risk matrix. Furthermore, future work on the ROI model should use these data sources along with the IMCOM data to better assess the projected financial impacts of hazards among all U.S. Army installations.
Finally, for resilient options, data can currently be entered into PLANNER Resilient Strategy Database. The ROI model requires the following input values from these databases: resilient strategy implementation cost, the hazard(s) addressed by that resilient strategy, the resilient strategy’s predicted lifetime, and the expected hazard impact reduction from implementing that resilient strategy. This database is currently constructed using direct submissions within PLANNER from its users. Instead, future work should explore building a comprehensive resilient strategy database to be used broadly across the DoD. Currently, PLANNER requires installation planners to input their own self-described resilient strategy. To create more cohesive planning across the army and DoD, PLANNER should have a pre-populated list of resilient strategies from which the installation planner could choose. The strategies would need to have a cost range due to regional cost differences.
5.2. Future Methodology Improvements
While mathematically rigorous, the relevance of the MVP model relies on the accuracy of the data provided. Current PLANNER data consists of point estimates for the various constant input parameters, such as the average number of hazards and the average cost of hazards over some number of years. For these point estimates, PLANNER does not provide specific values for each year over the full planning horizon. These point estimates only allow for a deterministic analysis when calculating ROI due.
To improve our MVP model, future research should include probabilistic analysis and break-even analysis. To conduct a preliminary probabilistic analysis, we suggest two probability distributions be derived from historical data: one for the number of yearly occurrences for each hazard type over a predetermined number of years, and one for the yearly costs of each hazard type over the same time span. These probability distributions would allow for more accurate ROI analysis using Monte Carlo simulation. Once approved, DCAT’s inclusion within PLANNER may provide the necessary probability distributions.
For more long-term future research, we first suggest including predictive forecasts for yearly data points. In its current form, PLANNER data assumes that input values remain constant over the planning horizon. Alternatively, break-even analysis requires the inclusion of variable year-to-year values for all input data. With more accurate yearly projections, the model could assess when a resilient strategy may begin to return a positive (or negative) ROI. Such analysis would allow installation planners a better understanding of when they should (or should not) implement a specific resilient strategy. Climate change-induced hazards are notoriously difficult to forecast, according to subject matter experts. Alternatively, as climate change is likely accelerating or decelerating the number of hazard occurrences year over year, these difficulties should not stop future financial modelers from trying to include predictive data.
6. Summary
We developed the MVP All-Hazard Return on Investment (ROI) model to evaluate strategies to make army installations more resilient to hazards that could significantly impact their operations, facilities, and personnel. The University of Arkansas research team has worked with the ERDC/Forge PLANNER development team to develop the model using installation planning data (the all-hazards risk matrix and data on potential resilient strategies) in PLANNER. The software calculates the net present cost (NPC) of not funding each potential resilient strategy, the NPC if each resilient strategy is funded, and the ROI for each resilient strategy. The outcome provides the essential data that installation planners need to identify and justify the most promising resilient strategies for their installation. The ROI model provides credible and consistent data for army installation managers and army and DoD resource allocation decision makers. In addition, we identify opportunities for future research using planned Army data analytic programs to make the ROI model more data-driven and to allow it to have higher fidelity.
Author Contributions
Conceptualization, G.S.P. and R.B.; Methodology, G.S.P., E.S., R.M.C. and S.W.; Software, A.B.; Validation, E.S.; Formal Analysis, R.M.C. and E.S.; Investigation, G.S.P. and E.S.; Resources, G.S.P.; Data Curation, E.S. and P.R.A.; Writing—Original Draft Preparation, G.S.P.; Writing—Review and Editing, R.M.C. and E.S.; Visualization, G.S.P. and A.B.; Supervision, G.S.P. and R.B.; Project Administration, G.S.P., R.M.C., and J.P.R.; Funding Acquisition, R.B. and S.W. All authors have read and agreed to the published version of the manuscript.
Funding
This research was funded by Engineer Research and Development Center Contract W912HZ22C0050 with the University of Arkansas.
Data Availability Statement
The data for the ROI model verification scenarios is available by contacting Patrick Ables, patrick.r.ables@erdc.dren.mil.
Acknowledgments
The authors would like to thank the stakeholders that we interviewed and the support of the Carol Maddox and her PLANNER development team at the Forge for the help in implementing changes to PLANNER to provide the data we needed for the ROI model.
Conflicts of Interest
The authors declare no conflicts of interest.
Acronyms
| AHRA | All-Hazards Risk Analysis |
| AIS IP | Army Installations Strategy Implementation Plan |
| AMC | Army Materiel Command |
| ARNG | Army National Guard |
| ASA IE&E | Assistant Secretary of the Army for Installations, Energy and Environment |
| ASA IH&P | Assistant Secretary of the Army Installations, Housing, and Partnerships |
| BAA | Broad Agency Announcement |
| BAT | Building Assessment Tool |
| BOS | Base Operating Support |
| CAC | Common Access Card |
| CMIP | Coupled Model Intercomparison Project |
| CMRA | Climate Mapping for Resilience and Adaptation |
| DCAT | DoD Climate Assessment Tool |
| DISDI | Defense Installations Spatial Data Infrastructure |
| EO | Executive Order |
| ERDC | Engineer Research and Development Center |
| FIA | Facility Investment Analytics |
| GSA | General Services Administration |
| HQIIS | Headquarters Installation Information System |
| ICRP | Installation Climate Resilience Plan |
| IMCOM | Installation Management Command |
| ISR | Installation Status Reports |
| ITL | Information Technology Laboratory of ERDC |
| MCL | Measures and Cost Library |
| MDI | Mission Dependency Index |
| MILCON | Military Construction |
| MVP | Minimum Viable Product |
| NOAA | National Oceanographic and Atmospheric Administration |
| NCF | National Critical Functions |
| NPC | Expected Net Present Cost |
| O&M | Operations and Maintenance |
| RPLANS | Real Property Planning and Analysis System |
| ROI | Return on Investment |
| SACS | South Atlantic Coastal Study |
| SRM | Facilities Sustainment, Restoration, and Modernization funding |
| UARK | University of Arkansas |
| USACE | United States Corps of Engineers |
| VTIME | Virtual Testbed Installation for Mission Effectiveness |
Appendix A
We performed extensive stakeholder interviews. Table A1 lists the stakeholder interviews that we conducted in our research and describes the major findings from each interview that were directly used in our research.
Table A1.
Stakeholder Interview Findings.
Table A1.
Stakeholder Interview Findings.
| Interviewee Position | Major Findings |
|---|---|
| Chief of Real Estate Division USACE District |
|
| Chief of Cost Estimation Division at the USACE |
|
| Climate and Sustainability Director at the Government Services Agency (GSA) |
|
| USACE District Planning Manager |
|
| MILCON Economist USACE |
|
| Air Force 14th Weather Squadron |
|
| WELDER Developers, Lawerence Berkeley National Laboratory |
|
| VTIME Developers |
|
| FIA Developers |
|
| Installation Planner in Colorado Army Material Command |
|
| BUILDER Developers |
|
| Senior Coastal Engineer US Army Corps of Engineers |
|
Notes
| 1 | Revised DoDI 4715.AG, Integrated Installation Resilience, dated 12 August 2024. |
| 2 | The other tasks in the strategy were not related to our project. |
References
- Lachman, B.E.; Briggs, R.J.; Wilson, M.T.; Resetar, S.A.; Niewijk, J.; Song, P. Valuing Army Installation Resilience Investments for Natural Hazards: Exploring the Use of Insurance Methods and Historical Installation Storm Damage. 2023. Available online: https://www.rand.org/pubs/research_reports/RRA2382-1.html (accessed on 3 March 2023).
- Cottam, B.J.; Specking, E.A.; Small, C.A.; Pohl, E.A.; Parnell, G.S.; Buchanan, R.K. Defining Resilience for Engineered Systems; Canadian Center of Science and Education: Toronto, ON, Canada, 2019; Volume 8. [Google Scholar]
- Narayanan, S.; Stephenson, R.; Wilson, M.T.; McCollester, M.; Weilant, S.; Yonekura, E.; Ishikawa, S.; Balagna, J.; Grocholski, K.R.; Chhatiawala, N. Accounting for Climate Resilience in Infrastructure Investment Decision-making A Data-Driven Approach for Department of the Air Force Project Prioritization; RAND Corporation: Santa Monica, CA, USA, 2023. [Google Scholar]
- Lauland, A.; Regan, L.; Resetar, S.A.; Acosta, J.D.; Ali, R.; Chan, E.W.; Donohue, R.H.; Ecola, L.; Gulden, T.R.; Kolb, C.; et al. Strategies to Mitigate the Risk to the National Critical Functions Generated by Climate Change; RAND: Santa Monical, CA, USA, 2023. [Google Scholar]
- Department of Defense, Office of the Undersecretary for Acquisition and Sustainment. DoDD 4715.21 Climate Change Adaption and Resilience. January 2016. Available online: https://dod.defense.gov/Portals/1/Documents/pubs/471521p.pdf (accessed on 3 March 2023).
- Department of Defense, Department of the Army. Army Installations Strategy: Supporting the Army in Multiple Domains. December 2020. Available online: https://apps.dtic.mil/sti/pdfs/AD1118920.pdf (accessed on 3 March 2023).
- 118th Congress. National Defense Authorization Act for Fiscal Year 2024. 2023. Available online: https://www.govtrack.us/congress/bills/118/hr2670 (accessed on 3 March 2023).
- Department of Defense. Army Climate Strategy Implementation Plan. 2022. Available online: https://www.army.mil/e2/downloads/rv7/about/2022_Army_Climate_Strategy_Implementation_Plan_FY23-FY27.pdf (accessed on 3 March 2023).
- United States White House. Valuing the Future: Revision to the Social Discount Rate Means Appropriately Assessing Benefits and Costs. 27 February 2024. Available online: https://www.whitehouse.gov/cea/written-materials/2024/02/27/valuing-the-future-revision-to-the-social-discount-rate-means-appropriately-assessing-benefits-and-costs/ (accessed on 3 March 2023).
- Parnell, G.S.; Bresnick, T.; Tani, S.N.; Johnson, E.R. Handbook of Decision Analysis, 2nd ed.; Operations Research/Management Science Handbook Series; Wiley & Sons: Hoboken, NJ, USA, 2025. [Google Scholar]
- Howard, R.A.; Matheson, J.A. Influence Diagrams. Decis. Anal. 2005, 2, 127–143. [Google Scholar] [CrossRef]
- Bier, V. The Role of Decision Analysis in Risk Analysis: A Retrospective. Risk Anal. 2020, 40, 2207–2217. [Google Scholar] [CrossRef]
- Huang, D.; Liu, M.; Li, M. Researches and Applications on Occupational Hazards Evaluation Technologies Based on Risk Analysis. Adv. Intell. Syst. Res. 2014, 102, 266–272. [Google Scholar]
- Dai, H.; Huang, G.; Zeng, H.; Yu, R. Haze Risk Assessment Based on Improved PCA-MEE and ISPO-LightGBM Model. Systems 2022, 10, 263. [Google Scholar] [CrossRef]
- Chung, H.-Y.; Ting, T.-H.; Chang, K.-H. A Novel Intuitionistic Fuzzy Set-Based Risk Priority Number Method for Solving Chemical Experiment Risk Evaluation. Systems 2024, 12, 155. [Google Scholar] [CrossRef]
- Li, Y.; Zue, H.; Wei, S.; Wang, R.; Liu, F. A Machine Learning Approach for Investigating the Determinants of Stock Price Crash Risk: Exploiting Firm and CEO Characteristics. Systems 2024, 12, 143. [Google Scholar] [CrossRef]
- Feng, C.; Wang, H. Proportionality of hazards in competing risk analysis. Statistics 2013, 47, 654–661. [Google Scholar] [CrossRef]
- Kappes, M.S.; Keiler, M.; von Elverfeldt, K.; Glade, T. Challenges of analyzing multi-hazard risk: A review. Nat. Hazards 2012, 64, 1925–1958. [Google Scholar] [CrossRef]
- Owolabi, T.A.; Sajjad, M. A global outlook on multi-hazard risk analysis: A systematic and scientometric review. Int. J. Diaster Risk Reduct. 2023, 92, 103727. [Google Scholar] [CrossRef]
- Ayyub, M.; McGill, W.L.; Kaiminskiy, M. Critical Asset and Portfolio Risk Analysis. Risk Anal. 2007, 27, 789–801. [Google Scholar] [CrossRef] [PubMed]
- Liu, B.; Han, X.; Qin, L.; Xu, W.; Fan, J. Multi-hazard risk mapping for coupling of natural and technological hazards. Geomatrics Nat. Hazards Risk 2021, 12, 2544–2560. [Google Scholar] [CrossRef]

Disclaimer/Publisher’s Note: The statements, opinions and data contained in all publications are solely those of the individual author(s) and contributor(s) and not of MDPI and/or the editor(s). MDPI and/or the editor(s) disclaim responsibility for any injury to people or property resulting from any ideas, methods, instructions or products referred to in the content. |
© 2025 by the authors. Licensee MDPI, Basel, Switzerland. This article is an open access article distributed under the terms and conditions of the Creative Commons Attribution (CC BY) license (https://creativecommons.org/licenses/by/4.0/).