Abstract
In overweight and obese patients, elevated serum and breastmilk leptin concentrations are observed, with serum leptin also being likely affected by the diet. We analyzed serum and breastmilk leptin in normal weight (NW) and overweight/obese (OW/OB) mothers, and evaluated its associations with (1) maternal anthropometric parameters; (2) markers of cardiometabolic health; and (3) the maternal diet. The BLOOM (Breastmilk and the Link to Overweight/Obesity and Maternal diet) study was conducted among 40 women (n = 20 OW/OB; n = 20, NW) who were exclusively or predominantly breastfeeding for 15.5 ± 1.2 (OW/OB group) weeks. We collected 24 h breastmilk and fasting blood samples for leptin analysis by ELISA. Maternal dietary habits were evaluated using a 3-day dietary record and food frequency questionnaire, which were used to calculate the Polish-adapted Mediterranean Diet score. Maternal anthropometric measurements and DEXA scans were performed, and anthropometric and cardiometabolic indices were calculated. The OW mothers had 1.4 times higher serum levels, while OB mothers had 4.5 and 6.2 higher serum and breastmilk leptin levels, respectively, in comparison to the NW mothers. The FM% was correlated with serum and breastmilk leptin levels (r = 0.878, r = 0.638). Serum leptin was associated with markers of cardiometabolic health such as AIP, CMI, and VAI in the NW mothers, and with LAP in the OW/OB mothers. Higher energy, fructose intake and adherence to the Mediterranean diet were associated with serum leptin in the NW mothers (β = 0.323, 0.039–0.608; β = 0.318, 0.065–0.572; β = 0.279, 0.031–0.528); meanwhile, higher adherence to the Mediterranean diet could protect against elevated breastmilk leptin concentrations in OW/OB mothers (β = −0.444, −0.839–−0.050), even after adjustment for FM%. Our results suggest a potential association between maternal serum leptin concentrations and cardiometabolic health. In addition, we confirm the importance of healthy dietary patterns in the improvement of breastmilk composition.
1. Introduction
Breastfeeding is a gold standard in infant nutrition because of the various health and developmental benefits associated with the unique composition of breastmilk [1,2]. Breastmilk contains highly bioavailable nutrients and a variety of bioactive factors including leukocytes, stem cells, immunoglobins, beneficial microbes, hormones, and growth factors. In addition, the concentrations and ratios of these compounds exhibit diurnal variation, change dynamically throughout lactation, and are unique to each infant–mother dyad [1,3,4,5]. Among the environmental, parental, and infant-related factors that may contribute to the variation in breastmilk composition [3,4], the maternal health status and lifestyle, including diet and obesity, are some of the most widely discussed [4].
Currently, one-third of the global population is overweight or obese, and the prevalence has doubled since 1980 [6]. Thus, obesity-related diseases are an increasing public health burden, particularly due to non-communicable chronic diseases and their adverse effects on reproductive health [7,8]. In OW/OB mothers, lower rates of breastfeeding initiation and exclusivity, as well as a shorter duration of breastfeeding, have been observed [4]. Obesity and elevated adiposity also alter the composition of breastmilk, in particular the concentration of adipokines, the antioxidant profile, and inflammatory properties [4,9,10]. Adipokines, including leptin or adiponectin, are hormones produced by adipose tissue. OW/OB individuals secrete more leptin, which subsequently leads to the development of leptin resistance [10,11]. Leptin has a pleiotropic activity as it is involved in the regulation of energy homeostasis, food intake, and appetite, as well as fat and glucose metabolism [12]. On the other hand, alterations in the release of leptin and other cytokines (e.g., tumor necrosis factor-α (TNF-α), interleukin-6 (IL-6), and other adipocytokines) by adipose tissue could cause homeostasis imbalance, reduce insulin sensitivity, and increase inflammation and contractility. These metabolic changes play a critical role in the development and progression of many non-communicable diseases [13]. In consequence, leptin is used as a biomarker of systemic inflammation and cardiovascular disease (CVD) risk [13,14]. Up to this day, leptin has been associated with the increased risk of CVD or metabolic diseases, some types of cancer, and depression [8,11,12,15]. Contrary, it also appears to have a protective effect on bone health [16], while breastmilk leptin specifically could further be one of the key regulators of nutritional programming [17,18]. Previous studies have shown that not only obesity but also diet could positively or negatively influence leptin secretion [19].
Therefore, this study aimed to analyze the serum and breastmilk leptin levels among normal weight (NW) and overweight/obese (OW/OB) mothers, and explore the association with (1) maternal anthropometric parameters; (2) markers of cardiometabolic health; and (3) the maternal diet.
2. Materials and Methods
2.1. Study Group
This case–control BLOOM (Breastmilk and the Link to Overweight/Obesity and Maternal diet) study was conducted between October 2022 and April 2023 among 40 mothers who exclusively or predominantly breastfed for 15.5 ± 1.2 weeks. The study group was divided into two groups: those with a normal body mass index (BMI, 18.50–24.99, kg/m2; NW group) and those with overweight or obesity (BMI, ≥25.00, kg/m2; OW/OB), according to the WHO criteria [20]. Participants were recruited through convenience sampling from the local community using social media groups, and were selected based on inclusion and exclusion criteria (Figure 1). The study was conducted in accordance with the Helsinki Declaration and was approved by the Ethics Committee of the Faculty of Human Nutrition and Consumer Sciences, Warsaw University of Life Sciences, Poland (Resolution No. 53/2021, 20 December 2021).
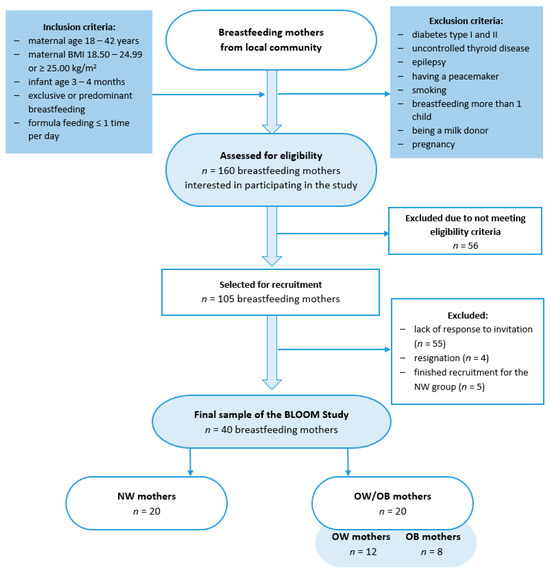
Figure 1.
Flowchart of the study group selection. BLOOM, Breastmilk and the Link to Overweight/Obesity and Maternal diet); NW, normal weight; OW/OB, overweight or obese.
Based on the breastmilk leptin levels reported in the studies by Lemas et al. [21] and De Luca et al. [22], we calculated a minimum sample size using the G*Power Software 3.1.9.7 [23]. To achieve statistically significant results (80% power, significance level at 0.05), we needed to include 9 or 16 mothers in each group (n = 18 or n = 32 in total). We decided to recruit a higher number of participants, and in case of any data loss, we recruited twenty mothers for each group.
2.2. Breastmilk Collection
Within 24 h before the study visits, mothers were asked to collect breastmilk samples according to the instructions, which were designed to minimize diurnal and intra-feeding [5] variations in the breastmilk composition. Before and after one selected feeding from each of the four time periods (6:00–12:00; 12:00–18:00; 18:00–24:00; 24:00–06:00), mothers expressed an equal volume of fore- and hindmilk into one polypropylene bottle. The sample was stored and transported to the laboratory under refrigerated conditions and protected from light. In the laboratory, the samples were mixed in a Vortex shaker IKA MS2 (IKA Works Inc., Wilmington, NC, USA) for one minute, transferred into 2 mL Eppendorf tubes, and stored at −80 °C for further analysis.
2.3. Blood Collection
Fasting blood samples were collected from the ulnar vein between 7:00 a.m. and 10:00 a.m. on the day of the study visit using standard techniques. The blood samples for further analysis were centrifuged at 8000 rpm for 10 min at 4 °C and serum was stored at −80 °C.
2.4. Biochemical Analysis
Biochemical analysis of the lipid profile (total cholesterol (CHOL), HDL cholesterol (HDL-C), LDL cholesterol (LDL-C), triglycerides (TG)) was performed by the certified laboratory using standard methods. Meanwhile, the LDL-C was calculated according to the Friedewald formula [24].
The serum and skim breastmilk leptin concentrations were measured by the immunoenzymatic ELISA test using a commercially available Human Leptin Quantikine ELISA Kit (R&D Systems, Minneapolis, MN, USA), according to the manufacturer’s instructions. Prior to analysis, breastmilk samples were centrifuged at 2000 rpm for 20 min at 4 °C to obtain skimmed milk.
2.5. Anthropometric Assessment
Maternal anthropometric measurements (body weight and height, waist and hip circumference) were measured twice by a well-trained researcher, according to the International Society for Advancement of Kinanthropometry (ISAK) International Standards for Anthropometric Assessment guidelines [25]. We also asked mothers about their pre-pregnancy body weight. Based on these data, we calculated their pre-pregnancy and current BMI and interpreted it according to the WHO criteria [20]. The maternal body composition (fat mass (FM) and fat-free mass (FFM)) was measured using a dual-energy X-ray absorptiometer (DXA; Lunar Prodigy, GE HealthCare, Chicago, IL, USA), according to the manufacturer’s instructions.
2.6. Cardiometabolic Health Indices
Based on the collected anthropometric and lipid profile data, we calculated several indices of cardiometabolic health: the atherogenic index of plasma (AIP), cardiometabolic index (CMI), lipid accumulation product (LAP), and visceral adiposity index (VAI) using the following formulas [26,27]:
AIP = log (TG/HDL-C);
CMI = (TG/HDL) × WHtR;
LAP = (WC − 58) × TG (mmo/L);
VAI = WC/(36.58 + (1.89 × BMI)) × TG/0.81 × 1.52/HDL-C.
2.7. Dietary Assessment
Maternal dietary habits were assessed using a food frequency questionnaire (FFQ) and 3-day dietary record methods. The FFQ was adapted from the validated Dietary Habits and Nutrition Beliefs Questionnaire KomPAN [28,29]. It included a list of 61 food items with six categories referring to the frequency of their consumption in the previous year (‘never or almost never’; ‘1–3 times a month’; ‘once a week’; ‘few times a week’; ‘once a day’; ‘few times a day’). More details can be found In the manual of the questionnaire [29]. The 3-day dietary record included the mothers’ food intake for the three typical days prior to the study visit and blood collection, with the last day being a day of breastmilk collection. Before completing the records, mothers were given detailed instructions and were asked to use typical household measures or kitchen scales to record the weight of portions consumed. The obtained records were verified by a trained dietitian, while the energy value and nutrient intake were analyzed using Dieta 6.0 Software (National Institute of Public Health NIH—National Research Institute, Warsaw, Poland). Based on the FFQ, we calculated the Polish-adapted Mediterranean Diet (Polish-aMED) [30] score, with our adaptation (in the category ‘red and processed meat’, we also included processed meat substitutes, whose availability on the Polish market has increased within recent years).
2.8. Statistical Analysis
All the statistical analyses were performed using STATISTICA 13.3 Software (TIBCO Software Inc., Paolo Alto, CA, USA). The normality of distribution was checked using the Shapiro–Wilk test and, when necessary, variables were log-transformed to obtain the normal distribution. Quantitative variables were presented as mean (M) ± standard deviation (SD) or median (upper–lower quartile) for variables with a non-normal distribution, and qualitative data were presented as frequencies (n (%)). Differences between the NW and OW/OB groups were assessed using the t-Student test or U-Mann–Whitney test for quantitative variables and Fisher’s exact test for qualitative variables. Differences between the NW, OW, and OB groups were assessed using ANOVA followed by the RIR Tukey post hoc test, or by the ANOVA Kruskal–Wallis test followed by a post hoc test for quantitative variables and a chi2 test for qualitative variables. We examined the correlations between leptin and the mothers’ anthropometric parameters, lipid profile, and cardiometabolic indices using Pearson or Spearman rank correlations.
Furthermore, stepwise forward multiple regression analysis was performed to identify the best dietary and anthropometric predictors of serum and breastmilk leptin. Based on the performed analysis, we selected three significant dietary predictors (energy value (kcal/d), fructose intake (g/d), and Pl-aMED score) and one anthropometric predictor (FM%). Then, we created multivariate linear models adjusted for maternal age. Analyses were performed on log-transformed variables and separately for the total, NW, and OW/OB groups. Afterward, we conducted the post hoc power analysis for created regression models using the G*Power Software 3.1.9.7 [23].
3. Results
The characteristics of the participants are shown in Table 1. There were no significant differences between the NW and OW/OB groups in maternal characteristics, gestational weight gain, CHOL, LDL-C, AIP, and dietary variables.

Table 1.
Distribution of general variables of the participants among NW and OW/OB mothers.
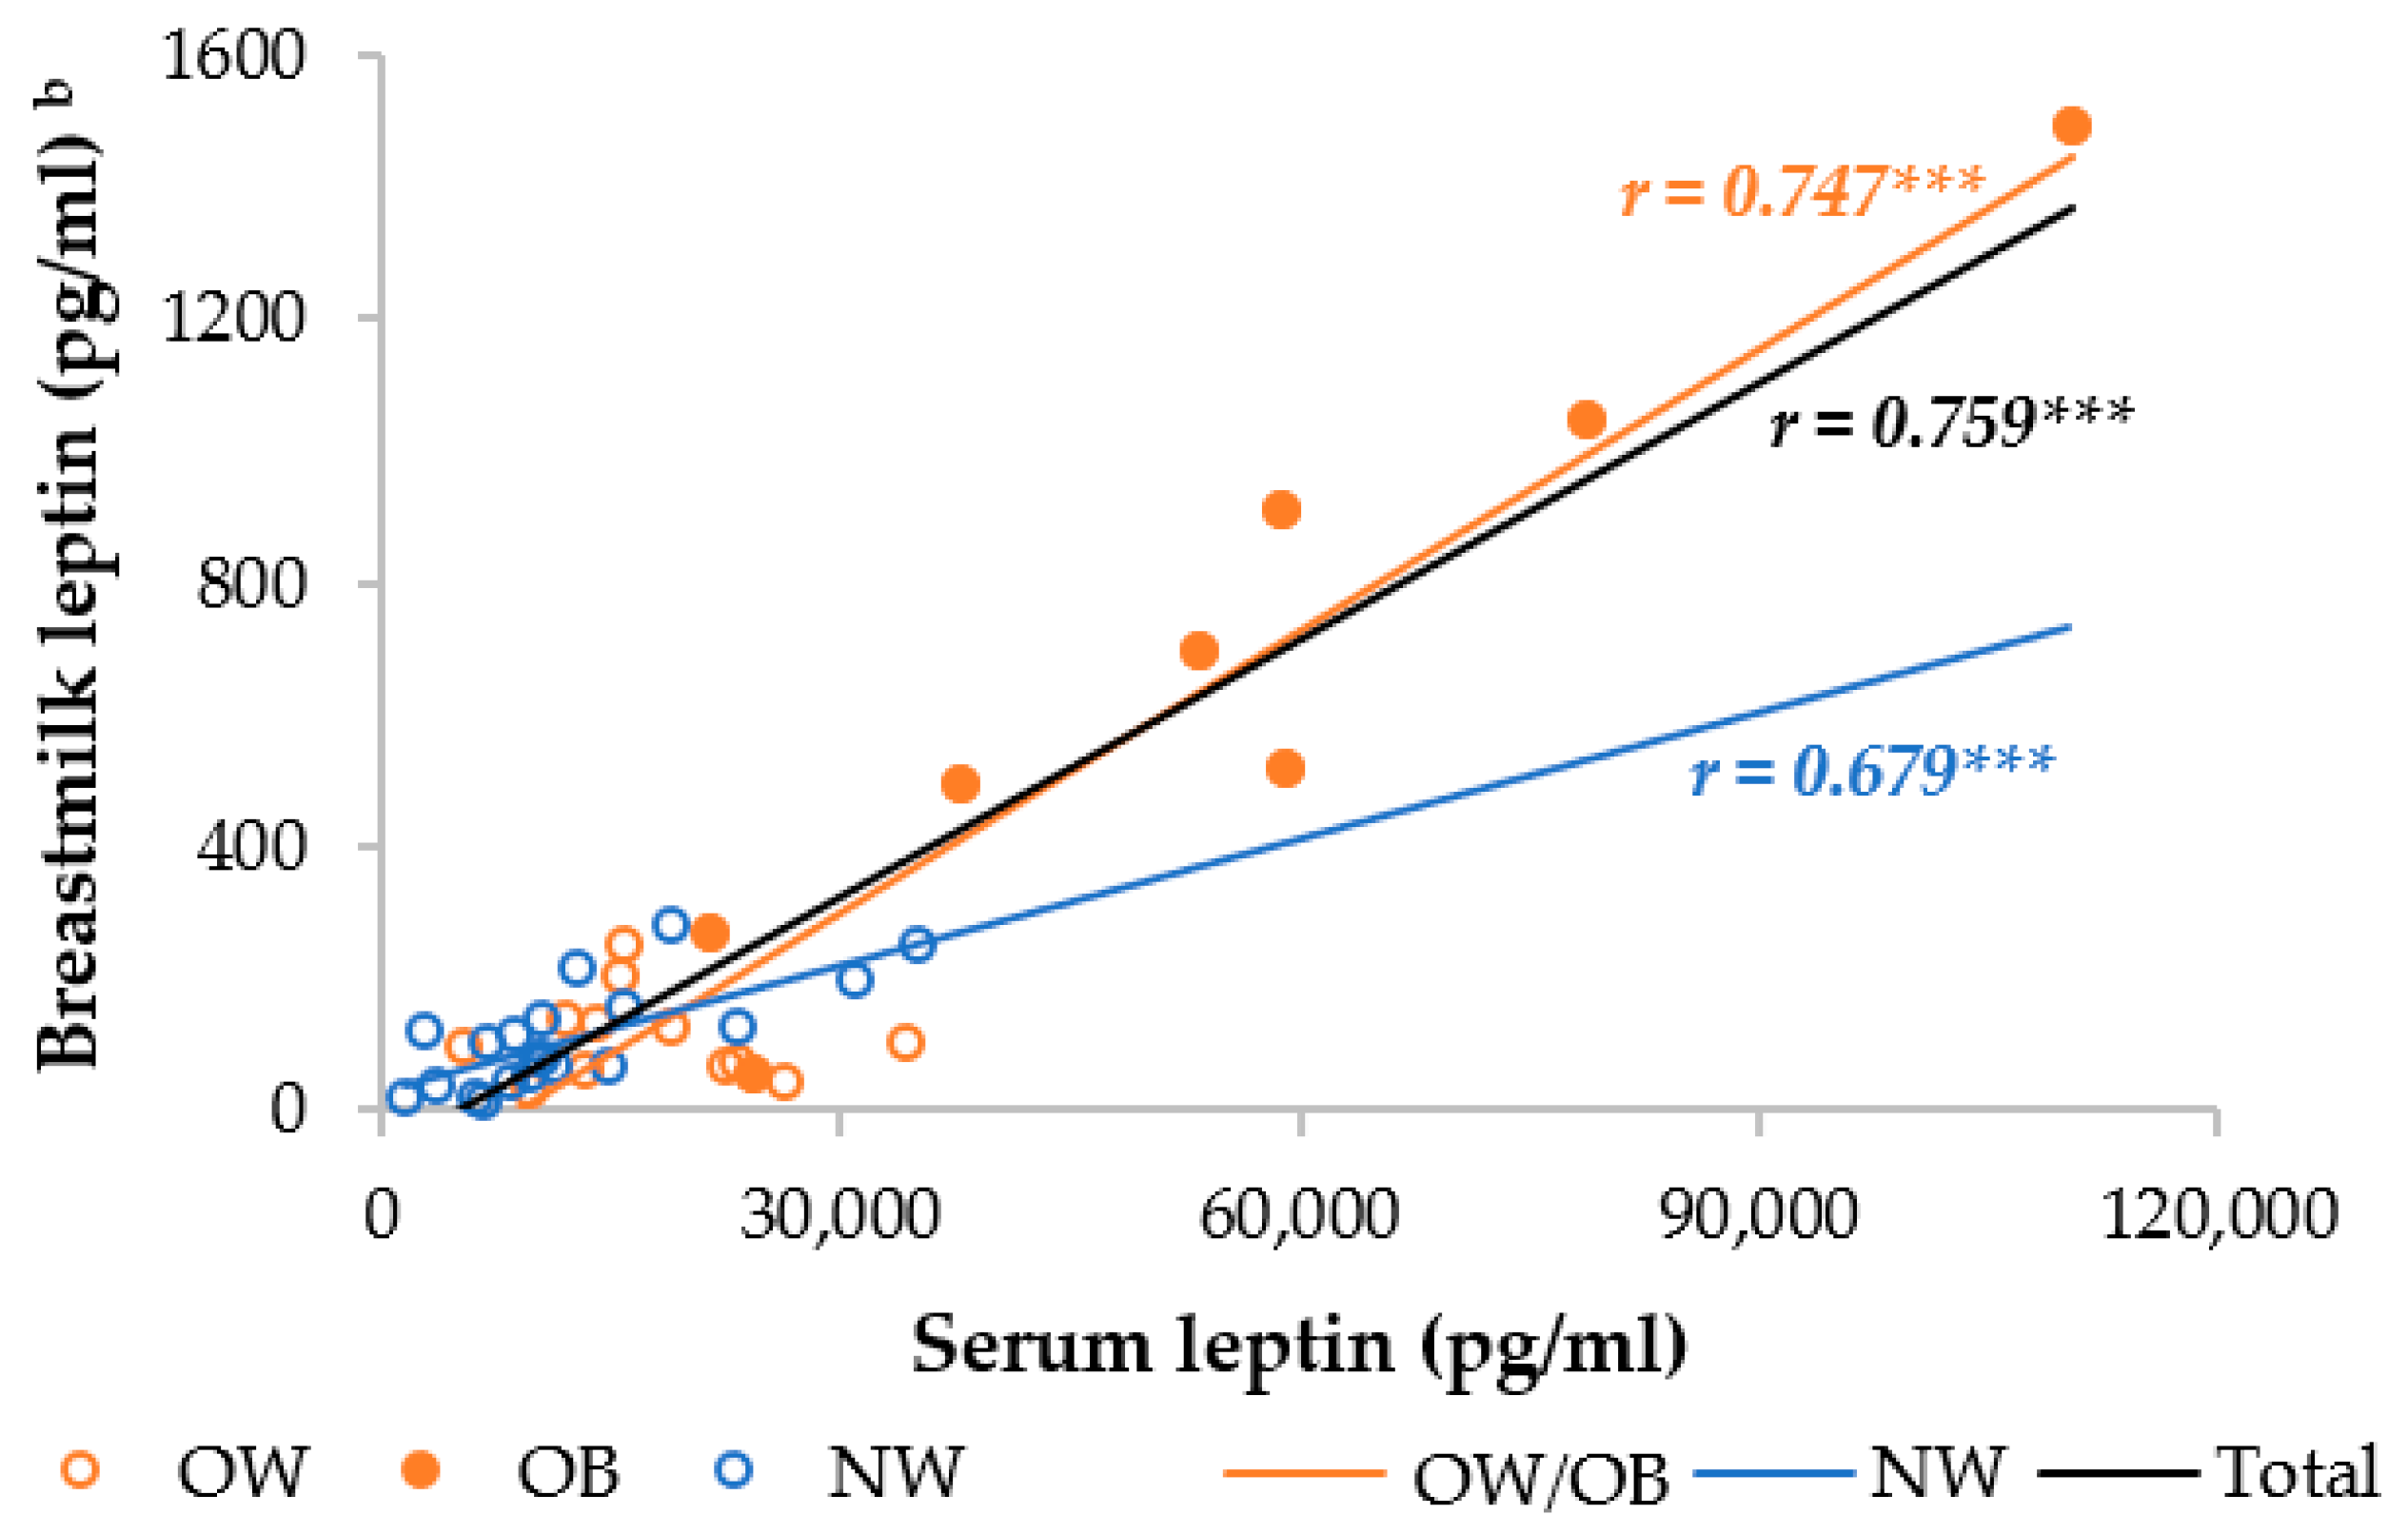
The OW/OB group had a significantly higher serum and skimmed breastmilk leptin level compared to the NW group. In the separate analysis, the OB mothers had, respectively, 4.5- and 3.2-fold higher serum leptin levels than the NW and OW mothers, whereas the OW mothers had an insignificantly 1.4-fold higher serum leptin level (Table S1). The OW and NW mothers had similar breastmilk leptin levels, but the OB mothers had 6.2 times higher breastmilk levels than the NW and OW mothers. Moreover, the serum and breastmilk leptin levels were significantly different between the OB and both the OW and NW mothers, but not between the OW and NW mothers. We observed a strong correlation between serum and breastmilk leptin, which was higher in the OW/OB group compared to the NW group (Figure 2).
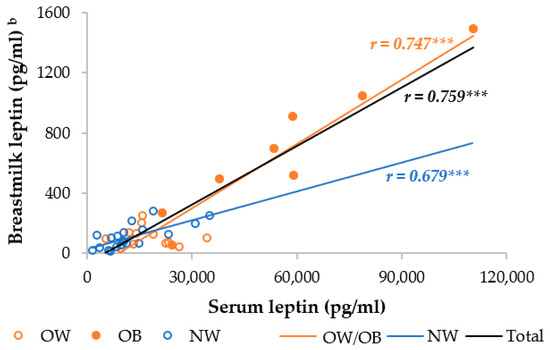
Figure 2.
Correlation between breastmilk leptin and serum leptin among NW and OW/OB mothers. NW, normal weight; OW/OB, overweight or obese. b The result of the Pearson correlations conducted on log-transformed data. *** p ≤ 0.001.
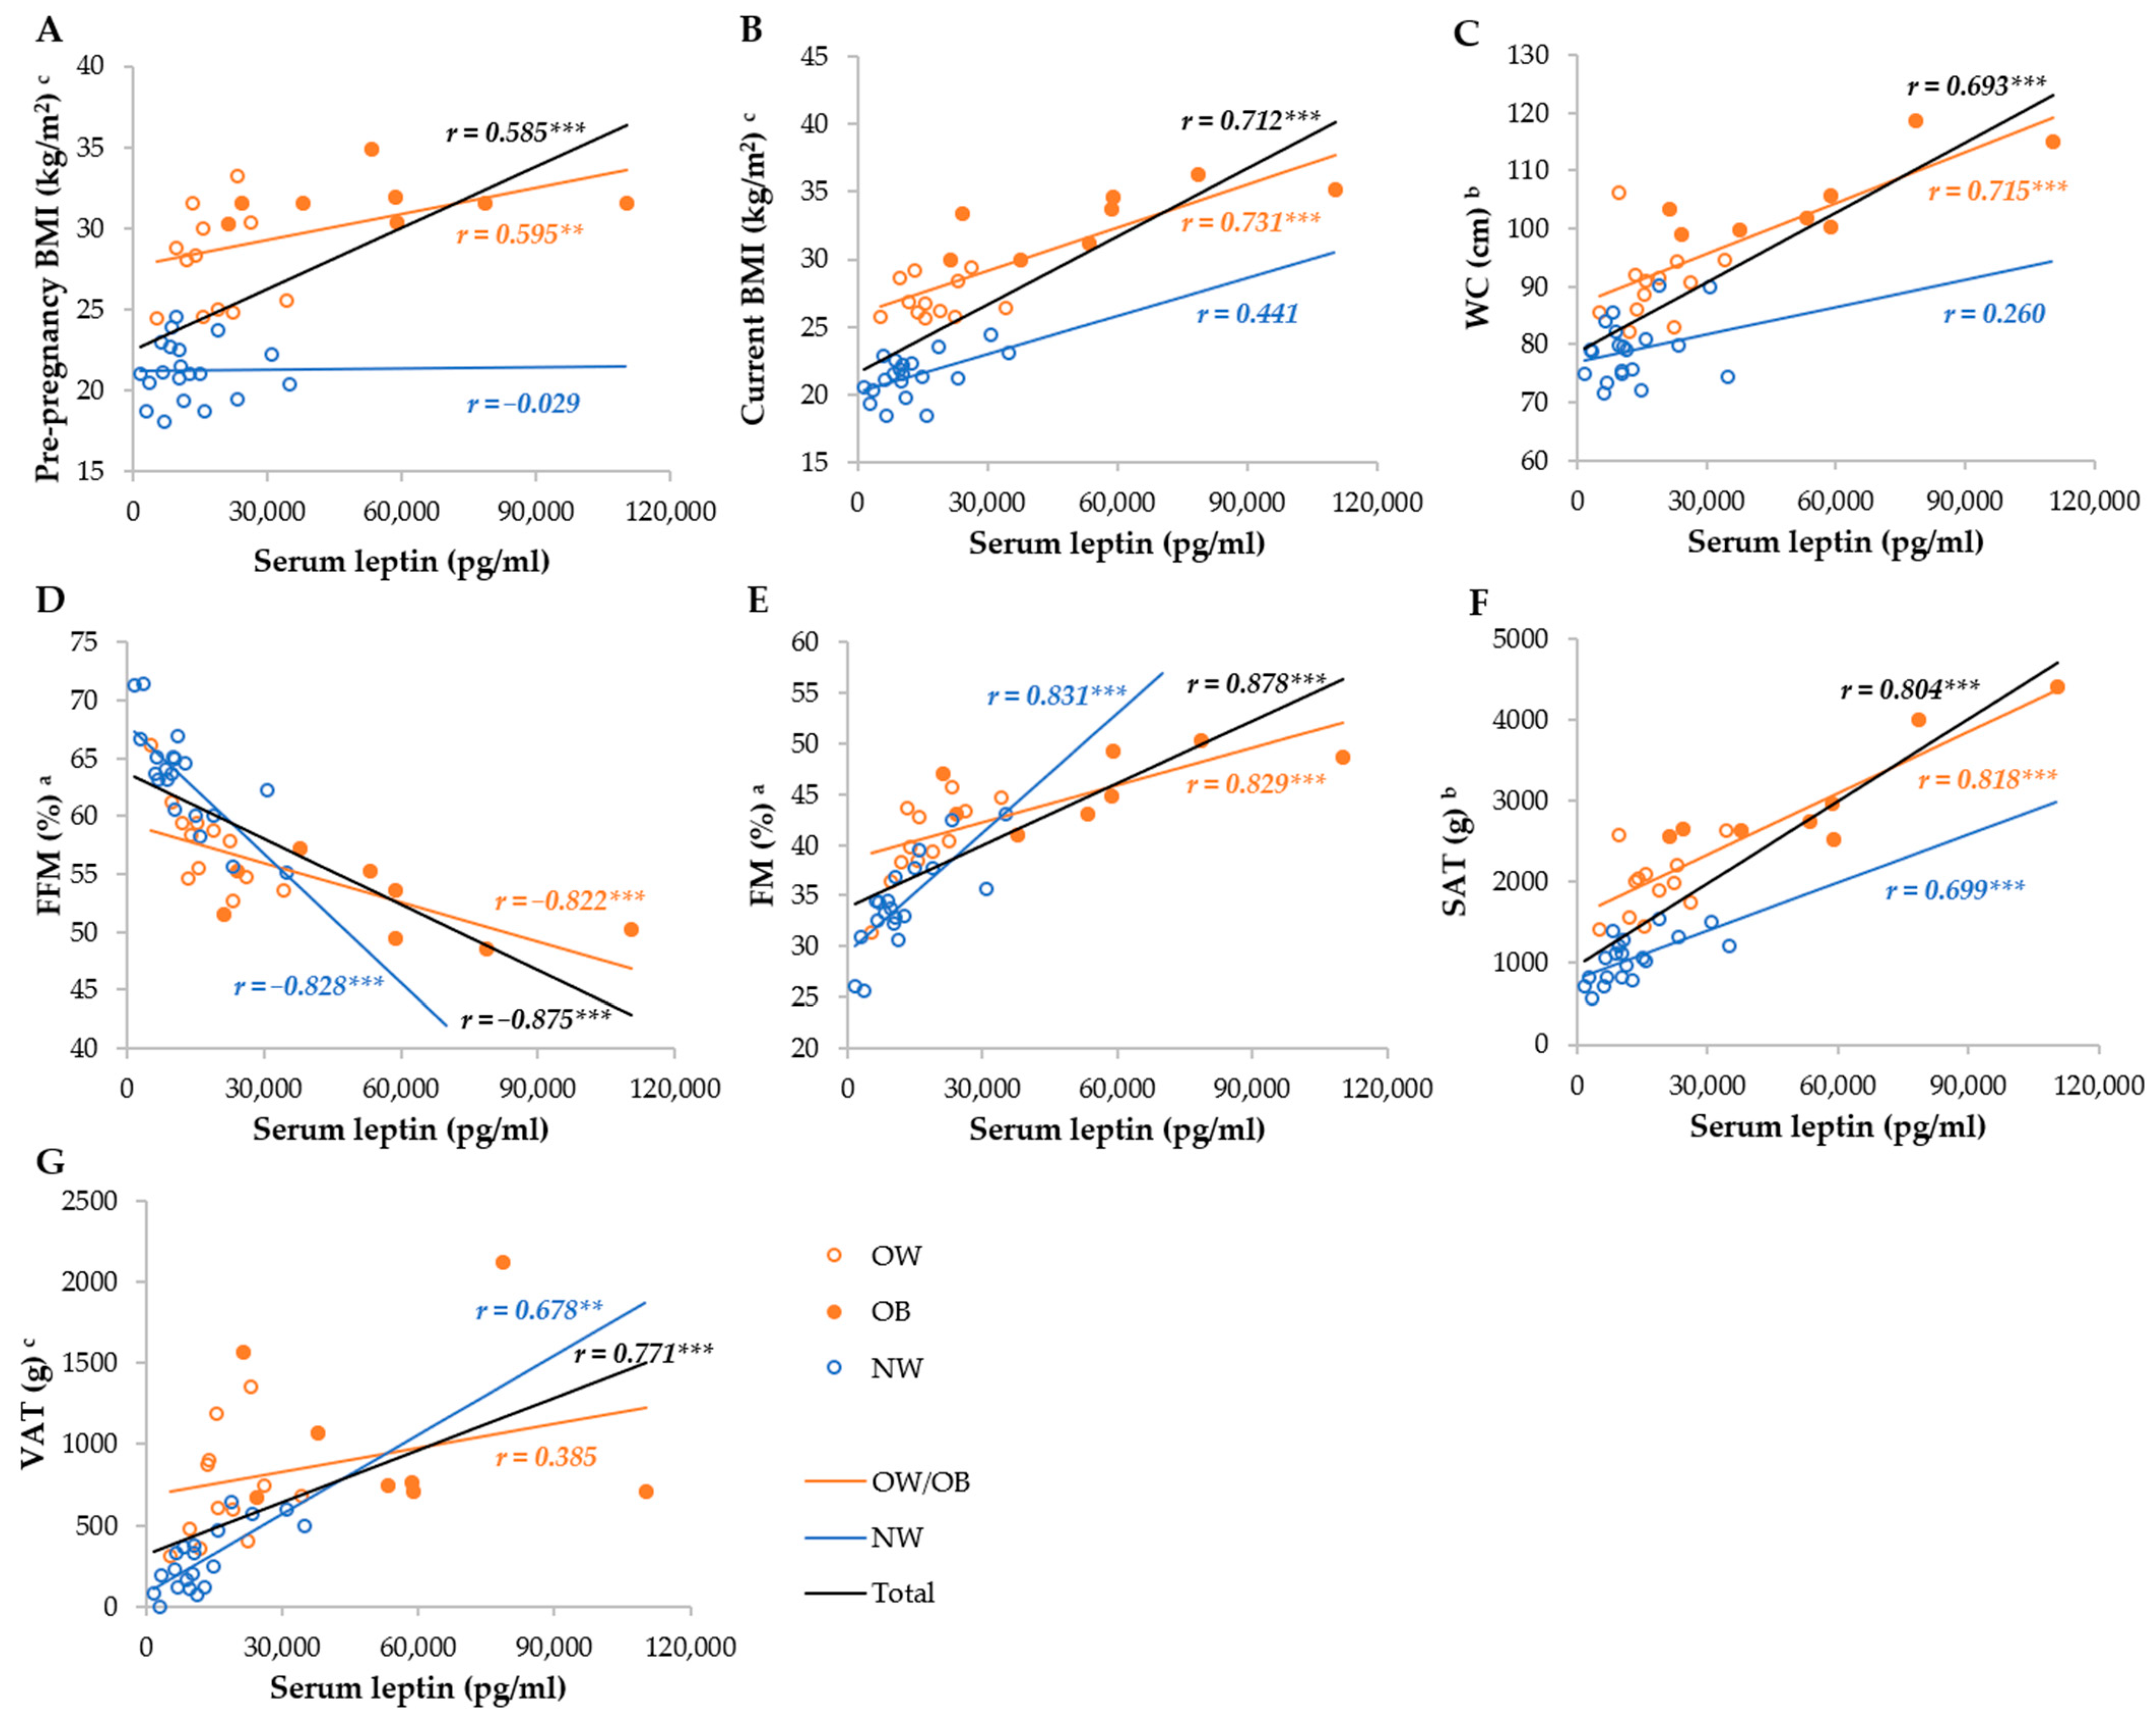
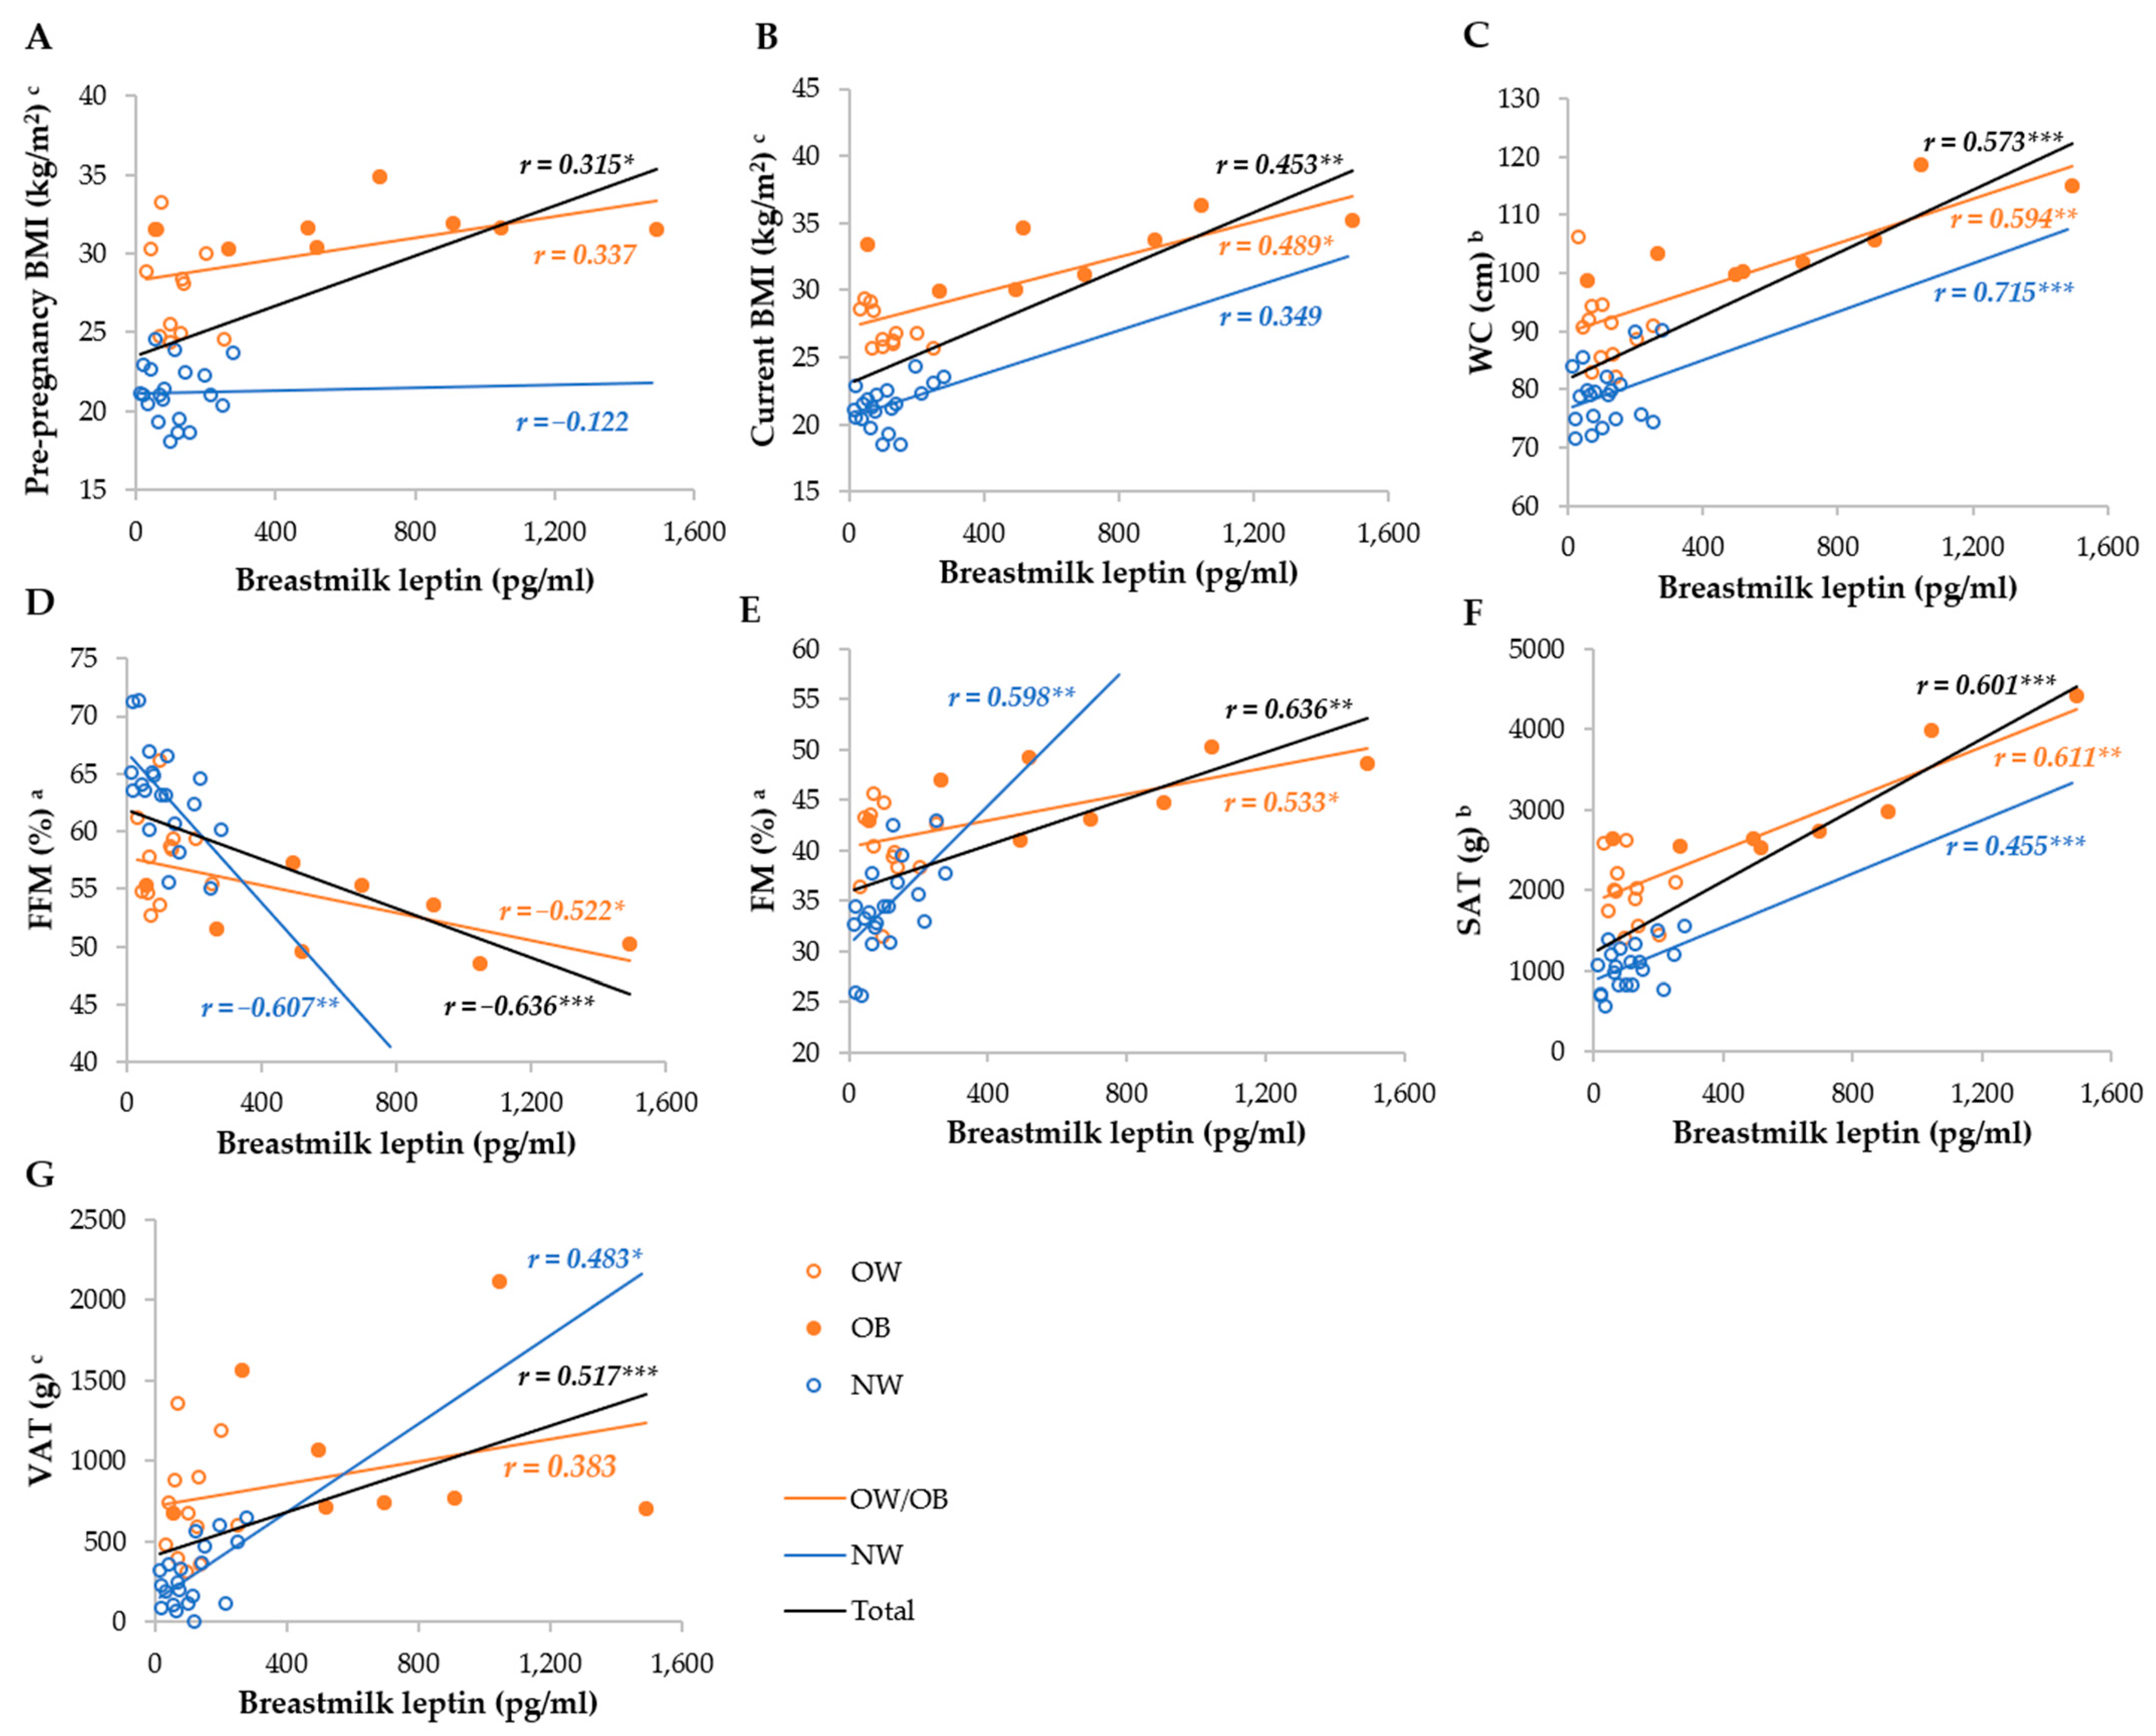
Serum leptin was most strongly correlated with the FM%, FFM%, SAT, VAT, WC, current, and pre-pregnancy BMI in the total group, whereas it was not correlated with the BMI and WC, as well as VAT, in the NW and OW/OB groups, respectively (Figure 3). Breastmilk leptin was less correlated with anthropometric parameters than serum leptin, and the strongest correlations were observed with FM%, FFM%, SAT, WC, and VAT, whereas they were not correlated with BMI in the NW group, and VAT and pre-pregnancy BMI in the OW/OB group. We observed stronger correlations between SAT and serum and breastmilk leptin in the OW/OB group, and with VAT, FM%, and FFM% in the NW group (Figure 4).
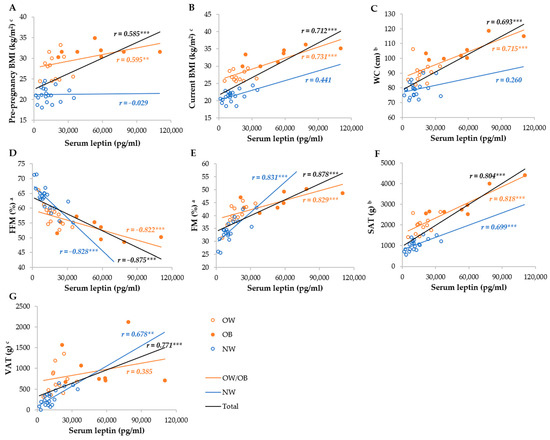
Figure 3.
Correlation between serum leptin and anthropometric parameters among NW and OW/OB mothers. BMI, body mass index; FFM, fat-free mass; FM, fat mass; NW, normal weight; OW/OB, overweight or obese; SAT, subcutaneous adipose tissue; WC, waist circumference; VAT, visceral adipose tissue. a Result of the Pearson test conducted on original data; b result of the Pearson correlations conducted on log-transformed data; c results of the Spearman rank correlations. ** p ≤ 0.01; *** p ≤ 0.001. (A) Correlation between serum leptin and pre-pregnancy BMI, (B) correlation between serum leptin and current BMI, (C) correlation between serum leptin and WC, (D) correlation between serum leptin and FFM, (E) correlation between serum leptin and FM, (F) correlation between serum leptin and SAT, and (G) correlation between serum leptin and VAT.
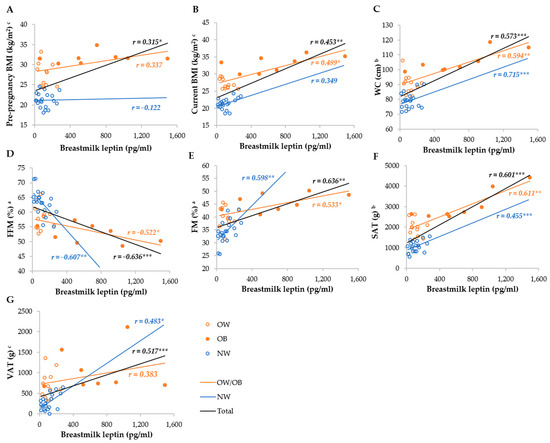
Figure 4.
Correlation between breastmilk leptin and anthropometric parameters among NW and OW/OB mothers. BMI, body mass index; FFM, fat-free mass; FM, fat mass; NW, normal weight; OW/OB, overweight or obese; SAT, subcutaneous adipose tissue; WC, waist circumference; VAT, visceral adipose tissue. a Result of the Pearson test conducted on original data; b result of the Pearson correlations conducted on log-transformed data; c results of the Spearman rank correlations. * p ≤ 0.05; ** p ≤ 0.01; *** p ≤ 0.001. (A) Correlation between breastmilk leptin and pre-pregnancy BMI, (B) correlation between breastmilk leptin and current BMI, (C) correlation between breastmilk leptin and WC, (D) correlation between breastmilk leptin and FI (E) correlation between breastmilk leptin and FM, (F) correlation between breastmilk leptin and SAT, and (G) correlation between breastmilk leptin and VAT.
We observed that serum leptin was negatively correlated with CHOL (NW group) and HDL-C (total and NW groups). At the same time, it was positively correlated with TG (total group), AIP, CMI, VAI (total and NW groups), and LAP (total and NW groups; Table 2). We observed similar correlation coefficients between breastmilk leptin and cardiometabolic indices.
Table 2.
Correlations between serum and breastmilk leptin and lipid profile, and cardiometabolic indices among NW and OW mothers.
Multivariate linear regression analysis showed that FM% was a strong and significant predictor of both serum and breastmilk leptin (Table 3). In addition, we found that in the NW, but not in the total and OW groups, the serum leptin concentration increased with the dietary energy value (β = 0.323, 95% CI 0.039–0.608) and fructose intake (β = 0.318, 95% CI 0.065–0.572), and increased with higher adherence to the Mediterranean diet (β = 0.279, 95% CI −0.031–0.528); however, in the NW group, the Pl-aMED score was moderately correlated with energy intake (r = 0.352, p = 0.128 vs. r = 0.042, p = 0.860 in the OW/OB), which may explain the observed association. In the OW/OB mothers, we observed that a higher adherence to the Mediterranean diet was associated with lower breastmilk leptin (β = −0.444, 95% CI −0.839–−0.050). However, the power of this analysis is slightly below the recommended value.
Table 3.
Results of multivariable linear regression analysis exploring associations between serum or breastmilk leptin and selected dietary variables.
4. Discussion
In the present study, we investigated the associations between serum and skimmed breastmilk leptin, maternal anthropometric and cardiometabolic health indices, and diet in the NW and OW/OB mothers. Our results confirm that overweight/obesity is associated with elevated breastmilk and serum leptin, and that these values are highly correlated. However, in the separate analysis of the OW/OB group, we found that obesity influences the leptin concentration greater than overweight. We also found that body composition was more strongly correlated with serum and breastmilk leptin concentrations, whereas the effect of fat distribution was different in the NW and OW/OB mothers. In addition, serum leptin was associated with markers of increased cardiovascular disease risk, especially in the NW mothers. Last but not least, we observed that higher dietary energy and fructose intake were associated with higher serum leptin in the NW mothers, whereas a higher adherence to the Mediterranean diet may protect against elevated breastmilk leptin in the OW/OB mothers.
4.1. Serum and Breastmilk Leptin and Maternal Anthropometrics
The OW/OB mothers in our study had 1.8- and 3.1-fold higher serum and breastmilk leptin concentrations, respectively, than the NW mothers. However, in the separate analysis, we found that the OB mothers had, respectively, 4.5- and 3.2-fold higher serum leptin levels than the NW and OW mothers, whereas the difference between the OW and NW mothers was insignificant. The OW and NW mothers had similar breastmilk leptin levels, but the OB mothers had 6.2 times higher breastmilk levels than both the NW and OW mothers. It is well known that overweight/obesity and/or increased adiposity are associated with elevated serum leptin due to increased adipocyte secretion and leptin resistance [11,12]. At this point, it should be noted that not all leptin circulates free, and some is bound to the circulating soluble leptin receptor (LepRe). Leptin bound to LepRe is Inactive and inaccessible to other leptin membrane receptors. In lean individuals, up to about 65% of leptin circulates bound to this receptor, while in obese individuals, only 15% is bound and 85% is free leptin [31,32]. Studies conducted during lactation have also shown higher serum [33] and breastmilk leptin concentrations in overweight or obese mothers [10,21,22,33,34,35]. This is due to strong correlations between serum and breastmilk leptin [33,36,37,38], which were also confirmed in our study. This indicates that leptin is transferred from serum to breastmilk [36,37,38]. However, some amount of leptin could also be synthesized by mammary epithelial cells and secreted into the breastmilk in milk fat globules [39,40]. In addition, it has been suggested that adipocytes and leptin could influence mammary epithelial cell proliferation, differentiation, and/or apoptosis, which can contribute to increased leptin concentrations in breastmilk [10,40]. This may also explain why we observed stronger correlations between breastmilk leptin concentrations and body composition than between BMI or WC, which are not direct measures of adiposity. Moreover, the higher transfer of leptin into breastmilk in obese women may also be explained by the predominance of the active free form of circulating leptin in their serum. We observed slightly stronger correlations between serum leptin, BMI (pre-pregnancy and current), and WC, but they were lower than with FM%, VAT, and SAT. Moreover, in both cases, the correlations with BMI and WC were not significant in the NW mothers, probably due to their lower adiposity. On the contrary, it has been previously suggested that leaner mothers could have a greater sensitivity to adiposity [41]. Nevertheless, our results are consistent with the majority of previous studies that found moderate or no correlations between the current maternal or pre-pregnancy BMI and breastmilk leptin [9,10,22,41,42,43], and that FM% (if assessed) was a stronger predictor of breastmilk leptin compared to BMI [41,44,45]. We observed intriguing results regarding the association between adipose tissue distribution and serum or breastmilk leptin. In our group, SAT was more strongly correlated with the serum and breastmilk leptin concentration (especially in the OW/OB group), compared to VAT (results in the OW/OB group were insignificant). To the best of our knowledge, this is the first study to report the association between the serum and breastmilk leptin concentration in NW and OW/OB mothers. However, these results are not surprising given that in women, leptin secretion rates can be two to three times higher in SAT than in VAT, independent of obesity or menopausal status [8,46].
4.2. Maternal Leptin and Cardiometabolic Health
Leptin has pro-inflammatory properties and is one of the mediators of systemic inflammation [11]. Increased leptin secretion causes adipose hypertrophy, insulin resistance, dyslipidemia, hypertension, and thickness of the common carotid artery [8,47]. Therefore, elevated leptin levels could increase the risk of the subsequent development of obesity-related non-communicable diseases such as CVD, type 2 diabetes, metabolic syndrome (MetS), and even some types of cancer [8,12,47,48]. In this study, we examined the associations between serum and breastmilk leptin, the maternal lipid profile, and cardiometabolic health indices, such as AIP, CMI, LAP, and VAI. These indices are based on anthropometric data (WC, BMI, WHtR) and/or lipid profile (HDL, TG), and could be useful for the early diagnosis or identification of patients with diabetes, CVD, and MetS [26,27,49].
In our study, we observed that serum leptin was negatively correlated with HDL-C (Total and NW groups) and positively correlated with TG (only in the Total group), AIP, CMI, VAI (Total and NW groups), and LAP (Total and OW/OB groups). Therefore, our results indicate that these associations are dependent of obesity status and that leptin could be a better predictor of cardiometabolic health indices in NW mothers. Previous studies conducted in non-lactating individuals have shown that CMI and VAI are good predictors of the “metabolic obesity with normal body weight” (MONW) phenotype, which could explain the stronger and more significant associations observed in the NW group [27]. On the other hand, previous studies have associated serum leptin with an increased risk of insulin resistance in children [47] and MetS in adults [11], independent of obesity status. However, both studies included larger numbers of participants, analyzed more metabolic biomarkers (e.g., fasting glucose and insulin), and were conducted in non-lactating women. It is well known that significant changes in lipid and glucose metabolism occur during pregnancy, manifested by physiologically elevated CHOL-C, LDL-C and TG, insulin resistance, and glucose intolerance [50]. Breastfeeding is associated with improvements in these biomarkers; CHOL-C and TG decrease from 2 to 6 months of lactation and return to baseline after one year of lactation [50]. Thus, breastfeeding is associated with a longitudinal decrease in the cardiometabolic risk in mothers, even in the post-menopausal period [50]. To the best of our knowledge, this was the first study to evaluate these indices in lactating individuals, so it is unclear how these indicators adjust for this physiological state. However, in light of the above, our results seem to be logical. Therefore, prospective studies are needed to determine the associations between maternal overweight/obesity and mothers’ metabolic profile, breastfeeding status, and subsequent metabolic health.
4.3. Serum and Breastmilk Leptin—Associations with Maternal Diet
The results of the present study showed that the energy value and fructose intake during the 72 h before blood collection were significant predictors of serum leptin in the NW mothers, even after adjustment for FM%. The increase in the serum leptin concentration associated with the higher energy value of the diet in the previous days is not surprising, as leptin is a key regulator of energy balance, food intake, and appetite [12]. We assume that the increase in serum leptin following a more energetic diet was a metabolic response leading to a subsequent decrease in food intake. This would be supported by the results of several animal and human studies showing that leptin administration reduces food and calorie intake [12,51]. In addition, a recent analysis of intervention studies conducted in lean individuals showed that serum leptin levels directly before a meal are inversely correlated with caloric intake [51]. Another intervention conducted in adult men showed that a decrease in leptin during energy restriction was associated with an increase in appetite, but due to sex differences, a smaller association would be expected in women [52]. To date, only Leghi et al. [53] have investigated a dietary intervention in breastfeeding mothers. They showed that a 2-week energy restriction resulted in a decrease in breastmilk leptin, adiponectin, and insulin, which is in line with previous studies assessing serum leptin in non-lactating women. In our study, we did not observe a significant association between maternal energy intake and breastmilk composition. This could be a consequence of the fact that our participants followed a habitual diet and the associations were too weak to be observed. The association between habitual dietary intake and serum leptin concentrations has received little attention, and the studies that have been conducted have obtained less consistent results than intervention studies. Two studies conducted in postmenopausal women [54] and obese adults aged 40–59 years [55] showed inverse associations between the serum leptin concentration and energy intake, and another study found no significant association [56]. The authors also concluded that their results support the role of leptin in the physiological regulation of food intake. Although these studies also observed associations with other dietary components, such as carbohydrates [54], total fat [54], saturated fatty acids [54], protein [35], and dietary fiber [56], we did not confirm this association in our study. On the other hand, we observed that fructose intake was positively associated with serum leptin in the NW mothers. This is in line with the previous animal studies linking high-fat and high-fructose diets with the development of hyperleptinemia [19]. A similar effect was observed in humans, where 4-week fructose supplementation led to a continuous rise in the fasting leptin concentration [57].
One of the most important findings of our study was that the Mediterranean diet may help to limit increases in the breastmilk leptin concentration in OW/OB mothers. On the other hand, in the NW mothers, it was related to higher serum leptin. However, in this group, Pl-aMED was moderately correlated with energy intake, which may explain the observed association. Despite the power of the analysis conducted in the OW/OB group being 8% lower than the recommended 80%, the observed results are indeed in line with the literature [14,58,59]. The traditional Mediterranean diet is characterized by a higher consumption of vegetables and fruits, legumes, whole grains, nuts and seeds, olive oil, fish, and seafood, while minimizing the intake of meat, ultra-processed foods, and alcohol [60]. Previous studies found that the Mediterranean diet is associated with lower serum inflammatory biomarkers including leptin [14,58,59]. On the other hand, some studies have not confirmed this [61], or showed that the beneficial effect was only in participants with weight reduction [62]. Additionally, the Mediterranean diet has anti-inflammatory properties, and improves the lipid profile, blood pressure, and insulin sensitivity [61]. Thanks to these effects, it plays a beneficial role in the prevention of non-communicable diseases and mortality, as well as improves overall health and well-being [14,30,61]. However, little is known about the association between the Mediterranean diet and leptin during pregnancy and lactation. Interestingly, an intervention study conducted during pregnancy showed lower gestational weight gain, birthweight, neonate fat mass (%), and cord leptin in the Mediterranean intervention group [58]. To the best of our knowledge, this is the first study to investigate the associations between adherence to the Mediterranean diet and the serum and breastmilk leptin concentration in lactating mothers. However, several studies have investigated the association with breastmilk composition or various health outcomes during lactation. The Mediterranean diet during lactation could have a beneficial effect on the fatty acid profile [60], total antioxidant content [63], and selenium [64], calcium and zinc [65] content of breastmilk. Tabasso et al. [66], in a study conducted among lactating mothers in Italy, found that a higher adherence to the Mediterranean diet was associated with lower adipose tissue deposition during breastfeeding (without differences in body weight or BMI). This observation could partially explain the association between Pl-aMED and leptin observed in our study. However, because the results remained significant after adjustment for FM%, we can assume that this goes beyond the association with body composition and is related to an anti-inflammatory effect of this diet. This is supported by the results of Stendell-Hollis [67], who found that a 4-month Mediterranean-style dietary intervention improved body mass reduction, and decreased the concentration of serum inflammatory biomarkers such as TNF-α, but not IL-6, in overweight breastfeeding mothers. It was also shown that higher adherence to the Mediterranean diet could reduce the risk of postpartum depression [68]. Interestingly, this may also be related to leptin, as it has been suggested that leptin insufficiency and/or resistance may contribute to the development of depression [15].
4.4. Possible Implications to the Infant Health
In recent years, much interest has focused on the effect of leptin on nutritional programming [17,18]. Previous animal and human studies have shown that during infancy, ingested leptin is absorbed into the circulation and exerts biological effects [38,69]. With that said, leptin could beneficially influence the development of the intestinal microbiota [21]. But the effect of leptin on infant growth and body composition has been more widely discussed with ambiguous results [2,18,43]. A recent systematic review revealed that leptin showed consistent negative associations with infant anthropometrics (weight, weight gain, length, BMI z-score, FM%). However, the authors highlighted that most of the studies did not adequately control for confounders, including maternal BMI [2]. We, and other authors [9,21,70], have shown that infants born to OW/OB mothers are exposed to a few times higher levels of breastmilk leptin than those born to NW mothers. It has been hypothesized that exposure to elevated leptin levels could lead to the development of leptin resistance, subsequent alterations in appetite regulation and an increased risk of obesity [38]. Maternal obesity is an important factor that increases the risk of childhood obesity [70,71], but at the same time, breastfeeding plays a crucial protective role against the development of obesity. Having said that, a limited number of studies have compared the effects of leptin programming between NW and OW/OB mothers. It has been shown that maternal OW/OB could alter the infant intestinal microbiota [21] and breastmilk supply of leptin-related miRNAs, which may influence infant development [70]. Additionally, more impact than leptin concentration could have a total 24-h infant leptin intake via breastmilk [72,73]. Therefore, further studies should understand the role of breastmilk from OW/OB mothers in nutritional programming [18].
4.5. Strengths and Limitations
This study has several strengths. Firstly, our participants were matched for socio-economic characteristics and at a similar period of lactation, which reduced the possible influence of covariates. Secondly, we collected both serum and breastmilk samples, which allowed us to examine the associations more widely. Thirdly, we collected 24 h breastmilk samples including fore- and hindmilk, which reduced the interference of intra-feeding and diurnal variability in leptin concentrations [74]. Fourthly, we assessed the maternal body composition using DEXA, a “gold standard” in the assessment of body composition [27,75]. Fifthly, we assessed the maternal dietary habits using the FFQ and 3-day dietary records. Nevertheless, our study also has some limitations. Firstly, we analyzed leptin in skimmed breastmilk, but it has been shown that leptin concentrations are higher in whole milk [36,45]. Yet, despite this, the majority of studies have investigated leptin in skimmed milk [18]. Secondly, our results revealed a high variability among the OW/OB mothers, which indicates the importance of separate analyses of OW and OB mothers. Unfortunately, in our study, 12 mothers were overweight and 8 obese, so we were unable to conduct separate analyses in those three groups. Thirdly, our study had a cross-sectional design without follow-up, which could provide more comprehensive data on maternal anthropometrics, diet, breastmilk composition, and cardiometabolic health, as well as leptin variability and its determinants. Fourthly, our participants were voluntary, not randomly selected, so we cannot generalize the results of our study to the total population of breastfeeding mothers. Moreover, our results could be affected by selection bias, as volunteers may have different characteristics and lifestyle-related behaviors (e.g., higher physical activity, healthy dietary patterns, or longer duration of breastfeeding) than the targeted population. Fifthly, the results of the linear regression in subgroups were sometimes underpowered, so a larger study group is needed for more complex statistical analysis (e.g., 34 patients in the group would be sufficient to achieve 80% of power in the model with breastmilk leptin as the dependent variable). Sixthly, we did not include infants in our study, so we cannot evaluate the influence of maternal overweight/obesity through breastmilk composition on their health and development.
5. Conclusions
The current findings add to a growing body of evidence on the influence of maternal overweight/obesity on breastmilk composition. We found that OW/OB mothers had significantly higher serum and breast milk leptin concentrations, with a greater effect in obese mothers. We also showed that serum leptin was significantly correlated with cardiometabolic health indices (especially in the NW mothers), which according to the literature, are predictors of the risk of developing CVD, type 2 diabetes or MetS among non-lactating individuals. However, further studies need to be performed to establish whether the serum leptin levels during lactation affect the well-known protective effect of breastfeeding on maternal cardiometabolic health. We also found that the maternal habitual dietary intake of energy and fructose had a negative effect, but that adherence to the Mediterranean diet had a positive effect on breastmilk leptin concentrations in the OW/OB mothers. Our results support the importance of healthy dietary patterns throughout lactation. Furthermore, the observed OW/OB-related differences in the analyzed associations indicate differences in the metabolic profile between NW and OW/OB mothers. So, ideally, studies should also evaluate metabolic profiles to better understand this phenomenon. Further research should longitudinally investigate the causal relationship between the maternal diet, breastmilk hormone and the metabolic profile, especially in the context of maternal obesity, subsequent cardiometabolic health, and the influence on infant growth and development. Moreover, further studies should favor a separate analysis of OW and OB, rather than clustering OW and OB patients.
Supplementary Materials
The following supporting information can be downloaded at: https://www.mdpi.com/article/10.3390/metabo14040221/s1, Table S1: Distribution of general variables of the participants among NW, OW and OB mothers. Figure S1. Correlation between serum leptin and anthropo-metric parameters among NW and OW/OB mothers with serum leptin not exceeding 50,000 pg/mL. Figure S2. Correlation between breastmilk leptin and anthropometric parameters among NW and OW/OB mothers with breastmilk levels not exceeding 600 pg/mL.
Author Contributions
Conceptualization, M.A.Z.-P.; methodology, M.A.Z.-P.; software, M.A.Z.-P. and J.H.; validation, M.A.Z.-P.; formal analysis, M.A.Z.-P.; investigation, M.A.Z.-P. and Ł.K.; resources, J.H.; data curation, M.A.Z.-P.; writing—original draft preparation, M.A.Z.-P. and Ł.K.; writing—review and editing, M.A.Z.-P., Ł.K. and J.H.; visualization, M.A.Z.-P. and Ł.K.; supervision, M.A.Z.-P. and J.H.; project administration, M.A.Z.-P.; funding acquisition, M.A.Z.-P. and J.H. All authors have read and agreed to the published version of the manuscript.
Funding
The study was supported by a grant from the National Science Center (NCN), Poland (No. 2021/05/X/NZ9/00625). The research for this study was carried out with the use of research equipment purchased as part of the Food and Nutrition Center—modernization of the WULS campus to create a Food and Nutrition Research and Development Center (CZiZ) co-financed by the European Union from the European Regional Development Fund under the Regional Operational Programme of the Mazowieckie Voivodeship for 2014–2020 (Project No. RPMA.01.01.00-14-8276/17).
Institutional Review Board Statement
The study was conducted in accordance with the Declaration of Helsinki, and approved by the Ethics Committee of the Faculty of Human Nutrition and Consumer Science, Warsaw University of Life Sciences, Poland, (Resolution No. 53/2021, 20 December 2021).
Informed Consent Statement
Informed consent was obtained from all subjects involved in the study.
Data Availability Statement
The data presented in this study are openly available in RepOD, repod.icm.edu.pl at https://doi.org/10.18150/3OCJMS.
Acknowledgments
We would like to thank all the mothers who participated in the study. We also thank Karolina Kositorny for her thorough language editing of the manuscript.
Conflicts of Interest
The authors declare no conflicts of interest.
Correction Statement
This article has been republished with a minor correction to resolve spelling and grammatical errors. This change does not affect the scientific content of the article.
References
- Smilowitz, J.T.; Allen, L.H.; Dallas, D.C.; McManaman, J.; Raiten, D.J.; Rozga, M.; Sela, D.A.; Seppo, A.; Williams, J.E.; Young, B.E.; et al. Ecologies, synergies, and biological systems shaping human milk composition—A report from “Breastmilk Ecology: Genesis of Infant Nutrition (BEGIN)” Working Group 2. Am. J. Clin. Nutr. 2023, 117, S28–S42. [Google Scholar] [CrossRef]
- Brockway, M.; Daniel, A.I.; Reyes, S.M.; Gauglitz, J.M.; Granger, M.; McDermid, J.M.; Chan, D.; Refvik, R.; Sidhu, K.K.; Musse, S.; et al. Human Milk Bioactive Components and Child Growth and Body Composition in the First 2 Years: A Systematic Review. Adv. Nutr. 2024, 15, 100127. [Google Scholar] [CrossRef]
- Krebs, N.F.; Belfort, M.B.; Meier, P.P.; Mennella, J.A.; O’Connor, D.L.; Taylor, S.N.; Raiten, D.J. Infant factors that impact the ecology of human milk secretion and composition—A report from “Breastmilk Ecology: Genesis of Infant Nutrition (BEGIN)” Working Group 3. Am. J. Clin. Nutr. 2023, 117, S43–S60. [Google Scholar] [CrossRef] [PubMed]
- Neville, M.C.; Demerath, E.W.; Hahn-Holbrook, J.; Hovey, R.C.; Martin-Carli, J.; McGuire, M.A.; Newton, E.R.; Rasmussen, K.M.; Rudolph, M.C.; Raiten, D.J. Parental factors that impact the ecology of human mammary development, milk secretion, and milk composition—A report from “Breastmilk Ecology: Genesis of Infant Nutrition (BEGIN)” Working Group 1. Am. J. Clin. Nutr. 2023, 117, S11–S27. [Google Scholar] [CrossRef] [PubMed]
- Suwaydi, M.A.; Lai, C.T.; Rea, A.; Gridneva, Z.; Perrella, S.L.; Wlodek, M.E.; Geddes, D.T. Circadian Variation in Human Milk Hormones and Macronutrients. Nutrients 2023, 15, 3729. [Google Scholar] [CrossRef] [PubMed]
- World Health Organization. World Health Statistics 2023: Monitoring Health for the SDGs, Sustainable Development Goals; World Health Organization: Geneva, Switzerland, 2023; ISBN 9789240074323.
- Ahmed, B.; Konje, J.C. The epidemiology of obesity in reproduction. Best Pract. Res. Clin. Obstet. Gynaecol. 2023, 89, 102342. [Google Scholar] [CrossRef] [PubMed]
- Lathigara, D.; Kaushal, D.; Wilson, R.B. Molecular Mechanisms of Western Diet-Induced Obesity and Obesity-Related Carcinogenesis—A Narrative Review. Metabolites 2023, 13, 675. [Google Scholar] [CrossRef] [PubMed]
- Andreas, N.J.; Hyde, M.J.; Gale, C.; Parkinson, J.R.C.; Jeffries, S.; Holmes, E.; Modi, N. Effect of Maternal Body Mass Index on Hormones in Breast Milk: A Systematic Review. PLoS ONE 2014, 9, e115043. [Google Scholar] [CrossRef]
- Enstad, S.; Cheema, S.; Thomas, R.; Fichorova, R.N.; Martin, C.R.; O’Tierney-Ginn, P.; Wagner, C.L.; Sen, S. The Impact of Maternal Obesity and Breast Milk Inflammation on Developmental Programming of Infant Growth. Eur. J. Clin. Nutr. 2020, 75, 180–188. [Google Scholar] [CrossRef]
- Esteghamati, A.; Noshad, S.; Khalilzadeh, O.; Morteza, A.; Nazeri, A.; Meysamie, A.; Esteghamati, A.; Nakhjavani, M. Contribution of Serum Leptin to Metabolic Syndrome in Obese and Nonobese Subjects. Arch. Med. Res. 2011, 42, 244–251. [Google Scholar] [CrossRef]
- Ghadge, A.A.; Khaire, A.A. Leptin as a predictive marker for metabolic syndrome. Cytokine 2019, 121, 154735. [Google Scholar] [CrossRef]
- Mattu, H.S.; Randeva, H.S. Role of adipokines in cardiovascular disease. J. Endocrinol. 2013, 216, T17–T36. [Google Scholar] [CrossRef]
- Sureda, A.; del Mar Bibiloni, M.; Julibert, A.; Bouzas, C.; Argelich, E.; Llompart, I.; Pons, A.; Tur, J.A. Adherence to the Mediterranean Diet and Inflammatory Markers. Nutrients 2018, 10, 62. [Google Scholar] [CrossRef]
- Lu, X.Y. The leptin hypothesis of depression: A potential link between mood disorders and obesity? Curr. Opin. Pharmacol. 2007, 7, 648–652. [Google Scholar] [CrossRef]
- Morberg, C.M.; Tetens, I.; Black, E.; Toubro, S.; Soerensen, T.I.A.; Pedersen, O.; Astrup, A. Leptin and Bone Mineral Density: A Cross-Sectional Study in Obese and Nonobese Men. J. Clin. Endocrinol. Metab. 2003, 88, 5795–5800. [Google Scholar] [CrossRef]
- Larsen, J.K.; Bode, L. Obesogenic Programming Effects during Lactation: A Narrative Review and Conceptual Model Focusing on Underlying Mechanisms and Promising Future Research Avenues. Nutrients 2021, 13, 299. [Google Scholar] [CrossRef]
- Sinkiewicz-Darol, E.; Adamczyk, I.; Łubiech, K.; Pilarska, G.; Twarużek, M. Leptin in Human Milk—One of the Key Regulators of Nutritional Programming. Molecules 2022, 27, 3581. [Google Scholar] [CrossRef]
- Mendoza-Herrera, K.; Florio, A.A.; Moore, M.; Marrero, A.; Tamez, M.; Bhupathiraju, S.N.; Mattei, J. The Leptin System and Diet: A Mini Review of the Current Evidence. Front. Endocrinol. 2021, 12, 749050. [Google Scholar] [CrossRef]
- World Health Organization. Obesity: Preventing and Managing the Global Epidemic. WHO Tech. Rep. Ser. 2000, 894, 252. [Google Scholar]
- Lemas, D.J.; Young, B.E.; Ii, P.R.B.; Tomczik, A.C.; Soderborg, T.K.; Hernandez, T.L.; De La Houssaye, B.A.; Robertson, C.E.; Rudolph, M.C.; Ir, D.; et al. Alterations in human milk leptin and insulin are associated with early changes in the infant intestinal microbiome. Am. J. Clin. Nutr. 2016, 103, 1291–1300. [Google Scholar] [CrossRef] [PubMed]
- De Luca, A.; Frasquet-Darrieux, M.; Gaud, M.A.; Christin, P.; Boquien, C.Y.; Millet, C.; Herviou, M.; Darmaun, D.; Robins, R.J.; Ingrand, P.; et al. Higher Leptin but Not Human Milk Macronutrient Concentration Distinguishes Normal-Weight from Obese Mothers at 1-Month Postpartum. PLoS ONE 2016, 11, e0168568. [Google Scholar] [CrossRef]
- Faul, F.; Erdfelder, E.; Lang, A.G.; Buchner, A. G*Power 3: A flexible statistical power analysis program for the social, behavioral, and biomedical sciences. Behav. Res. Methods 2007, 39, 175–191. [Google Scholar] [CrossRef]
- Friedewald, W.T.; Levy, R.I.; Fredrickson, D.S. Estimation of the Concentration of Low-Density Lipoprotein Cholesterol in Plasma, without Use of the Preparative Ultracentrifuge. Clin. Chem. 1972, 18, 499–502. [Google Scholar] [CrossRef]
- Marfell-Jones, M.J.; Stewart, A.D.; De Ridder, J.H. International Standards for Anthropometric Assessment; International Society for the Advancement of Kinanthropometry: Lower Hutt, New Zealand, 2001. [Google Scholar]
- Fernández-Macías, J.C.; Ochoa-Martínez, A.C.; Varela-Silva, J.A.; Pérez-Maldonado, I.N. Atherogenic Index of Plasma: Novel Predictive Biomarker for Cardiovascular Illnesses. Arch. Med. Res. 2019, 50, 285–294. [Google Scholar] [CrossRef]
- Pluta, W.; Dudzińska, W.; Lubkowska, A. Metabolic Obesity in People with Normal Body Weight (MONW)—Review of Diagnostic Criteria. Int. J. Environ. Res. Public Health 2022, 19, 624. [Google Scholar] [CrossRef]
- Kowalkowska, J.; Wadolowska, L.; Czarnocinska, J.; Czlapka-Matyasik, M.; Galinski, G.; Jezewska-Zychowicz, M.; Bronkowska, M.; Dlugosz, A.; Loboda, D.; Wyka, J. Reproducibility of a Questionnaire for Dietary Habits, Lifestyle and Nutrition Knowledge Assessment (KomPAN) in Polish Adolescents and Adults. Nutrients 2018, 10, 1845. [Google Scholar] [CrossRef]
- Jezewska-Zychowicz, M.; Gawecki, J.; Wadolowska, L.; Czarnocinska, J.; Galinski, G.; Kollajtis-Dolowy, A.; Roszkowski, W.; Wawrzyniak, A.; Przybylowicz, K.; Stasiewicz, B.; et al. KomPAN® Dietary Habits and Nutrition Beliefs Questionnaire for People 15–65 Years Old, Version 1.2.—Self-administered Questionnaire. Available online: https://knozc.pan.pl/images/stories/MLonnie/KomPAN_manual_english_version_25-11-2020_last_korekta_2021.pdf (accessed on 9 July 2021).
- Krusinska, B.; Hawrysz, I.; Wadolowska, L.; Slowinska, M.A.; Biernacki, M.; Czerwinska, A.; Golota, J.J. Associations of Mediterranean Diet and a Posteriori Derived Dietary Patterns with Breast and Lung Cancer Risk: A Case-Control Study. Nutrients 2018, 10, 470. [Google Scholar] [CrossRef]
- Magni, P.; Liuzzi, A.; Ruscica, M.; Dozio, E.; Ferrario, S.; Bussi, I.; Minocci, A.; Castagna, A.; Motta, M.; Savia, G. Free and bound plasma leptin in normal weight and obese men and women: Relationship with body composition, resting energy expenditure, insulin-sensitivity, lipid profile and macronutrient preference. Clin. Endocrinol. 2005, 62, 189–196. [Google Scholar] [CrossRef]
- Cui, H.; López, M.; Rahmouni, K. The cellular and molecular bases of leptin and ghrelin resistance in obesity. Nat. Rev. Endocrinol. 2017, 13, 338–351. [Google Scholar] [CrossRef]
- Marousez, L.; Hanssens, S.; Butruille, L.; Petit, C.; Pourpe, C.; Besengez, C.; Rakza, T.; Storme, L.; Deruelle, P.; Lesage, J.; et al. Breast milk apelin level increases with maternal obesity and high-fat feeding during lactation. Int. J. Obes. 2021, 45, 1052–1060. [Google Scholar] [CrossRef]
- Sims, C.R.; Lipsmeyer, M.E.; Turner, D.E.; Andres, A. Human milk composition differs by maternal BMI in the first 9 months postpartum. Am. J. Clin. Nutr. 2020, 112, 548–557. [Google Scholar] [CrossRef] [PubMed]
- Binder, C.; Baumgartner-Parzer, S.; Gard, L.-I.; Berger, A.; Thajer, A. Maternal Diet Influences Human Milk Protein Concentration and Adipose Tissue Marker. Nutrients 2023, 15, 433. [Google Scholar] [CrossRef] [PubMed]
- Houseknecht, K.L.; McGuire, M.K.; Portocarrero, C.P.; McGuire, M.A.; Beerman, K. Leptin Is Present in Human Milk and Is Related to Maternal Plasma Leptin Concentration and Adiposity. Biochem. Biophys. Res. Commun. 1997, 240, 742–747. [Google Scholar] [CrossRef] [PubMed]
- Miralles, O.; Sánchez, J.; Palou, A.; Picó, C. A physiological role of breast milk leptin in body weight control in developing infants. Obesity 2006, 14, 1371–1377. [Google Scholar] [CrossRef] [PubMed]
- Savino, F.; Sardo, A.; Rossi, L.; Benetti, S.; Savino, A.; Silvestro, L. Mother and Infant Body Mass Index, Breast Milk Leptin and Their Serum Leptin Values. Nutrients 2016, 8, 383. [Google Scholar] [CrossRef] [PubMed]
- Smith-Kirwin, S.M.; O’Connor, D.M.; Johnston, J.; de Lancy, E.; Hassink, S.G.; Funanage, V.L. Leptin Expression in Human Mammary Epithelial Cells and Breast Milk. J. Clin. Endocrinol. Metab. 1998, 83, 1810. [Google Scholar] [CrossRef]
- Bonnet, M.; Delavaud, C.; Laud, K.; Gourdou, I.; Leroux, C.; Djiane, J.; Chilliard, Y. Mammary leptin synthesis, milk leptin and their putative physiological roles. Reprod. Nutr. Dev. 2002, 42, 399–413. [Google Scholar] [CrossRef] [PubMed]
- Quinn, E.A.; Largado, F.; Borja, J.B.; Kuzawa, C.W. Maternal characteristics associated with milk leptin content in a sample of filipino women and associations with infant weight for Age. J. Hum. Lact. 2015, 31, 273–281. [Google Scholar] [CrossRef]
- Chan, D.; Goruk, S.; Becker, A.B.; Subbarao, P.; Mandhane, P.J.; Turvey, S.E.; Lefebvre, D.; Sears, M.R.; Field, C.J.; Azad, M.B. Adiponectin, leptin and insulin in breast milk: Associations with maternal characteristics and infant body composition in the first year of life. Int. J. Obes. 2018, 42, 36–43. [Google Scholar] [CrossRef]
- Ramiro-Cortijo, D.; Singh, P.; Herranz Carrillo, G.; Gila-Díaz, A.; Martín-Cabrejas, M.A.; Martin, C.R.; Arribas, S.M. Association of maternal body composition and diet on breast milk hormones and neonatal growth during the first month of lactation. Front. Endocrinol. 2023, 14, 1090499. [Google Scholar] [CrossRef]
- Schueler, J.; Alexander, B.; Hart, A.M.; Austin, K.; Enette Larson-Meyer, D. Presence and Dynamics of Leptin GLP-1 and PYY in Human Breast Milk at Early Postpartum. Obesity 2013, 21, 1451–1458. [Google Scholar] [CrossRef]
- Kugananthan, S.; Gridneva, Z.; Lai, C.T.; Hepworth, A.R.; Mark, P.J.; Kakulas, F.; Geddes, D.T. Associations between maternal body composition and appetite hormones and macronutrients in human milk. Nutrients 2017, 9, 252. [Google Scholar] [CrossRef]
- Van Harmelen, V.; Reynisdottir, S.; Eriksson, P.; Thörne, A.; Hoffstedt, J.; Lönnqvist, F.; Arner, P. Leptin secretion from subcutaneous and visceral adipose tissue in women. Diabetes 1998, 47, 913–917. [Google Scholar] [CrossRef]
- Frithioff-Bøjsøe, C.; Lund, M.A.V.; Lausten-Thomsen, U.; Hedley, P.L.; Pedersen, O.; Christiansen, M.; Baker, J.L.; Hansen, T.; Holm, J.C. Leptin, adiponectin, and their ratio as markers of insulin resistance and cardiometabolic risk in childhood obesity. Pediatr. Diabetes 2020, 21, 194–202. [Google Scholar] [CrossRef]
- Farias, D.R.; Franco-Sena, A.B.; Rebelo, F.; Schlüssel, M.M.; Salles, G.F.; Kac, G. Total cholesterol and leptin concentrations are associated with prospective changes in systemic blood pressure in healthy pregnant women. J. Hypertens. 2014, 32, 127–134. [Google Scholar] [CrossRef] [PubMed]
- Białkowska, A.; Górnicka, M.; Zielinska-Pukos, M.A.; Hamulka, J. Associations between Dietary Patterns, Anthropometric and Cardiometabolic Indices and the Number of MetS Components in Polish Adults with Metabolic Disorders. Nutrients 2023, 15, 2237. [Google Scholar] [CrossRef] [PubMed]
- Perrine, C.G.; Nelson, J.M.; Corbelli, J.; Scanlon, K.S. Lactation and Maternal Cardio-Metabolic Health. Annu. Rev. Nutr. 2016, 36, 627–645. [Google Scholar] [CrossRef] [PubMed]
- Chrysafi, P.; Perakakis, N.; Farr, O.M.; Stefanakis, K.; Peradze, N.; Sala-Vila, A.; Mantzoros, C.S. Leptin alters energy intake and fat mass but not energy expenditure in lean subjects. Nat. Commun. 2020, 11, 5145. [Google Scholar] [CrossRef]
- Mars, M.; De Graaf, C.; De Groot, C.P.G.M.; Van Rossum, C.T.M.; Kok, F.J. Fasting leptin and appetite responses induced by a 4-day 65%-energy-restricted diet. Int. J. Obes. 2006, 30, 122–128. [Google Scholar] [CrossRef]
- Leghi, G.E.; Netting, M.J.; Lai, C.T.; Narayanan, A.; Dymock, M.; Rea, A.; Wlodek, M.E.; Geddes, D.T.; Muhlhausler, B.S. Reduction in Maternal Energy Intake during Lactation Decreased Maternal Body Weight and Concentrations of Leptin, Insulin and Adiponectin in Human Milk without Affecting Milk Production, Milk Macronutrient Composition or Infant Growth. Nutrients 2021, 13, 1892. [Google Scholar] [CrossRef]
- Larsson, H.; Sö, S.; Elmståhl, S.; Go, G.; Berglund, G.; Ahré, B.O. Evidence for Leptin Regulation of Food Intake in Humans. J. Clin. Endocrinol. Metab. 1998, 83, 4382–4385. [Google Scholar] [CrossRef]
- Nakamura, Y.; Ueshima, H.; Okuda, N.; Murakami, Y.; Miura, K.; Kita, Y.; Okamura, T.; Okayama, A.; Turin, T.C.; Choudhry, S.R.; et al. Serum leptin and total dietary energy intake: The INTERLIPID Study. Eur. J. Nutr. 2013, 52, 1641–1648. [Google Scholar] [CrossRef]
- Murakami, K.; Sasaki, S.; Takahashi, Y.; Uenishi, K.; Yamasaki, M.; Hayabuchi, H.; Goda, T.; Oka, J.; Baba, K.; Ohki, K.; et al. Nutrient and food intake in relation to serum leptin concentration among young Japanese women. Nutrition 2007, 23, 461–468. [Google Scholar] [CrossRef]
- Lê, K.-A.; Faeh, D.; Stettler, R.; Ith, M.; Kreis, R.; Vermathen, P.; Boesch, C.; Ravussin, E.; Tappy, L. A 4-Wk High-Fructose Diet Alters Lipid Metabolism without Affecting Insulin Sensitivity or Ectopic Lipids in Healthy Humans. Am. J. Clin. Nutr. 2006, 84, 1374–1379. [Google Scholar] [CrossRef]
- Abdou, R.M.; Sayed, G.; Hawary, E.; Saab, A.A. Effect of Gestational Mediterranean Diet Intervention on Newborn Fat Mass and Cord Blood Leptin Level. Egypt. Pediatr. Assoc. Gaz. 2020, 68, 30. [Google Scholar] [CrossRef]
- Dinu, M.; Colombini, B.; Pagliai, G.; Cesari, F.; Gori, A.; Giusti, B.; Marcucci, R.; Sofi, F. Effects of a dietary intervention with Mediterranean and vegetarian diets on hormones that influence energy balance: Results from the CARDIVEG study. Int. J. Food Sci. Nutr. 2020, 71, 362–369. [Google Scholar] [CrossRef]
- Di Maso, M.; Bravi, F.; Ferraroni, M.; Agostoni, C.; Eussen, S.R.B.M.; Decsi, T.; Quitadamo, P.A.; Tonetto, P.; Peila, C.; Profeti, C.; et al. Adherence to Mediterranean Diet of Breastfeeding Mothers and Fatty Acids Composition of Their Human Milk: Results From the Italian MEDIDIET Study. Front. Nutr. 2022, 9, 891376. [Google Scholar] [CrossRef] [PubMed]
- Bédard, A.; Tchernof, A.; Lamarche, B.; Corneau, L.; Dodin, S.; Lemieux, S. Effects of the traditional Mediterranean diet on adiponectin and leptin concentrations in men and premenopausal women: Do sex differences exist? Eur. J. Clin. Nutr. 2014, 68, 561–566. [Google Scholar] [CrossRef]
- Greco, M.; Chiefari, E.; Montalcini, T.; Accattato, F.; Costanzo, F.S.; Pujia, A.; Foti, D.; Brunetti, A.; Gulletta, E. Early Effects of a Hypocaloric, Mediterranean Diet on Laboratory Parameters in Obese Individuals. Mediat. Inflamm. 2014, 2014, 750860. [Google Scholar] [CrossRef]
- Karbasi, S.; Mohamadian, M.; Naseri, M.; Khorasanchi, Z.; Zarban, A. A Mediterranean Diet Is Associated with Improved Total Antioxidant Content of Human Breast Milk and Infant Urine. Nutr. J. 2023, 22, 11. [Google Scholar] [CrossRef]
- Sánchez, C.; Fente, C.; Barreiro, R.; López-Racamonde, O.; Cepeda, A.; Regal, P. Association between Breast Milk Mineral Content and Maternal Adherence to Healthy Dietary Patterns in Spain: A Transversal Study. Foods 2020, 9, 659. [Google Scholar] [CrossRef]
- Zielinska-Pukos, M.A.; Michalska-Kacymirow, M.; Kurek, E.; Bulska, E.; Grabowicz-Chądrzyńska, I.; Wesołowska, A.; Hamułka, J. Breastmilk Mineral Composition among Well-Educated Mothers from Central Poland—Associations with Maternal Dietary Intake, Dietary Patterns and Infant Psychomotor Development. J. Trace Elem. Med. Biol. 2024, 83, 127393. [Google Scholar] [CrossRef]
- Tabasso, C.; Mallardi, D.; Corti, Y.; Perrone, M.; Piemontese, P.; Liotto, N.; Menis, C.; Roggero, P.; Mosca, F. Adherence to the Mediterranean diet and body composition of breast-feeding mothers: The potential role of unsaturated fatty acids. J. Nutr. Sci. 2021, 10, e63. [Google Scholar] [CrossRef]
- Stendell-Hollis, N.R.; Thompson, P.A.; West, J.L.; Wertheim, B.C.; Thomson, C.A. A Comparison of Mediterranean-Style and MyPyramid Diets on Weight Loss and Inflammatory Biomarkers in Postpartum Breastfeeding Women. J. Women’s Health 2013, 22, 48–57. [Google Scholar] [CrossRef]
- Papadopoulou, S.K.; Pavlidou, E.; Dakanalis, A.; Antasouras, G.; Vorvolakos, T.; Mentzelou, M.; Serdari, A.; Pandi, A.L.; Spanoudaki, M.; Alexatou, O.; et al. Postpartum Depression Is Associated with Maternal Sociodemographic and Anthropometric Characteristics, Perinatal Outcomes, Breastfeeding Practices, and Mediterranean Diet Adherence. Nutrients 2023, 15, 3853. [Google Scholar] [CrossRef]
- Sánchez, J.; Priego, T.; Palou, M.; Tobaruela, A.; Palou, A.; Picó, C. Oral supplementation with physiological doses of leptin during lactation in rats improves insulin sensitivity and affects food preferences later in life. Endocrinology 2008, 149, 733–740. [Google Scholar] [CrossRef]
- Zamanillo, R.; Sánchez, J.; Serra, F.; Palou, A. Breast Milk Supply of MicroRNA Associated with Leptin and Adiponectin Is Affected by Maternal Overweight/Obesity and Influences Infancy BMI. Nutrients 2019, 11, 2589. [Google Scholar] [CrossRef]
- Woo Baidal, J.A.; Locks, L.M.; Cheng, E.R.; Blake-Lamb, T.L.; Perkins, M.E.; Taveras, E.M. Risk Factors for Childhood Obesity in the First 1,000 Days: A Systematic Review. Am. J. Prev. Med. 2016, 50, 761–779. [Google Scholar] [CrossRef]
- Kon, I.Y.; Shilina, N.M.; Gmoshinskaya, M.V.; Ivanushkina, T.A. The study of breast milk IGF-1, leptin, ghrelin and adiponectin levels as possible reasons of high weight gain in breast-fed infants. Ann. Nutr. Metab. 2014, 65, 317–323. [Google Scholar] [CrossRef]
- Khodabakhshi, A.; Ghayour-Mobarhan, M.; Rooki, H.; Vakili, R.; Hashemy, S.I.; Mirhafez, S.R.; Shakeri, M.T.; Kashanifar, R.; Pourbafarani, R.; Mirzaei, H.; et al. Comparative measurement of ghrelin, leptin, adiponectin, EGF and IGF-1 in breast milk of mothers with overweight/obese and normal-weight infants. Eur. J. Clin. Nutr. 2014, 69, 614–618. [Google Scholar] [CrossRef]
- Suwaydi, M.A.; Lai, C.T.; Gridneva, Z.; Perrella, S.L.; Wlodek, M.E.; Geddes, D.T. Sampling Procedures for Estimating the Infant Intake of Human Milk Leptin, Adiponectin, Insulin, Glucose, and Total Lipid. Nutrients 2024, 16, 331. [Google Scholar] [CrossRef] [PubMed]
- Ellegård, L.; Bertz, F.; Winkvist, A.; Bosaeus, I.; Brekke, H.K. Body composition in overweight and obese women postpartum: Bioimpedance methods validated by dual energy X-ray absorptiometry and doubly labeled water. Eur. J. Clin. Nutr. 2016, 70, 1181–1188. [Google Scholar] [CrossRef] [PubMed]

Disclaimer/Publisher’s Note: The statements, opinions and data contained in all publications are solely those of the individual author(s) and contributor(s) and not of MDPI and/or the editor(s). MDPI and/or the editor(s) disclaim responsibility for any injury to people or property resulting from any ideas, methods, instructions or products referred to in the content. |
© 2024 by the authors. Licensee MDPI, Basel, Switzerland. This article is an open access article distributed under the terms and conditions of the Creative Commons Attribution (CC BY) license (https://creativecommons.org/licenses/by/4.0/).